
Hamxa_khan07_
8 投稿

Hamxa_khan07_
報告
ユーザーをブロック
4 フォロー
11 フォロワー
7 いいね
投稿
すべて
引用
記事
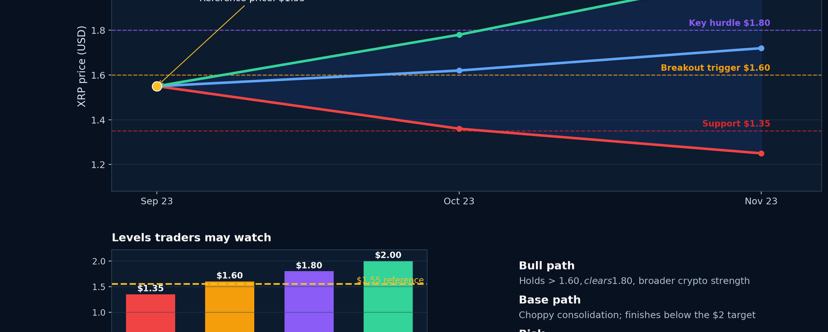
今後2か月でXRPは$2へ?リップルのトークンはその動きを実現できるのか?今後2か月以内にXRPが$2に到達することは可能ですが、重要なレジスタンス水準を上抜けした状態が継続し、さらに暗号資産市場全体での追い風となる条件が必要になります。XRPは最近およそ$1.50〜$1.65で取引されており、$2への動きはおおよそ20%〜33%の上昇余地に相当します。これはボラティリティの高い暗号資産では不可能ではありませんが、当然ながら確実ではありません。[1][2]
## 現在のXRPの状況
XRPは2026年に波乱の展開でした。9月上旬には$1.28〜$1.40あたりで推移していましたが、その後ビットコイン主導のショートスクイーズによって$1.50を上回って反発しました。このトークンは依然として、2025年の高値である約$3.66を大きく下回っています。つまり、過去のデータからは、強い市場環境ではXRPが$2を大きく上回って取引できることが示されています。[2][3]
今後2か月でXRPは$2へ?リップルのトークンはその動きを実現できるのか?
今後2か月以内にXRPが$2に到達することは可能ですが、重要なレジスタンス水準を上抜けした状態が継続し、さらに暗号資産市場全体での追い風となる条件が必要になります。XRPは最近およそ$1.50〜$1.65で取引されており、$2への動きはおおよそ20%〜33%の上昇余地に相当します。これはボラティリティの高い暗号資産では不可能ではありませんが、当然ながら確実ではありません。[1][2]
## 現在のXRPの状況
XRPは2026年に波乱の展開でした。9月上旬には$1.28〜$1.40あたりで推移していましたが、その後ビットコイン主導のショートスクイーズによって$1.50を上回って反発しました。このトークンは依然として、2025年の高値である約$3.66を大きく下回っています。つまり、過去のデータからは、強い市場環境ではXRPが$2を大きく上回って取引できることが示されています。[2][3]
## 現在のXRPの状況
XRPは2026年に波乱の展開でした。9月上旬には$1.28〜$1.40あたりで推移していましたが、その後ビットコイン主導のショートスクイーズによって$1.50を上回って反発しました。このトークンは依然として、2025年の高値である約$3.66を大きく下回っています。つまり、過去のデータからは、強い市場環境ではXRPが$2を大きく上回って取引できることが示されています。[2][3]
372
記事
翻訳参照
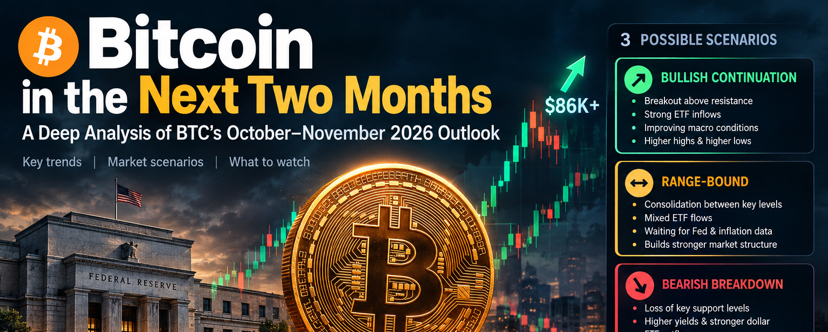
Bitcoin in the Next Two Months: A Deep Analysis of BTC’s October–November 2026 OutlookBitcoin has entered the final quarter of 2026 with a market structure that is difficult to ignore. After recovering sharply toward $86,000, BTC is facing a critical two-month period shaped by monetary policy, institutional demand, liquidity, regulation, market psychology, and technical resistance.
Important: This is a market analysis, not a guarantee or personalized financial advice. Bitcoin can move rapidly in either direction, and the scenarios below should be treated as possibilities rather than predictions.
Where Bitcoin Stands Right Now
As of September 23, 2026, Bitcoin is trading around $86,800. BTC recently moved above $86,000, reaching its highest level since January. The move was accompanied by strength in technology stocks and renewed institutional activity. (CoinDesk)
This is important because Bitcoin is currently behaving less like an isolated cryptocurrency and more like a high-beta macro asset.
In other words, what happens to:
* interest rates,
* Treasury yields,
* the U.S. dollar,
* liquidity,
* technology stocks,
* institutional flows,
* and geopolitical risk
could have a major influence on BTC over the next two months.
The Biggest Macro Risk: The Federal Reserve
One of the most important developments of September was the Federal Reserve’s decision to raise its target interest-rate range by 25 basis points to 3.75%–4.00%.
This was the first Fed rate increase since 2023.
More importantly, Federal Reserve projections indicated that policymakers expected another increase during 2026, while the previous expectation of a 2027 cut was removed from the latest projections. (Reuters)
That creates a complicated environment for Bitcoin.
Normally, lower interest rates and easier liquidity can support risk assets. Higher rates can make speculative assets less attractive because investors can obtain relatively higher returns from traditional fixed-income assets.
However, Bitcoin has recently demonstrated something interesting:
Bad macro news has not automatically produced a major BTC sell-off.
After the Fed hike and the setback to the CLARITY Act, Bitcoin remained relatively resilient. CoinDesk reported that BTC had been holding around the $77,000 area despite several macroeconomic and regulatory headwinds before its subsequent recovery. (CoinDesk)
That resilience is worth watching.
⸻
October: The First Major Test
October could become a defining month for Bitcoin.
The next Federal Reserve meeting is scheduled for October 27–28, 2026. (Admirals)
Therefore, BTC could experience increased volatility as traders reassess:
Inflation → Fed policy → interest rates → liquidity → risk appetite → Bitcoin
If inflation remains elevated and the Fed maintains a hawkish position, Bitcoin could face resistance.
But if inflation data improves and markets begin expecting less monetary tightening, the environment could become more supportive for risk assets.
This makes October less about a single Bitcoin headline and more about the interaction between Bitcoin and macroeconomic liquidity.
⸻
Bitcoin’s Technical Structure
At around $86,000–$87,000, Bitcoin is entering an area where the market will need to prove that the recent recovery has enough strength behind it.
A useful way to think about the next two months is through three broad zones rather than one exact price prediction.
Scenario 1: Bullish continuation
If BTC can establish itself above the recent breakout area and maintain strong trading volume, the market could begin focusing on higher resistance zones.
The important signal would not simply be a brief move above resistance.
The stronger signal would be:
breakout → successful retest → higher low → continuation
That would suggest buyers are willing to defend higher prices.
Institutional flows could strengthen this scenario. Recent reporting indicated that major U.S. spot Bitcoin ETFs received approximately $433 million in inflows on one Friday, while Strategy purchased another $75.7 million worth of Bitcoin. (The Wall Street Journal)
If this type of demand continues, it could provide an important source of buying pressure.
⸻
Scenario 2: Range-Bound Bitcoin
Bitcoin does not necessarily need to enter a massive bull or bear market immediately.
A third possibility is consolidation.
BTC could move back and forth between major support and resistance zones while investors wait for clearer information about:
* Federal Reserve policy
* inflation
* ETF flows
* institutional accumulation
* the U.S. dollar
* Treasury yields
* geopolitical developments
This type of environment can feel boring, but it can become important for market structure.
A prolonged consolidation can allow excessive leverage to disappear and give long-term investors time to establish positions.
⸻
Scenario 3: Bearish Breakdown
The major risk would be a failure of the current recovery.
If Bitcoin loses important support levels while simultaneously experiencing:
* rising Treasury yields,
* a stronger U.S. dollar,
* additional Fed tightening expectations,
* falling ETF inflows,
* declining equity markets,
* or a major geopolitical shock,
selling pressure could accelerate.
The key distinction would be whether a decline is simply a normal correction or the beginning of a broader trend reversal.
A single red day would not establish a bear trend.
A more concerning structure would be:
lower high → lower low → failed recovery → additional selling
This is why the next few weeks are likely to be more informative than any single daily candle.
⸻
The Institutional Factor
One of the biggest structural changes in Bitcoin’s market is the increasing importance of institutional investors.
The recent recovery has occurred alongside renewed institutional activity.
For example, Strategy’s Bitcoin holdings reached approximately 846,000 BTC after its latest reported purchase, while major spot Bitcoin ETFs also recorded substantial inflows. (The Wall Street Journal)
This matters because institutional capital can change the character of Bitcoin’s market.
If institutions continue accumulating during corrections, dips can potentially find stronger demand.
But the opposite is also true.
If institutional flows reverse significantly, Bitcoin could lose an important source of demand.
Therefore, over the next two months, ETF flow data may be more informative than social-media sentiment.
⸻
Regulation: A Mixed Picture
Regulation is another major variable.
The Senate’s CLARITY Act setback created uncertainty for the crypto industry, but it did not eliminate all regulatory developments.
CoinDesk reported that the SEC subsequently introduced an innovation exemption related to tokenized securities venues, providing a more constructive regulatory development even after the legislative setback. (CoinDesk)
For Bitcoin specifically, regulatory clarity can influence institutional participation.
The market therefore needs to distinguish between:
negative legislative news
and
broader regulatory progress.
They are not necessarily the same thing.
⸻
Bitcoin Seasonality
Historical seasonality is another factor investors will probably watch.
Bitcoin is currently on track for a rare three-month winning streak from July through September. CoinDesk notes that the only previous occurrence was in 2012. Interestingly, Bitcoin then experienced a decline in October before beginning a historically extraordinary rally afterward. (CoinDesk)
But there is an important warning here:
One historical example is not enough to establish a reliable trading rule.
Markets change.
Bitcoin’s market structure today is completely different from 2012, with institutional ETFs, derivatives markets, large professional participants and significantly greater liquidity.
Therefore, the 2012 pattern should be treated as historical context—not as evidence that 2026 will repeat it.
⸻
What Could Drive Bitcoin Higher?
Several developments could strengthen the bullish scenario over the next two months:
1. Lower inflation
If inflation data begins moving convincingly lower, expectations for additional Fed tightening could decline.
2. Strong ETF inflows
Persistent institutional buying could provide structural demand.
3. Improving liquidity
A shift toward easier financial conditions could benefit risk assets.
4. Bitcoin holding higher support
If BTC repeatedly survives corrections without breaking important structural levels, confidence could increase.
5. Strong equity markets
Bitcoin has recently shown meaningful correlation with technology and risk assets. (MarketWatch)
Continued strength in equities could therefore support BTC sentiment.
⸻
What Could Push Bitcoin Lower?
The biggest risks include:
Higher-for-longer interest rates
The Fed’s current projections remain a significant headwind. (Reuters)
Stronger U.S. dollar
A stronger dollar can tighten financial conditions and pressure risk assets.
Rising oil prices
Higher energy prices can contribute to inflation and make monetary easing more difficult.
ETF outflows
If institutional investors begin withdrawing capital consistently, Bitcoin could lose an important source of demand.
Excessive leverage
Large amounts of leveraged long positions can create violent liquidations during sudden declines.
Geopolitical shocks
Unexpected geopolitical developments can rapidly change global risk appetite.
⸻
The Two-Month Roadmap
Rather than attempting to predict one exact BTC price, it is more useful to monitor the market in stages.
Late September
Question: Can Bitcoin maintain the recent recovery?
Watch:
* $86K–$87K area
* trading volume
* ETF flows
* Nasdaq performance
* dollar strength
October
Question: Can BTC establish a sustainable higher structure?
The October 27–28 Fed meeting will be particularly important. (Admirals)
Watch for changes in expectations surrounding inflation and interest rates.
November
Question: Was the October move a breakout or simply another rally inside a larger range?
By November, investors should have more information about:
* Fed policy
* inflation
* ETF demand
* institutional positioning
* regulatory developments
* Bitcoin’s reaction to resistance and support
That information could make the market structure considerably clearer.
⸻
My Framework for the Next Two Months
Instead of asking:
“Will Bitcoin go up or down?”
A better question is:
“What evidence would confirm each scenario?”
Bullish evidence
Higher highs + higher lows + strong volume + sustained ETF inflows + improving macro conditions
Neutral evidence
Range-bound price + mixed ETF flows + stable macro conditions + repeated rejection at resistance
Bearish evidence
Lower highs + lower lows + ETF outflows + stronger dollar + rising yields + worsening risk sentiment
This framework prevents one headline from controlling the entire analysis.
⸻
Final Takeaway
Bitcoin enters the final quarter of 2026 at a fascinating point.
The market has already demonstrated considerable resilience. BTC has recovered toward the mid-$80,000s despite a more hawkish Federal Reserve, regulatory uncertainty and broader macroeconomic pressures. (CoinDesk)
At the same time, the environment is far from risk-free.
The Federal Reserve has raised rates to 3.75%–4.00%, policymakers have signaled the possibility of another increase, and inflation remains an important concern. (Reuters)
That creates a genuine tug-of-war:
Institutional demand vs. tighter monetary policy
Bitcoin momentum vs. macroeconomic pressure
Regulatory progress vs. legislative uncertainty
Risk appetite vs. higher yields
The next two months may therefore be less about finding a perfect Bitcoin price target and more about identifying which side of this battle is gaining strength.
For investors and observers, the most important indicators to monitor are likely to be ETF flows, Federal Reserve expectations, inflation data, Treasury yields, the U.S. dollar, Bitcoin’s support/resistance structure, and institutional accumulation.
Bitcoin does not need every indicator to become bullish simultaneously.
But if several of these factors begin moving in the same direction, the market’s next major trend could become much easier to identify.
#BTC #BTC☀ #BTC走势分析 #btc90k $
Bitcoin in the Next Two Months: A Deep Analysis of BTC’s October–November 2026 Outlook
Bitcoin has entered the final quarter of 2026 with a market structure that is difficult to ignore. After recovering sharply toward $86,000, BTC is facing a critical two-month period shaped by monetary policy, institutional demand, liquidity, regulation, market psychology, and technical resistance.
Important: This is a market analysis, not a guarantee or personalized financial advice. Bitcoin can move rapidly in either direction, and the scenarios below should be treated as possibilities rather than predictions.
Where Bitcoin Stands Right Now
As of September 23, 2026, Bitcoin is trading around $86,800. BTC recently moved above $86,000, reaching its highest level since January. The move was accompanied by strength in technology stocks and renewed institutional activity. (CoinDesk)
This is important because Bitcoin is currently behaving less like an isolated cryptocurrency and more like a high-beta macro asset.
In other words, what happens to:
* interest rates,
* Treasury yields,
* the U.S. dollar,
* liquidity,
* technology stocks,
* institutional flows,
* and geopolitical risk
could have a major influence on BTC over the next two months.
The Biggest Macro Risk: The Federal Reserve
One of the most important developments of September was the Federal Reserve’s decision to raise its target interest-rate range by 25 basis points to 3.75%–4.00%.
This was the first Fed rate increase since 2023.
More importantly, Federal Reserve projections indicated that policymakers expected another increase during 2026, while the previous expectation of a 2027 cut was removed from the latest projections. (Reuters)
That creates a complicated environment for Bitcoin.
Normally, lower interest rates and easier liquidity can support risk assets. Higher rates can make speculative assets less attractive because investors can obtain relatively higher returns from traditional fixed-income assets.
However, Bitcoin has recently demonstrated something interesting:
Bad macro news has not automatically produced a major BTC sell-off.
After the Fed hike and the setback to the CLARITY Act, Bitcoin remained relatively resilient. CoinDesk reported that BTC had been holding around the $77,000 area despite several macroeconomic and regulatory headwinds before its subsequent recovery. (CoinDesk)
That resilience is worth watching.
⸻
October: The First Major Test
October could become a defining month for Bitcoin.
The next Federal Reserve meeting is scheduled for October 27–28, 2026. (Admirals)
Therefore, BTC could experience increased volatility as traders reassess:
Inflation → Fed policy → interest rates → liquidity → risk appetite → Bitcoin
If inflation remains elevated and the Fed maintains a hawkish position, Bitcoin could face resistance.
But if inflation data improves and markets begin expecting less monetary tightening, the environment could become more supportive for risk assets.
This makes October less about a single Bitcoin headline and more about the interaction between Bitcoin and macroeconomic liquidity.
⸻
Bitcoin’s Technical Structure
At around $86,000–$87,000, Bitcoin is entering an area where the market will need to prove that the recent recovery has enough strength behind it.
A useful way to think about the next two months is through three broad zones rather than one exact price prediction.
Scenario 1: Bullish continuation
If BTC can establish itself above the recent breakout area and maintain strong trading volume, the market could begin focusing on higher resistance zones.
The important signal would not simply be a brief move above resistance.
The stronger signal would be:
breakout → successful retest → higher low → continuation
That would suggest buyers are willing to defend higher prices.
Institutional flows could strengthen this scenario. Recent reporting indicated that major U.S. spot Bitcoin ETFs received approximately $433 million in inflows on one Friday, while Strategy purchased another $75.7 million worth of Bitcoin. (The Wall Street Journal)
If this type of demand continues, it could provide an important source of buying pressure.
⸻
Scenario 2: Range-Bound Bitcoin
Bitcoin does not necessarily need to enter a massive bull or bear market immediately.
A third possibility is consolidation.
BTC could move back and forth between major support and resistance zones while investors wait for clearer information about:
* Federal Reserve policy
* inflation
* ETF flows
* institutional accumulation
* the U.S. dollar
* Treasury yields
* geopolitical developments
This type of environment can feel boring, but it can become important for market structure.
A prolonged consolidation can allow excessive leverage to disappear and give long-term investors time to establish positions.
⸻
Scenario 3: Bearish Breakdown
The major risk would be a failure of the current recovery.
If Bitcoin loses important support levels while simultaneously experiencing:
* rising Treasury yields,
* a stronger U.S. dollar,
* additional Fed tightening expectations,
* falling ETF inflows,
* declining equity markets,
* or a major geopolitical shock,
selling pressure could accelerate.
The key distinction would be whether a decline is simply a normal correction or the beginning of a broader trend reversal.
A single red day would not establish a bear trend.
A more concerning structure would be:
lower high → lower low → failed recovery → additional selling
This is why the next few weeks are likely to be more informative than any single daily candle.
⸻
The Institutional Factor
One of the biggest structural changes in Bitcoin’s market is the increasing importance of institutional investors.
The recent recovery has occurred alongside renewed institutional activity.
For example, Strategy’s Bitcoin holdings reached approximately 846,000 BTC after its latest reported purchase, while major spot Bitcoin ETFs also recorded substantial inflows. (The Wall Street Journal)
This matters because institutional capital can change the character of Bitcoin’s market.
If institutions continue accumulating during corrections, dips can potentially find stronger demand.
But the opposite is also true.
If institutional flows reverse significantly, Bitcoin could lose an important source of demand.
Therefore, over the next two months, ETF flow data may be more informative than social-media sentiment.
⸻
Regulation: A Mixed Picture
Regulation is another major variable.
The Senate’s CLARITY Act setback created uncertainty for the crypto industry, but it did not eliminate all regulatory developments.
CoinDesk reported that the SEC subsequently introduced an innovation exemption related to tokenized securities venues, providing a more constructive regulatory development even after the legislative setback. (CoinDesk)
For Bitcoin specifically, regulatory clarity can influence institutional participation.
The market therefore needs to distinguish between:
negative legislative news
and
broader regulatory progress.
They are not necessarily the same thing.
⸻
Bitcoin Seasonality
Historical seasonality is another factor investors will probably watch.
Bitcoin is currently on track for a rare three-month winning streak from July through September. CoinDesk notes that the only previous occurrence was in 2012. Interestingly, Bitcoin then experienced a decline in October before beginning a historically extraordinary rally afterward. (CoinDesk)
But there is an important warning here:
One historical example is not enough to establish a reliable trading rule.
Markets change.
Bitcoin’s market structure today is completely different from 2012, with institutional ETFs, derivatives markets, large professional participants and significantly greater liquidity.
Therefore, the 2012 pattern should be treated as historical context—not as evidence that 2026 will repeat it.
⸻
What Could Drive Bitcoin Higher?
Several developments could strengthen the bullish scenario over the next two months:
1. Lower inflation
If inflation data begins moving convincingly lower, expectations for additional Fed tightening could decline.
2. Strong ETF inflows
Persistent institutional buying could provide structural demand.
3. Improving liquidity
A shift toward easier financial conditions could benefit risk assets.
4. Bitcoin holding higher support
If BTC repeatedly survives corrections without breaking important structural levels, confidence could increase.
5. Strong equity markets
Bitcoin has recently shown meaningful correlation with technology and risk assets. (MarketWatch)
Continued strength in equities could therefore support BTC sentiment.
⸻
What Could Push Bitcoin Lower?
The biggest risks include:
Higher-for-longer interest rates
The Fed’s current projections remain a significant headwind. (Reuters)
Stronger U.S. dollar
A stronger dollar can tighten financial conditions and pressure risk assets.
Rising oil prices
Higher energy prices can contribute to inflation and make monetary easing more difficult.
ETF outflows
If institutional investors begin withdrawing capital consistently, Bitcoin could lose an important source of demand.
Excessive leverage
Large amounts of leveraged long positions can create violent liquidations during sudden declines.
Geopolitical shocks
Unexpected geopolitical developments can rapidly change global risk appetite.
⸻
The Two-Month Roadmap
Rather than attempting to predict one exact BTC price, it is more useful to monitor the market in stages.
Late September
Question: Can Bitcoin maintain the recent recovery?
Watch:
* $86K–$87K area
* trading volume
* ETF flows
* Nasdaq performance
* dollar strength
October
Question: Can BTC establish a sustainable higher structure?
The October 27–28 Fed meeting will be particularly important. (Admirals)
Watch for changes in expectations surrounding inflation and interest rates.
November
Question: Was the October move a breakout or simply another rally inside a larger range?
By November, investors should have more information about:
* Fed policy
* inflation
* ETF demand
* institutional positioning
* regulatory developments
* Bitcoin’s reaction to resistance and support
That information could make the market structure considerably clearer.
⸻
My Framework for the Next Two Months
Instead of asking:
“Will Bitcoin go up or down?”
A better question is:
“What evidence would confirm each scenario?”
Bullish evidence
Higher highs + higher lows + strong volume + sustained ETF inflows + improving macro conditions
Neutral evidence
Range-bound price + mixed ETF flows + stable macro conditions + repeated rejection at resistance
Bearish evidence
Lower highs + lower lows + ETF outflows + stronger dollar + rising yields + worsening risk sentiment
This framework prevents one headline from controlling the entire analysis.
⸻
Final Takeaway
Bitcoin enters the final quarter of 2026 at a fascinating point.
The market has already demonstrated considerable resilience. BTC has recovered toward the mid-$80,000s despite a more hawkish Federal Reserve, regulatory uncertainty and broader macroeconomic pressures. (CoinDesk)
At the same time, the environment is far from risk-free.
The Federal Reserve has raised rates to 3.75%–4.00%, policymakers have signaled the possibility of another increase, and inflation remains an important concern. (Reuters)
That creates a genuine tug-of-war:
Institutional demand vs. tighter monetary policy
Bitcoin momentum vs. macroeconomic pressure
Regulatory progress vs. legislative uncertainty
Risk appetite vs. higher yields
The next two months may therefore be less about finding a perfect Bitcoin price target and more about identifying which side of this battle is gaining strength.
For investors and observers, the most important indicators to monitor are likely to be ETF flows, Federal Reserve expectations, inflation data, Treasury yields, the U.S. dollar, Bitcoin’s support/resistance structure, and institutional accumulation.
Bitcoin does not need every indicator to become bullish simultaneously.
But if several of these factors begin moving in the same direction, the market’s next major trend could become much easier to identify.
#BTC #BTC☀ #BTC走势分析 #btc90k $
Important: This is a market analysis, not a guarantee or personalized financial advice. Bitcoin can move rapidly in either direction, and the scenarios below should be treated as possibilities rather than predictions.
Where Bitcoin Stands Right Now
As of September 23, 2026, Bitcoin is trading around $86,800. BTC recently moved above $86,000, reaching its highest level since January. The move was accompanied by strength in technology stocks and renewed institutional activity. (CoinDesk)
This is important because Bitcoin is currently behaving less like an isolated cryptocurrency and more like a high-beta macro asset.
In other words, what happens to:
* interest rates,
* Treasury yields,
* the U.S. dollar,
* liquidity,
* technology stocks,
* institutional flows,
* and geopolitical risk
could have a major influence on BTC over the next two months.
The Biggest Macro Risk: The Federal Reserve
One of the most important developments of September was the Federal Reserve’s decision to raise its target interest-rate range by 25 basis points to 3.75%–4.00%.
This was the first Fed rate increase since 2023.
More importantly, Federal Reserve projections indicated that policymakers expected another increase during 2026, while the previous expectation of a 2027 cut was removed from the latest projections. (Reuters)
That creates a complicated environment for Bitcoin.
Normally, lower interest rates and easier liquidity can support risk assets. Higher rates can make speculative assets less attractive because investors can obtain relatively higher returns from traditional fixed-income assets.
However, Bitcoin has recently demonstrated something interesting:
Bad macro news has not automatically produced a major BTC sell-off.
After the Fed hike and the setback to the CLARITY Act, Bitcoin remained relatively resilient. CoinDesk reported that BTC had been holding around the $77,000 area despite several macroeconomic and regulatory headwinds before its subsequent recovery. (CoinDesk)
That resilience is worth watching.
⸻
October: The First Major Test
October could become a defining month for Bitcoin.
The next Federal Reserve meeting is scheduled for October 27–28, 2026. (Admirals)
Therefore, BTC could experience increased volatility as traders reassess:
Inflation → Fed policy → interest rates → liquidity → risk appetite → Bitcoin
If inflation remains elevated and the Fed maintains a hawkish position, Bitcoin could face resistance.
But if inflation data improves and markets begin expecting less monetary tightening, the environment could become more supportive for risk assets.
This makes October less about a single Bitcoin headline and more about the interaction between Bitcoin and macroeconomic liquidity.
⸻
Bitcoin’s Technical Structure
At around $86,000–$87,000, Bitcoin is entering an area where the market will need to prove that the recent recovery has enough strength behind it.
A useful way to think about the next two months is through three broad zones rather than one exact price prediction.
Scenario 1: Bullish continuation
If BTC can establish itself above the recent breakout area and maintain strong trading volume, the market could begin focusing on higher resistance zones.
The important signal would not simply be a brief move above resistance.
The stronger signal would be:
breakout → successful retest → higher low → continuation
That would suggest buyers are willing to defend higher prices.
Institutional flows could strengthen this scenario. Recent reporting indicated that major U.S. spot Bitcoin ETFs received approximately $433 million in inflows on one Friday, while Strategy purchased another $75.7 million worth of Bitcoin. (The Wall Street Journal)
If this type of demand continues, it could provide an important source of buying pressure.
⸻
Scenario 2: Range-Bound Bitcoin
Bitcoin does not necessarily need to enter a massive bull or bear market immediately.
A third possibility is consolidation.
BTC could move back and forth between major support and resistance zones while investors wait for clearer information about:
* Federal Reserve policy
* inflation
* ETF flows
* institutional accumulation
* the U.S. dollar
* Treasury yields
* geopolitical developments
This type of environment can feel boring, but it can become important for market structure.
A prolonged consolidation can allow excessive leverage to disappear and give long-term investors time to establish positions.
⸻
Scenario 3: Bearish Breakdown
The major risk would be a failure of the current recovery.
If Bitcoin loses important support levels while simultaneously experiencing:
* rising Treasury yields,
* a stronger U.S. dollar,
* additional Fed tightening expectations,
* falling ETF inflows,
* declining equity markets,
* or a major geopolitical shock,
selling pressure could accelerate.
The key distinction would be whether a decline is simply a normal correction or the beginning of a broader trend reversal.
A single red day would not establish a bear trend.
A more concerning structure would be:
lower high → lower low → failed recovery → additional selling
This is why the next few weeks are likely to be more informative than any single daily candle.
⸻
The Institutional Factor
One of the biggest structural changes in Bitcoin’s market is the increasing importance of institutional investors.
The recent recovery has occurred alongside renewed institutional activity.
For example, Strategy’s Bitcoin holdings reached approximately 846,000 BTC after its latest reported purchase, while major spot Bitcoin ETFs also recorded substantial inflows. (The Wall Street Journal)
This matters because institutional capital can change the character of Bitcoin’s market.
If institutions continue accumulating during corrections, dips can potentially find stronger demand.
But the opposite is also true.
If institutional flows reverse significantly, Bitcoin could lose an important source of demand.
Therefore, over the next two months, ETF flow data may be more informative than social-media sentiment.
⸻
Regulation: A Mixed Picture
Regulation is another major variable.
The Senate’s CLARITY Act setback created uncertainty for the crypto industry, but it did not eliminate all regulatory developments.
CoinDesk reported that the SEC subsequently introduced an innovation exemption related to tokenized securities venues, providing a more constructive regulatory development even after the legislative setback. (CoinDesk)
For Bitcoin specifically, regulatory clarity can influence institutional participation.
The market therefore needs to distinguish between:
negative legislative news
and
broader regulatory progress.
They are not necessarily the same thing.
⸻
Bitcoin Seasonality
Historical seasonality is another factor investors will probably watch.
Bitcoin is currently on track for a rare three-month winning streak from July through September. CoinDesk notes that the only previous occurrence was in 2012. Interestingly, Bitcoin then experienced a decline in October before beginning a historically extraordinary rally afterward. (CoinDesk)
But there is an important warning here:
One historical example is not enough to establish a reliable trading rule.
Markets change.
Bitcoin’s market structure today is completely different from 2012, with institutional ETFs, derivatives markets, large professional participants and significantly greater liquidity.
Therefore, the 2012 pattern should be treated as historical context—not as evidence that 2026 will repeat it.
⸻
What Could Drive Bitcoin Higher?
Several developments could strengthen the bullish scenario over the next two months:
1. Lower inflation
If inflation data begins moving convincingly lower, expectations for additional Fed tightening could decline.
2. Strong ETF inflows
Persistent institutional buying could provide structural demand.
3. Improving liquidity
A shift toward easier financial conditions could benefit risk assets.
4. Bitcoin holding higher support
If BTC repeatedly survives corrections without breaking important structural levels, confidence could increase.
5. Strong equity markets
Bitcoin has recently shown meaningful correlation with technology and risk assets. (MarketWatch)
Continued strength in equities could therefore support BTC sentiment.
⸻
What Could Push Bitcoin Lower?
The biggest risks include:
Higher-for-longer interest rates
The Fed’s current projections remain a significant headwind. (Reuters)
Stronger U.S. dollar
A stronger dollar can tighten financial conditions and pressure risk assets.
Rising oil prices
Higher energy prices can contribute to inflation and make monetary easing more difficult.
ETF outflows
If institutional investors begin withdrawing capital consistently, Bitcoin could lose an important source of demand.
Excessive leverage
Large amounts of leveraged long positions can create violent liquidations during sudden declines.
Geopolitical shocks
Unexpected geopolitical developments can rapidly change global risk appetite.
⸻
The Two-Month Roadmap
Rather than attempting to predict one exact BTC price, it is more useful to monitor the market in stages.
Late September
Question: Can Bitcoin maintain the recent recovery?
Watch:
* $86K–$87K area
* trading volume
* ETF flows
* Nasdaq performance
* dollar strength
October
Question: Can BTC establish a sustainable higher structure?
The October 27–28 Fed meeting will be particularly important. (Admirals)
Watch for changes in expectations surrounding inflation and interest rates.
November
Question: Was the October move a breakout or simply another rally inside a larger range?
By November, investors should have more information about:
* Fed policy
* inflation
* ETF demand
* institutional positioning
* regulatory developments
* Bitcoin’s reaction to resistance and support
That information could make the market structure considerably clearer.
⸻
My Framework for the Next Two Months
Instead of asking:
“Will Bitcoin go up or down?”
A better question is:
“What evidence would confirm each scenario?”
Bullish evidence
Higher highs + higher lows + strong volume + sustained ETF inflows + improving macro conditions
Neutral evidence
Range-bound price + mixed ETF flows + stable macro conditions + repeated rejection at resistance
Bearish evidence
Lower highs + lower lows + ETF outflows + stronger dollar + rising yields + worsening risk sentiment
This framework prevents one headline from controlling the entire analysis.
⸻
Final Takeaway
Bitcoin enters the final quarter of 2026 at a fascinating point.
The market has already demonstrated considerable resilience. BTC has recovered toward the mid-$80,000s despite a more hawkish Federal Reserve, regulatory uncertainty and broader macroeconomic pressures. (CoinDesk)
At the same time, the environment is far from risk-free.
The Federal Reserve has raised rates to 3.75%–4.00%, policymakers have signaled the possibility of another increase, and inflation remains an important concern. (Reuters)
That creates a genuine tug-of-war:
Institutional demand vs. tighter monetary policy
Bitcoin momentum vs. macroeconomic pressure
Regulatory progress vs. legislative uncertainty
Risk appetite vs. higher yields
The next two months may therefore be less about finding a perfect Bitcoin price target and more about identifying which side of this battle is gaining strength.
For investors and observers, the most important indicators to monitor are likely to be ETF flows, Federal Reserve expectations, inflation data, Treasury yields, the U.S. dollar, Bitcoin’s support/resistance structure, and institutional accumulation.
Bitcoin does not need every indicator to become bullish simultaneously.
But if several of these factors begin moving in the same direction, the market’s next major trend could become much easier to identify.
#BTC #BTC☀ #BTC走势分析 #btc90k $
71
記事
翻訳参照
XRP Next Big Move🤑📈 What the Charts & Technicals Show
Several technical-analysis sources highlight a consolidation zone roughly between $2.40 and $2.90 for XRP. If price stabilizes here, that may set the stage for a breakout later.
A common view among chart analysts: a breakout above resistance near ≈ $2.75–$3.00 could trigger a rally toward $3.50–$4.50+ levels.
Some bullish projections see XRP climbing beyond — for example, one forecast suggests a path to ≈ $5–$8 by 2026, provided favorable market and macro conditions.
---
🔮 Potential Near-Term & Mid-Term Trends for XRP
Time Frame What Might Happen / What to Watch
Next few months Consolidation between $2.40–$2.90, testing support/resistance — range-bound moves unless strong catalysts (like renewed adoption or macro tailwinds) emerge.
Late 2025 – 2026 If resistance breaks, price could revisit $4–$6, assuming bullish sentiment returns and institutional interest in crypto strengthens.
2026–2028 (bullish scenario) Some long-term price models—based on repeating past cycle patterns and growing adoption — point to $7–$10+ potential.
Risk factors A failure to hold support zones (~$2.40), broader crypto-market downturns, or weaker-than-expected institutional flows could stall or reverse the uptrend.
---
⚠️ What Could Drive or Derail the Trend
Potential Catalysts:
Strong institutional adoption — if companies or banks increasingly use XRP for cross-border payments.
Overall bullish mood in crypto markets, possibly spurred by macroeconomic conditions, rate cuts, or favorable regulatory developments.
Technical breakout above resistance zones and successful consolidation — historical momentum extremes often lead to sharp upswings.
Key Risks:
Extended consolidation or sideways action, leading to loss of investor interest or capital outflow.
Adverse macroeconomic or regulatory events that affect crypto broadly.
Failure to translate technical potential into real-world adoption (payments, institutional flows) — undermining long-term bullish projections.
$XRP #BTCVSGOLD #BinanceBlockchainWeek #CryptoMarketAnalysis
{future}(XRPUSDT)
XRP Next Big Move🤑
📈 What the Charts & Technicals Show
Several technical-analysis sources highlight a consolidation zone roughly between $2.40 and $2.90 for XRP. If price stabilizes here, that may set the stage for a breakout later.
A common view among chart analysts: a breakout above resistance near ≈ $2.75–$3.00 could trigger a rally toward $3.50–$4.50+ levels.
Some bullish projections see XRP climbing beyond — for example, one forecast suggests a path to ≈ $5–$8 by 2026, provided favorable market and macro conditions.
---
🔮 Potential Near-Term & Mid-Term Trends for XRP
Time Frame What Might Happen / What to Watch
Next few months Consolidation between $2.40–$2.90, testing support/resistance — range-bound moves unless strong catalysts (like renewed adoption or macro tailwinds) emerge.
Late 2025 – 2026 If resistance breaks, price could revisit $4–$6, assuming bullish sentiment returns and institutional interest in crypto strengthens.
2026–2028 (bullish scenario) Some long-term price models—based on repeating past cycle patterns and growing adoption — point to $7–$10+ potential.
Risk factors A failure to hold support zones (~$2.40), broader crypto-market downturns, or weaker-than-expected institutional flows could stall or reverse the uptrend.
---
⚠️ What Could Drive or Derail the Trend
Potential Catalysts:
Strong institutional adoption — if companies or banks increasingly use XRP for cross-border payments.
Overall bullish mood in crypto markets, possibly spurred by macroeconomic conditions, rate cuts, or favorable regulatory developments.
Technical breakout above resistance zones and successful consolidation — historical momentum extremes often lead to sharp upswings.
Key Risks:
Extended consolidation or sideways action, leading to loss of investor interest or capital outflow.
Adverse macroeconomic or regulatory events that affect crypto broadly.
Failure to translate technical potential into real-world adoption (payments, institutional flows) — undermining long-term bullish projections.
$XRP #BTCVSGOLD #BinanceBlockchainWeek #CryptoMarketAnalysis
Several technical-analysis sources highlight a consolidation zone roughly between $2.40 and $2.90 for XRP. If price stabilizes here, that may set the stage for a breakout later.
A common view among chart analysts: a breakout above resistance near ≈ $2.75–$3.00 could trigger a rally toward $3.50–$4.50+ levels.
Some bullish projections see XRP climbing beyond — for example, one forecast suggests a path to ≈ $5–$8 by 2026, provided favorable market and macro conditions.
---
🔮 Potential Near-Term & Mid-Term Trends for XRP
Time Frame What Might Happen / What to Watch
Next few months Consolidation between $2.40–$2.90, testing support/resistance — range-bound moves unless strong catalysts (like renewed adoption or macro tailwinds) emerge.
Late 2025 – 2026 If resistance breaks, price could revisit $4–$6, assuming bullish sentiment returns and institutional interest in crypto strengthens.
2026–2028 (bullish scenario) Some long-term price models—based on repeating past cycle patterns and growing adoption — point to $7–$10+ potential.
Risk factors A failure to hold support zones (~$2.40), broader crypto-market downturns, or weaker-than-expected institutional flows could stall or reverse the uptrend.
---
⚠️ What Could Drive or Derail the Trend
Potential Catalysts:
Strong institutional adoption — if companies or banks increasingly use XRP for cross-border payments.
Overall bullish mood in crypto markets, possibly spurred by macroeconomic conditions, rate cuts, or favorable regulatory developments.
Technical breakout above resistance zones and successful consolidation — historical momentum extremes often lead to sharp upswings.
Key Risks:
Extended consolidation or sideways action, leading to loss of investor interest or capital outflow.
Adverse macroeconomic or regulatory events that affect crypto broadly.
Failure to translate technical potential into real-world adoption (payments, institutional flows) — undermining long-term bullish projections.
$XRP #BTCVSGOLD #BinanceBlockchainWeek #CryptoMarketAnalysis
13


🫰🫰
🫰🫰


FeryX Trades
·
--
ブリッシュ🎁ビッグレッドボックスを請求するコメント🧧😋
毎日の暗号分析と無料シグナル + ビッグレッドボックスのために@FeryX Trades をフォローしてください💥💥😍
$SOL $XRP $BTC #FeryX
毎日の暗号分析と無料シグナル + ビッグレッドボックスのために@FeryX Trades をフォローしてください💥💥😍
$SOL $XRP $BTC #FeryX


翻訳参照
I think it can hit 20$ again in the next upcoming weeks🧐
I think it can hit 20$ again in the next upcoming weeks🧐

DeFiTitan
·
--
弱気相場🚨 TRUMPPPPPPPコインはあなたを破産させましたか?まだ大きなブル市場の復活を夢見ていますか?🚨
🔥 $TRUMP – 夢を打ち砕いたコイン!🔥
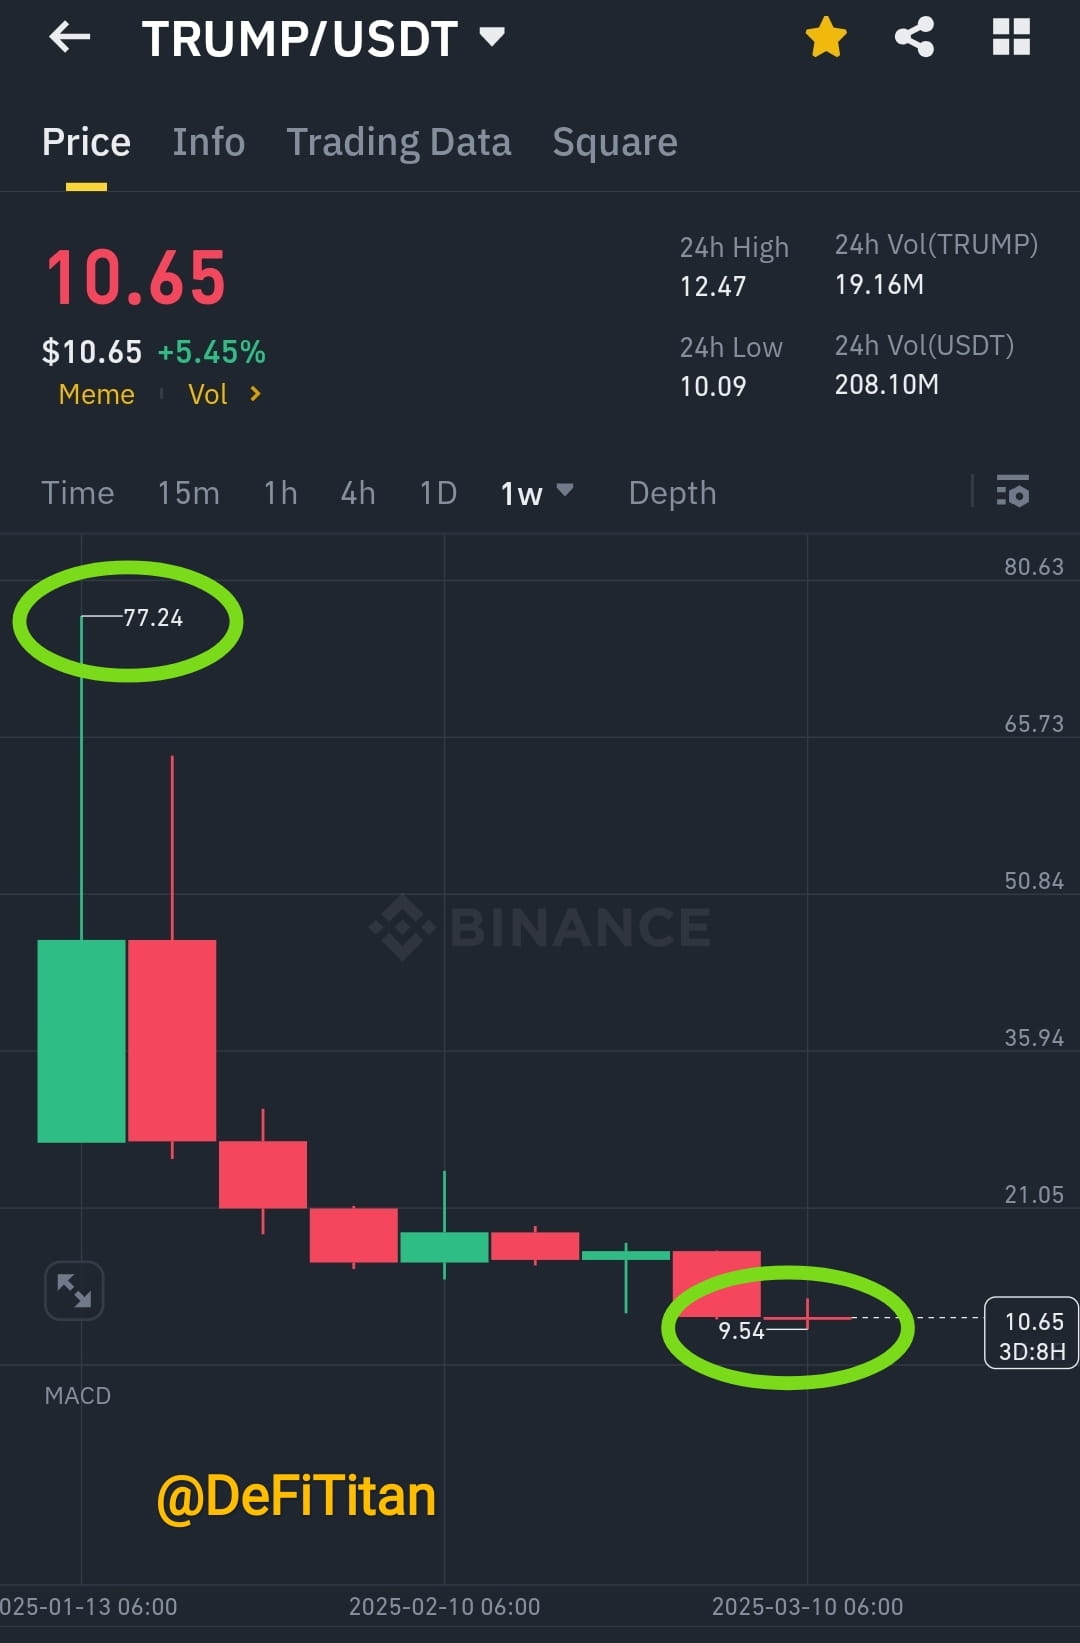
📊 現在の価格: 10.65 (+/-)
📈 24時間の高値: 12.47 | 24時間の安値: 10.10
🏆 史上最高値: 77.24 (2025年1月19日)
📉 史上最低値: 9.54 (2025年3月11日)
TRUMPコインは多くの暗号投資家の富を消し去りました!最初にローンチされたとき、それは最も多く投資されたコインの一つとして歴史を作り、すぐにトップ20-25の最も価値のある暗号資産に入っていきました。米国の選挙の前、多くの人がトランプを「暗号大統領」と信じており、コインへの大きな期待と投資を促進しました。
しかし今、$TRUMP は77.24からわずか9.54に崩壊しました!ピーク時に150ドルに達することを期待して購入した投資家たちは、今や壊滅的な状況にあります。彼らの状況を想像できますか?多くの人がすべてを失いました!
それでは、再び77.24への上昇を待ち続けますか?どのトレーダーもそんなに長く持ちこたえられますか?すべてが下がるだけのTRUMPコインを信頼するのはまだ選択肢ですか?
💬 コメントであなたの意見をお聞かせください!
💰 このコインにいくら投資しましたか?
📉 この大幅な下落後の現在のポジションは?
📢 @DeFiTitan による投稿
👍 いいね、🔄 シェア & 💬 コメント – ただし、許可なくコピーしないでください!
#TRUMP #CryptoCollapse #BearishTrend #CryptoReality #DeFiTitan $TRUMP
🔥 $TRUMP – 夢を打ち砕いたコイン!🔥
📊 現在の価格: 10.65 (+/-)
📈 24時間の高値: 12.47 | 24時間の安値: 10.10
🏆 史上最高値: 77.24 (2025年1月19日)
📉 史上最低値: 9.54 (2025年3月11日)
TRUMPコインは多くの暗号投資家の富を消し去りました!最初にローンチされたとき、それは最も多く投資されたコインの一つとして歴史を作り、すぐにトップ20-25の最も価値のある暗号資産に入っていきました。米国の選挙の前、多くの人がトランプを「暗号大統領」と信じており、コインへの大きな期待と投資を促進しました。
しかし今、$TRUMP は77.24からわずか9.54に崩壊しました!ピーク時に150ドルに達することを期待して購入した投資家たちは、今や壊滅的な状況にあります。彼らの状況を想像できますか?多くの人がすべてを失いました!
それでは、再び77.24への上昇を待ち続けますか?どのトレーダーもそんなに長く持ちこたえられますか?すべてが下がるだけのTRUMPコインを信頼するのはまだ選択肢ですか?
💬 コメントであなたの意見をお聞かせください!
💰 このコインにいくら投資しましたか?
📉 この大幅な下落後の現在のポジションは?
📢 @DeFiTitan による投稿
👍 いいね、🔄 シェア & 💬 コメント – ただし、許可なくコピーしないでください!
#TRUMP #CryptoCollapse #BearishTrend #CryptoReality #DeFiTitan $TRUMP
115
2時間待ってください、強気になります
2時間待ってください、強気になります

TajwarSiyoon
·
--
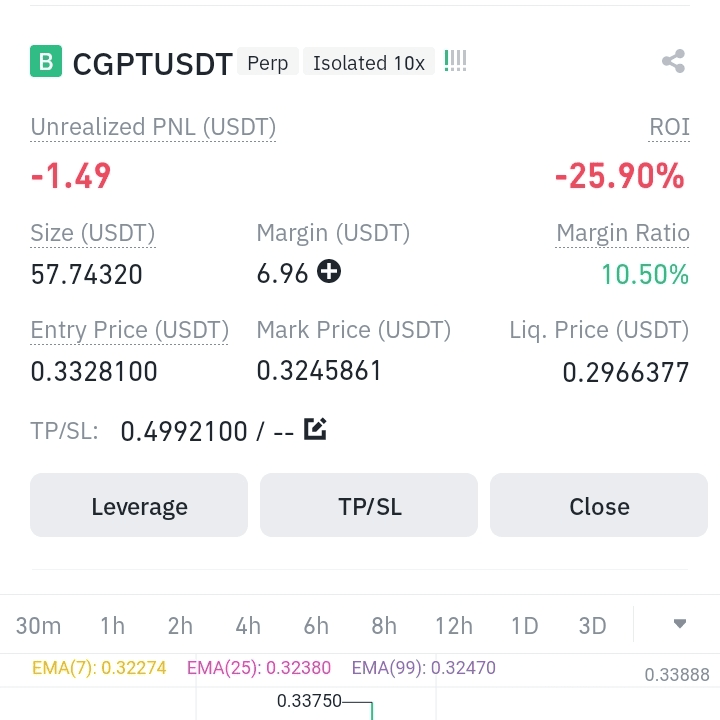
$CGPT ロングポジション ....保持するか閉じるか、TPに最適なポイントはどれか教えてください
1
1
ログインして、さらにコンテンツを読む
厳選トピックで世界の暗号資産トレーダーの仲間入り
⚡️ 暗号資産に関する最新かつ有益な情報が見つかります。
💬 世界最大の暗号資産取引所から信頼されています。
👍 認証を受けたクリエイターから、有益なインサイトを得られます。
メール / 電話番号
トレンドトピック
AIStocksWhatNext
閲覧回数 898,610
6,688人が討論中
注目ハッシュタグキャンペーンでトラフィック報酬を「シェア&ウィン」しよう
✨トピック:AI株が上昇し続ける中、ほかにどんな投資チャンスが残っている?
👉参加方法:
ハッシュタグ #AIStocksWhatNext を付けて短い投稿または記事を公開する
強気か弱気かを共有し、AI株の保有または取引を投稿してください—取引ウィジェットを使うと資格を得やすくなる可能性があります。
データやチャートを共有し、AI生成画像を避けることで、投稿をさらに強化できます。
✍️以下の切り口を参考にコンテンツを作成してください:
- Nvidiaは来年のチップ販売が倍増すると述べ、主要なAI企業は記録的な売上を更新し続けています。これを支える計算コストはそれだけでも驚異的です。本当にAI需要は伸びているのか? そして、それはどれくらい続くのでしょうか?AI株は全体的に上昇中。これは本物のブレイクアウトなのか、それとも短期的な戻りなのか?
- 産業のリーダーたちはAI開発のペースを落とすよう求めています。一方でトランプは「AIフォース」を構築する計画で、AIが将来的に米国のGDPの25%を占める可能性があると主張しています。あなたはどちら側ですか? AI株に対する州レベルの後押しは長期的な勝利になりますか?
- あなたはAI株を買っていますか? 取引/保有を、取引シェアリングウィジェットで共有してください。
⏰キャンペーン期間:
- 2026-09-22 7:00 - 2026-09-24 4:00(UTC)
🎁報酬:
- 上記のガイドラインを満たし、100語を超える適格投稿は審査され、ランダムなトラフィックブースト(500〜3,000ビュー)が付与される場合があります。投稿が選ばれた場合は、フィード担当者から通知が届きます。
- Binance Square Officialに記事が掲載されるチャンス
投稿のアイデアが必要ですか? トピックページ #AIStocksWhatNext または Square Guide on How to Post for Better Reach をご覧ください。
Binance Square Official
·いいね:588件
·閲覧回数 1.7M
BitcoinRejectedAt$87,300Twice
閲覧回数 0
0人が討論中
BCHJumps28%OnCMEFuturesListing
閲覧回数 12,688
552人が討論中