
Bhandari Pitambar
2.5k 投稿

Bhandari Pitambar
報告
ユーザーをブロック
取引を発注

PEPEホルダー
高頻度トレーダー
1.2年
2.2K+ フォロー
601 フォロワー
233 いいね
投稿
ポートフォリオ
すべて
動画
ライブ
記事
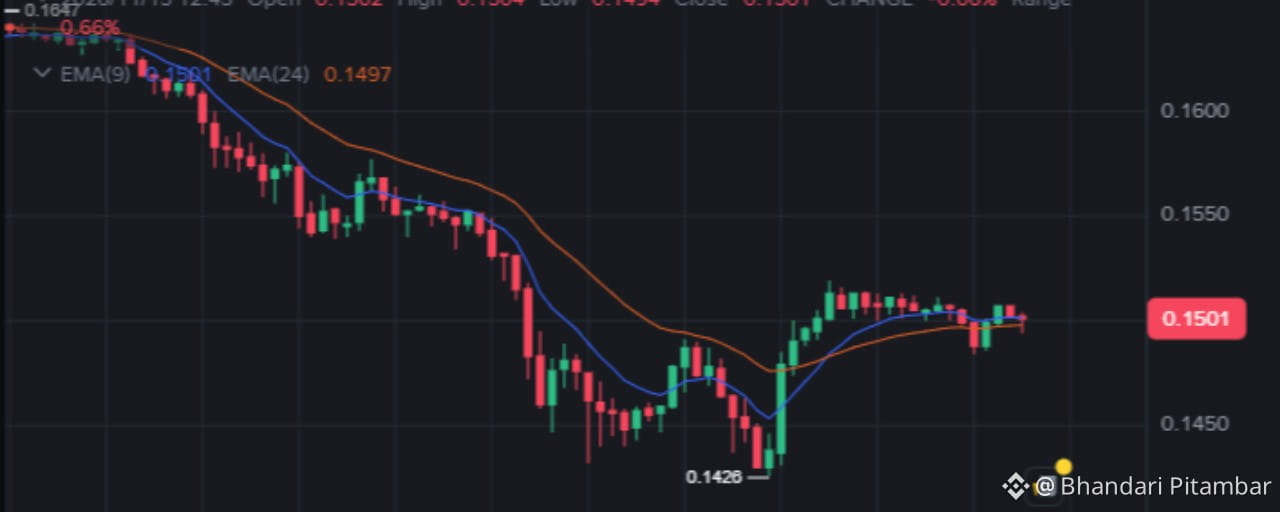
ADA/USDT市場分析(15分足チャート+市場全体)チャートが示していること:
価格:$0.1501 — 0.1647から大きく下落した後、0.1426で底を打ち、V字回復して約0.1520まで上昇。その後、現在は0.1495~0.1510の狭い範囲で持ち合っています
EMA(9) ≈ 0.1501、EMA(24) = 0.1497 — 価格は両方のEMAとほぼ同水準か、その上に張り付いています。短期的な下落はいったん止まっていますが、方向性はまだ定まっていません
RSI(6) = 49.90 — ほぼ中立です。売られすぎでも買われすぎでもなく、市場はブレイクアウトを待っています
全体像(重要なポイント):
ADAは24時間で-10.29%、30日間で-34.98%下落しており、BNBよりも弱いパフォーマンスです
ADA/USDT市場分析(15分足チャート+市場全体)
チャートが示していること:
価格:$0.1501 — 0.1647から大きく下落した後、0.1426で底を打ち、V字回復して約0.1520まで上昇。その後、現在は0.1495~0.1510の狭い範囲で持ち合っています
EMA(9) ≈ 0.1501、EMA(24) = 0.1497 — 価格は両方のEMAとほぼ同水準か、その上に張り付いています。短期的な下落はいったん止まっていますが、方向性はまだ定まっていません
RSI(6) = 49.90 — ほぼ中立です。売られすぎでも買われすぎでもなく、市場はブレイクアウトを待っています
全体像(重要なポイント):
ADAは24時間で-10.29%、30日間で-34.98%下落しており、BNBよりも弱いパフォーマンスです
価格:$0.1501 — 0.1647から大きく下落した後、0.1426で底を打ち、V字回復して約0.1520まで上昇。その後、現在は0.1495~0.1510の狭い範囲で持ち合っています
EMA(9) ≈ 0.1501、EMA(24) = 0.1497 — 価格は両方のEMAとほぼ同水準か、その上に張り付いています。短期的な下落はいったん止まっていますが、方向性はまだ定まっていません
RSI(6) = 49.90 — ほぼ中立です。売られすぎでも買われすぎでもなく、市場はブレイクアウトを待っています
全体像(重要なポイント):
ADAは24時間で-10.29%、30日間で-34.98%下落しており、BNBよりも弱いパフォーマンスです
1
1
237
記事
翻訳参照
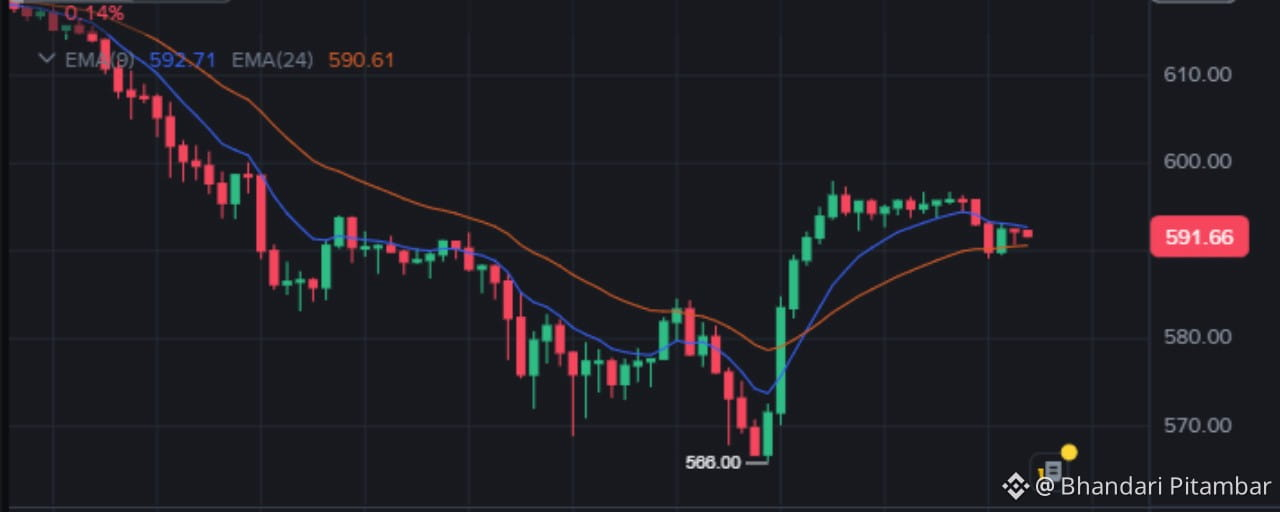
BNB Market Analysis (15-Minute Chart + Overall Market)What Your Chart Shows:
Price: 591.66 — BNB bounced sharply in a V-shape from the low of 568 to around 597. It is now pulling back and trying to stabilize.EMA(9) = 592.71 (price is below it) and EMA(24) = 590.61 (price is above it) — Price is trapped between the two EMAs, indicating that the market is looking for direction.RSI(6) = 43 — Buying momentum is slowing down, but the market is not oversold. RSI is in a neutral-to-weak zone.
Bigger Picture (Very Important):
Looking only at the 15-minute chart is not enough. On higher timeframes, BNB is in a strong downtrend.
BNB has dropped approximately 15% in 7 days, falling from around 700 to 590.This is not just a BNB problem — the entire crypto market is under pressure: Bitcoin is below 69,000, ETH is below 2,000, and approximately $1.9 billion in liquidations have occurred within 24 hours.Macroeconomic pressure: Higher-than-expected US inflation has increased fears that the Federal Reserve may raise interest rates in December. ETF outflows are also putting pressure on the market.The impact of Binance's approximately $6.4 billion hack on October 29 is still being felt. However, Binance has reportedly covered all affected assets through its SAFU fund and published its Proof of Reserves.Fear & Greed Index = 21 (Extreme Fear), and approximately 71% of accounts are holding long positions. Heavy long positioning increases the risk of further liquidations.
Pump or Dump? — Both Scenarios:
🟢 Bullish Scenario (Pump):
If the 588–590 support zone (EMA24) holds and BNB breaks above 595–597 with strong volume, the next targets could be:600–605610–613 (potential relief rally)The daily RSI was around 28 (oversold), so there is room for a bounce.However, the rally may not last unless BTC also stabilizes and starts recovering.
🔴 Bearish Scenario (Dump) — More Likely According to the Current Trend:
If the price drops below 588–590, BNB could retest:580 support568 (the previous chart low)If 568 also breaks, the next downside zone could be 550–558.Analysts consider $580 an important support level. Losing this level could lead to a deeper decline.
My Conclusion:
In the short term, BNB appears likely to move within the 568–600 range, but the overall trend remains bearish.
Buying the current bounce and assuming that a new pump has started would be risky.
Until BTC recovers and BNB successfully reclaims the 600+ level, this move is more likely to be an oversold relief bounce rather than the beginning of a sustained bullish trend.
If 568 holds, a short-term long scalp setup may develop, but only with strict risk management and a stop-loss around 566–567.
{future}(BTCUSDT)
{spot}(BNBUSDT)
BNB Market Analysis (15-Minute Chart + Overall Market)
What Your Chart Shows:
Price: 591.66 — BNB bounced sharply in a V-shape from the low of 568 to around 597. It is now pulling back and trying to stabilize.EMA(9) = 592.71 (price is below it) and EMA(24) = 590.61 (price is above it) — Price is trapped between the two EMAs, indicating that the market is looking for direction.RSI(6) = 43 — Buying momentum is slowing down, but the market is not oversold. RSI is in a neutral-to-weak zone.
Bigger Picture (Very Important):
Looking only at the 15-minute chart is not enough. On higher timeframes, BNB is in a strong downtrend.
BNB has dropped approximately 15% in 7 days, falling from around 700 to 590.This is not just a BNB problem — the entire crypto market is under pressure: Bitcoin is below 69,000, ETH is below 2,000, and approximately $1.9 billion in liquidations have occurred within 24 hours.Macroeconomic pressure: Higher-than-expected US inflation has increased fears that the Federal Reserve may raise interest rates in December. ETF outflows are also putting pressure on the market.The impact of Binance's approximately $6.4 billion hack on October 29 is still being felt. However, Binance has reportedly covered all affected assets through its SAFU fund and published its Proof of Reserves.Fear & Greed Index = 21 (Extreme Fear), and approximately 71% of accounts are holding long positions. Heavy long positioning increases the risk of further liquidations.
Pump or Dump? — Both Scenarios:
🟢 Bullish Scenario (Pump):
If the 588–590 support zone (EMA24) holds and BNB breaks above 595–597 with strong volume, the next targets could be:600–605610–613 (potential relief rally)The daily RSI was around 28 (oversold), so there is room for a bounce.However, the rally may not last unless BTC also stabilizes and starts recovering.
🔴 Bearish Scenario (Dump) — More Likely According to the Current Trend:
If the price drops below 588–590, BNB could retest:580 support568 (the previous chart low)If 568 also breaks, the next downside zone could be 550–558.Analysts consider $580 an important support level. Losing this level could lead to a deeper decline.
My Conclusion:
In the short term, BNB appears likely to move within the 568–600 range, but the overall trend remains bearish.
Buying the current bounce and assuming that a new pump has started would be risky.
Until BTC recovers and BNB successfully reclaims the 600+ level, this move is more likely to be an oversold relief bounce rather than the beginning of a sustained bullish trend.
If 568 holds, a short-term long scalp setup may develop, but only with strict risk management and a stop-loss around 566–567.
Price: 591.66 — BNB bounced sharply in a V-shape from the low of 568 to around 597. It is now pulling back and trying to stabilize.EMA(9) = 592.71 (price is below it) and EMA(24) = 590.61 (price is above it) — Price is trapped between the two EMAs, indicating that the market is looking for direction.RSI(6) = 43 — Buying momentum is slowing down, but the market is not oversold. RSI is in a neutral-to-weak zone.
Bigger Picture (Very Important):
Looking only at the 15-minute chart is not enough. On higher timeframes, BNB is in a strong downtrend.
BNB has dropped approximately 15% in 7 days, falling from around 700 to 590.This is not just a BNB problem — the entire crypto market is under pressure: Bitcoin is below 69,000, ETH is below 2,000, and approximately $1.9 billion in liquidations have occurred within 24 hours.Macroeconomic pressure: Higher-than-expected US inflation has increased fears that the Federal Reserve may raise interest rates in December. ETF outflows are also putting pressure on the market.The impact of Binance's approximately $6.4 billion hack on October 29 is still being felt. However, Binance has reportedly covered all affected assets through its SAFU fund and published its Proof of Reserves.Fear & Greed Index = 21 (Extreme Fear), and approximately 71% of accounts are holding long positions. Heavy long positioning increases the risk of further liquidations.
Pump or Dump? — Both Scenarios:
🟢 Bullish Scenario (Pump):
If the 588–590 support zone (EMA24) holds and BNB breaks above 595–597 with strong volume, the next targets could be:600–605610–613 (potential relief rally)The daily RSI was around 28 (oversold), so there is room for a bounce.However, the rally may not last unless BTC also stabilizes and starts recovering.
🔴 Bearish Scenario (Dump) — More Likely According to the Current Trend:
If the price drops below 588–590, BNB could retest:580 support568 (the previous chart low)If 568 also breaks, the next downside zone could be 550–558.Analysts consider $580 an important support level. Losing this level could lead to a deeper decline.
My Conclusion:
In the short term, BNB appears likely to move within the 568–600 range, but the overall trend remains bearish.
Buying the current bounce and assuming that a new pump has started would be risky.
Until BTC recovers and BNB successfully reclaims the 600+ level, this move is more likely to be an oversold relief bounce rather than the beginning of a sustained bullish trend.
If 568 holds, a short-term long scalp setup may develop, but only with strict risk management and a stop-loss around 566–567.
1
1
98
記事
翻訳参照
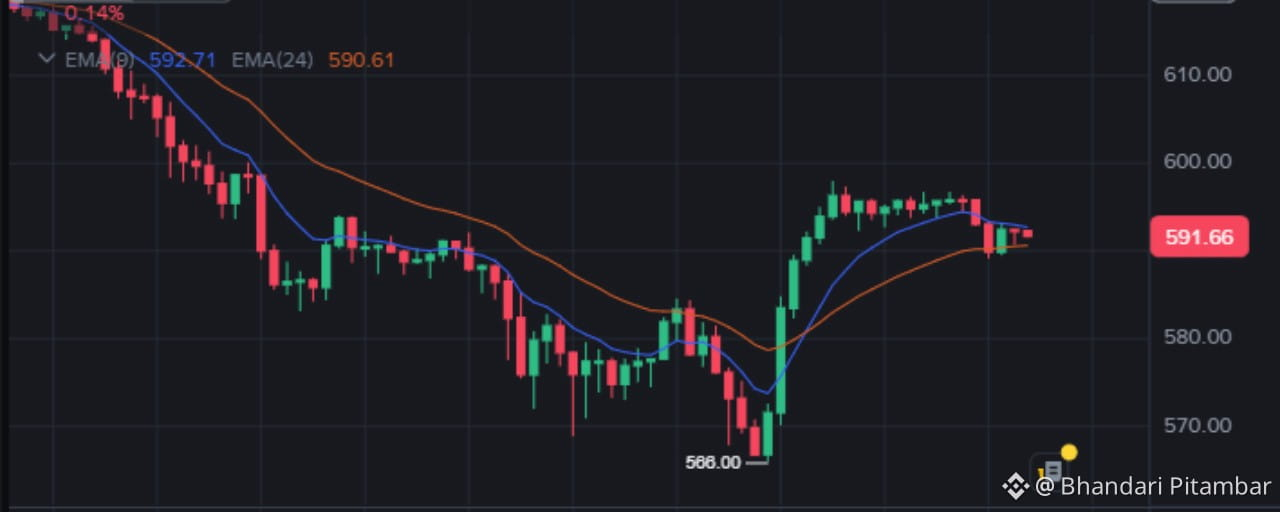
BNB Market Analysis (15m Chart + Overall Market)Tapai ko chart ma k dekhinchha:
Price: 591.66 — 568 ko bottom bata V-shape bounce bhaera ~597 samma pugyo, aba tyaha bata pullback bhaera consolidate gardai chhaEMA(9) = 592.71 (price yo bhanda tala) vs EMA(24) = 590.61 (price yo bhanda mathi) — dui EMA ko bich ma squeeze chha, matlab market le direction khojirako chhaRSI(6) = 43 — bounce ko momentum chiso hudai chha, tara oversold chhaina. Neutral-weak zone
Thulo picture (yo chahi important chha):
15m chart matra herera hunna — bigger timeframe ma BNB strong downtrend ma chha:
7 din ma ~15% le gireko chha, ~$700 bata $590 sammacoinmarketcap.comYo BNB-specific matra haina — purai market crash ma chha: Bitcoin $69K bhanda tala, ETH $2,000 bhanda tala, 24 ghanta ma $1.9 billion liquidationcoinstats.appMacro pressure: US inflation tato aayeko le December ma Fed le rate badhaune dar, ETF outflowscoinstats.appBinance ko Oct 29 ko ~$6.4B hack ko overhang ajhai chha, yadyapi Binance le SAFU fund bata sabai asset replace garisakyo ra Proof of Reserves publish garyocoinstats.appFear & Greed Index = 21 (Extreme Fear), ra ~71% accounts long chhan — crowded longs = ajhai liquidation ko riskcoinstats.app
Aba Pump ki Dump? — Duitai scenario:
🟢 Pump (bounce) scenario:
588–590 (EMA24) hold bhayo + 595–597 break with volume → 600–605, tyaspachi 610–613 samma relief rally possibleDaily RSI oversold (~28) thiyo, tesaile bounce ko space chhacoinstats.appTara BTC le stabilize nagare samma bounce tikdaina
🔴 Dump scenario (higher probability trend-wise):
588–590 break bhayo bhane → 580 retest, tyaspachi 568 (tapai ko chart ko low)568 pani gayo bhane → 550–558 zone samma jharna sakchha$580 lai analysts le key support bhaneka chhan — yo gayo bhane deeper test hunchhacoinstats.app
Mero bias:
Short-term ma 568–600 ko range, tara overall trend bearish chha. Ahile ko bounce lai "pump suru bho" bhanera kinnu risky chha — yo oversold relief bounce matra huna sakne probability badi chha jab samma BTC recover hudaina ra BNB le 600+ reclaim gardaina. 568 hold bhayo bhane chai short-term long scalp ko setup banna sakchha, tara tight stop-loss (566–567) bina hoina.
{future}(BTCUSDT)
{spot}(BNBUSDT)
BNB Market Analysis (15m Chart + Overall Market)
Tapai ko chart ma k dekhinchha:
Price: 591.66 — 568 ko bottom bata V-shape bounce bhaera ~597 samma pugyo, aba tyaha bata pullback bhaera consolidate gardai chhaEMA(9) = 592.71 (price yo bhanda tala) vs EMA(24) = 590.61 (price yo bhanda mathi) — dui EMA ko bich ma squeeze chha, matlab market le direction khojirako chhaRSI(6) = 43 — bounce ko momentum chiso hudai chha, tara oversold chhaina. Neutral-weak zone
Thulo picture (yo chahi important chha):
15m chart matra herera hunna — bigger timeframe ma BNB strong downtrend ma chha:
7 din ma ~15% le gireko chha, ~$700 bata $590 sammacoinmarketcap.comYo BNB-specific matra haina — purai market crash ma chha: Bitcoin $69K bhanda tala, ETH $2,000 bhanda tala, 24 ghanta ma $1.9 billion liquidationcoinstats.appMacro pressure: US inflation tato aayeko le December ma Fed le rate badhaune dar, ETF outflowscoinstats.appBinance ko Oct 29 ko ~$6.4B hack ko overhang ajhai chha, yadyapi Binance le SAFU fund bata sabai asset replace garisakyo ra Proof of Reserves publish garyocoinstats.appFear & Greed Index = 21 (Extreme Fear), ra ~71% accounts long chhan — crowded longs = ajhai liquidation ko riskcoinstats.app
Aba Pump ki Dump? — Duitai scenario:
🟢 Pump (bounce) scenario:
588–590 (EMA24) hold bhayo + 595–597 break with volume → 600–605, tyaspachi 610–613 samma relief rally possibleDaily RSI oversold (~28) thiyo, tesaile bounce ko space chhacoinstats.appTara BTC le stabilize nagare samma bounce tikdaina
🔴 Dump scenario (higher probability trend-wise):
588–590 break bhayo bhane → 580 retest, tyaspachi 568 (tapai ko chart ko low)568 pani gayo bhane → 550–558 zone samma jharna sakchha$580 lai analysts le key support bhaneka chhan — yo gayo bhane deeper test hunchhacoinstats.app
Mero bias:
Short-term ma 568–600 ko range, tara overall trend bearish chha. Ahile ko bounce lai "pump suru bho" bhanera kinnu risky chha — yo oversold relief bounce matra huna sakne probability badi chha jab samma BTC recover hudaina ra BNB le 600+ reclaim gardaina. 568 hold bhayo bhane chai short-term long scalp ko setup banna sakchha, tara tight stop-loss (566–567) bina hoina.
Price: 591.66 — 568 ko bottom bata V-shape bounce bhaera ~597 samma pugyo, aba tyaha bata pullback bhaera consolidate gardai chhaEMA(9) = 592.71 (price yo bhanda tala) vs EMA(24) = 590.61 (price yo bhanda mathi) — dui EMA ko bich ma squeeze chha, matlab market le direction khojirako chhaRSI(6) = 43 — bounce ko momentum chiso hudai chha, tara oversold chhaina. Neutral-weak zone
Thulo picture (yo chahi important chha):
15m chart matra herera hunna — bigger timeframe ma BNB strong downtrend ma chha:
7 din ma ~15% le gireko chha, ~$700 bata $590 sammacoinmarketcap.comYo BNB-specific matra haina — purai market crash ma chha: Bitcoin $69K bhanda tala, ETH $2,000 bhanda tala, 24 ghanta ma $1.9 billion liquidationcoinstats.appMacro pressure: US inflation tato aayeko le December ma Fed le rate badhaune dar, ETF outflowscoinstats.appBinance ko Oct 29 ko ~$6.4B hack ko overhang ajhai chha, yadyapi Binance le SAFU fund bata sabai asset replace garisakyo ra Proof of Reserves publish garyocoinstats.appFear & Greed Index = 21 (Extreme Fear), ra ~71% accounts long chhan — crowded longs = ajhai liquidation ko riskcoinstats.app
Aba Pump ki Dump? — Duitai scenario:
🟢 Pump (bounce) scenario:
588–590 (EMA24) hold bhayo + 595–597 break with volume → 600–605, tyaspachi 610–613 samma relief rally possibleDaily RSI oversold (~28) thiyo, tesaile bounce ko space chhacoinstats.appTara BTC le stabilize nagare samma bounce tikdaina
🔴 Dump scenario (higher probability trend-wise):
588–590 break bhayo bhane → 580 retest, tyaspachi 568 (tapai ko chart ko low)568 pani gayo bhane → 550–558 zone samma jharna sakchha$580 lai analysts le key support bhaneka chhan — yo gayo bhane deeper test hunchhacoinstats.app
Mero bias:
Short-term ma 568–600 ko range, tara overall trend bearish chha. Ahile ko bounce lai "pump suru bho" bhanera kinnu risky chha — yo oversold relief bounce matra huna sakne probability badi chha jab samma BTC recover hudaina ra BNB le 600+ reclaim gardaina. 568 hold bhayo bhane chai short-term long scalp ko setup banna sakchha, tara tight stop-loss (566–567) bina hoina.
1
1
66
翻訳参照
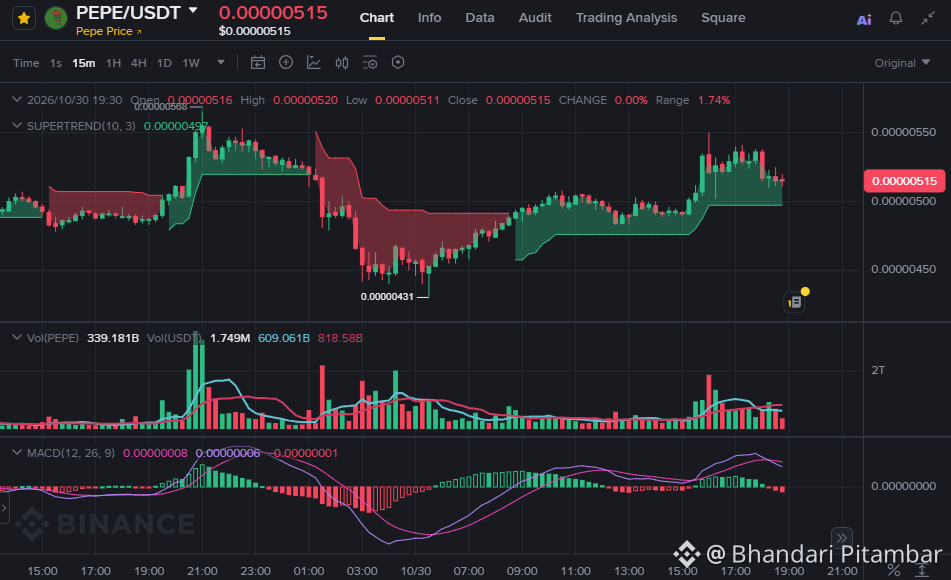
Looking at the PEPE/USDT chart right now the price is moving around 0.00000517 USDT. Last 24 hour price increased by about +6.38% and now there seems to be some correction till the 24 hour high price reached 0.00000568.
Now whether the market will rise or fall depends on technical indicators:
1. Bullish Signals:
The chart is currently seeing a support zone at 0.00000497 using the SUPERTREND (10, 3) indicator. As long as the price remains above this support level, the market is considered to be in the positive (bullish) zone and there is a possibility of going higher again.
2. Possibility of decrease or correction:
The price has recently reached a new low at (0.00000568), some time there may be a further support test in the market due to Profit Booking.
What should you do?
Now, if you are looking for money, then spend all your money at once.
If the price still bottoms out and settles in the support zone (around 0.00000500), the DCA (piece by piece par) risk becomes less.
(Note: This is not a financial advice. Since the crypto market is high risk, do your own research before taking the decision.)
{spot}(PEPEUSDT)
Looking at the PEPE/USDT chart right now the price is moving around 0.00000517 USDT. Last 24 hour price increased by about +6.38% and now there seems to be some correction till the 24 hour high price reached 0.00000568.
Now whether the market will rise or fall depends on technical indicators:
1. Bullish Signals:
The chart is currently seeing a support zone at 0.00000497 using the SUPERTREND (10, 3) indicator. As long as the price remains above this support level, the market is considered to be in the positive (bullish) zone and there is a possibility of going higher again.
2. Possibility of decrease or correction:
The price has recently reached a new low at (0.00000568), some time there may be a further support test in the market due to Profit Booking.
What should you do?
Now, if you are looking for money, then spend all your money at once.
If the price still bottoms out and settles in the support zone (around 0.00000500), the DCA (piece by piece par) risk becomes less.
(Note: This is not a financial advice. Since the crypto market is high risk, do your own research before taking the decision.)
Now whether the market will rise or fall depends on technical indicators:
1. Bullish Signals:
The chart is currently seeing a support zone at 0.00000497 using the SUPERTREND (10, 3) indicator. As long as the price remains above this support level, the market is considered to be in the positive (bullish) zone and there is a possibility of going higher again.
2. Possibility of decrease or correction:
The price has recently reached a new low at (0.00000568), some time there may be a further support test in the market due to Profit Booking.
What should you do?
Now, if you are looking for money, then spend all your money at once.
If the price still bottoms out and settles in the support zone (around 0.00000500), the DCA (piece by piece par) risk becomes less.
(Note: This is not a financial advice. Since the crypto market is high risk, do your own research before taking the decision.)
66
翻訳参照
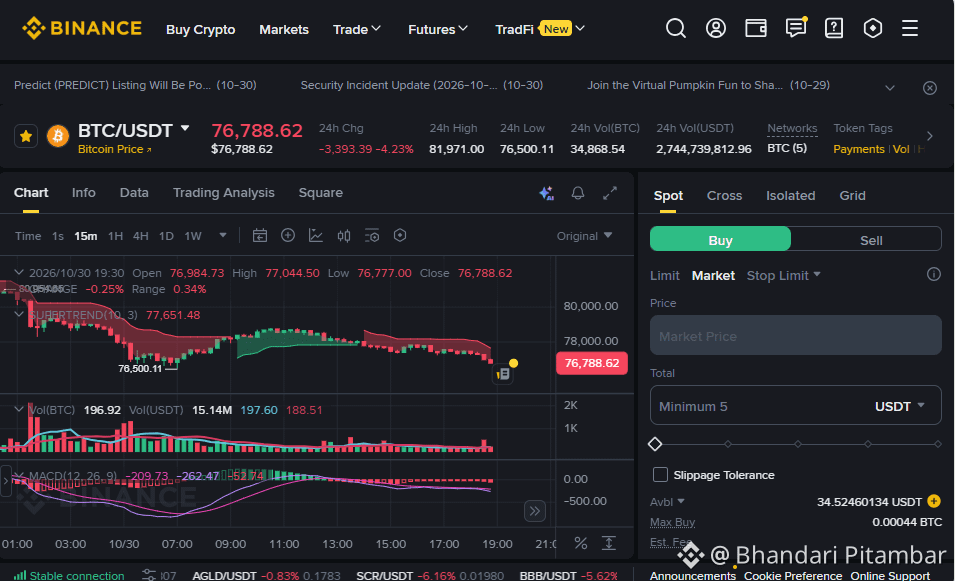
Current Chart State and Market Critical Herd Analysis of rare market decline or aging Yes Type F:
1. Pressure to decrease or correct the price (bearish pressure)
Recent chart: Bitcoin price is currently at $76,650 per trade.
Indicators: The Supertrend line on the 15-minute chart remains in the negative zone for the short-term stock price ($77,624). This indicates that in the short term, the pressure on short-term creditor-buyer sellers may remain high and the price may bottom out for some time or settle sideways (Uta Range).
2. How rare is the market to grow?
Support Level: 24-hour all-time low point (low) near $76,500. If the price takes important support, the price may bounce back.
Bholum: Halko Business Cash Body High ($2.74 Billion) Reko Chh, Jasle Thulo Dosima Kinbech Bharekhsho Sounch.
conclusion:
Short-term provisional reports indicate satellite growth. If the $76,500 support level remains intact then the market will remain stable, and at this point the bottom price will remain at the lowest level.
The crypto market is extremely volatile and any predictions regarding its risk appetite are necessary.
{spot}(BTCUSDT)
Current Chart State and Market Critical Herd Analysis of rare market decline or aging Yes Type F:
1. Pressure to decrease or correct the price (bearish pressure)
Recent chart: Bitcoin price is currently at $76,650 per trade.
Indicators: The Supertrend line on the 15-minute chart remains in the negative zone for the short-term stock price ($77,624). This indicates that in the short term, the pressure on short-term creditor-buyer sellers may remain high and the price may bottom out for some time or settle sideways (Uta Range).
2. How rare is the market to grow?
Support Level: 24-hour all-time low point (low) near $76,500. If the price takes important support, the price may bounce back.
Bholum: Halko Business Cash Body High ($2.74 Billion) Reko Chh, Jasle Thulo Dosima Kinbech Bharekhsho Sounch.
conclusion:
Short-term provisional reports indicate satellite growth. If the $76,500 support level remains intact then the market will remain stable, and at this point the bottom price will remain at the lowest level.
The crypto market is extremely volatile and any predictions regarding its risk appetite are necessary.
1. Pressure to decrease or correct the price (bearish pressure)
Recent chart: Bitcoin price is currently at $76,650 per trade.
Indicators: The Supertrend line on the 15-minute chart remains in the negative zone for the short-term stock price ($77,624). This indicates that in the short term, the pressure on short-term creditor-buyer sellers may remain high and the price may bottom out for some time or settle sideways (Uta Range).
2. How rare is the market to grow?
Support Level: 24-hour all-time low point (low) near $76,500. If the price takes important support, the price may bounce back.
Bholum: Halko Business Cash Body High ($2.74 Billion) Reko Chh, Jasle Thulo Dosima Kinbech Bharekhsho Sounch.
conclusion:
Short-term provisional reports indicate satellite growth. If the $76,500 support level remains intact then the market will remain stable, and at this point the bottom price will remain at the lowest level.
The crypto market is extremely volatile and any predictions regarding its risk appetite are necessary.
79
翻訳参照
you are the girl of the garden
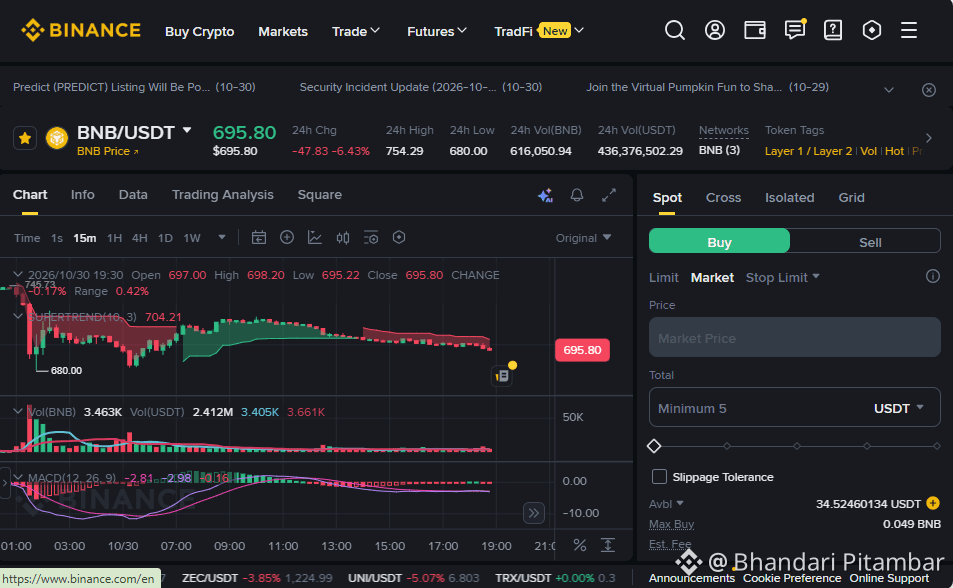
Looking at the current market situation and technical indicators, selling pressure and bearish trend are clearly visible in the market. Its main reasons are mentioned below:
Price Drop: BNB price 24 hours down 6.20% to 697.39 USDT (24 hours high price 754.29 USDT).
Supertrend: Current price is at 697.39 while Supertrend indicator is at 706.35. A price below this line indicates the continuation of a short-term downtrend.
MACD indicator: The MACD line is in the negative zone (-2.76 and -2.78), which shows that sellers are dominating the market and there is less possibility of a big upswing in the near future.
Impact on the overall market: Other major cryptocurrencies including Bitcoin (-3.69%) and Ethereum (-4.08%) are also trading down overnight.
conclusion:
Technically, the market is currently under pressure and may go down for some time in the short term or there may be fluctuations around this. To know when the market reverses, it has to cross the major resistance line.
Warning: Due to the highly volatile nature of the cryptocurrency market, you should only take decisions while investing or trading keeping your risk management in mind.
{spot}(BNBUSDT)
you are the girl of the garden
Looking at the current market situation and technical indicators, selling pressure and bearish trend are clearly visible in the market. Its main reasons are mentioned below:
Price Drop: BNB price 24 hours down 6.20% to 697.39 USDT (24 hours high price 754.29 USDT).
Supertrend: Current price is at 697.39 while Supertrend indicator is at 706.35. A price below this line indicates the continuation of a short-term downtrend.
MACD indicator: The MACD line is in the negative zone (-2.76 and -2.78), which shows that sellers are dominating the market and there is less possibility of a big upswing in the near future.
Impact on the overall market: Other major cryptocurrencies including Bitcoin (-3.69%) and Ethereum (-4.08%) are also trading down overnight.
conclusion:
Technically, the market is currently under pressure and may go down for some time in the short term or there may be fluctuations around this. To know when the market reverses, it has to cross the major resistance line.
Warning: Due to the highly volatile nature of the cryptocurrency market, you should only take decisions while investing or trading keeping your risk management in mind.
Looking at the current market situation and technical indicators, selling pressure and bearish trend are clearly visible in the market. Its main reasons are mentioned below:
Price Drop: BNB price 24 hours down 6.20% to 697.39 USDT (24 hours high price 754.29 USDT).
Supertrend: Current price is at 697.39 while Supertrend indicator is at 706.35. A price below this line indicates the continuation of a short-term downtrend.
MACD indicator: The MACD line is in the negative zone (-2.76 and -2.78), which shows that sellers are dominating the market and there is less possibility of a big upswing in the near future.
Impact on the overall market: Other major cryptocurrencies including Bitcoin (-3.69%) and Ethereum (-4.08%) are also trading down overnight.
conclusion:
Technically, the market is currently under pressure and may go down for some time in the short term or there may be fluctuations around this. To know when the market reverses, it has to cross the major resistance line.
Warning: Due to the highly volatile nature of the cryptocurrency market, you should only take decisions while investing or trading keeping your risk management in mind.
91
🎙️ 🎉2026年、熱狂的な強気相場の号砲が鳴り響く!相場はBSCチェーンに注目!!11月1日、マスク氏が火星犬Marvinの誕生日をお祝いします。このオンチェーン相場の波をぜひつかみましょう!
終了
02 時間 03 分 35 秒
2.5k
8
34

記事
ビットコイン市場今日: 上がるか下がるか?ビットコイン市場今日: 上がるか下がるか?
短い答え:
市場は今日はやや弱気から中立であり、明確な上昇トレンドはありません。
実際の価格コンテキスト:
ビットコインは約$66,000–$70,000のレンジで取引されており、最近$75,000以上の高値を維持できませんでした。
1. 市場構造: トレンドなし—停滞。
ビットコインは現在強くトレンドしていません。レンジにとどまっています:
サポート: $60,000–$66,000
レジスタンス: $72,000–$75,000
これが本当に意味すること:
これは決定ゾーンであり、強気のブレイクアウトフェーズではありません。
現実チェック:
ビットコイン市場今日: 上がるか下がるか?
ビットコイン市場今日: 上がるか下がるか?
短い答え:
市場は今日はやや弱気から中立であり、明確な上昇トレンドはありません。
実際の価格コンテキスト:
ビットコインは約$66,000–$70,000のレンジで取引されており、最近$75,000以上の高値を維持できませんでした。
1. 市場構造: トレンドなし—停滞。
ビットコインは現在強くトレンドしていません。レンジにとどまっています:
サポート: $60,000–$66,000
レジスタンス: $72,000–$75,000
これが本当に意味すること:
これは決定ゾーンであり、強気のブレイクアウトフェーズではありません。
現実チェック:
短い答え:
市場は今日はやや弱気から中立であり、明確な上昇トレンドはありません。
実際の価格コンテキスト:
ビットコインは約$66,000–$70,000のレンジで取引されており、最近$75,000以上の高値を維持できませんでした。
1. 市場構造: トレンドなし—停滞。
ビットコインは現在強くトレンドしていません。レンジにとどまっています:
サポート: $60,000–$66,000
レジスタンス: $72,000–$75,000
これが本当に意味すること:
これは決定ゾーンであり、強気のブレイクアウトフェーズではありません。
現実チェック:
2
1
2
270

記事
BNB市場今日: 上昇か下降か?1. 現在の事実(誇大広告ではない)
最新のデータに基づくと、BNBは今日わずかに下落または横ばいで取引されています。
価格範囲: ~$630–$645
24時間の変化: わずかにネガティブからフラット
市場行動: 低いモメンタム、統合
最近のデータは次のことを示しています:
24時間で約-0.6%から-2.8%のわずかな減少
日中の動きはタイトで、強いブレイクアウト方向がありません
コアインサイト:
現在はトレンド市場ではありません—待機段階にあります。
2. 市場構造: 実際に何が起こっているのか
A. トレンドレイヤー(短期)
価格は範囲内に留まっています(約$622 – $663)
BNB市場今日: 上昇か下降か?
1. 現在の事実(誇大広告ではない)
最新のデータに基づくと、BNBは今日わずかに下落または横ばいで取引されています。
価格範囲: ~$630–$645
24時間の変化: わずかにネガティブからフラット
市場行動: 低いモメンタム、統合
最近のデータは次のことを示しています:
24時間で約-0.6%から-2.8%のわずかな減少
日中の動きはタイトで、強いブレイクアウト方向がありません
コアインサイト:
現在はトレンド市場ではありません—待機段階にあります。
2. 市場構造: 実際に何が起こっているのか
A. トレンドレイヤー(短期)
価格は範囲内に留まっています(約$622 – $663)
最新のデータに基づくと、BNBは今日わずかに下落または横ばいで取引されています。
価格範囲: ~$630–$645
24時間の変化: わずかにネガティブからフラット
市場行動: 低いモメンタム、統合
最近のデータは次のことを示しています:
24時間で約-0.6%から-2.8%のわずかな減少
日中の動きはタイトで、強いブレイクアウト方向がありません
コアインサイト:
現在はトレンド市場ではありません—待機段階にあります。
2. 市場構造: 実際に何が起こっているのか
A. トレンドレイヤー(短期)
価格は範囲内に留まっています(約$622 – $663)
1
1
1
48

記事
今日はクリプトが静かに感じる…でも、それが危険な時期であることが多い。今日、暗号市場が明確に上がるか下がると思って目を覚ましたなら—まあ、そんなことは本当に起こらない。山の天気を見ているようなものだ。一瞬晴れていて、次の瞬間には霧が出る。
そして今日は?「静かに見えるけど... 何かが起こりそうな」日だ。
じゃあ... インジケーターは本当に何を言っているの?
さて、リアルトレーダーの視点で見てみよう—教科書的なやり方ではなく、チャートを見たときの直感のように。
1. RSI(相対力指数)
今、主要なコインのRSIは真ん中に漂っている。過熱感も売られ過ぎ感もない。
今日はクリプトが静かに感じる…でも、それが危険な時期であることが多い。
今日、暗号市場が明確に上がるか下がると思って目を覚ましたなら—まあ、そんなことは本当に起こらない。山の天気を見ているようなものだ。一瞬晴れていて、次の瞬間には霧が出る。
そして今日は?「静かに見えるけど... 何かが起こりそうな」日だ。
じゃあ... インジケーターは本当に何を言っているの?
さて、リアルトレーダーの視点で見てみよう—教科書的なやり方ではなく、チャートを見たときの直感のように。
1. RSI(相対力指数)
今、主要なコインのRSIは真ん中に漂っている。過熱感も売られ過ぎ感もない。
そして今日は?「静かに見えるけど... 何かが起こりそうな」日だ。
じゃあ... インジケーターは本当に何を言っているの?
さて、リアルトレーダーの視点で見てみよう—教科書的なやり方ではなく、チャートを見たときの直感のように。
1. RSI(相対力指数)
今、主要なコインのRSIは真ん中に漂っている。過熱感も売られ過ぎ感もない。
124

記事
NOMは本当に今日上がるのか?短い答え: 流動性、ナラティブ、タイミングによる—希望ではない。
さて、現実をしっかり分解して、あなたのBinance Squareの投稿が専門的なレベルで際立つようにしよう、ノイズではなく。
1. まず市場のコンテキスト(現実チェック)
NOMに手を出す前に、これを理解しておけ:
クリプトはランダムに動かない。レイヤーで動く:
レイヤー1: マクロフロー
ビットコインのドミナンス上昇 → アルトコイン(NOMのような)は苦戦
ビットコインがレンジ → アルトがローテーション(NOMのポンプにとって最良のケース)
ビットコインがダンプ → すべてが出血
レイヤー2: 流動性サイクル
NOMは本当に今日上がるのか?
短い答え: 流動性、ナラティブ、タイミングによる—希望ではない。
さて、現実をしっかり分解して、あなたのBinance Squareの投稿が専門的なレベルで際立つようにしよう、ノイズではなく。
1. まず市場のコンテキスト(現実チェック)
NOMに手を出す前に、これを理解しておけ:
クリプトはランダムに動かない。レイヤーで動く:
レイヤー1: マクロフロー
ビットコインのドミナンス上昇 → アルトコイン(NOMのような)は苦戦
ビットコインがレンジ → アルトがローテーション(NOMのポンプにとって最良のケース)
ビットコインがダンプ → すべてが出血
レイヤー2: 流動性サイクル
さて、現実をしっかり分解して、あなたのBinance Squareの投稿が専門的なレベルで際立つようにしよう、ノイズではなく。
1. まず市場のコンテキスト(現実チェック)
NOMに手を出す前に、これを理解しておけ:
クリプトはランダムに動かない。レイヤーで動く:
レイヤー1: マクロフロー
ビットコインのドミナンス上昇 → アルトコイン(NOMのような)は苦戦
ビットコインがレンジ → アルトがローテーション(NOMのポンプにとって最良のケース)
ビットコインがダンプ → すべてが出血
レイヤー2: 流動性サイクル
142

記事
今日のPAXG価格 – 深い市場現実分析ハイプを切り捨てて、期待に満ちた投資家ではなくトレーダーのように考えよう。
まず、PAXゴールド(PAXG)が実際に何であるかを理解しよう。これは典型的なクリプトではなく、実物の金をトークン化したものなんだ。つまり、
その価格は ≈ 実物の金の価格
アルトコインのようなハイプサイクルに左右されない
ミームではなくマクロ経済に基づいて動く
だから「PAXGは今日上がるのか?」と尋ねるのは、実際にはこう問うことなんだ:
「金は今日上がるのか?」
1. PAXGを動かすコアドライバー(今日のレベルでの思考)
A. USDの強さ(重要)
金とUSDは逆の関係にある。
今日のPAXG価格 – 深い市場現実分析
ハイプを切り捨てて、期待に満ちた投資家ではなくトレーダーのように考えよう。
まず、PAXゴールド(PAXG)が実際に何であるかを理解しよう。これは典型的なクリプトではなく、実物の金をトークン化したものなんだ。つまり、
その価格は ≈ 実物の金の価格
アルトコインのようなハイプサイクルに左右されない
ミームではなくマクロ経済に基づいて動く
だから「PAXGは今日上がるのか?」と尋ねるのは、実際にはこう問うことなんだ:
「金は今日上がるのか?」
1. PAXGを動かすコアドライバー(今日のレベルでの思考)
A. USDの強さ(重要)
金とUSDは逆の関係にある。
まず、PAXゴールド(PAXG)が実際に何であるかを理解しよう。これは典型的なクリプトではなく、実物の金をトークン化したものなんだ。つまり、
その価格は ≈ 実物の金の価格
アルトコインのようなハイプサイクルに左右されない
ミームではなくマクロ経済に基づいて動く
だから「PAXGは今日上がるのか?」と尋ねるのは、実際にはこう問うことなんだ:
「金は今日上がるのか?」
1. PAXGを動かすコアドライバー(今日のレベルでの思考)
A. USDの強さ(重要)
金とUSDは逆の関係にある。
97

記事
来るべき暗号通貨の交差点:Googleの警告とサトシの眠る富ここで何が起こっているのかをじっくりと考えましょう—これは単なる技術的なアップデートではありません。これは、暗号通貨にとっての哲学的、経済的、さらには心理的な転換点です。
Googleのような企業が暗号アルゴリズムのアップグレードを促し始めるとき、彼らは劇的になっているわけではありません。彼らは未来を見据えています—特に量子コンピュータの台頭と、今日の暗号システムを破る可能性についてです。
そしてそれは、暗号通貨における最大の未解決の質問の一つに私たちを導きます:
サトシ・ナカモトの手つかずのビットコインには何が起こるのでしょうか?
来るべき暗号通貨の交差点:Googleの警告とサトシの眠る富
ここで何が起こっているのかをじっくりと考えましょう—これは単なる技術的なアップデートではありません。これは、暗号通貨にとっての哲学的、経済的、さらには心理的な転換点です。
Googleのような企業が暗号アルゴリズムのアップグレードを促し始めるとき、彼らは劇的になっているわけではありません。彼らは未来を見据えています—特に量子コンピュータの台頭と、今日の暗号システムを破る可能性についてです。
そしてそれは、暗号通貨における最大の未解決の質問の一つに私たちを導きます:
サトシ・ナカモトの手つかずのビットコインには何が起こるのでしょうか?
Googleのような企業が暗号アルゴリズムのアップグレードを促し始めるとき、彼らは劇的になっているわけではありません。彼らは未来を見据えています—特に量子コンピュータの台頭と、今日の暗号システムを破る可能性についてです。
そしてそれは、暗号通貨における最大の未解決の質問の一つに私たちを導きます:
サトシ・ナカモトの手つかずのビットコインには何が起こるのでしょうか?
50

記事
KERNEL スマートマネー vs. リテール: 今日の価格を本当にコントロールしているのは誰か?正直に言おう。
ほとんどのトレーダーは、価格が「ニュース」や「コミュニティの盛り上がり」によって変わると思ってる。
これは安心するけど、間違ってる。
価格は流動性の操作によって変わる。
もしこれを理解していないなら、あなたはトレードしているのではなく、トレードされている。
1. キートゥルース(シンプルだけど強力)
市場には実際に存在する2つの力しかない:
1. スマートマネー
マーケットメーカー
クジラ
機関投資家
2. リテールトレーダー
あなた
バイナンススクエアユーザー
ソーシャルメディアのフォロワー
さて、ここからは不快な部分だ:
スマートマネーはリテールが損をする必要がある...そうしないと勝てない。
KERNEL スマートマネー vs. リテール: 今日の価格を本当にコントロールしているのは誰か?
正直に言おう。
ほとんどのトレーダーは、価格が「ニュース」や「コミュニティの盛り上がり」によって変わると思ってる。
これは安心するけど、間違ってる。
価格は流動性の操作によって変わる。
もしこれを理解していないなら、あなたはトレードしているのではなく、トレードされている。
1. キートゥルース(シンプルだけど強力)
市場には実際に存在する2つの力しかない:
1. スマートマネー
マーケットメーカー
クジラ
機関投資家
2. リテールトレーダー
あなた
バイナンススクエアユーザー
ソーシャルメディアのフォロワー
さて、ここからは不快な部分だ:
スマートマネーはリテールが損をする必要がある...そうしないと勝てない。
ほとんどのトレーダーは、価格が「ニュース」や「コミュニティの盛り上がり」によって変わると思ってる。
これは安心するけど、間違ってる。
価格は流動性の操作によって変わる。
もしこれを理解していないなら、あなたはトレードしているのではなく、トレードされている。
1. キートゥルース(シンプルだけど強力)
市場には実際に存在する2つの力しかない:
1. スマートマネー
マーケットメーカー
クジラ
機関投資家
2. リテールトレーダー
あなた
バイナンススクエアユーザー
ソーシャルメディアのフォロワー
さて、ここからは不快な部分だ:
スマートマネーはリテールが損をする必要がある...そうしないと勝てない。
149

記事
BNB市場分析 今日 — 深い戦略的分析BNBをカジュアルなトレーダーではなく、流動性、心理、マクロフローを理解する市場オペレーターのように分析しましょう。
1. 現在の市場構造(コアの理解)
BNBは単なるコインではなく、Binanceのエコシステムと密接に結びついています。
それはハイブリッド資産の行動を生み出します:
部分的なユーティリティトークン(手数料、ステーキング、ローンチパッド)
部分的な取引所株式の代理
部分的な投機資産
これは何を意味しますか?
BNBはビットコインやイーサリアムのような純粋な分散型資産のようには振る舞いません。
代わりに:
より制御されています
BNB市場分析 今日 — 深い戦略的分析
BNBをカジュアルなトレーダーではなく、流動性、心理、マクロフローを理解する市場オペレーターのように分析しましょう。
1. 現在の市場構造(コアの理解)
BNBは単なるコインではなく、Binanceのエコシステムと密接に結びついています。
それはハイブリッド資産の行動を生み出します:
部分的なユーティリティトークン(手数料、ステーキング、ローンチパッド)
部分的な取引所株式の代理
部分的な投機資産
これは何を意味しますか?
BNBはビットコインやイーサリアムのような純粋な分散型資産のようには振る舞いません。
代わりに:
より制御されています
1. 現在の市場構造(コアの理解)
BNBは単なるコインではなく、Binanceのエコシステムと密接に結びついています。
それはハイブリッド資産の行動を生み出します:
部分的なユーティリティトークン(手数料、ステーキング、ローンチパッド)
部分的な取引所株式の代理
部分的な投機資産
これは何を意味しますか?
BNBはビットコインやイーサリアムのような純粋な分散型資産のようには振る舞いません。
代わりに:
より制御されています
2
2
2
76
ログインして、さらにコンテンツを読む
厳選トピックで世界の暗号資産トレーダーの仲間入り
⚡️ 暗号資産に関する最新かつ有益な情報が見つかります。
💬 世界最大の暗号資産取引所から信頼されています。
👍 認証を受けたクリエイターから、有益なインサイトを得られます。
メール / 電話番号
トレンドトピック
A Packed Week of Earnings and Data Tests Markets
閲覧回数 27,313
210人が討論中
🚨🇺🇸 市場にとって重要な1週間がやってくる!
市場では12月のFRB利上げが織り込まれており、$BTC 来週は大きな値動きがあるかもしれません。
今後の予定はこちら:
• 月曜日:ウォーシュFRB議長が講演
• 火曜日:米小売売上高発表+$NVDA決算
• 水曜日:FOMC議事要旨
• 木曜日:新規失業保険申請件数+フィラデルフィア連銀製造業景気指数
• 金曜日:消費者信頼感+FRB高官の講演
重要な1週間が始まるなか、$BTC に注目が集まります。
#bitcoin
Mookie
·いいね:8件
·閲覧回数 4.6k
AnthropicIPOTestsInvestorAppetiteForAI
閲覧回数 27,912
535人が討論中
HuangReportedlyConsidersReturnToNvidia
閲覧回数 53,990
670人が討論中