
mrWH
15 投稿

mrWH
報告
ユーザーをブロック
10 フォロー
0 フォロワー
2 いいね
投稿
·
--
{spot}(BNBUSDT)
#BNB スマート分析 — BNBUSDT
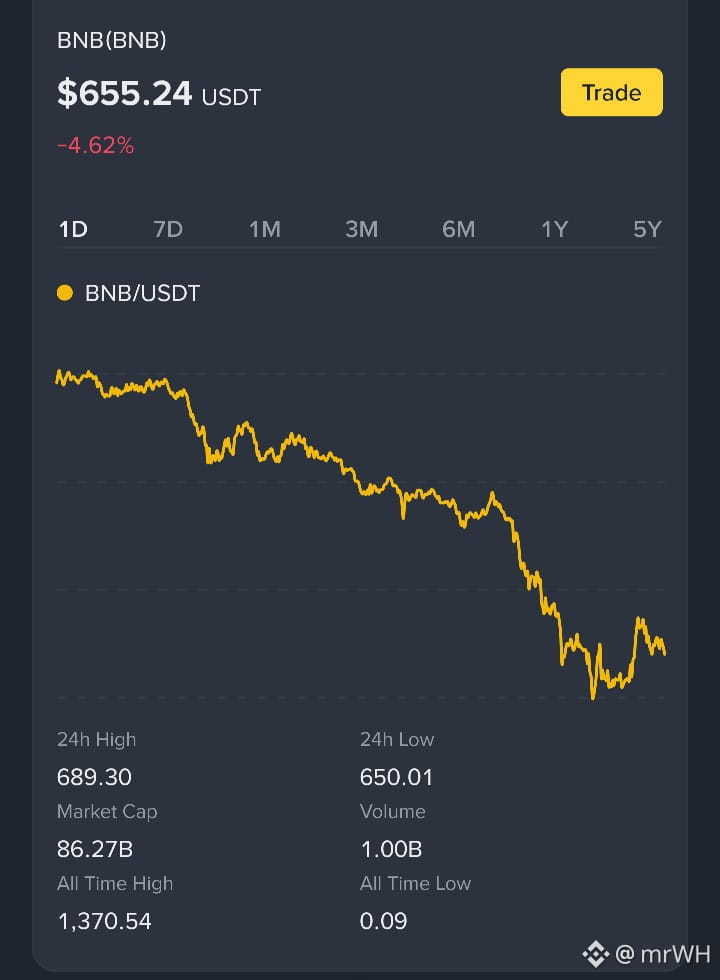
エグゼクティブ・ビュー:チャート構造は依然として弱いものの、直近の1日間の値動きはほぼ横ばいです。BNBは主要な日足移動平均線を下回って取引されており、モメンタム指標も軟調です。短期的な売られ過ぎの水準から、ボラティリティが高い状態が続く可能性がありますが、反転が確定したわけではありません。
チャートの概況
現物価格:$655.50
24時間の値幅:$650.01–$689.30
4時間足チャート:11月2日〜12日(UTC)の確定済みローソク足59本
このチャート期間中、BNBは$699.25から$654.57へ推移し、6.39%下落しました。
直近の確定済み4時間足ローソク足:始値 $664.40 / 高値 $665.24 / 安値 $650.01 / 終値 $654.57
現物データに基づく直近のパフォーマンス:1日で+0.15%、7日で−4.86%、30日で−11.89%。
テクニカル構造
1日足の指標を見ると:
BNBはEMA 7($689.06)、EMA 25($710.31)、EMA 99($706.30)を下回っています。
日足ボリンジャーバンドの下限は$662.93で、現在価格はこれを下回っています。
RSI 6は33.06、RSI 12は36.75で、モメンタムの弱さを示していますが、保存済み調査レポートにある極端な時間足の数値ほどではありません。
MACD DIFは−2.2973で、マイナスのモメンタムと一致しています。
チャート上で確認された水準は、$650.01付近の直近安値、$662.93の日足ボリンジャーバンド下限、そして$689〜$710付近のEMA群です。これらは過去の参考水準であり、売買指示ではありません。
資金フローと調査の背景
直近の4時間足の大口注文資金フローブロックでは、1,402.49 BNBの純流入が示されています。
保存済みの調査レポートは、それより前の別のスナップショットについて記述しており、現物の累計流出額は2,500万ドル超、最後の4時間では大口注文による売りが1,150万ドル超でした。スナップショットと時期が異なるため、これらを一つの資金フローシグナルとしてまとめるべきではありません。
同レポートでは、時間足RSI 6が5.39、時間足RSI 12が14.55と記録されており、そのレポート時点では短期的な売られ過ぎがはるかに極端だったことを示しています。新しい日足の数値は、それほど極端ではありません。
Binance Squareコミュニティ投票
限られたSquareの投票結果は次のとおりです:
弱気:379票中218票、57.5%
強気:379票中161票、42.5%
これは変動する限定的なコミュニティサンプルであり、市場全体のセンチメントを測定したものでも、代表性のある調査でもありません。
#BNB スマート分析 — BNBUSDT
エグゼクティブ・ビュー:チャート構造は依然として弱いものの、直近の1日間の値動きはほぼ横ばいです。BNBは主要な日足移動平均線を下回って取引されており、モメンタム指標も軟調です。短期的な売られ過ぎの水準から、ボラティリティが高い状態が続く可能性がありますが、反転が確定したわけではありません。
チャートの概況
現物価格:$655.50
24時間の値幅:$650.01–$689.30
4時間足チャート:11月2日〜12日(UTC)の確定済みローソク足59本
このチャート期間中、BNBは$699.25から$654.57へ推移し、6.39%下落しました。
直近の確定済み4時間足ローソク足:始値 $664.40 / 高値 $665.24 / 安値 $650.01 / 終値 $654.57
現物データに基づく直近のパフォーマンス:1日で+0.15%、7日で−4.86%、30日で−11.89%。
テクニカル構造
1日足の指標を見ると:
BNBはEMA 7($689.06)、EMA 25($710.31)、EMA 99($706.30)を下回っています。
日足ボリンジャーバンドの下限は$662.93で、現在価格はこれを下回っています。
RSI 6は33.06、RSI 12は36.75で、モメンタムの弱さを示していますが、保存済み調査レポートにある極端な時間足の数値ほどではありません。
MACD DIFは−2.2973で、マイナスのモメンタムと一致しています。
チャート上で確認された水準は、$650.01付近の直近安値、$662.93の日足ボリンジャーバンド下限、そして$689〜$710付近のEMA群です。これらは過去の参考水準であり、売買指示ではありません。
資金フローと調査の背景
直近の4時間足の大口注文資金フローブロックでは、1,402.49 BNBの純流入が示されています。
保存済みの調査レポートは、それより前の別のスナップショットについて記述しており、現物の累計流出額は2,500万ドル超、最後の4時間では大口注文による売りが1,150万ドル超でした。スナップショットと時期が異なるため、これらを一つの資金フローシグナルとしてまとめるべきではありません。
同レポートでは、時間足RSI 6が5.39、時間足RSI 12が14.55と記録されており、そのレポート時点では短期的な売られ過ぎがはるかに極端だったことを示しています。新しい日足の数値は、それほど極端ではありません。
Binance Squareコミュニティ投票
限られたSquareの投票結果は次のとおりです:
弱気:379票中218票、57.5%
強気:379票中161票、42.5%
これは変動する限定的なコミュニティサンプルであり、市場全体のセンチメントを測定したものでも、代表性のある調査でもありません。
エグゼクティブ・ビュー:チャート構造は依然として弱いものの、直近の1日間の値動きはほぼ横ばいです。BNBは主要な日足移動平均線を下回って取引されており、モメンタム指標も軟調です。短期的な売られ過ぎの水準から、ボラティリティが高い状態が続く可能性がありますが、反転が確定したわけではありません。
チャートの概況
現物価格:$655.50
24時間の値幅:$650.01–$689.30
4時間足チャート:11月2日〜12日(UTC)の確定済みローソク足59本
このチャート期間中、BNBは$699.25から$654.57へ推移し、6.39%下落しました。
直近の確定済み4時間足ローソク足:始値 $664.40 / 高値 $665.24 / 安値 $650.01 / 終値 $654.57
現物データに基づく直近のパフォーマンス:1日で+0.15%、7日で−4.86%、30日で−11.89%。
テクニカル構造
1日足の指標を見ると:
BNBはEMA 7($689.06)、EMA 25($710.31)、EMA 99($706.30)を下回っています。
日足ボリンジャーバンドの下限は$662.93で、現在価格はこれを下回っています。
RSI 6は33.06、RSI 12は36.75で、モメンタムの弱さを示していますが、保存済み調査レポートにある極端な時間足の数値ほどではありません。
MACD DIFは−2.2973で、マイナスのモメンタムと一致しています。
チャート上で確認された水準は、$650.01付近の直近安値、$662.93の日足ボリンジャーバンド下限、そして$689〜$710付近のEMA群です。これらは過去の参考水準であり、売買指示ではありません。
資金フローと調査の背景
直近の4時間足の大口注文資金フローブロックでは、1,402.49 BNBの純流入が示されています。
保存済みの調査レポートは、それより前の別のスナップショットについて記述しており、現物の累計流出額は2,500万ドル超、最後の4時間では大口注文による売りが1,150万ドル超でした。スナップショットと時期が異なるため、これらを一つの資金フローシグナルとしてまとめるべきではありません。
同レポートでは、時間足RSI 6が5.39、時間足RSI 12が14.55と記録されており、そのレポート時点では短期的な売られ過ぎがはるかに極端だったことを示しています。新しい日足の数値は、それほど極端ではありません。
Binance Squareコミュニティ投票
限られたSquareの投票結果は次のとおりです:
弱気:379票中218票、57.5%
強気:379票中161票、42.5%
これは変動する限定的なコミュニティサンプルであり、市場全体のセンチメントを測定したものでも、代表性のある調査でもありません。
59
·
--
翻訳参照
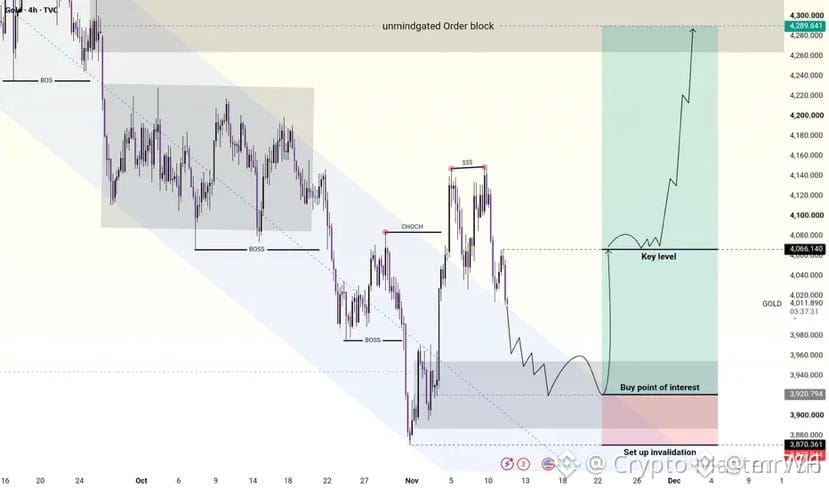
$XAU – Bullish Recovery Ahead? 3,000 Pips in Focus‼️
Attention Traders! Gold is showing bearish pressure near $4,012, with a potential buying opportunity around the $3,920–$3,950 support zone.
If buyers defend this area and reclaim $4,066, Gold could recover toward $4,200–$4,290. A break below $3,870 would weaken the bullish outlook.
What do you think, Fam? Is Gold preparing for a major comeback???
{future}(XAUUSDT)
$XAU – Bullish Recovery Ahead? 3,000 Pips in Focus‼️
Attention Traders! Gold is showing bearish pressure near $4,012, with a potential buying opportunity around the $3,920–$3,950 support zone.
If buyers defend this area and reclaim $4,066, Gold could recover toward $4,200–$4,290. A break below $3,870 would weaken the bullish outlook.
What do you think, Fam? Is Gold preparing for a major comeback???
Attention Traders! Gold is showing bearish pressure near $4,012, with a potential buying opportunity around the $3,920–$3,950 support zone.
If buyers defend this area and reclaim $4,066, Gold could recover toward $4,200–$4,290. A break below $3,870 would weaken the bullish outlook.
What do you think, Fam? Is Gold preparing for a major comeback???
28
·
--
翻訳参照
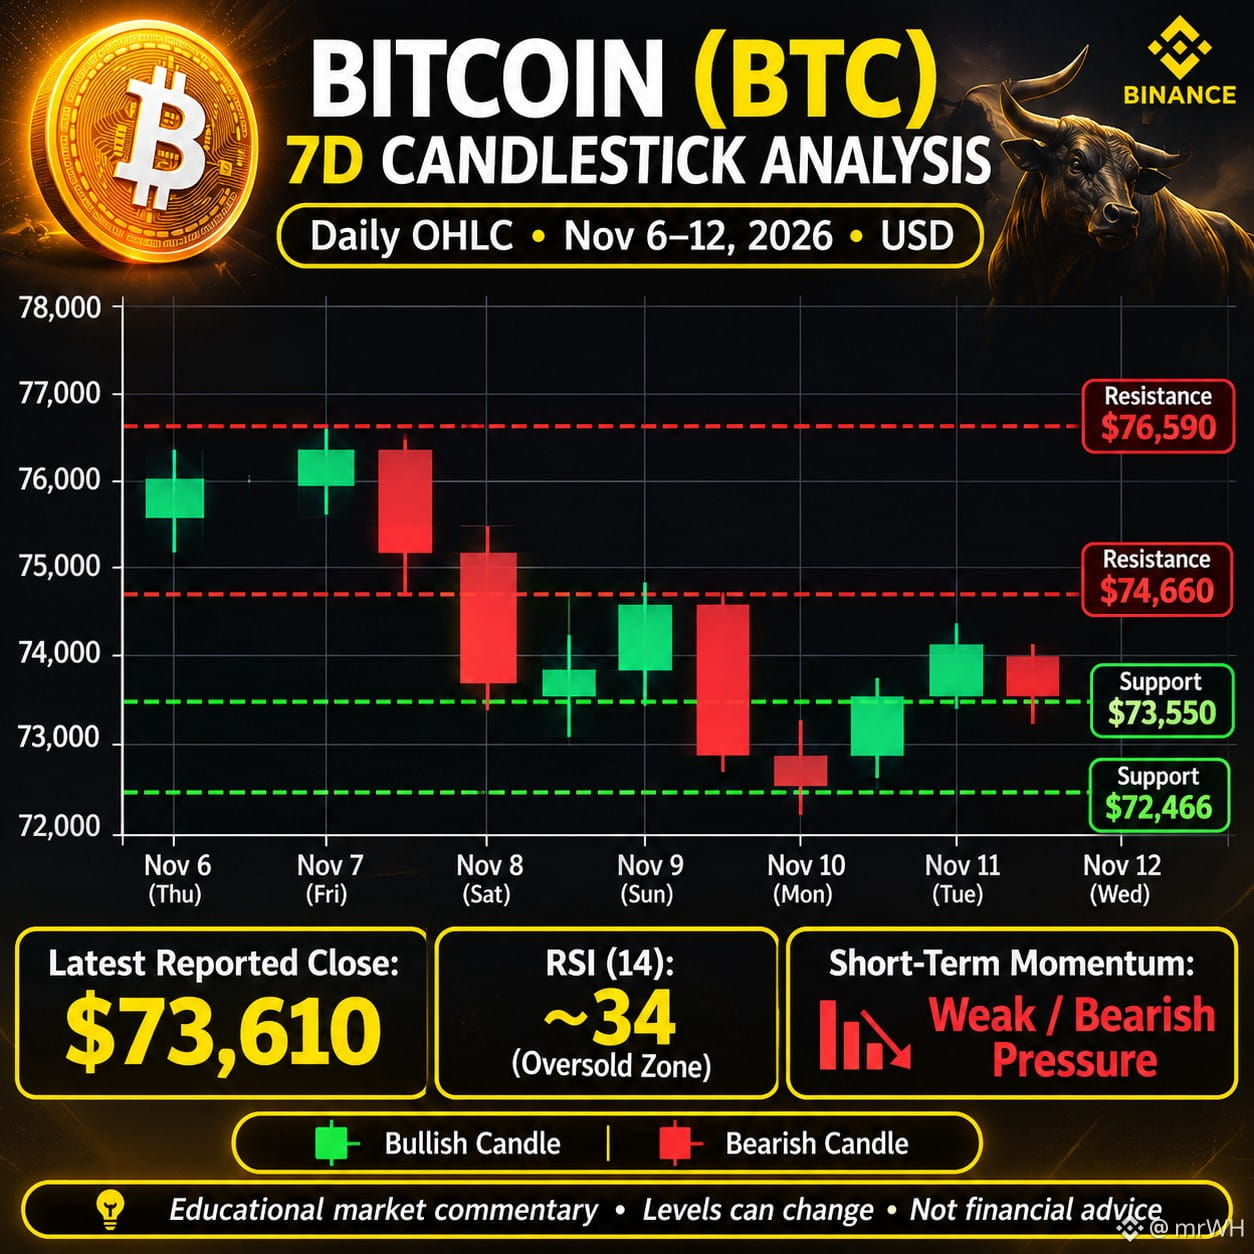
$BTC is facing selling pressure around $73,600. The short-term trend remains weak, with price trading below most major daily moving averages. RSI near 34 suggests weak momentum, although a short-term rebound remains possible.
Key technical levels
Support 1: $73,550
Support 2: $72,466
Resistance 1: $74,660
Resistance 2: $76,590
A sustained move above $74,660 could improve the short-term outlook, while a break below $73,550 could increase downside pressure.
#BTC #AnthropicRejectsIPODelayValuationinQuestion
{spot}(BTCUSDT)
$BTC is facing selling pressure around $73,600. The short-term trend remains weak, with price trading below most major daily moving averages. RSI near 34 suggests weak momentum, although a short-term rebound remains possible.
Key technical levels
Support 1: $73,550
Support 2: $72,466
Resistance 1: $74,660
Resistance 2: $76,590
A sustained move above $74,660 could improve the short-term outlook, while a break below $73,550 could increase downside pressure.
#BTC #AnthropicRejectsIPODelayValuationinQuestion
Key technical levels
Support 1: $73,550
Support 2: $72,466
Resistance 1: $74,660
Resistance 2: $76,590
A sustained move above $74,660 could improve the short-term outlook, while a break below $73,550 could increase downside pressure.
#BTC #AnthropicRejectsIPODelayValuationinQuestion
44
·
--
翻訳参照
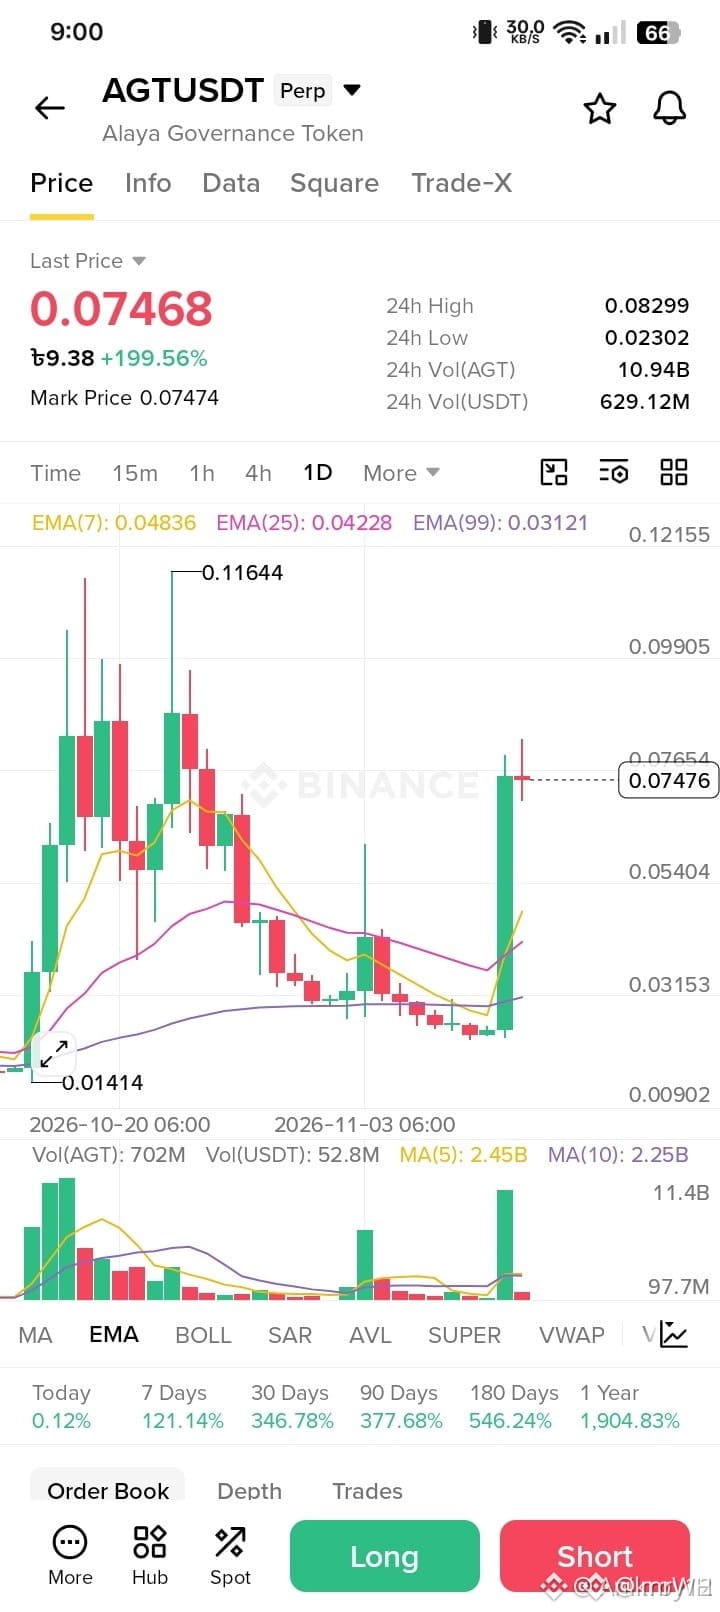
🚨 $AGT — DON'T IGNORE THE MARKET SIGNAL! 📉⚠️
What is happening with $AGT ? 👀
A sudden pump doesn't always mean a strong recovery. Sometimes the market moves up fast, then surprises everyone with a sharp correction! ☠️
Is this a real bullish move, or just a temporary pump before another drop? 🤔
Stay alert, protect your profits, and never make decisions based on hype alone.
💬 What's your opinion on $AGT ?
Are you BULLISH or BEARISH?
@IJ @JJ__ @_BH @hd @I_G
Let's discuss! 🔥
#AGT #CryptoMarket #trading #BinanceSquareFamily #AnthropicRejectsIPODelayValuationinQuestion
{spot}(TRXUSDT)
{future}(AGTUSDT)
{spot}(PEPEUSDT)
🚨 $AGT — DON'T IGNORE THE MARKET SIGNAL! 📉⚠️
What is happening with $AGT ? 👀
A sudden pump doesn't always mean a strong recovery. Sometimes the market moves up fast, then surprises everyone with a sharp correction! ☠️
Is this a real bullish move, or just a temporary pump before another drop? 🤔
Stay alert, protect your profits, and never make decisions based on hype alone.
💬 What's your opinion on $AGT ?
Are you BULLISH or BEARISH?
@IJ @JJ__ @_BH @hd @I_G
Let's discuss! 🔥
#AGT #CryptoMarket #trading #BinanceSquareFamily #AnthropicRejectsIPODelayValuationinQuestion
What is happening with $AGT ? 👀
A sudden pump doesn't always mean a strong recovery. Sometimes the market moves up fast, then surprises everyone with a sharp correction! ☠️
Is this a real bullish move, or just a temporary pump before another drop? 🤔
Stay alert, protect your profits, and never make decisions based on hype alone.
💬 What's your opinion on $AGT ?
Are you BULLISH or BEARISH?
@IJ @JJ__ @_BH @hd @I_G
Let's discuss! 🔥
#AGT #CryptoMarket #trading #BinanceSquareFamily #AnthropicRejectsIPODelayValuationinQuestion

53
·
--
翻訳参照
CPI at 0.4% Broke Bitcoin’s $73,000 Floor. What Happens if the Fed Goes Bigger? X
{spot}(BTCUSDT)
CPI at 0.4% Broke Bitcoin’s $73,000 Floor. What Happens if the Fed Goes Bigger? X
70
·
--
翻訳参照
Everyone is talking about Anthropic's IPO right now, but honestly, 1$ Trillion+ valuation in this market feels insane to me 🤯
Tech stocks just got battered this week and Nasdaq took a heavy hit, yet Anthropic is aiming for a record-breaking debut on Nasdaq.
On one side, revenue growth is massive. On the other side, data-center infrastructure costs are eating up margins fast and regulators are watching closely.
I'm torn on this one—does this turn out like the SpaceX listing momentum, or do we see a massive reality check on day one?
What’s your play here, long term hold or quick short? Drop your thoughts below 👇 $ANTHROPIC | $SPCX
{future}(ANTHROPICUSDT)
{future}(SPCXUSDT)
#AnthropicIPO进展
Everyone is talking about Anthropic's IPO right now, but honestly, 1$ Trillion+ valuation in this market feels insane to me 🤯
Tech stocks just got battered this week and Nasdaq took a heavy hit, yet Anthropic is aiming for a record-breaking debut on Nasdaq.
On one side, revenue growth is massive. On the other side, data-center infrastructure costs are eating up margins fast and regulators are watching closely.
I'm torn on this one—does this turn out like the SpaceX listing momentum, or do we see a massive reality check on day one?
What’s your play here, long term hold or quick short? Drop your thoughts below 👇 $ANTHROPIC | $SPCX
#AnthropicIPO进展
Tech stocks just got battered this week and Nasdaq took a heavy hit, yet Anthropic is aiming for a record-breaking debut on Nasdaq.
On one side, revenue growth is massive. On the other side, data-center infrastructure costs are eating up margins fast and regulators are watching closely.
I'm torn on this one—does this turn out like the SpaceX listing momentum, or do we see a massive reality check on day one?
What’s your play here, long term hold or quick short? Drop your thoughts below 👇 $ANTHROPIC | $SPCX
#AnthropicIPO进展

25
·
--
今回も明日の朝までに$SOLが再び$75まで下がるか見てみましょう。どう思いますか?
{spot}(SOLUSDT)
今回も明日の朝までに$SOLが再び$75まで下がるか見てみましょう。どう思いますか?
1
1
201
·
--
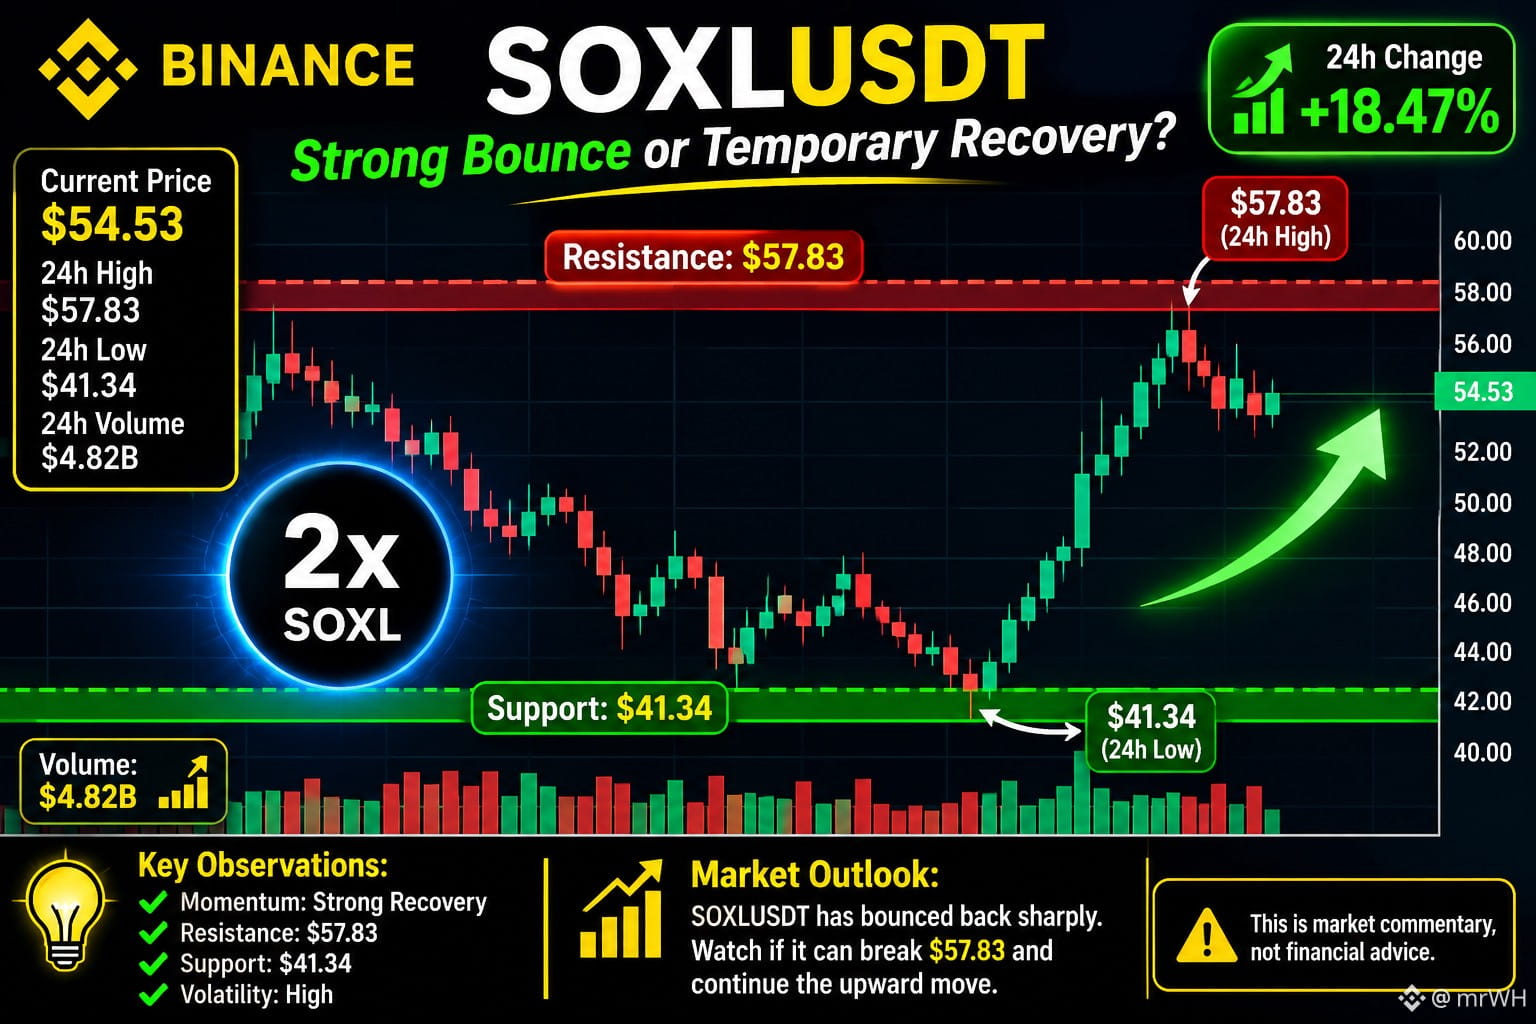
🚀 SOXLUSDT – 強い反発か、一時的な回復か?
SOXLUSDTは急速に回復しており、24時間で約18.47%上昇しています。しかし、最近のボラティリティと売り圧力を踏まえると、次の価格変動が重要です。
📊 市場分析 – 2026年11月10日
現在価格: $54.53
24時間高値: $57.83
24時間安値: $41.34
24時間変動率: +18.47%
24時間取引高: $4.82B
主なポイント:
モメンタム: 強い回復
レジスタンス: $57.83
サポート: $41.34
ボラティリティ: 高い
{future}(SOXLUSDT)
🚀 SOXLUSDT – 強い反発か、一時的な回復か?
SOXLUSDTは急速に回復しており、24時間で約18.47%上昇しています。しかし、最近のボラティリティと売り圧力を踏まえると、次の価格変動が重要です。
📊 市場分析 – 2026年11月10日
現在価格: $54.53
24時間高値: $57.83
24時間安値: $41.34
24時間変動率: +18.47%
24時間取引高: $4.82B
主なポイント:
モメンタム: 強い回復
レジスタンス: $57.83
サポート: $41.34
ボラティリティ: 高い
SOXLUSDTは急速に回復しており、24時間で約18.47%上昇しています。しかし、最近のボラティリティと売り圧力を踏まえると、次の価格変動が重要です。
📊 市場分析 – 2026年11月10日
現在価格: $54.53
24時間高値: $57.83
24時間安値: $41.34
24時間変動率: +18.47%
24時間取引高: $4.82B
主なポイント:
モメンタム: 強い回復
レジスタンス: $57.83
サポート: $41.34
ボラティリティ: 高い
362
·
--
翻訳参照
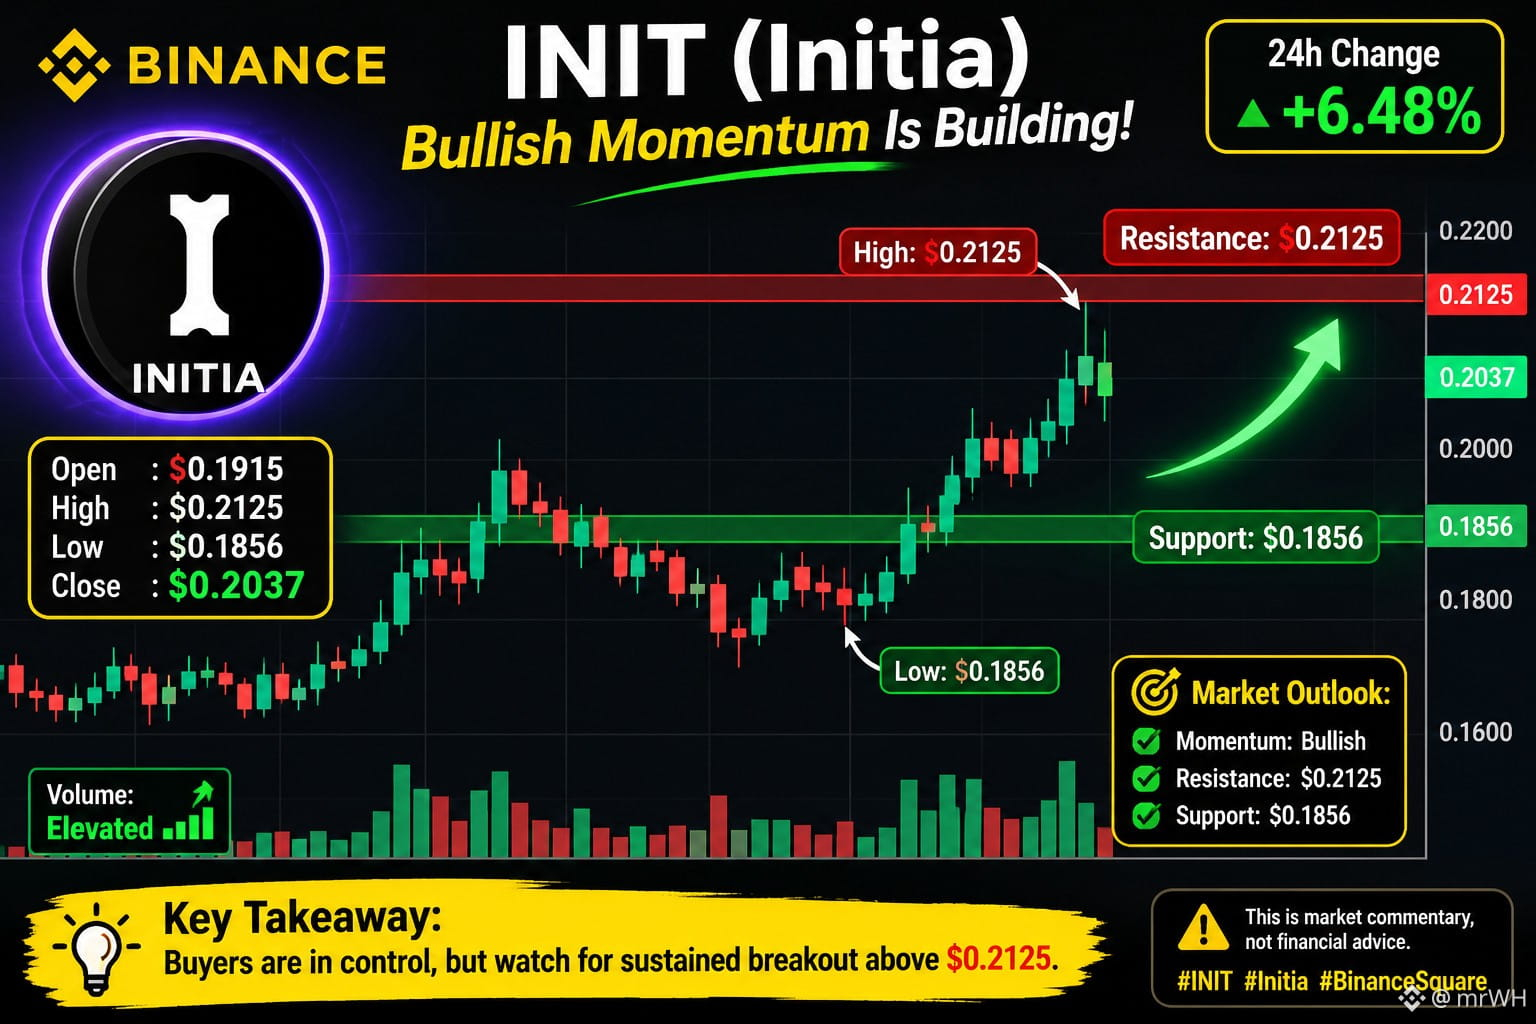
🚀 INIT (Initia) – Bullish Momentum Is Building!
INIT is showing strong bullish momentum, with increased trading activity and a sharp price recovery.
📊 Daily Candlestick Analysis (Nov 10)
Open: $0.1915
High: $0.2125
Low: $0.1856
Close: $0.2037
Daily Change: +6.48%
Market Outlook:
Momentum: Bullish
Resistance: $0.2125
Support: $0.1856
Volume: Elevated
{spot}(INITUSDT)
🚀 INIT (Initia) – Bullish Momentum Is Building!
INIT is showing strong bullish momentum, with increased trading activity and a sharp price recovery.
📊 Daily Candlestick Analysis (Nov 10)
Open: $0.1915
High: $0.2125
Low: $0.1856
Close: $0.2037
Daily Change: +6.48%
Market Outlook:
Momentum: Bullish
Resistance: $0.2125
Support: $0.1856
Volume: Elevated
INIT is showing strong bullish momentum, with increased trading activity and a sharp price recovery.
📊 Daily Candlestick Analysis (Nov 10)
Open: $0.1915
High: $0.2125
Low: $0.1856
Close: $0.2037
Daily Change: +6.48%
Market Outlook:
Momentum: Bullish
Resistance: $0.2125
Support: $0.1856
Volume: Elevated
166
ログインして、さらにコンテンツを読む
厳選トピックで世界の暗号資産トレーダーの仲間入り
⚡️ 暗号資産に関する最新かつ有益な情報が見つかります。
💬 世界最大の暗号資産取引所から信頼されています。
👍 認証を受けたクリエイターから、有益なインサイトを得られます。
メール / 電話番号