
Junior Bl4ck B3lt
11 投稿

Junior Bl4ck B3lt
報告
ユーザーをブロック
高頻度トレーダー
3.2か月
3 フォロー
0 フォロワー
0 いいね
投稿

バイナンスでのETH/USDT取引スクリーンショットを理解する
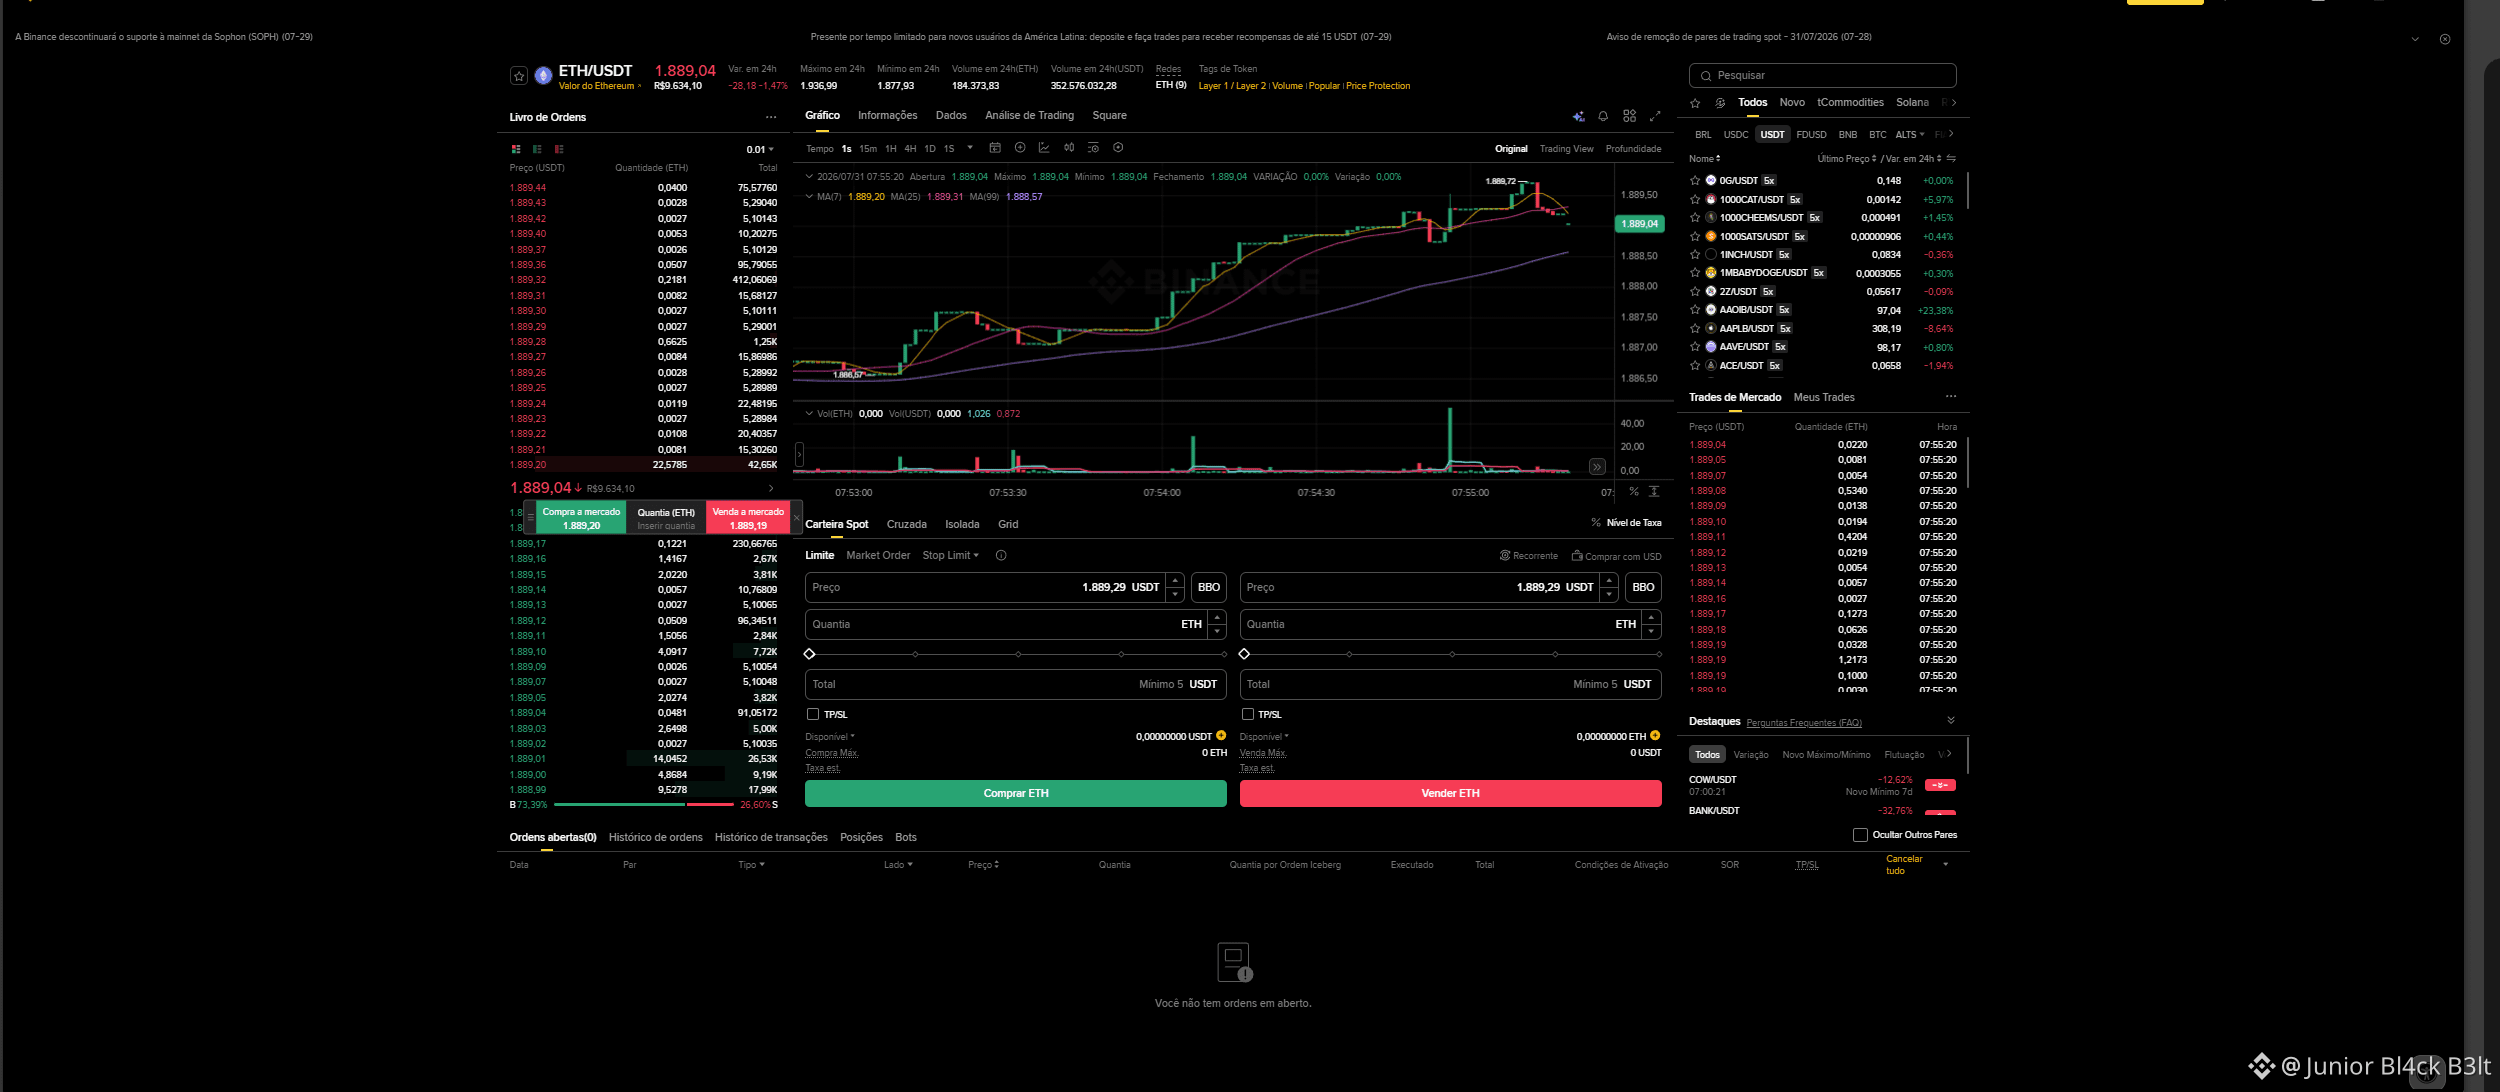
このスクリーンショットは、ETH/USDTペアのバイナンス現物取引インターフェースを示しており、撮影された時点でイーサリアムの取引価格が約1,889 USDTになっています。画面には、価格チャート、板(オーダーブック)、直近の取引、売買パネルなど、重要なリアルタイムの市場データが集約されています。
中央には、短い時間間隔でのETH/USDTの直近の価格変動を表示するローソク足チャートがあります。ローソク足は上昇の動きの後に、わずかな押し戻しを示しています。チャート上には移動平均線も表示されており、トレーダーが市場の方向性の可能性、サポートエリア、レジスタンス水準を見極めるのに役立ちます。
左側では、オーダーブックが赤の売り注文と緑の買い注文に分かれています。この部分では、その時点で市場で利用可能な価格と数量が示されています。買い手と売り手がどこに集中しているかを理解するのに役立ちます。
画面下部中央には、注文の価格、数量、合計金額をユーザーが入力できる取引フォームがあります。スクリーンショットでは「ETHを買う」「ETHを売る」のボタンが分かれており、ユーザーが現物ウォレットの取引エリアにいることが分かり、このペアに対して直接注文を出せます。
右側には、他の市場ペアの一覧や直近の取引も表示されています。この列により、ユーザーはさまざまな資産間での価格変動を比較し、ETH/USDTの最新の取引状況を追跡できます。
まとめると、このスクリーンショットは、ユーザーがイーサリアムの価格をリアルタイムで監視し、チャート、出来高、オーダーブック、直近の市場動向に基づいて売買の判断を行える、典型的なプロ向け取引画面を表しています。
バイナンスでのETH/USDT取引スクリーンショットを理解する
このスクリーンショットは、ETH/USDTペアのバイナンス現物取引インターフェースを示しており、撮影された時点でイーサリアムの取引価格が約1,889 USDTになっています。画面には、価格チャート、板(オーダーブック)、直近の取引、売買パネルなど、重要なリアルタイムの市場データが集約されています。
中央には、短い時間間隔でのETH/USDTの直近の価格変動を表示するローソク足チャートがあります。ローソク足は上昇の動きの後に、わずかな押し戻しを示しています。チャート上には移動平均線も表示されており、トレーダーが市場の方向性の可能性、サポートエリア、レジスタンス水準を見極めるのに役立ちます。
左側では、オーダーブックが赤の売り注文と緑の買い注文に分かれています。この部分では、その時点で市場で利用可能な価格と数量が示されています。買い手と売り手がどこに集中しているかを理解するのに役立ちます。
画面下部中央には、注文の価格、数量、合計金額をユーザーが入力できる取引フォームがあります。スクリーンショットでは「ETHを買う」「ETHを売る」のボタンが分かれており、ユーザーが現物ウォレットの取引エリアにいることが分かり、このペアに対して直接注文を出せます。
右側には、他の市場ペアの一覧や直近の取引も表示されています。この列により、ユーザーはさまざまな資産間での価格変動を比較し、ETH/USDTの最新の取引状況を追跡できます。
まとめると、このスクリーンショットは、ユーザーがイーサリアムの価格をリアルタイムで監視し、チャート、出来高、オーダーブック、直近の市場動向に基づいて売買の判断を行える、典型的なプロ向け取引画面を表しています。
このスクリーンショットは、ETH/USDTペアのバイナンス現物取引インターフェースを示しており、撮影された時点でイーサリアムの取引価格が約1,889 USDTになっています。画面には、価格チャート、板(オーダーブック)、直近の取引、売買パネルなど、重要なリアルタイムの市場データが集約されています。
中央には、短い時間間隔でのETH/USDTの直近の価格変動を表示するローソク足チャートがあります。ローソク足は上昇の動きの後に、わずかな押し戻しを示しています。チャート上には移動平均線も表示されており、トレーダーが市場の方向性の可能性、サポートエリア、レジスタンス水準を見極めるのに役立ちます。
左側では、オーダーブックが赤の売り注文と緑の買い注文に分かれています。この部分では、その時点で市場で利用可能な価格と数量が示されています。買い手と売り手がどこに集中しているかを理解するのに役立ちます。
画面下部中央には、注文の価格、数量、合計金額をユーザーが入力できる取引フォームがあります。スクリーンショットでは「ETHを買う」「ETHを売る」のボタンが分かれており、ユーザーが現物ウォレットの取引エリアにいることが分かり、このペアに対して直接注文を出せます。
右側には、他の市場ペアの一覧や直近の取引も表示されています。この列により、ユーザーはさまざまな資産間での価格変動を比較し、ETH/USDTの最新の取引状況を追跡できます。
まとめると、このスクリーンショットは、ユーザーがイーサリアムの価格をリアルタイムで監視し、チャート、出来高、オーダーブック、直近の市場動向に基づいて売買の判断を行える、典型的なプロ向け取引画面を表しています。
69
#saudioiltankersreroutearoundafrica
概要
この投稿では、紅海の不安定さによりサウジの原油タンカーが従来の航路を避け、アフリカ周りで航行せざるを得なくなっていると述べています。これにより移動時間が増え、海運コストが上昇し、原油・天然ガス、そして世界のサプライチェーンにより大きな変動が生じる可能性があります。
新しい記事
紅海の緊張が原油ルートとエネルギー市場に圧力
紅海での不安定な状況は、世界の海上輸送ルートに引き続き影響を与えています。同地域のリスクが高いままであるため、一部のサウジの原油タンカーは従来の通行経路を回避し、アフリカ周りの長いルートを選んでいます。
この転換は、これまで比較的短時間で済んでいた旅を、より長く、そして大幅に高コストな航海に変える可能性があります。追加コストには燃料、保険、運賃、そして物流の遅延などが含まれる場合があります。場合によっては、タンカーの迂回(ルート変更)によって、航海ごとに数百万ドル規模の追加費用が発生し得ます。
エネルギー市場にとって、この状況は注視する価値があります。より長い航路は輸送効率を低下させ、特定の地域で供給が引き締まる可能性があり、CLやBZ、NATGASといった原油・天然ガス関連の資産におけるボラティリティ(変動率)を高める恐れがあります。
影響は商品市場にとどまらないかもしれません。世界のサプライチェーンは安定した海上ルートに依存しており、長期化する混乱はコストを押し上げ、納品を遅らせ、インフレ期待への圧力につながる可能性があります。
トレーダーや投資家にとって重要なのは、地政学的な動向、運賃コスト、原油在庫、そして主要なエネルギー輸出国の対応を監視することです。この環境では、市場は新たな脅威、攻撃、あるいは外交上の進展といった出来事に対して素早く反応し得ます。
これは金融アドバイスではありません。地政学的リスクと、それがエネルギー市場に与え得る影響についての情報提供を目的とした分析です。
#saudioiltankersreroutearoundafrica
概要
この投稿では、紅海の不安定さによりサウジの原油タンカーが従来の航路を避け、アフリカ周りで航行せざるを得なくなっていると述べています。これにより移動時間が増え、海運コストが上昇し、原油・天然ガス、そして世界のサプライチェーンにより大きな変動が生じる可能性があります。
新しい記事
紅海の緊張が原油ルートとエネルギー市場に圧力
紅海での不安定な状況は、世界の海上輸送ルートに引き続き影響を与えています。同地域のリスクが高いままであるため、一部のサウジの原油タンカーは従来の通行経路を回避し、アフリカ周りの長いルートを選んでいます。
この転換は、これまで比較的短時間で済んでいた旅を、より長く、そして大幅に高コストな航海に変える可能性があります。追加コストには燃料、保険、運賃、そして物流の遅延などが含まれる場合があります。場合によっては、タンカーの迂回(ルート変更)によって、航海ごとに数百万ドル規模の追加費用が発生し得ます。
エネルギー市場にとって、この状況は注視する価値があります。より長い航路は輸送効率を低下させ、特定の地域で供給が引き締まる可能性があり、CLやBZ、NATGASといった原油・天然ガス関連の資産におけるボラティリティ(変動率)を高める恐れがあります。
影響は商品市場にとどまらないかもしれません。世界のサプライチェーンは安定した海上ルートに依存しており、長期化する混乱はコストを押し上げ、納品を遅らせ、インフレ期待への圧力につながる可能性があります。
トレーダーや投資家にとって重要なのは、地政学的な動向、運賃コスト、原油在庫、そして主要なエネルギー輸出国の対応を監視することです。この環境では、市場は新たな脅威、攻撃、あるいは外交上の進展といった出来事に対して素早く反応し得ます。
これは金融アドバイスではありません。地政学的リスクと、それがエネルギー市場に与え得る影響についての情報提供を目的とした分析です。
概要
この投稿では、紅海の不安定さによりサウジの原油タンカーが従来の航路を避け、アフリカ周りで航行せざるを得なくなっていると述べています。これにより移動時間が増え、海運コストが上昇し、原油・天然ガス、そして世界のサプライチェーンにより大きな変動が生じる可能性があります。
新しい記事
紅海の緊張が原油ルートとエネルギー市場に圧力
紅海での不安定な状況は、世界の海上輸送ルートに引き続き影響を与えています。同地域のリスクが高いままであるため、一部のサウジの原油タンカーは従来の通行経路を回避し、アフリカ周りの長いルートを選んでいます。
この転換は、これまで比較的短時間で済んでいた旅を、より長く、そして大幅に高コストな航海に変える可能性があります。追加コストには燃料、保険、運賃、そして物流の遅延などが含まれる場合があります。場合によっては、タンカーの迂回(ルート変更)によって、航海ごとに数百万ドル規模の追加費用が発生し得ます。
エネルギー市場にとって、この状況は注視する価値があります。より長い航路は輸送効率を低下させ、特定の地域で供給が引き締まる可能性があり、CLやBZ、NATGASといった原油・天然ガス関連の資産におけるボラティリティ(変動率)を高める恐れがあります。
影響は商品市場にとどまらないかもしれません。世界のサプライチェーンは安定した海上ルートに依存しており、長期化する混乱はコストを押し上げ、納品を遅らせ、インフレ期待への圧力につながる可能性があります。
トレーダーや投資家にとって重要なのは、地政学的な動向、運賃コスト、原油在庫、そして主要なエネルギー輸出国の対応を監視することです。この環境では、市場は新たな脅威、攻撃、あるいは外交上の進展といった出来事に対して素早く反応し得ます。
これは金融アドバイスではありません。地政学的リスクと、それがエネルギー市場に与え得る影響についての情報提供を目的とした分析です。

237

ログインして、さらにコンテンツを読む
厳選トピックで世界の暗号資産トレーダーの仲間入り
⚡️ 暗号資産に関する最新かつ有益な情報が見つかります。
💬 世界最大の暗号資産取引所から信頼されています。
👍 認証を受けたクリエイターから、有益なインサイトを得られます。
メール / 電話番号
トレンドトピック
FedRateWatch
閲覧回数 1.6M
7,081人が討論中
トレンドハッシュタグキャンペーンで「シェア&ウィン」交通(トラフィック)報酬を獲得しよう
✨トピック:FOMC 9月、「次のFRBの一手」は?
👉参加方法:
ハッシュタグ #FedRateWatch を付けて短い投稿または記事を投稿してください
以下の観点に基づいてコンテンツを作成してください:
- 8月のコアCPIは前月比0.3%上昇し、今週の25bp利上げの確率は現在約90%です。今週、利上げはあると思いますか?それは一時的なものですか、それともより長い利上げサイクルの始まりでしょうか?
- 利上げが実施された場合、BTC、テック株、ゴールドはどのように動きますか?強気(ブル)か弱気(ベア)か?
- 次の取引はどう計画していますか?取引共有ウィジェットを使って、BTC、株、またはゴールドの取引/保有を共有してください。
⏰キャンペーン期間:
- 2026-09-15 11:00 - 2026-09-17 3:00 UTC
🎁報酬:
- 上記のガイドラインを満たし、かつ100語を超える適格な投稿は審査され、抽選で500〜3,000ビューのランダムなトラフィック増加が付与される場合があります。投稿が選ばれた場合、フィードの事務局から通知が届きます。
- 記事がBinance Square Officialで特集されるチャンス
投稿のアイデアが必要ですか?トピックページ #FedRateWatch へアクセスするか、 Square Guide on How to Post for Better Reach をご覧ください。
Binance Square Official
·いいね:667件
·閲覧回数 1.7M
ZcashRises6%
閲覧回数 78,910
796人が討論中
XRPSinks10%
閲覧回数 50,339
527人が討論中