
Analysisking444r
44 投稿

Analysisking444r
報告
ユーザーをブロック
2 フォロー
1 フォロワー
1 いいね
投稿
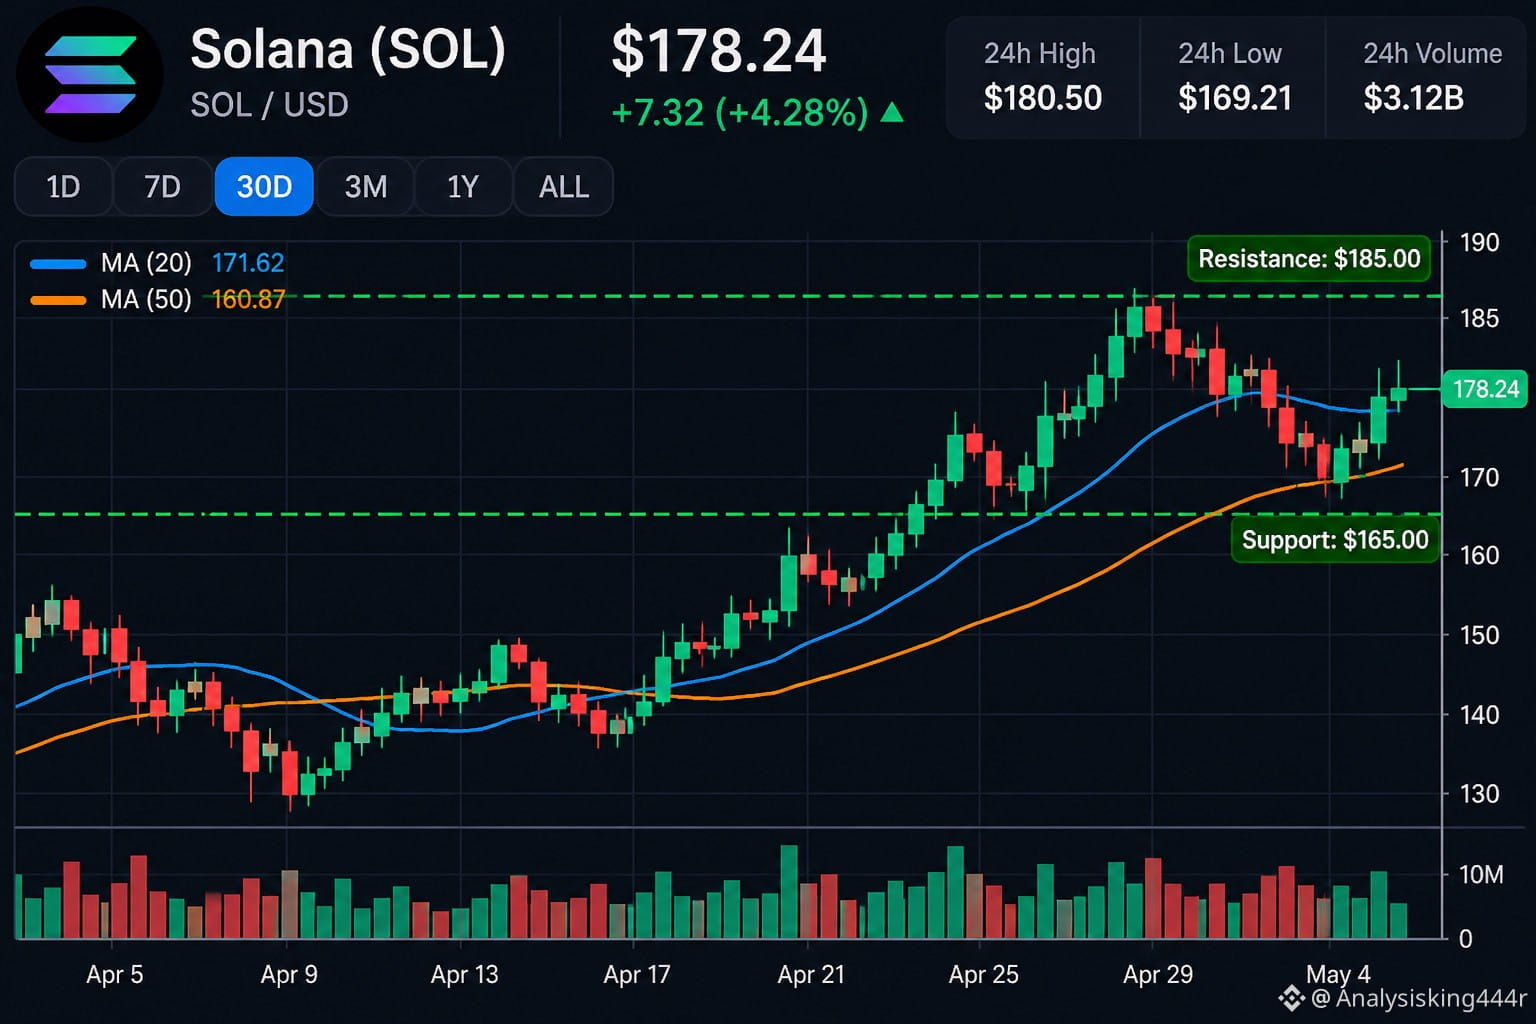
$SOL 市場見通し 📊
サポート:$90
レジスタンス:$100
$100を上抜け:上昇する可能性があります。
$90を下抜け:さらに下落するリスクがあります。
私の戦略:買う前に確認を待ちます。価格を追いかけて買わないようにしましょう。
#SolanaUSTD
$SOL 市場見通し 📊
サポート:$90
レジスタンス:$100
$100を上抜け:上昇する可能性があります。
$90を下抜け:さらに下落するリスクがあります。
私の戦略:買う前に確認を待ちます。価格を追いかけて買わないようにしましょう。
#SolanaUSTD
サポート:$90
レジスタンス:$100
$100を上抜け:上昇する可能性があります。
$90を下抜け:さらに下落するリスクがあります。
私の戦略:買う前に確認を待ちます。価格を追いかけて買わないようにしましょう。
#SolanaUSTD
68
$XRP /$USDT
{spot}(XRPUSDT)
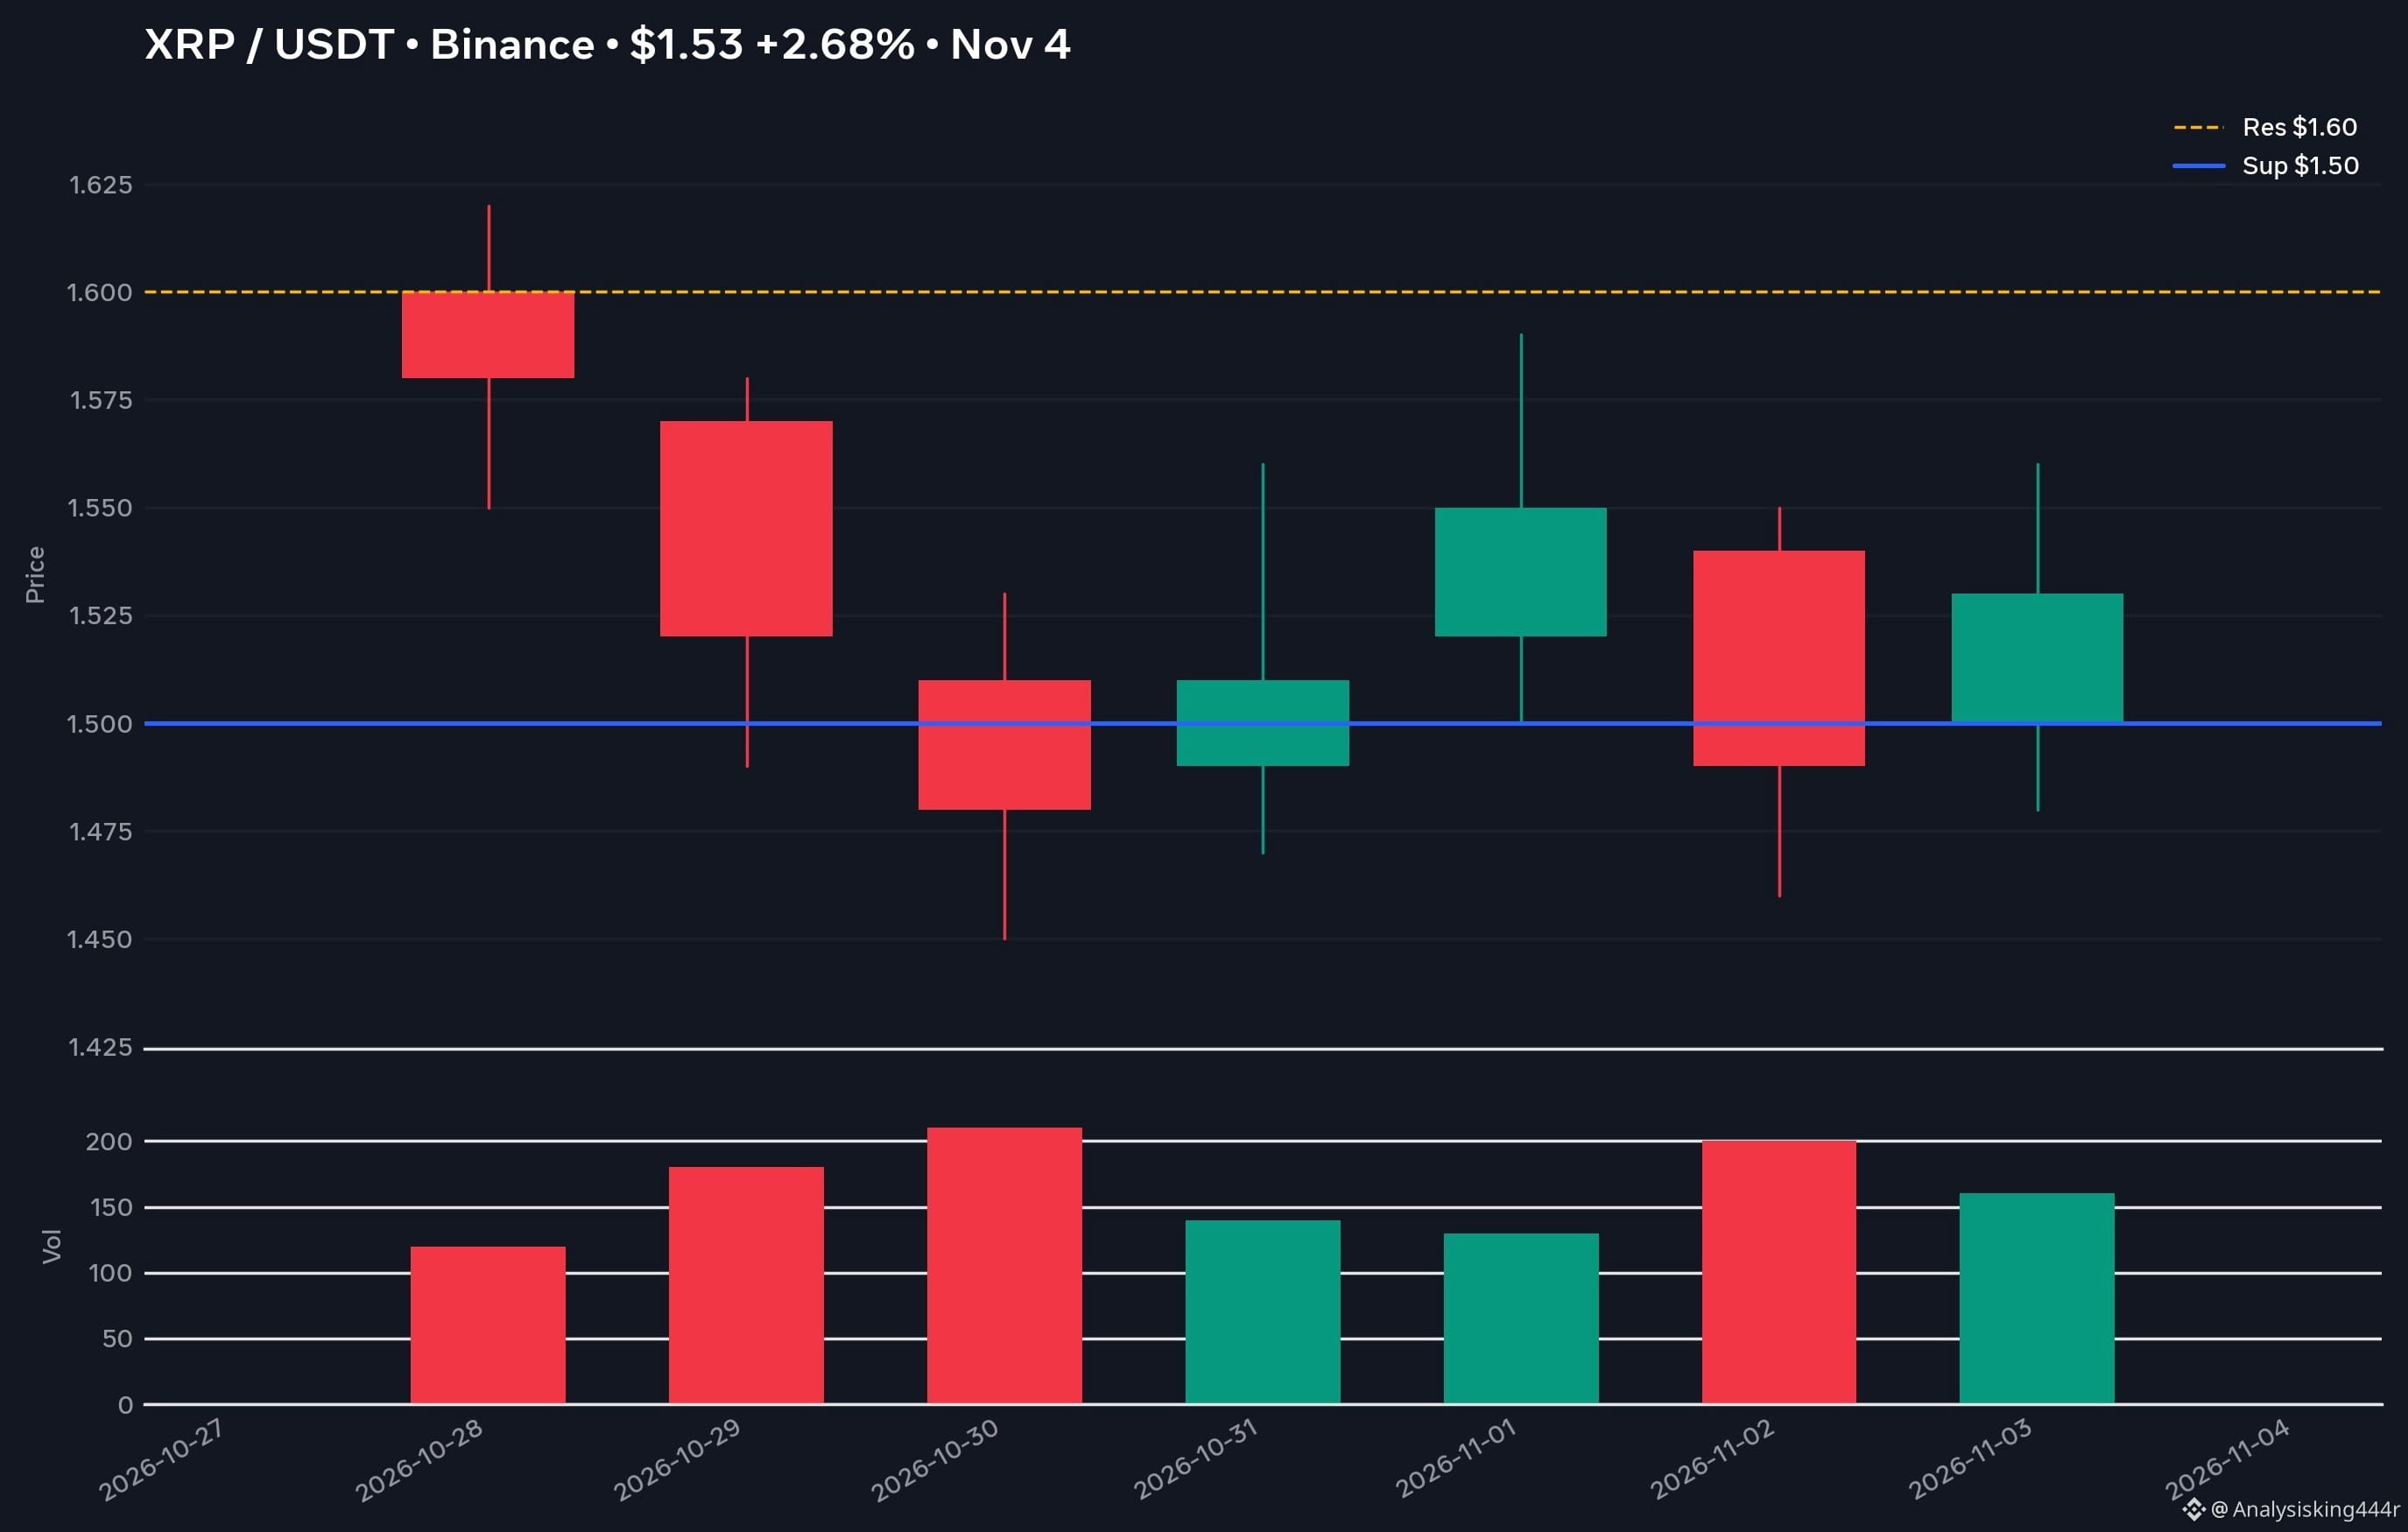
日足 - $1.53 (+2.68%) | Binance | 2026年11月4日
📊 テクニカル:
- サポート $1.50【極めて重要】 - 7日間で5回テストされ、維持 = 強気
- レジスタンス $1.60 - $1.60を上抜け = 目標 $1.75
- $1.50を割った場合、次のサポートは $1.45
ローソク足:
10月28日 $1.60で反落 -> 10月30日の安値 $1.45まで下落
10月31日〜11月1日 回復を示す陽線、$1.50から$1.59へ
11月2日 陰線で$1.46まで再テスト、下ヒゲ = 買い手が$1.50を守った
11月3日 陽線で$1.53で引け、サポートを上回る = 強気
出来高:
10月30日に陰線の出来高が高水準 = 投げ売り
11月1日〜3日に陽線の出来高が増加 = 買い手が戻ってきている
私の見解:
XRPは$1.50を維持 = 安全。$1.50を上回れば$1.60へ
$1.50を下回る = 危険、$1.45まで下落
現在$1.53 = 保有、売らない。$1.60の上抜けを待つ。
#XRP #Ripple #暗号資産
$XRP /$USDT
日足 - $1.53 (+2.68%) | Binance | 2026年11月4日
📊 テクニカル:
- サポート $1.50【極めて重要】 - 7日間で5回テストされ、維持 = 強気
- レジスタンス $1.60 - $1.60を上抜け = 目標 $1.75
- $1.50を割った場合、次のサポートは $1.45
ローソク足:
10月28日 $1.60で反落 -> 10月30日の安値 $1.45まで下落
10月31日〜11月1日 回復を示す陽線、$1.50から$1.59へ
11月2日 陰線で$1.46まで再テスト、下ヒゲ = 買い手が$1.50を守った
11月3日 陽線で$1.53で引け、サポートを上回る = 強気
出来高:
10月30日に陰線の出来高が高水準 = 投げ売り
11月1日〜3日に陽線の出来高が増加 = 買い手が戻ってきている
私の見解:
XRPは$1.50を維持 = 安全。$1.50を上回れば$1.60へ
$1.50を下回る = 危険、$1.45まで下落
現在$1.53 = 保有、売らない。$1.60の上抜けを待つ。
#XRP #Ripple #暗号資産
日足 - $1.53 (+2.68%) | Binance | 2026年11月4日
📊 テクニカル:
- サポート $1.50【極めて重要】 - 7日間で5回テストされ、維持 = 強気
- レジスタンス $1.60 - $1.60を上抜け = 目標 $1.75
- $1.50を割った場合、次のサポートは $1.45
ローソク足:
10月28日 $1.60で反落 -> 10月30日の安値 $1.45まで下落
10月31日〜11月1日 回復を示す陽線、$1.50から$1.59へ
11月2日 陰線で$1.46まで再テスト、下ヒゲ = 買い手が$1.50を守った
11月3日 陽線で$1.53で引け、サポートを上回る = 強気
出来高:
10月30日に陰線の出来高が高水準 = 投げ売り
11月1日〜3日に陽線の出来高が増加 = 買い手が戻ってきている
私の見解:
XRPは$1.50を維持 = 安全。$1.50を上回れば$1.60へ
$1.50を下回る = 危険、$1.45まで下落
現在$1.53 = 保有、売らない。$1.60の上抜けを待つ。
#XRP #Ripple #暗号資産
262
$BTC /$USDC 本日の市場アップデート
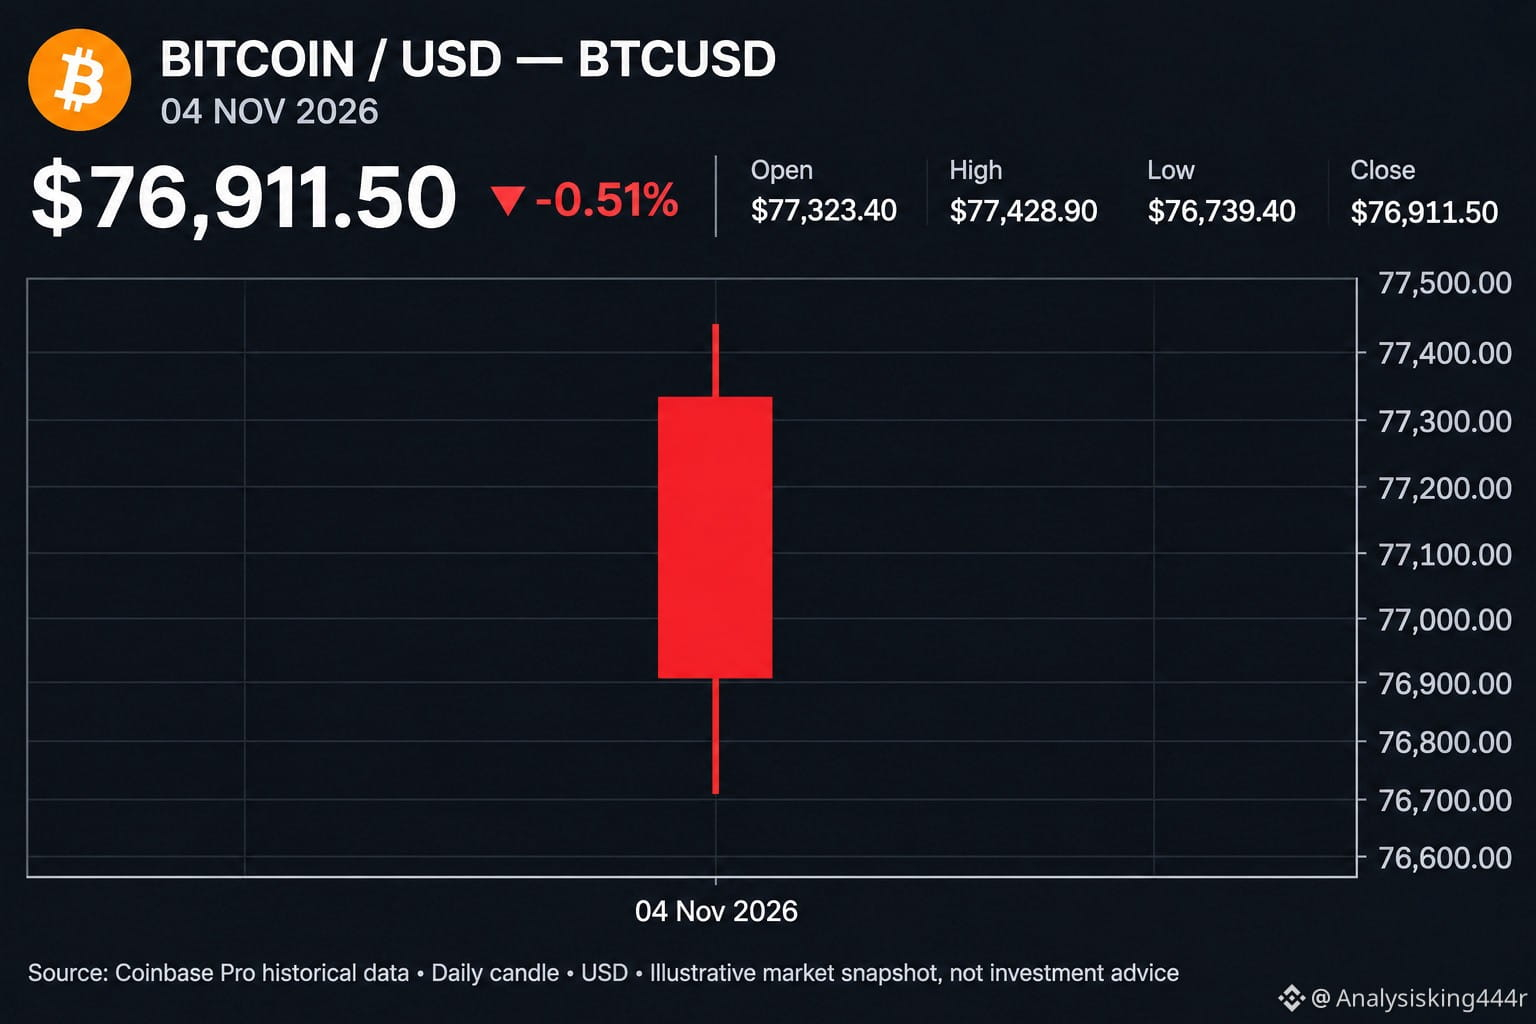
💰 現在価格: $76,911.50
🔻 1日の変動: -0.51%
市場概況:
ビットコインは短期的に弱気の勢いを見せています。売り手が価格を始値より下に押し下げており、売り圧力がうかがえます。
重要な価格水準:
- レジスタンス1: $77,300
- レジスタンス2: $77,430
- サポート1: $76,740
- サポート2: $76,500
取引見通し:
🔴 $76,740を下回る場合は弱気。
🟢 価格が$77,430を回復すれば強気。
🟡 $76,740~$77,430の間では横ばい。
結論:
BTCは現在、やや弱気の構造を示しています。取引に入る前に、ブレイクアウトが確認されるのを待ちましょう。リスクは慎重に管理してください。
⚠️ これは金融アドバイスではありません。価格水準は提供されたチャートに基づく参考値であり、リアルタイムの市場データを独自に検証したものではありません。
$BTC /$USDC 本日の市場アップデート
💰 現在価格: $76,911.50
🔻 1日の変動: -0.51%
市場概況:
ビットコインは短期的に弱気の勢いを見せています。売り手が価格を始値より下に押し下げており、売り圧力がうかがえます。
重要な価格水準:
- レジスタンス1: $77,300
- レジスタンス2: $77,430
- サポート1: $76,740
- サポート2: $76,500
取引見通し:
🔴 $76,740を下回る場合は弱気。
🟢 価格が$77,430を回復すれば強気。
🟡 $76,740~$77,430の間では横ばい。
結論:
BTCは現在、やや弱気の構造を示しています。取引に入る前に、ブレイクアウトが確認されるのを待ちましょう。リスクは慎重に管理してください。
⚠️ これは金融アドバイスではありません。価格水準は提供されたチャートに基づく参考値であり、リアルタイムの市場データを独自に検証したものではありません。
💰 現在価格: $76,911.50
🔻 1日の変動: -0.51%
市場概況:
ビットコインは短期的に弱気の勢いを見せています。売り手が価格を始値より下に押し下げており、売り圧力がうかがえます。
重要な価格水準:
- レジスタンス1: $77,300
- レジスタンス2: $77,430
- サポート1: $76,740
- サポート2: $76,500
取引見通し:
🔴 $76,740を下回る場合は弱気。
🟢 価格が$77,430を回復すれば強気。
🟡 $76,740~$77,430の間では横ばい。
結論:
BTCは現在、やや弱気の構造を示しています。取引に入る前に、ブレイクアウトが確認されるのを待ちましょう。リスクは慎重に管理してください。
⚠️ これは金融アドバイスではありません。価格水準は提供されたチャートに基づく参考値であり、リアルタイムの市場データを独自に検証したものではありません。
85
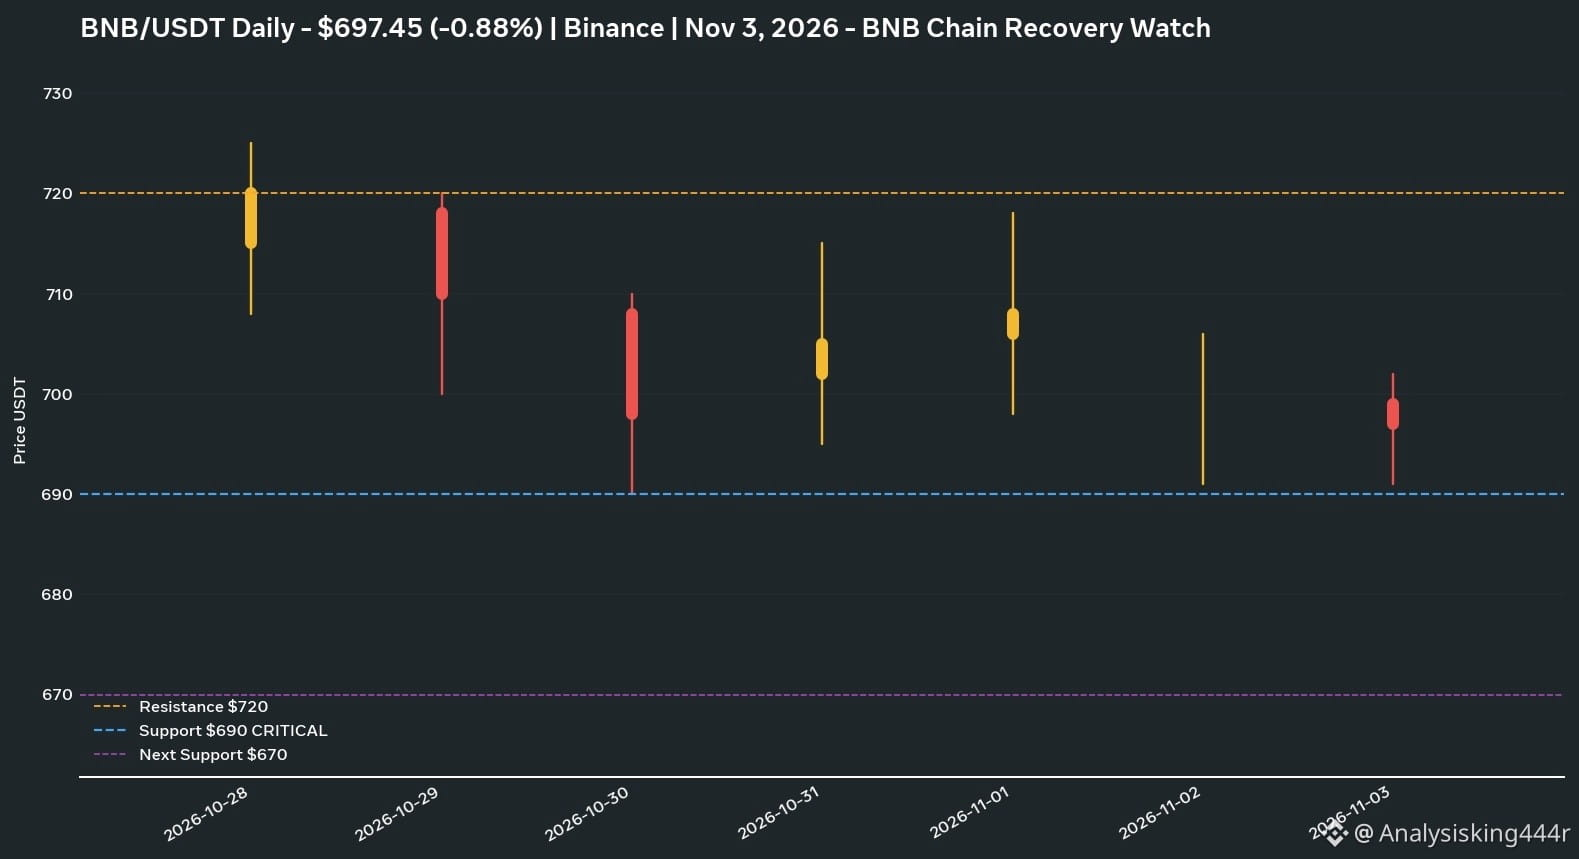
$BNB - $697*
- $690を上回る = 安全、$720まで上昇
- $690を下回る = 危険、$670まで下落
現在は$697 = 保有、新規購入はしない。
$720に達したら売却。$690を維持したら購入。
以上。
$BNB - $697*
- $690を上回る = 安全、$720まで上昇
- $690を下回る = 危険、$670まで下落
現在は$697 = 保有、新規購入はしない。
$720に達したら売却。$690を維持したら購入。
以上。
- $690を上回る = 安全、$720まで上昇
- $690を下回る = 危険、$670まで下落
現在は$697 = 保有、新規購入はしない。
$720に達したら売却。$690を維持したら購入。
以上。
120
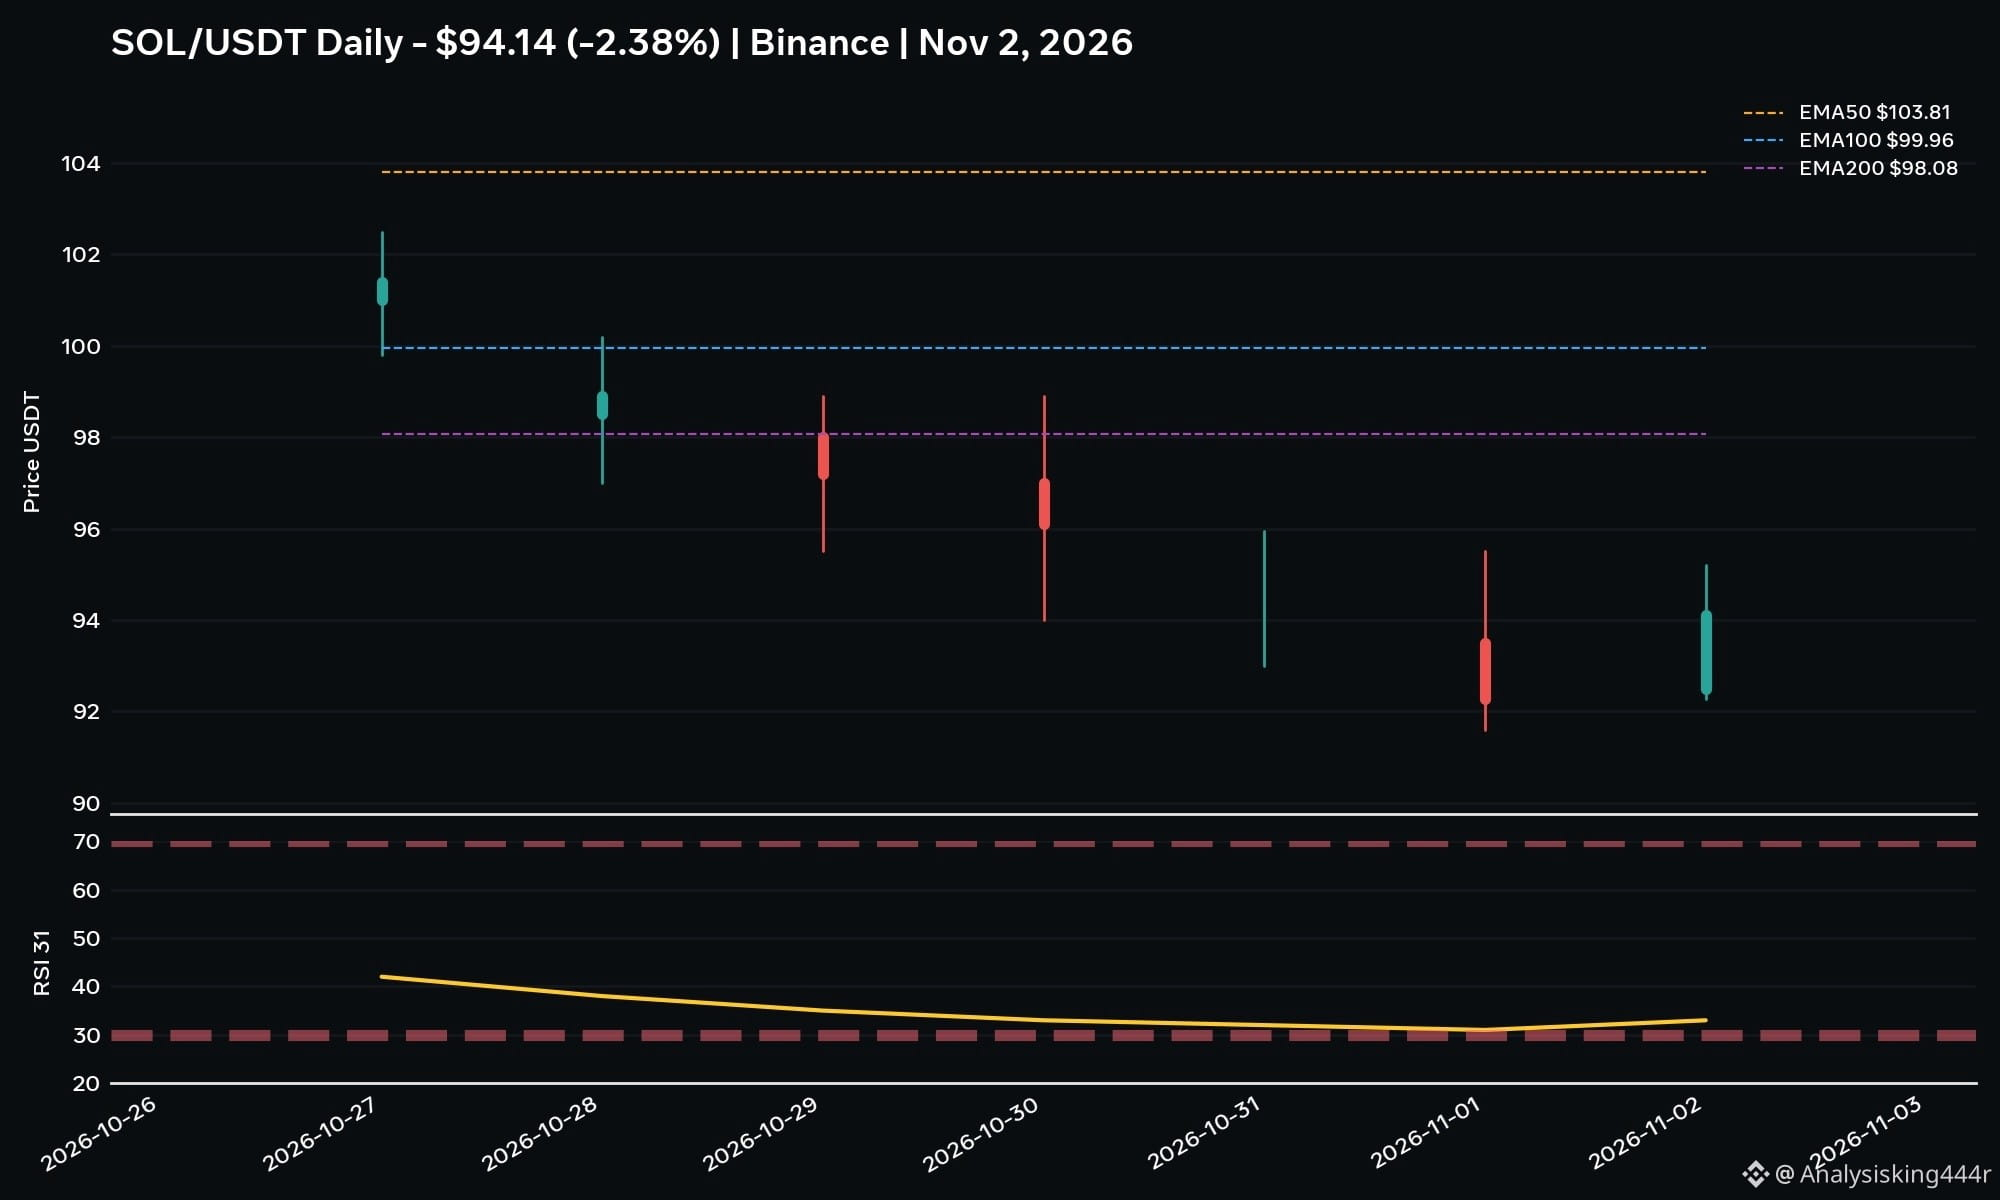
$SOL 更新
*価格:* 現在 $94.14、5日間で7.6%下落
*トレンド:* 下落
- 5本連続で陰線
- 価格は主要な移動平均線($98、$99、$103)をすべて下回っており、売り圧力が強いことを示しています
*RSI 31:* 売られ過ぎに近い状態です。売られ過ぎているため、まもなく$96〜$97まで反発する可能性がありますが、依然として弱い状況です。
*サポート:* 安値は$91.59。ここを下回ると、次は$88
*レジスタンス:* 上昇するには、まず$98の壁を突破する必要があります
*$6でどうするか:*
- *今はSOLを買わないでください* — 落ちてくるナイフをつかむようなものです
- すでにSOLを持っている場合は、$97まで反発するのを待ってから売却しましょう
- 今週はSOLよりBTCのほうが安全です
SOLが大きな出来高を伴って$98を上回れば、再び安心して買えます。今のところは売りシグナルです。
SOLの買いシグナル通知をご希望ですか?
$SOL 更新
*価格:* 現在 $94.14、5日間で7.6%下落
*トレンド:* 下落
- 5本連続で陰線
- 価格は主要な移動平均線($98、$99、$103)をすべて下回っており、売り圧力が強いことを示しています
*RSI 31:* 売られ過ぎに近い状態です。売られ過ぎているため、まもなく$96〜$97まで反発する可能性がありますが、依然として弱い状況です。
*サポート:* 安値は$91.59。ここを下回ると、次は$88
*レジスタンス:* 上昇するには、まず$98の壁を突破する必要があります
*$6でどうするか:*
- *今はSOLを買わないでください* — 落ちてくるナイフをつかむようなものです
- すでにSOLを持っている場合は、$97まで反発するのを待ってから売却しましょう
- 今週はSOLよりBTCのほうが安全です
SOLが大きな出来高を伴って$98を上回れば、再び安心して買えます。今のところは売りシグナルです。
SOLの買いシグナル通知をご希望ですか?
*価格:* 現在 $94.14、5日間で7.6%下落
*トレンド:* 下落
- 5本連続で陰線
- 価格は主要な移動平均線($98、$99、$103)をすべて下回っており、売り圧力が強いことを示しています
*RSI 31:* 売られ過ぎに近い状態です。売られ過ぎているため、まもなく$96〜$97まで反発する可能性がありますが、依然として弱い状況です。
*サポート:* 安値は$91.59。ここを下回ると、次は$88
*レジスタンス:* 上昇するには、まず$98の壁を突破する必要があります
*$6でどうするか:*
- *今はSOLを買わないでください* — 落ちてくるナイフをつかむようなものです
- すでにSOLを持っている場合は、$97まで反発するのを待ってから売却しましょう
- 今週はSOLよりBTCのほうが安全です
SOLが大きな出来高を伴って$98を上回れば、再び安心して買えます。今のところは売りシグナルです。
SOLの買いシグナル通知をご希望ですか?
1
160
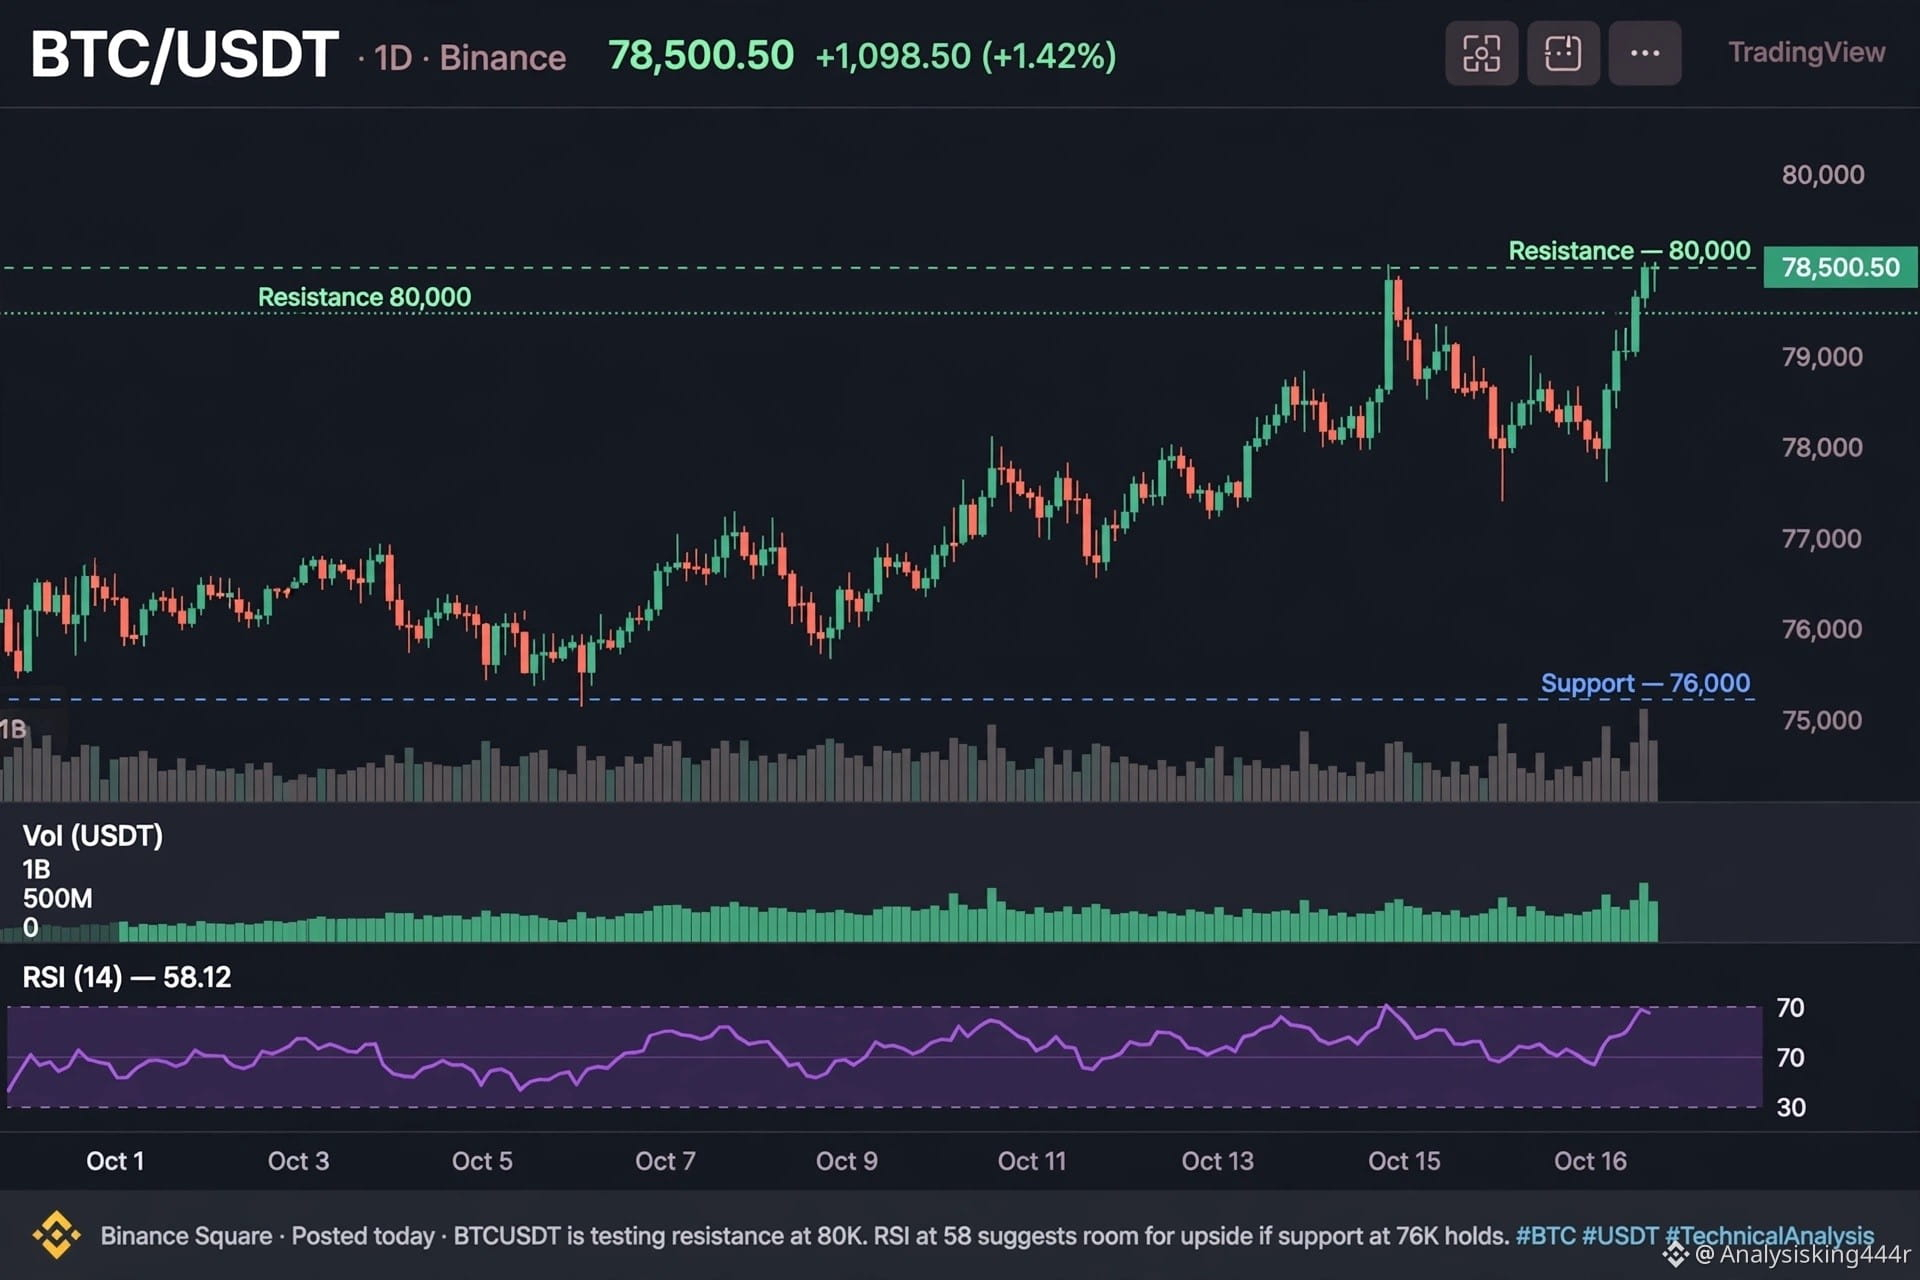
$BTC - $78,500 (+1.42%)
Binanceのハッキング報道を受けて$76.1kまで下落したBTCは反発。現在は100日EMAの$77,831を上回って推移しており、これは力強い動きです。
レジスタンス:$80,307(50日EMA)— 回復して$85kを目指すには、日足終値でこの水準を上回る必要があります
サポート:$77,831と$76k — $76kを割ると、さらに下落する可能性があります
RSI 58=中立で、買われすぎではなく、上昇余地があります。今日は出来高も多く、実際の買い手が戻っています。
私の見方:回復はまだ不安定で、トレンド転換とまでは言えません。$80kを下回る水準では大きくロングしないこと。$80.3kの上抜けを待つか、$77.8k付近への押し目をタイトなSLで狙いましょう。
この反発で買いますか?それとも様子見ですか?👇
#BTC #Bitcoin #Crypto #BinanceSquare
$BTC - $78,500 (+1.42%)
Binanceのハッキング報道を受けて$76.1kまで下落したBTCは反発。現在は100日EMAの$77,831を上回って推移しており、これは力強い動きです。
レジスタンス:$80,307(50日EMA)— 回復して$85kを目指すには、日足終値でこの水準を上回る必要があります
サポート:$77,831と$76k — $76kを割ると、さらに下落する可能性があります
RSI 58=中立で、買われすぎではなく、上昇余地があります。今日は出来高も多く、実際の買い手が戻っています。
私の見方:回復はまだ不安定で、トレンド転換とまでは言えません。$80kを下回る水準では大きくロングしないこと。$80.3kの上抜けを待つか、$77.8k付近への押し目をタイトなSLで狙いましょう。
この反発で買いますか?それとも様子見ですか?👇
#BTC #Bitcoin #Crypto #BinanceSquare
Binanceのハッキング報道を受けて$76.1kまで下落したBTCは反発。現在は100日EMAの$77,831を上回って推移しており、これは力強い動きです。
レジスタンス:$80,307(50日EMA)— 回復して$85kを目指すには、日足終値でこの水準を上回る必要があります
サポート:$77,831と$76k — $76kを割ると、さらに下落する可能性があります
RSI 58=中立で、買われすぎではなく、上昇余地があります。今日は出来高も多く、実際の買い手が戻っています。
私の見方:回復はまだ不安定で、トレンド転換とまでは言えません。$80kを下回る水準では大きくロングしないこと。$80.3kの上抜けを待つか、$77.8k付近への押し目をタイトなSLで狙いましょう。
この反発で買いますか?それとも様子見ですか?👇
#BTC #Bitcoin #Crypto #BinanceSquare
83
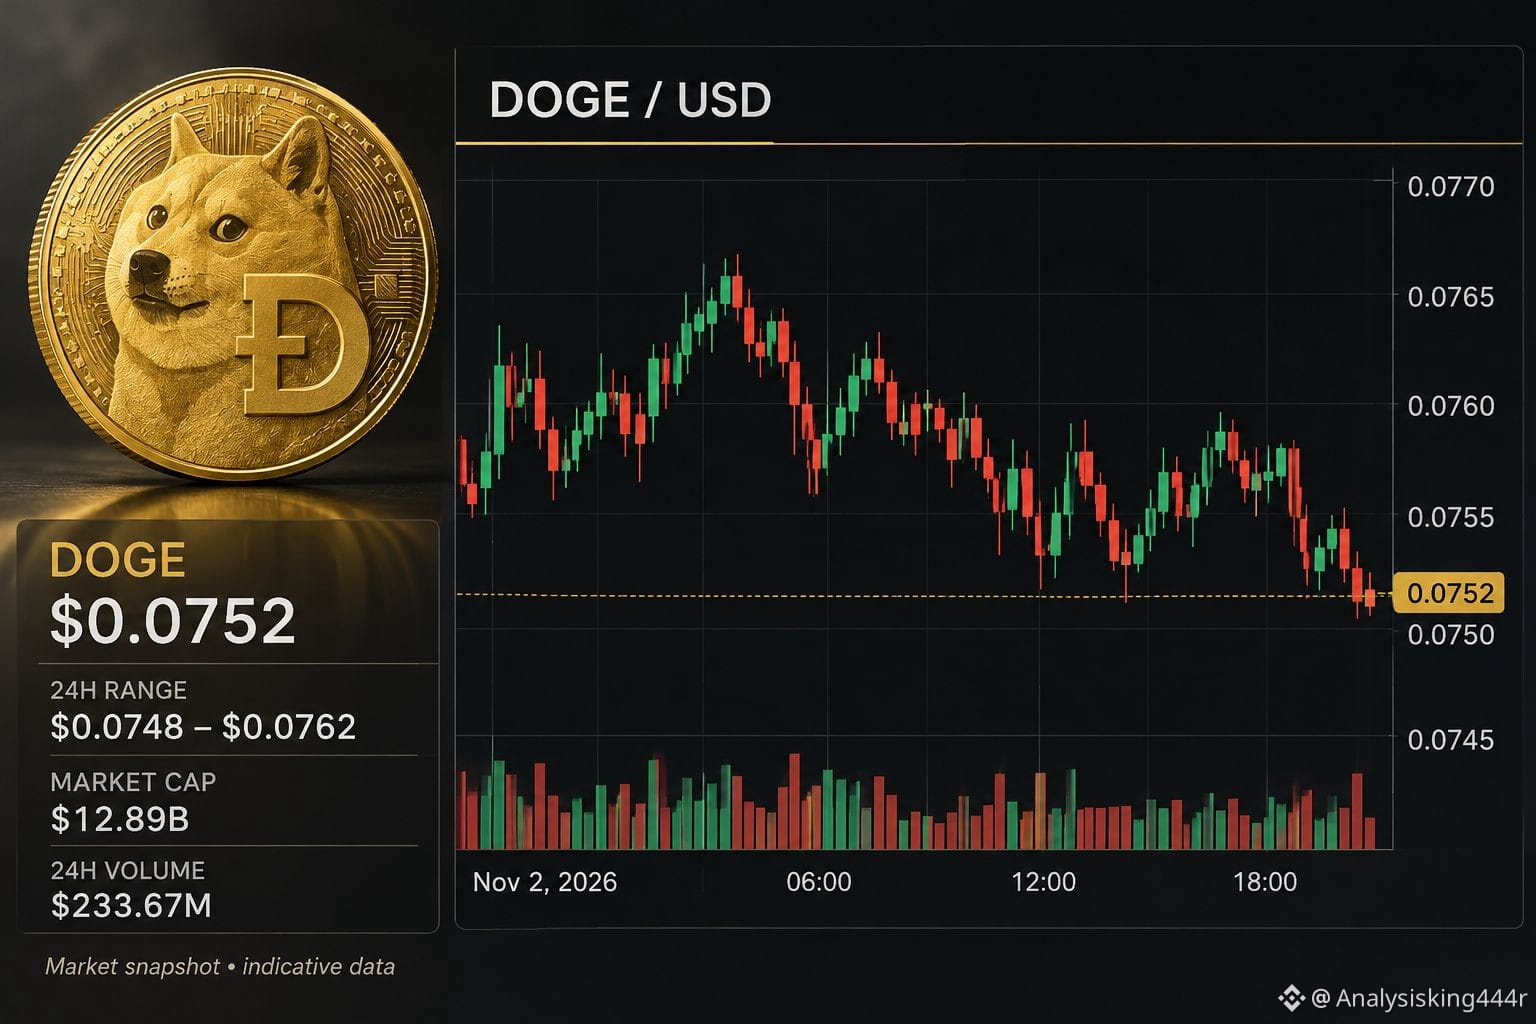
$DOGE /USD 市場分析
DOGECOINは現在、弱気の勢いを示しています。買い手は価格を押し上げようとしましたが、売り手が主導権を握り、0.0752ドル付近まで価格を押し下げました。
重要なサポート水準は0.0750ドルです。DOGEがこの水準を上回って維持できれば、0.0758ドル、さらに0.0765ドルまで回復する可能性があります。
しかし、価格が0.0750ドルを下回った場合、0.0748ドルに向けてさらに下落する可能性があります。
私の見解:現時点では、市場はやや弱気に見えます。買いポジションに入る前に、確認を待ちたいと思います。サポート水準を注意深く見守り、必ずストップロスを設定してください。
全体的なセンチメント:慎重ながら弱気。
$DOGE /USD 市場分析
DOGECOINは現在、弱気の勢いを示しています。買い手は価格を押し上げようとしましたが、売り手が主導権を握り、0.0752ドル付近まで価格を押し下げました。
重要なサポート水準は0.0750ドルです。DOGEがこの水準を上回って維持できれば、0.0758ドル、さらに0.0765ドルまで回復する可能性があります。
しかし、価格が0.0750ドルを下回った場合、0.0748ドルに向けてさらに下落する可能性があります。
私の見解:現時点では、市場はやや弱気に見えます。買いポジションに入る前に、確認を待ちたいと思います。サポート水準を注意深く見守り、必ずストップロスを設定してください。
全体的なセンチメント:慎重ながら弱気。
DOGECOINは現在、弱気の勢いを示しています。買い手は価格を押し上げようとしましたが、売り手が主導権を握り、0.0752ドル付近まで価格を押し下げました。
重要なサポート水準は0.0750ドルです。DOGEがこの水準を上回って維持できれば、0.0758ドル、さらに0.0765ドルまで回復する可能性があります。
しかし、価格が0.0750ドルを下回った場合、0.0748ドルに向けてさらに下落する可能性があります。
私の見解:現時点では、市場はやや弱気に見えます。買いポジションに入る前に、確認を待ちたいと思います。サポート水準を注意深く見守り、必ずストップロスを設定してください。
全体的なセンチメント:慎重ながら弱気。
91
翻訳参照
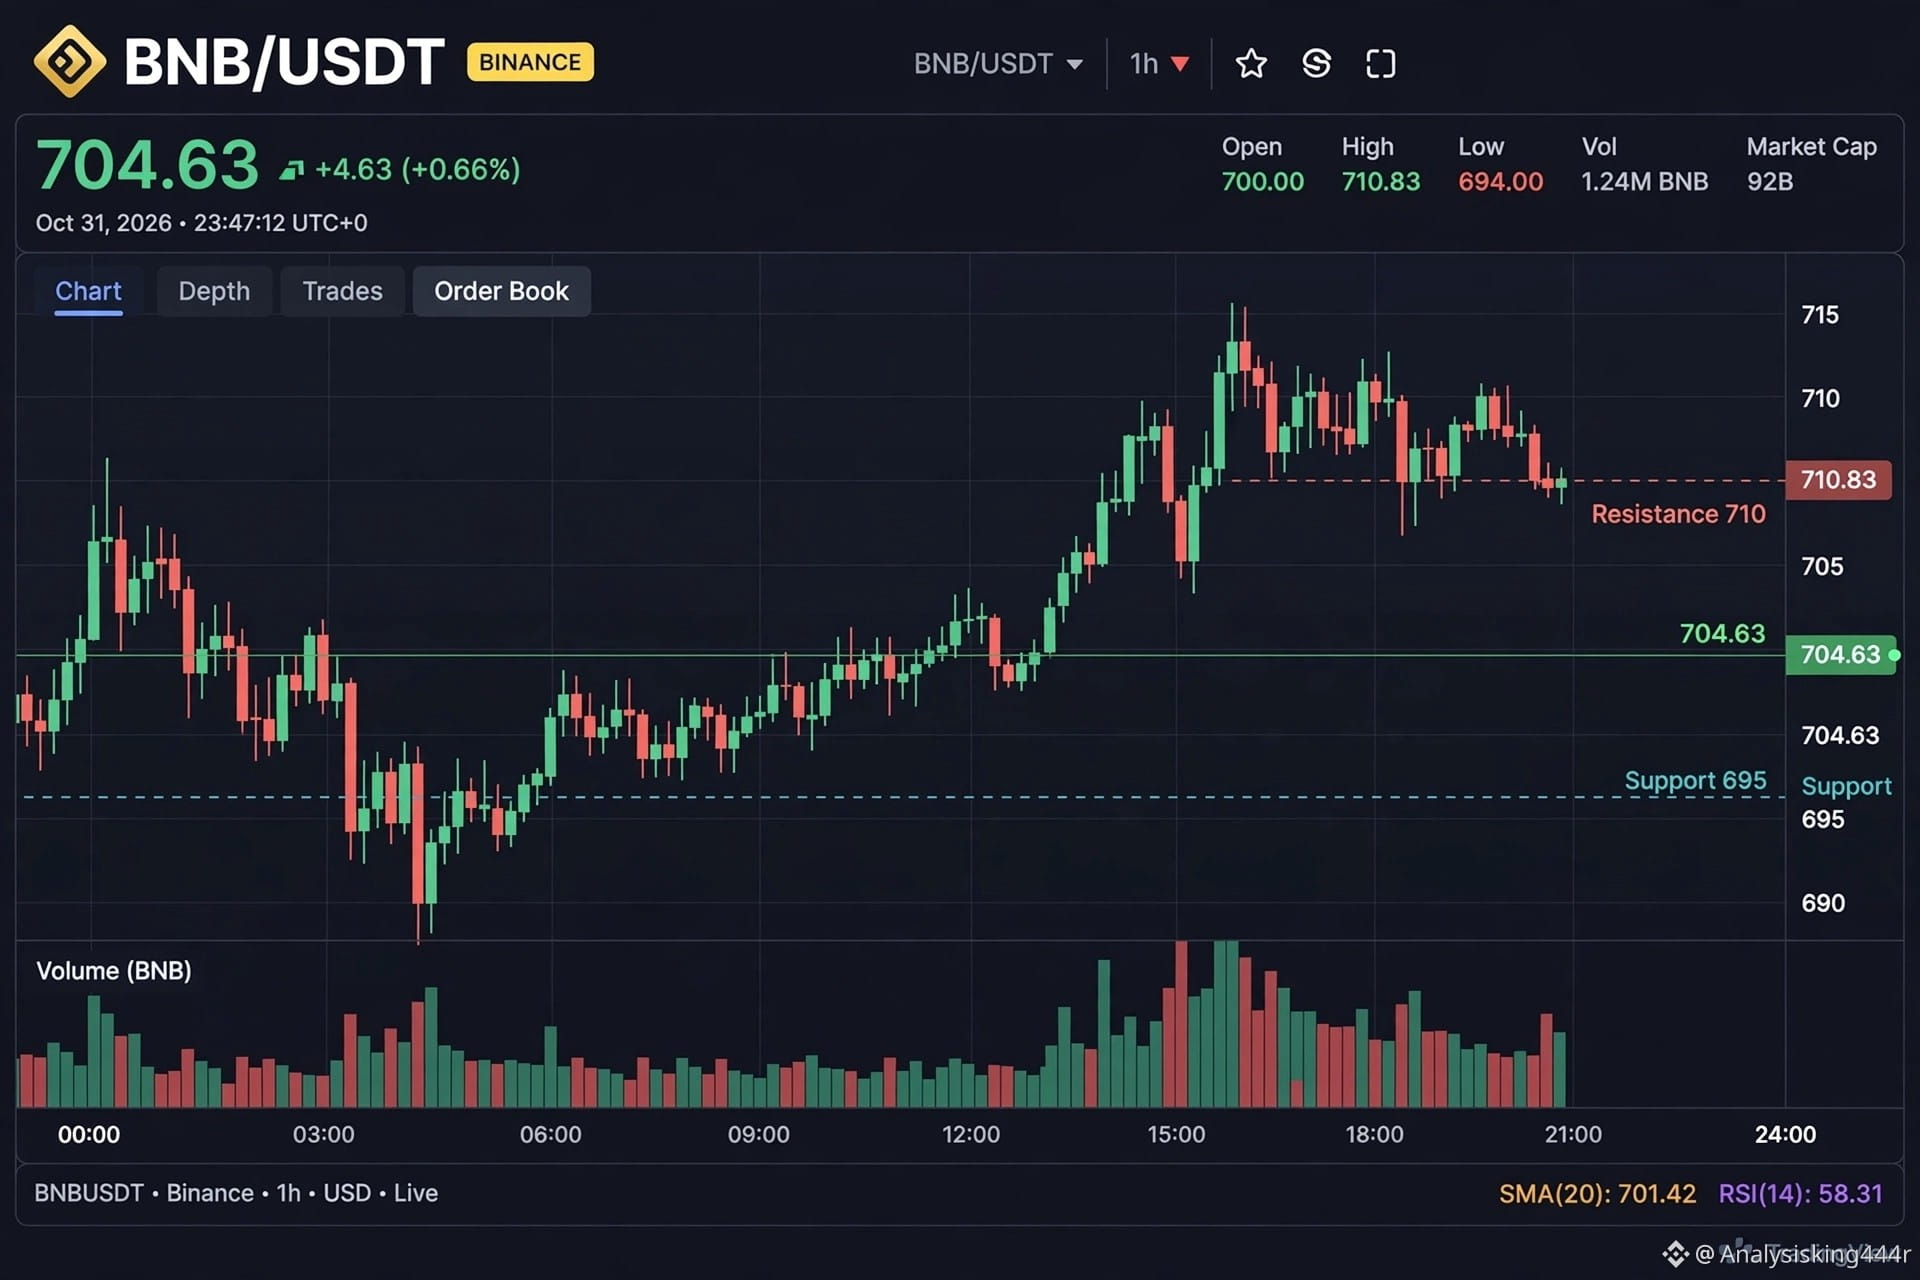
🚨 $BNB CRASHED TO $682 THEN PUMPED TO $704 TODAY!
Why? Binance $6.3B hack panic is over - whales buying back!
📊 REAL CHART Oct 31:
Price: $704.63 (+0.66%)
Support: $695
Resistance: $710.83 (break = $725)
RSI: 58.31 - still cheap, not overbought!
My plan: Bought small at $698, target $715, SL $692
Will $BNB break $720 this week? Comment YES or NO 👇
#BNB #Binance #CryptoAnalysis #BinanceSquare
🚨 $BNB CRASHED TO $682 THEN PUMPED TO $704 TODAY!
Why? Binance $6.3B hack panic is over - whales buying back!
📊 REAL CHART Oct 31:
Price: $704.63 (+0.66%)
Support: $695
Resistance: $710.83 (break = $725)
RSI: 58.31 - still cheap, not overbought!
My plan: Bought small at $698, target $715, SL $692
Will $BNB break $720 this week? Comment YES or NO 👇
#BNB #Binance #CryptoAnalysis #BinanceSquare
Why? Binance $6.3B hack panic is over - whales buying back!
📊 REAL CHART Oct 31:
Price: $704.63 (+0.66%)
Support: $695
Resistance: $710.83 (break = $725)
RSI: 58.31 - still cheap, not overbought!
My plan: Bought small at $698, target $715, SL $692
Will $BNB break $720 this week? Comment YES or NO 👇
#BNB #Binance #CryptoAnalysis #BinanceSquare
68
翻訳参照
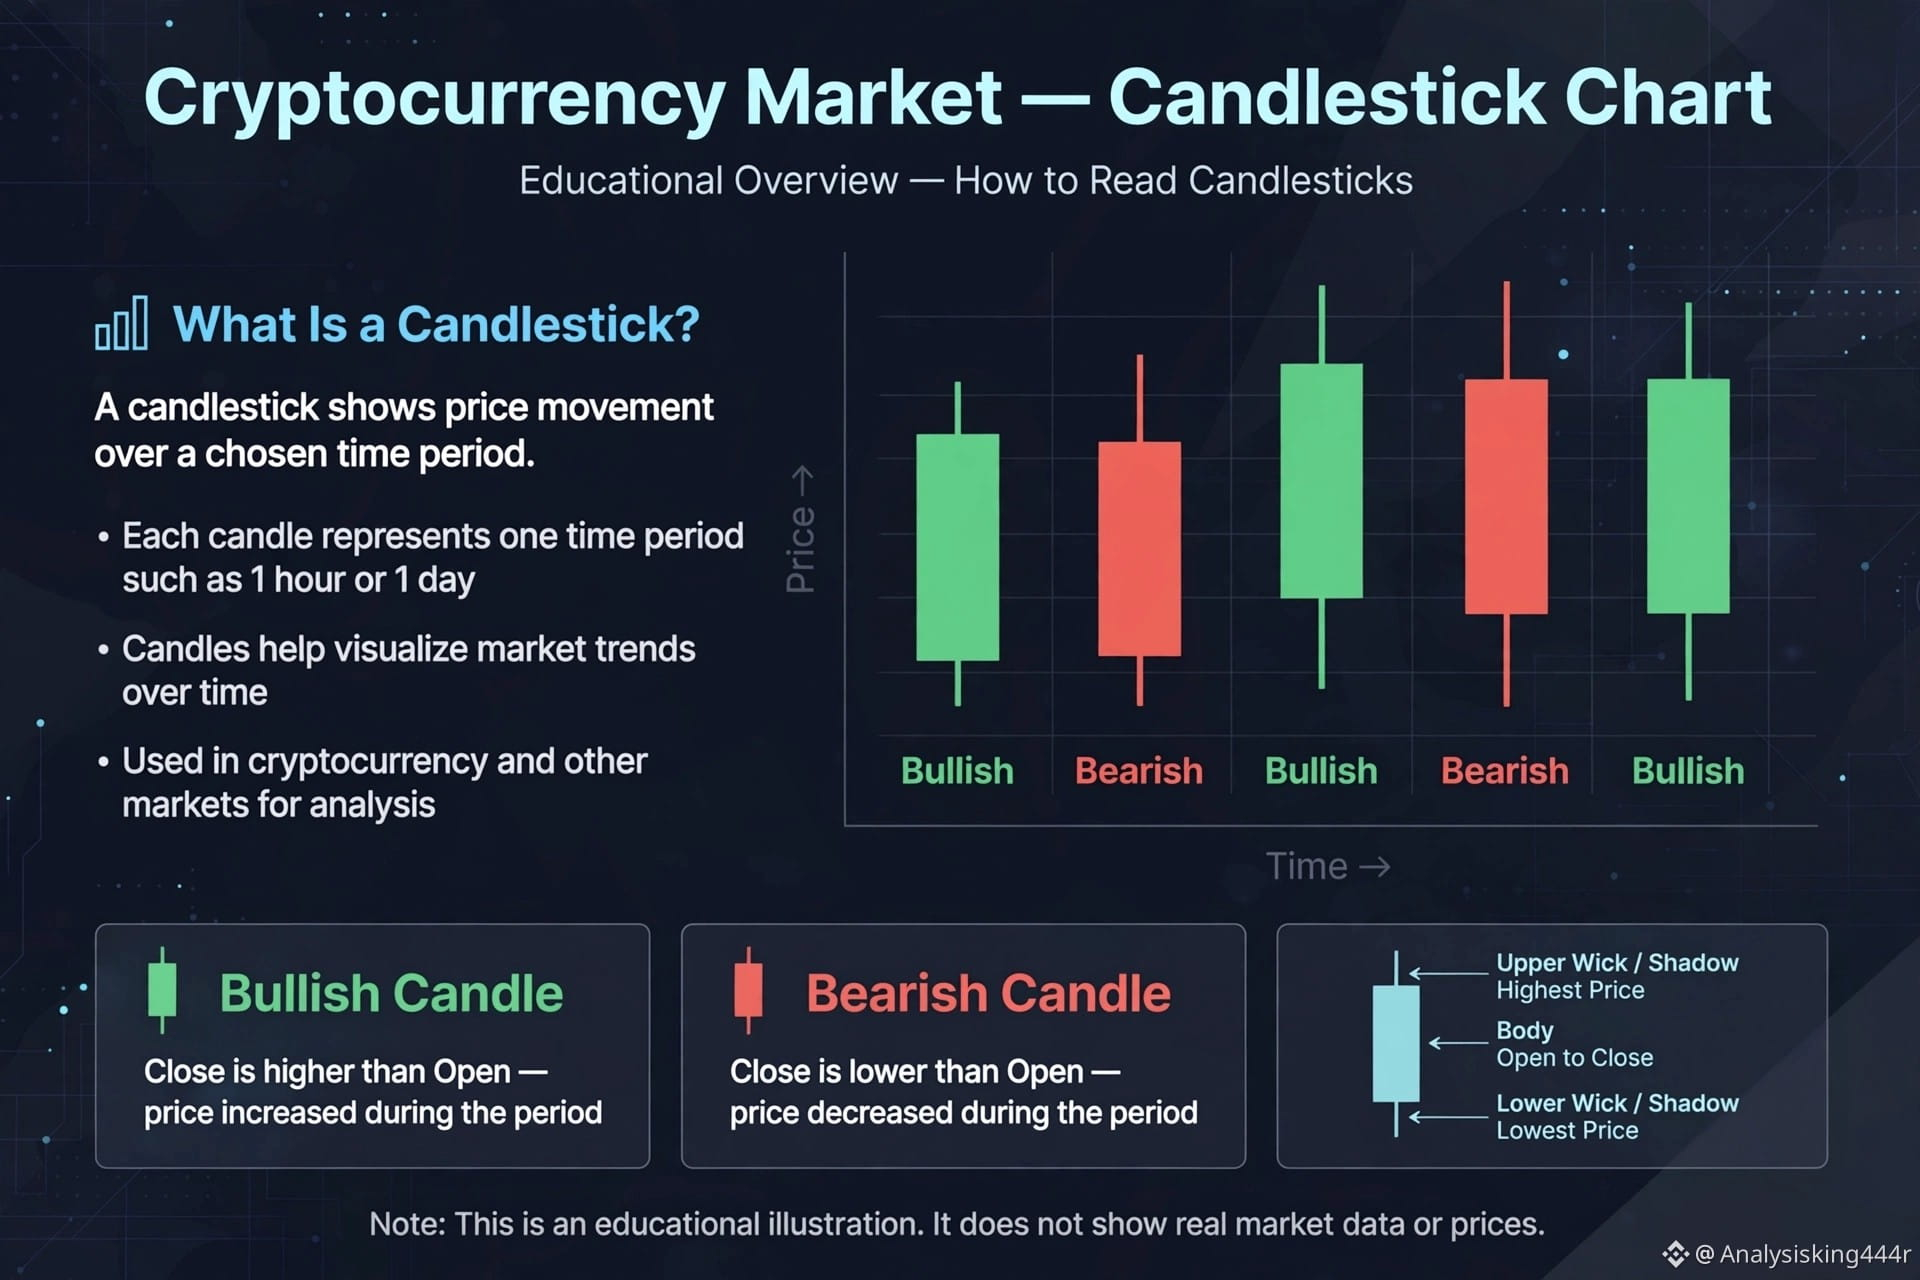
Understanding Candlestick Charts — Complete Beginner Guide 🕯️
Many new traders get confused by charts, here is simple breakdown:
1. Green Candle (Bullish): Buyers in control. Price closed higher than it opened.
2. Red Candle (Bearish): Sellers in control. Price closed lower.
3. Wick/Shadow: Shows highest and lowest price in that period.
Tip: Don't trade just by seeing green/red. Wait for trend + volume + support/resistance.
Are you learning chart reading? What topic should I explain next?
$BTC $SOL $ETH #CryptoEducation
Understanding Candlestick Charts — Complete Beginner Guide 🕯️
Many new traders get confused by charts, here is simple breakdown:
1. Green Candle (Bullish): Buyers in control. Price closed higher than it opened.
2. Red Candle (Bearish): Sellers in control. Price closed lower.
3. Wick/Shadow: Shows highest and lowest price in that period.
Tip: Don't trade just by seeing green/red. Wait for trend + volume + support/resistance.
Are you learning chart reading? What topic should I explain next?
$BTC $SOL $ETH #CryptoEducation
Many new traders get confused by charts, here is simple breakdown:
1. Green Candle (Bullish): Buyers in control. Price closed higher than it opened.
2. Red Candle (Bearish): Sellers in control. Price closed lower.
3. Wick/Shadow: Shows highest and lowest price in that period.
Tip: Don't trade just by seeing green/red. Wait for trend + volume + support/resistance.
Are you learning chart reading? What topic should I explain next?
$BTC $SOL $ETH #CryptoEducation
100
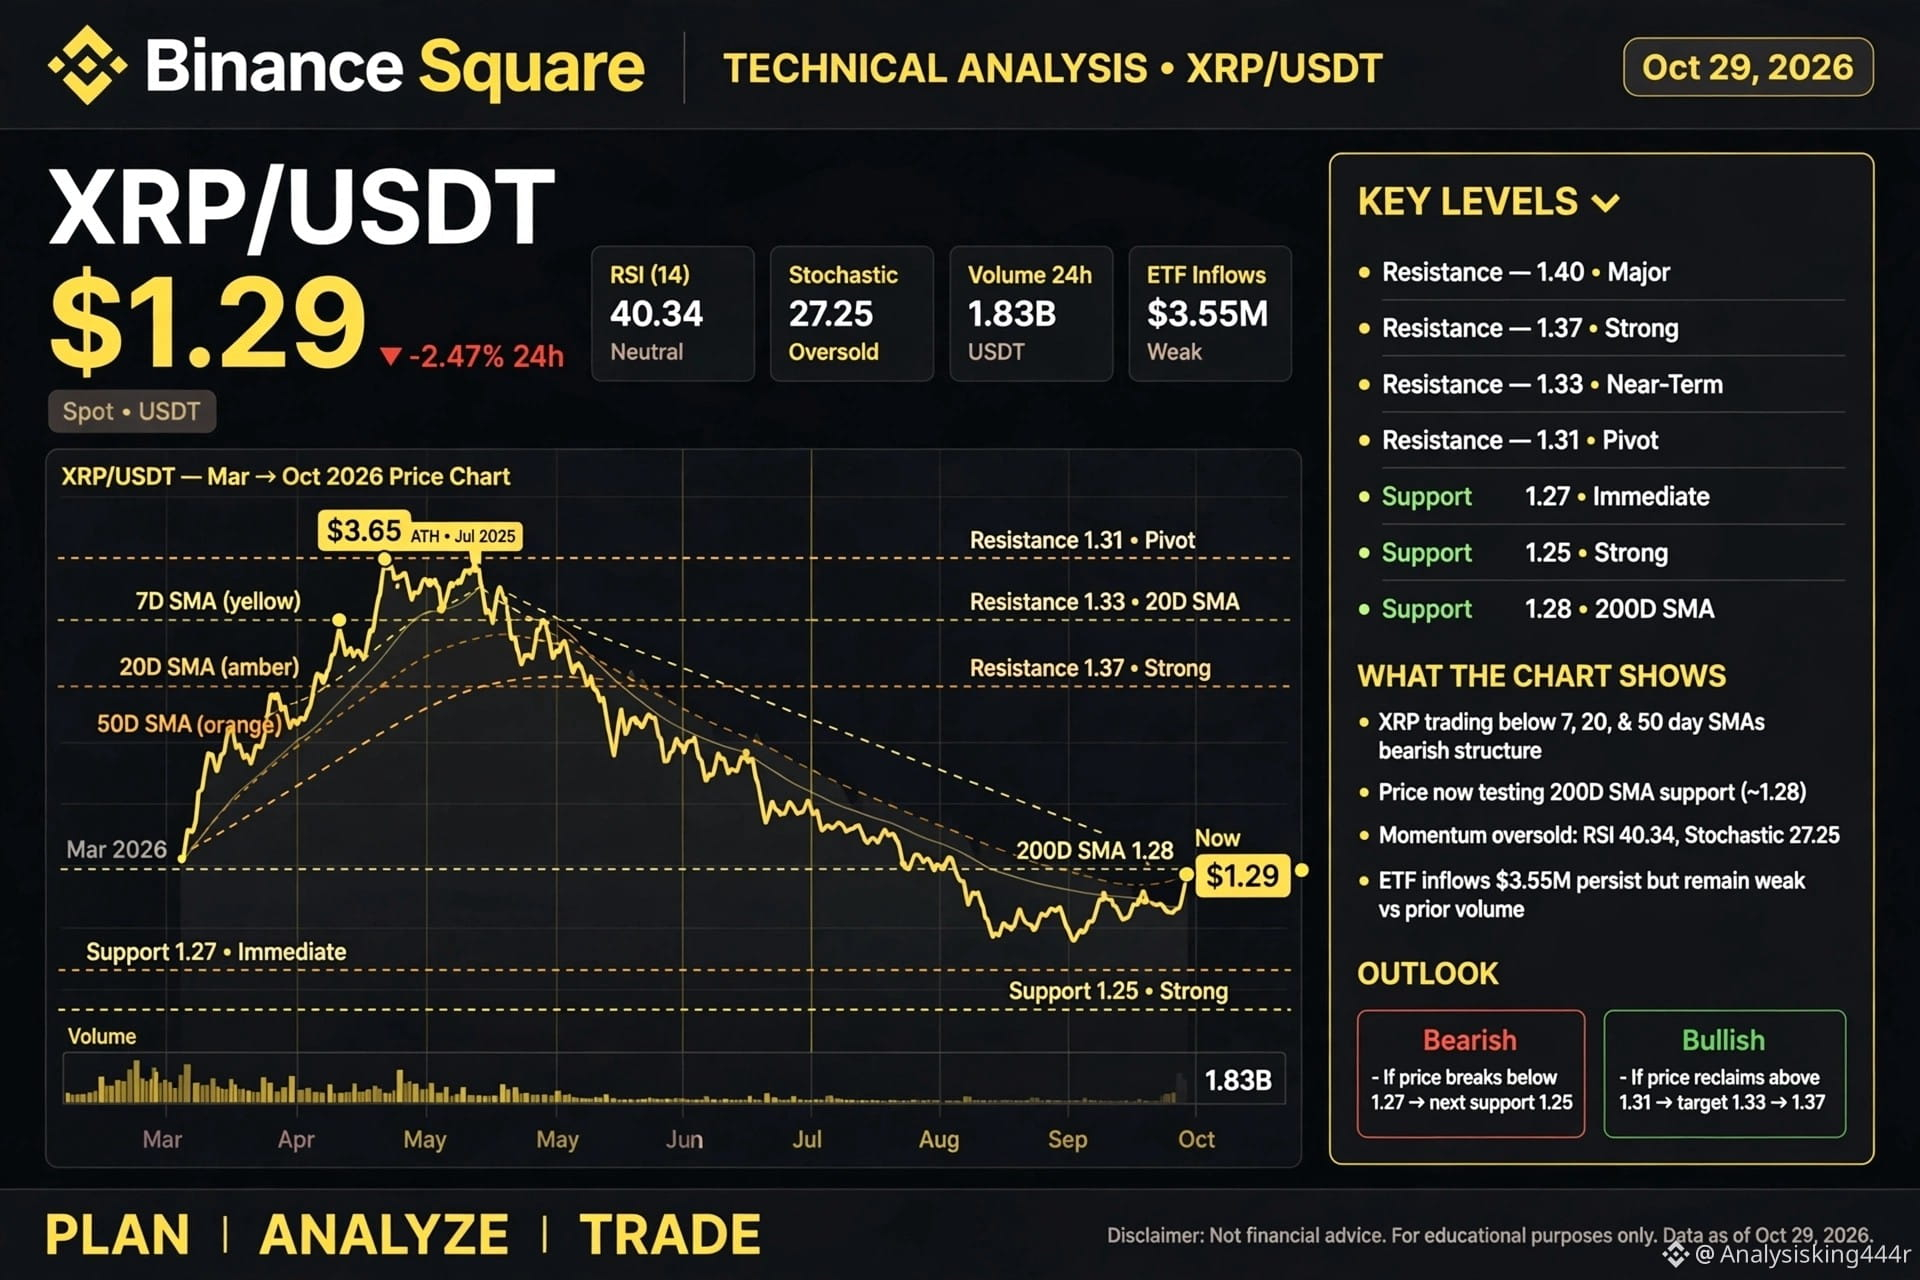
$XRP は現在$1.29で、7日・20日・50日の各移動平均を下回って取引されており、売り手がトレンドを支配していることを示しています。下支えとなっているのは、$1.28付近の200日移動平均だけです。
RSIは40で、勢いが弱いことを示しています。ストキャスティクスは27で売られ過ぎの状態を示しており、すでに多くの人が売却したため、小幅な反発の可能性はあります。ただし、反発を確認するには$1.31を上回る必要があります。
$1.31を上回れば、すぐに$1.33、さらに$1.37まで上昇する可能性があります。$1.27を下回れば、$1.25まで下落する可能性が高いでしょう。
$XRP は現在$1.29で、7日・20日・50日の各移動平均を下回って取引されており、売り手がトレンドを支配していることを示しています。下支えとなっているのは、$1.28付近の200日移動平均だけです。
RSIは40で、勢いが弱いことを示しています。ストキャスティクスは27で売られ過ぎの状態を示しており、すでに多くの人が売却したため、小幅な反発の可能性はあります。ただし、反発を確認するには$1.31を上回る必要があります。
$1.31を上回れば、すぐに$1.33、さらに$1.37まで上昇する可能性があります。$1.27を下回れば、$1.25まで下落する可能性が高いでしょう。
RSIは40で、勢いが弱いことを示しています。ストキャスティクスは27で売られ過ぎの状態を示しており、すでに多くの人が売却したため、小幅な反発の可能性はあります。ただし、反発を確認するには$1.31を上回る必要があります。
$1.31を上回れば、すぐに$1.33、さらに$1.37まで上昇する可能性があります。$1.27を下回れば、$1.25まで下落する可能性が高いでしょう。
588
$BTC
2026年10月29日:*
*BTC/USDT 1日足 - 実際の水準:*
*重要な水準*
- *レジスタンス:* 82,000ドルが主要水準、81,700ドルが短期水準
- *サポート:* 80,000ドルが強い心理的節目、79,710ドルが直近安値
- BTCは7日SMA(80,660)、20日SMA(81,801)、50日SMAをすべて*下回って*取引されており、上値を抑えられている状態=弱気圧力
- 本日の値幅は79,710~81,823ドル、現在は80,150ドル(-0.85%)
- RSIは約48.9で中立から弱気、モメンタムは弱まっている
- ETFへの資金流入は昨日もプラスの1億3,700万ドル。ただし価格は追随しておらず、買い手は売りを吸収しているものの、まだ価格を押し上げていない
*見通し:*
- 81,700ドルを上抜けて維持できれば強気
- 80,000ドルを下抜ければ弱気。次の下値目標は79,710ドル、その次が79,000ドル
これは金融アドバイスではなく、教育目的のみです。
$BTC
2026年10月29日:*
*BTC/USDT 1日足 - 実際の水準:*
*重要な水準*
- *レジスタンス:* 82,000ドルが主要水準、81,700ドルが短期水準
- *サポート:* 80,000ドルが強い心理的節目、79,710ドルが直近安値
- BTCは7日SMA(80,660)、20日SMA(81,801)、50日SMAをすべて*下回って*取引されており、上値を抑えられている状態=弱気圧力
- 本日の値幅は79,710~81,823ドル、現在は80,150ドル(-0.85%)
- RSIは約48.9で中立から弱気、モメンタムは弱まっている
- ETFへの資金流入は昨日もプラスの1億3,700万ドル。ただし価格は追随しておらず、買い手は売りを吸収しているものの、まだ価格を押し上げていない
*見通し:*
- 81,700ドルを上抜けて維持できれば強気
- 80,000ドルを下抜ければ弱気。次の下値目標は79,710ドル、その次が79,000ドル
これは金融アドバイスではなく、教育目的のみです。
2026年10月29日:*
*BTC/USDT 1日足 - 実際の水準:*
*重要な水準*
- *レジスタンス:* 82,000ドルが主要水準、81,700ドルが短期水準
- *サポート:* 80,000ドルが強い心理的節目、79,710ドルが直近安値
- BTCは7日SMA(80,660)、20日SMA(81,801)、50日SMAをすべて*下回って*取引されており、上値を抑えられている状態=弱気圧力
- 本日の値幅は79,710~81,823ドル、現在は80,150ドル(-0.85%)
- RSIは約48.9で中立から弱気、モメンタムは弱まっている
- ETFへの資金流入は昨日もプラスの1億3,700万ドル。ただし価格は追随しておらず、買い手は売りを吸収しているものの、まだ価格を押し上げていない
*見通し:*
- 81,700ドルを上抜けて維持できれば強気
- 80,000ドルを下抜ければ弱気。次の下値目標は79,710ドル、その次が79,000ドル
これは金融アドバイスではなく、教育目的のみです。
58
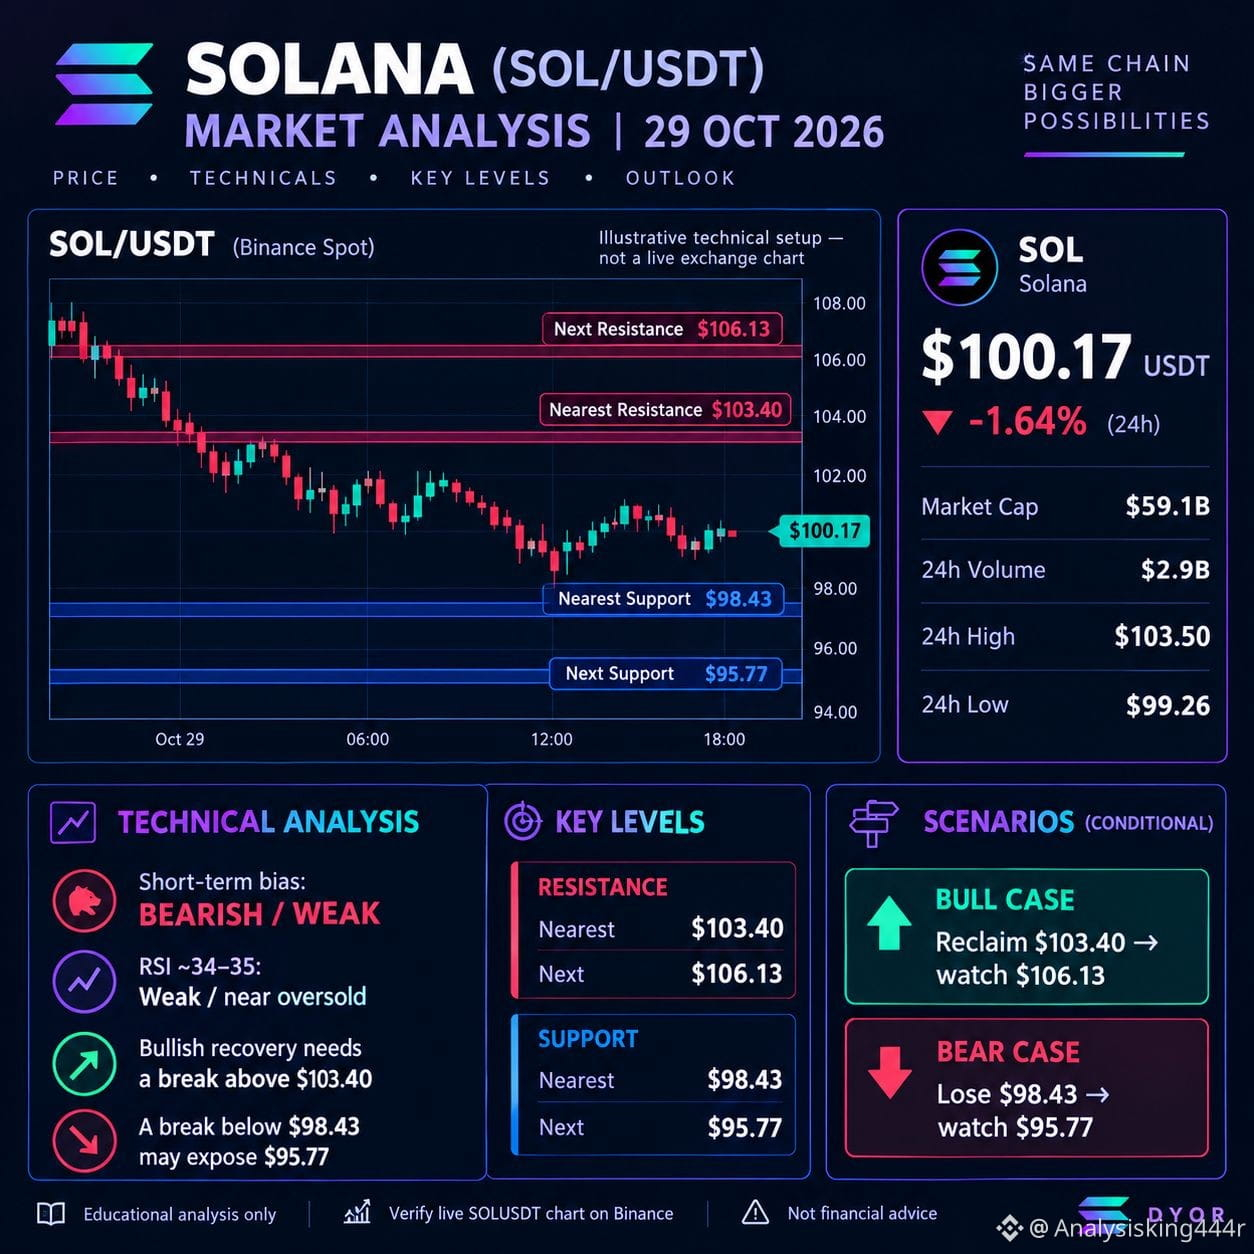
📊 $SOL 市場分析 | $100.17
$SOL は本日-1.64%下落し、売り圧力を受けて弱含みで取引されています。
🔴 上値抵抗線:
$103.40(反発には奪回が必須)
$106.13(主要な抵抗線)
🟢 下値支持線:
$98.43(目先の支持線)
$95.77(下抜けた場合の次の支持線)
📉 RSI 34~35 → 売られ過ぎに近いものの、まだ反転の兆しはありません。
🚀 強気シナリオ:$103.40を奪回 → $106.13も視野に
🐻 弱気シナリオ:$98.43を割る → $95.77に注目
$98.43と$103.40を注視しましょう。上抜けか下抜けかで次の動きが決まります。中途半端な価格で飛び乗らないように。
この$100の押し目で買いますか?それとも$95まで待ちますか?
$SOL $BTC #SOL
📊 $SOL 市場分析 | $100.17
$SOL は本日-1.64%下落し、売り圧力を受けて弱含みで取引されています。
🔴 上値抵抗線:
$103.40(反発には奪回が必須)
$106.13(主要な抵抗線)
🟢 下値支持線:
$98.43(目先の支持線)
$95.77(下抜けた場合の次の支持線)
📉 RSI 34~35 → 売られ過ぎに近いものの、まだ反転の兆しはありません。
🚀 強気シナリオ:$103.40を奪回 → $106.13も視野に
🐻 弱気シナリオ:$98.43を割る → $95.77に注目
$98.43と$103.40を注視しましょう。上抜けか下抜けかで次の動きが決まります。中途半端な価格で飛び乗らないように。
この$100の押し目で買いますか?それとも$95まで待ちますか?
$SOL $BTC #SOL
$SOL は本日-1.64%下落し、売り圧力を受けて弱含みで取引されています。
🔴 上値抵抗線:
$103.40(反発には奪回が必須)
$106.13(主要な抵抗線)
🟢 下値支持線:
$98.43(目先の支持線)
$95.77(下抜けた場合の次の支持線)
📉 RSI 34~35 → 売られ過ぎに近いものの、まだ反転の兆しはありません。
🚀 強気シナリオ:$103.40を奪回 → $106.13も視野に
🐻 弱気シナリオ:$98.43を割る → $95.77に注目
$98.43と$103.40を注視しましょう。上抜けか下抜けかで次の動きが決まります。中途半端な価格で飛び乗らないように。
この$100の押し目で買いますか?それとも$95まで待ちますか?
$SOL $BTC #SOL
93
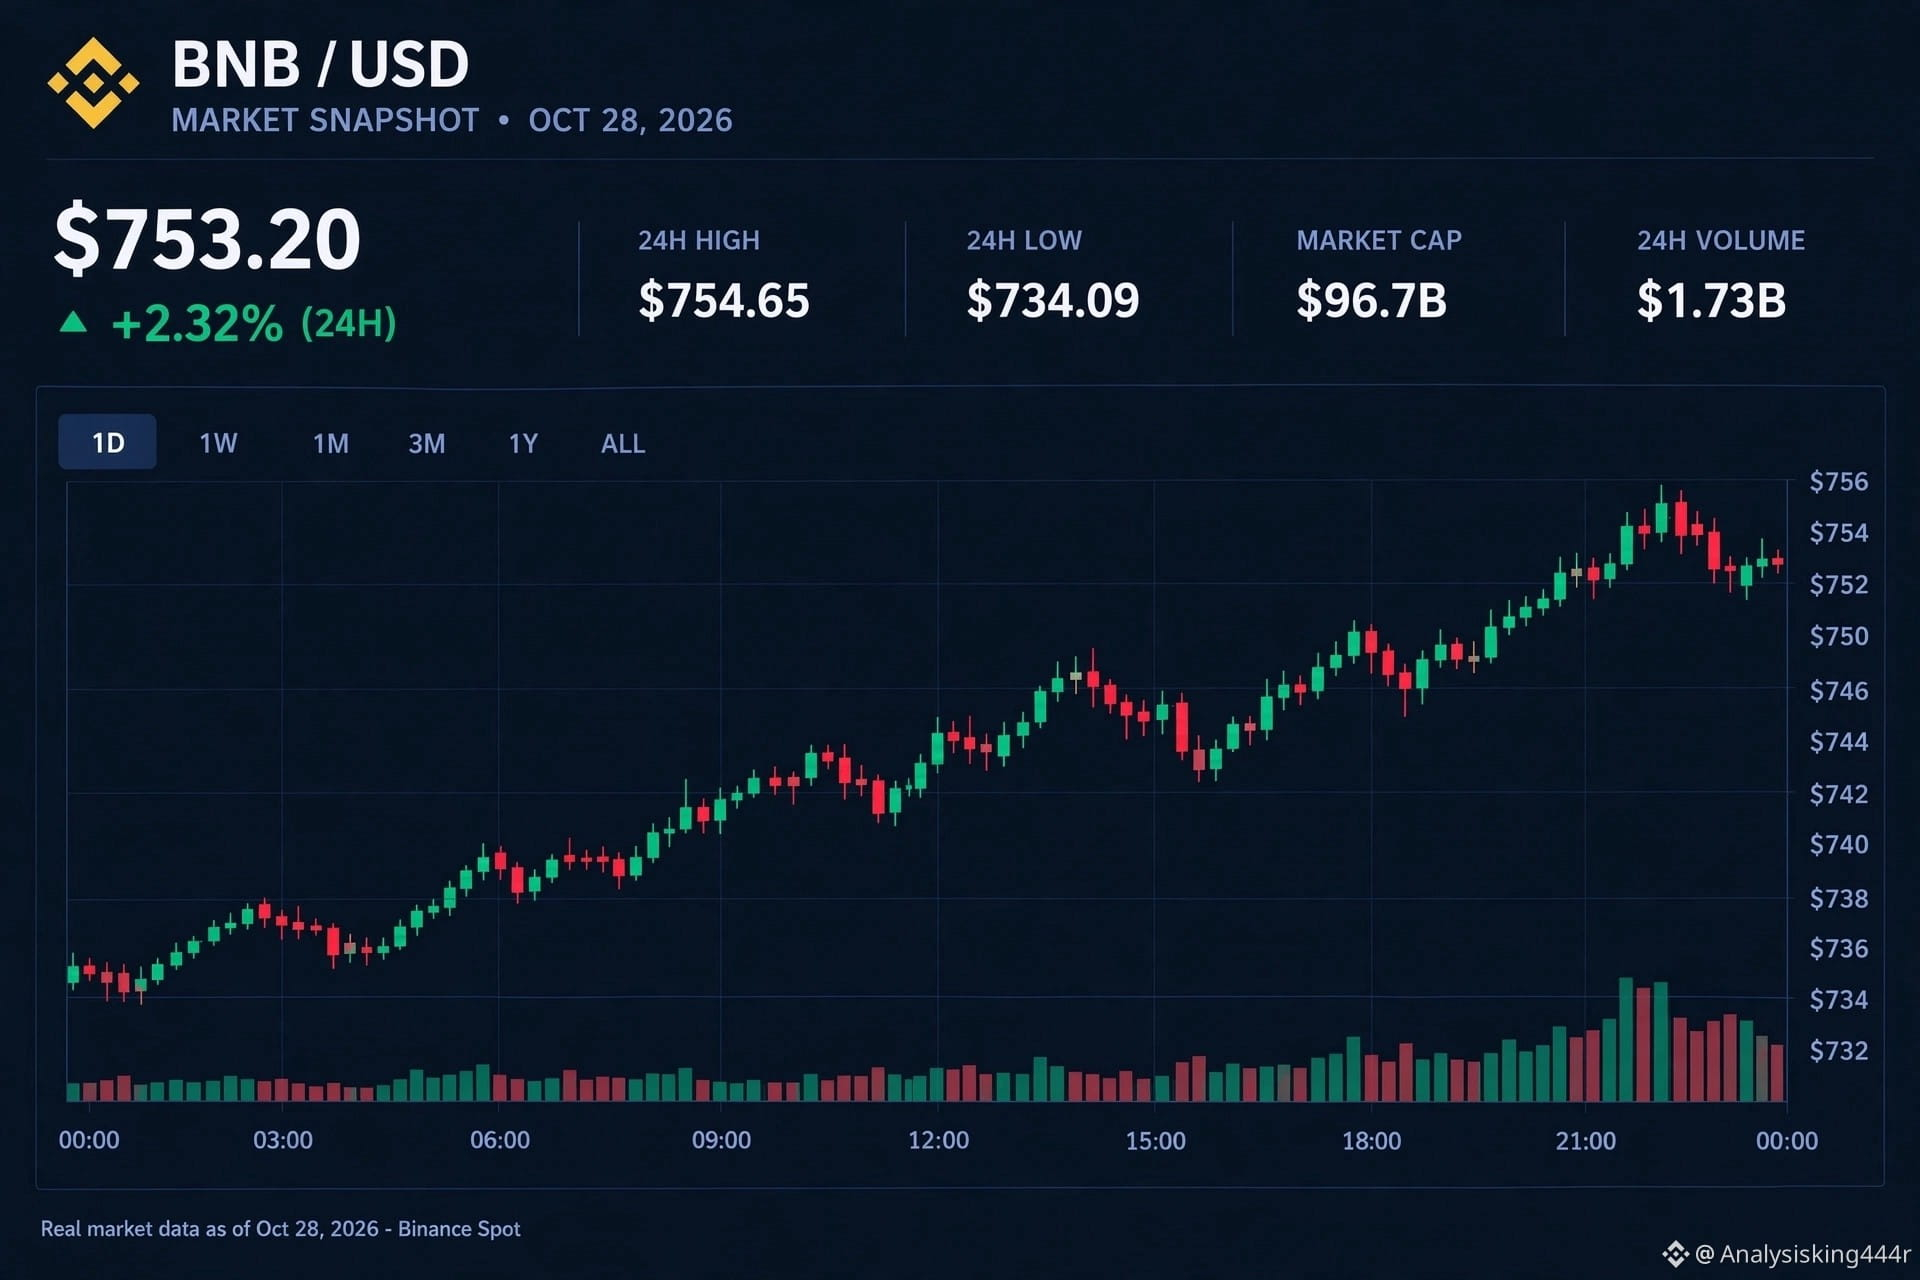
$BNB デイリーチェックイン 📊
$BNB は現在$753.20で取引されており、過去24時間で2.32%上昇。チャートも堅調に見えます。
注目している重要な価格帯:
🟢 サポート:$750、次いで$744~$746
🔴 レジスタンス:$754~$756(過去24時間の高値ゾーン)
直近のローソク足は小さく、方向感に欠けています。$752~$753付近で赤と緑が入り混じっています。これはレジスタンスの下でのもみ合いに見えます。出来高を伴って$756を明確に上抜ければ、さらに上昇する可能性があります。$750を割り込めば、$746を再び試す展開も不思議ではありません。
市場スナップショット:時価総額$96.7B、過去24時間の取引高$1.73B。流動性は十分です。
モメンタムは強気ですが、価格はちょうどレジスタンスに差し掛かっています。ここでは追いかけるより、じっくり待つほうがよさそうです。ブレイクアウトが確認されるのを待ちましょう。
あなたはどう見ますか?先に上抜け、それとも押し目? 👇
投資助言ではありません。必ずご自身で調査し、リスクを管理してください。
#BNB #Binance #暗号資産分析 #BinanceSquare
$BNB デイリーチェックイン 📊
$BNB は現在$753.20で取引されており、過去24時間で2.32%上昇。チャートも堅調に見えます。
注目している重要な価格帯:
🟢 サポート:$750、次いで$744~$746
🔴 レジスタンス:$754~$756(過去24時間の高値ゾーン)
直近のローソク足は小さく、方向感に欠けています。$752~$753付近で赤と緑が入り混じっています。これはレジスタンスの下でのもみ合いに見えます。出来高を伴って$756を明確に上抜ければ、さらに上昇する可能性があります。$750を割り込めば、$746を再び試す展開も不思議ではありません。
市場スナップショット:時価総額$96.7B、過去24時間の取引高$1.73B。流動性は十分です。
モメンタムは強気ですが、価格はちょうどレジスタンスに差し掛かっています。ここでは追いかけるより、じっくり待つほうがよさそうです。ブレイクアウトが確認されるのを待ちましょう。
あなたはどう見ますか?先に上抜け、それとも押し目? 👇
投資助言ではありません。必ずご自身で調査し、リスクを管理してください。
#BNB #Binance #暗号資産分析 #BinanceSquare
$BNB は現在$753.20で取引されており、過去24時間で2.32%上昇。チャートも堅調に見えます。
注目している重要な価格帯:
🟢 サポート:$750、次いで$744~$746
🔴 レジスタンス:$754~$756(過去24時間の高値ゾーン)
直近のローソク足は小さく、方向感に欠けています。$752~$753付近で赤と緑が入り混じっています。これはレジスタンスの下でのもみ合いに見えます。出来高を伴って$756を明確に上抜ければ、さらに上昇する可能性があります。$750を割り込めば、$746を再び試す展開も不思議ではありません。
市場スナップショット:時価総額$96.7B、過去24時間の取引高$1.73B。流動性は十分です。
モメンタムは強気ですが、価格はちょうどレジスタンスに差し掛かっています。ここでは追いかけるより、じっくり待つほうがよさそうです。ブレイクアウトが確認されるのを待ちましょう。
あなたはどう見ますか?先に上抜け、それとも押し目? 👇
投資助言ではありません。必ずご自身で調査し、リスクを管理してください。
#BNB #Binance #暗号資産分析 #BinanceSquare
70
😂🐶 すべての暗号資産トレーダーの物語をひとつのミームに!
高値で買い 📈、暴落を見届け 📉、ちょっとパニックになり 😭、そしてこう言う…「長期保有するんだ!」💎🙌
これがDOGE投資家の日常!🚀 月に届くのは、私たちの希望だけってこともある。😂🌕
正直に言ってみて。最高値でコインを買って、自分のことを長期投資家って呼んだことある?🤣👇
ただのミームです。投資助言ではありません 🙌
#Dogecoin #DOGE #CryptoMemes #CryptoCommunity #BinanceSquare #HODL #CryptoTrading
😂🐶 すべての暗号資産トレーダーの物語をひとつのミームに!
高値で買い 📈、暴落を見届け 📉、ちょっとパニックになり 😭、そしてこう言う…「長期保有するんだ!」💎🙌
これがDOGE投資家の日常!🚀 月に届くのは、私たちの希望だけってこともある。😂🌕
正直に言ってみて。最高値でコインを買って、自分のことを長期投資家って呼んだことある?🤣👇
ただのミームです。投資助言ではありません 🙌
#Dogecoin #DOGE #CryptoMemes #CryptoCommunity #BinanceSquare #HODL #CryptoTrading
高値で買い 📈、暴落を見届け 📉、ちょっとパニックになり 😭、そしてこう言う…「長期保有するんだ!」💎🙌
これがDOGE投資家の日常!🚀 月に届くのは、私たちの希望だけってこともある。😂🌕
正直に言ってみて。最高値でコインを買って、自分のことを長期投資家って呼んだことある?🤣👇
ただのミームです。投資助言ではありません 🙌
#Dogecoin #DOGE #CryptoMemes #CryptoCommunity #BinanceSquare #HODL #CryptoTrading

112
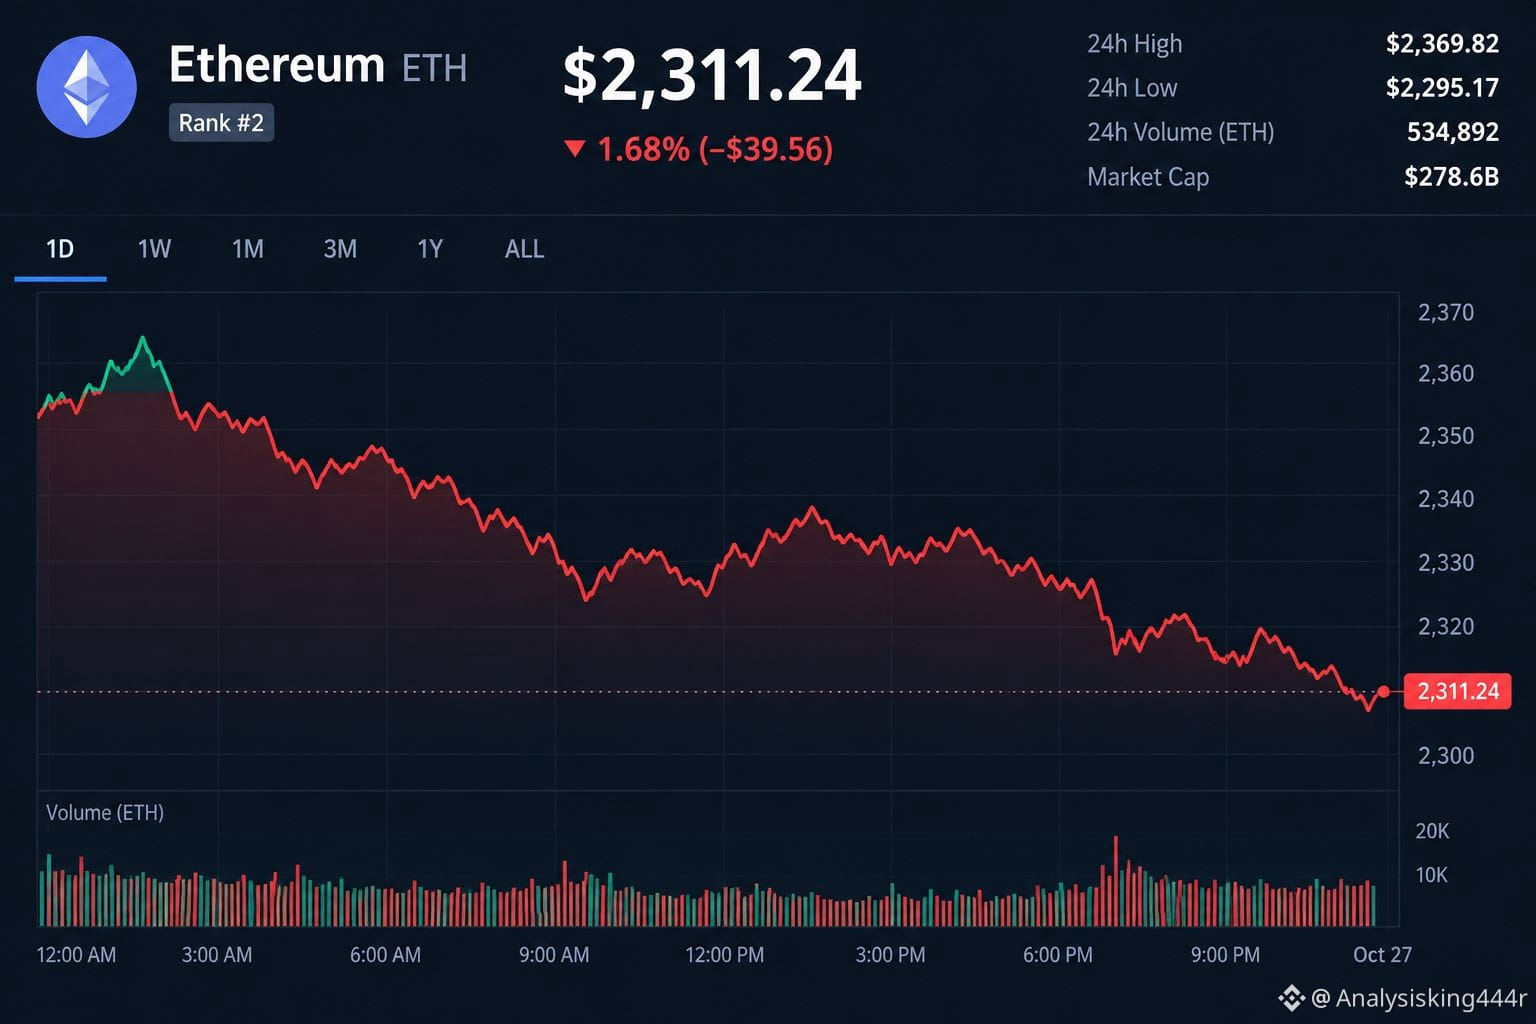
$ETH
ETHは高値と安値を切り下げています。これは通常、売り手が優勢であることを意味します。
2,300ドルは注目すべき重要な水準です。ETHがこの水準付近を維持して回復し始めれば、買い手が下値を固めようとしている可能性があります。明確に下抜ければ、売り圧力が強まるかもしれません。
反発したからといって、必ずしもトレンド転換とは限りません。回復と判断するには、ETHがレジスタンスを上抜けて、その水準を維持するのを確認したいところです。
$ETH
ETHは高値と安値を切り下げています。これは通常、売り手が優勢であることを意味します。
2,300ドルは注目すべき重要な水準です。ETHがこの水準付近を維持して回復し始めれば、買い手が下値を固めようとしている可能性があります。明確に下抜ければ、売り圧力が強まるかもしれません。
反発したからといって、必ずしもトレンド転換とは限りません。回復と判断するには、ETHがレジスタンスを上抜けて、その水準を維持するのを確認したいところです。
ETHは高値と安値を切り下げています。これは通常、売り手が優勢であることを意味します。
2,300ドルは注目すべき重要な水準です。ETHがこの水準付近を維持して回復し始めれば、買い手が下値を固めようとしている可能性があります。明確に下抜ければ、売り圧力が強まるかもしれません。
反発したからといって、必ずしもトレンド転換とは限りません。回復と判断するには、ETHがレジスタンスを上抜けて、その水準を維持するのを確認したいところです。
137
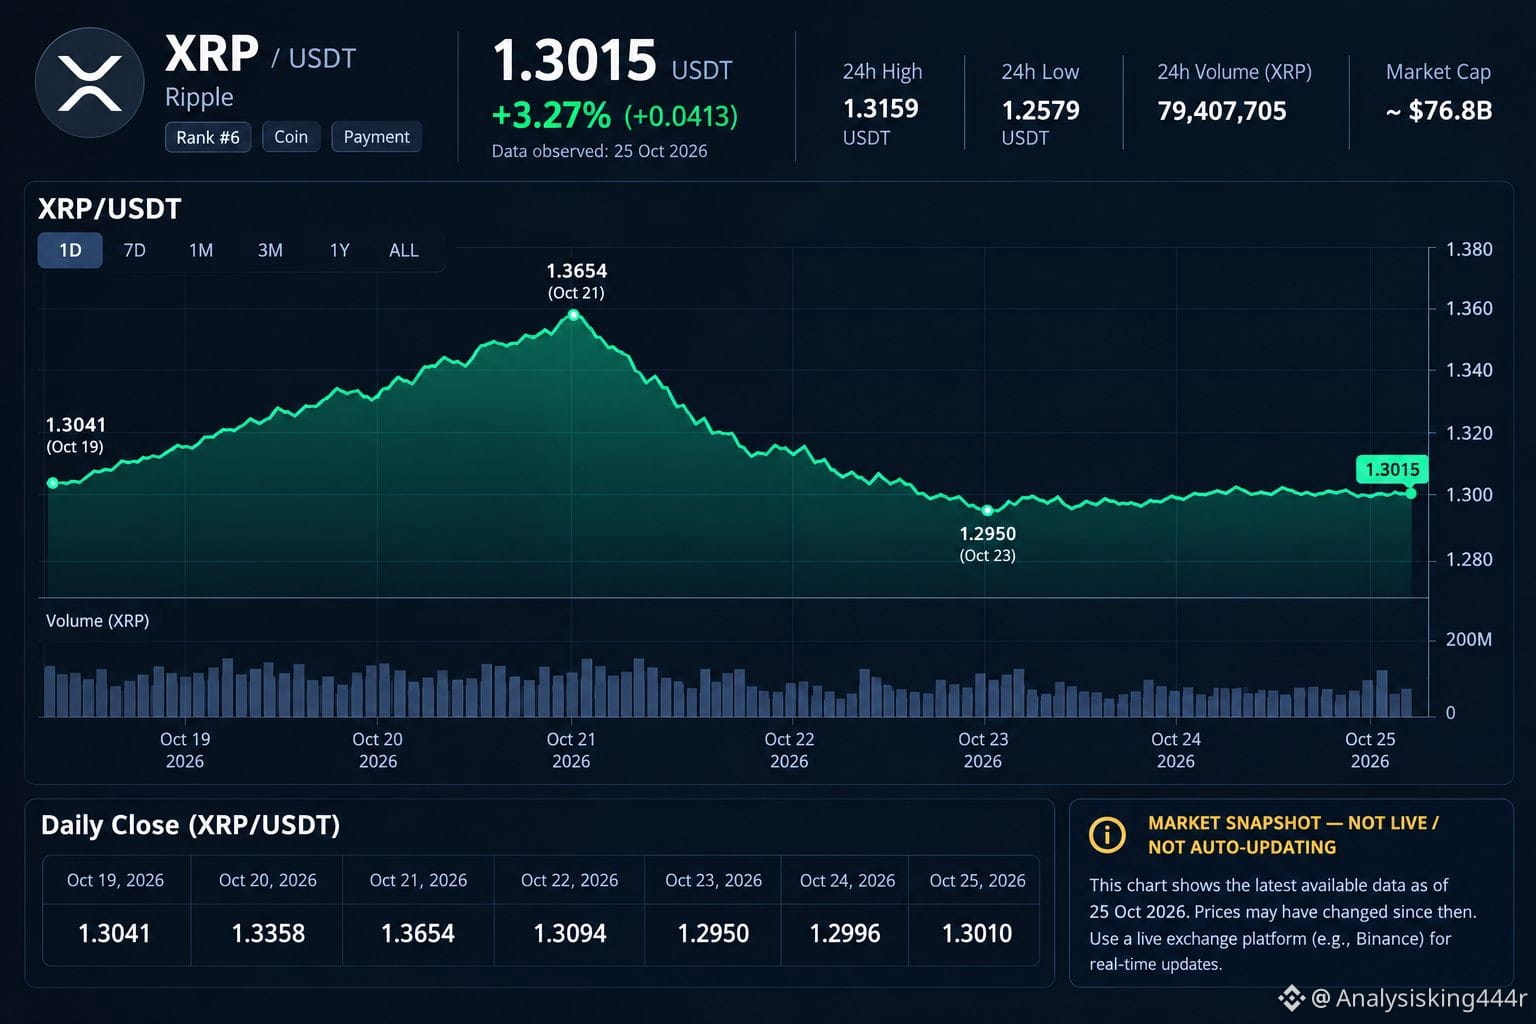
$XRP
XRPは小幅な回復の兆しを見せていますが、まだ強気への反転が確定したとは言えません。
$XRP
XRPは小幅な回復の兆しを見せていますが、まだ強気への反転が確定したとは言えません。
XRPは小幅な回復の兆しを見せていますが、まだ強気への反転が確定したとは言えません。
220
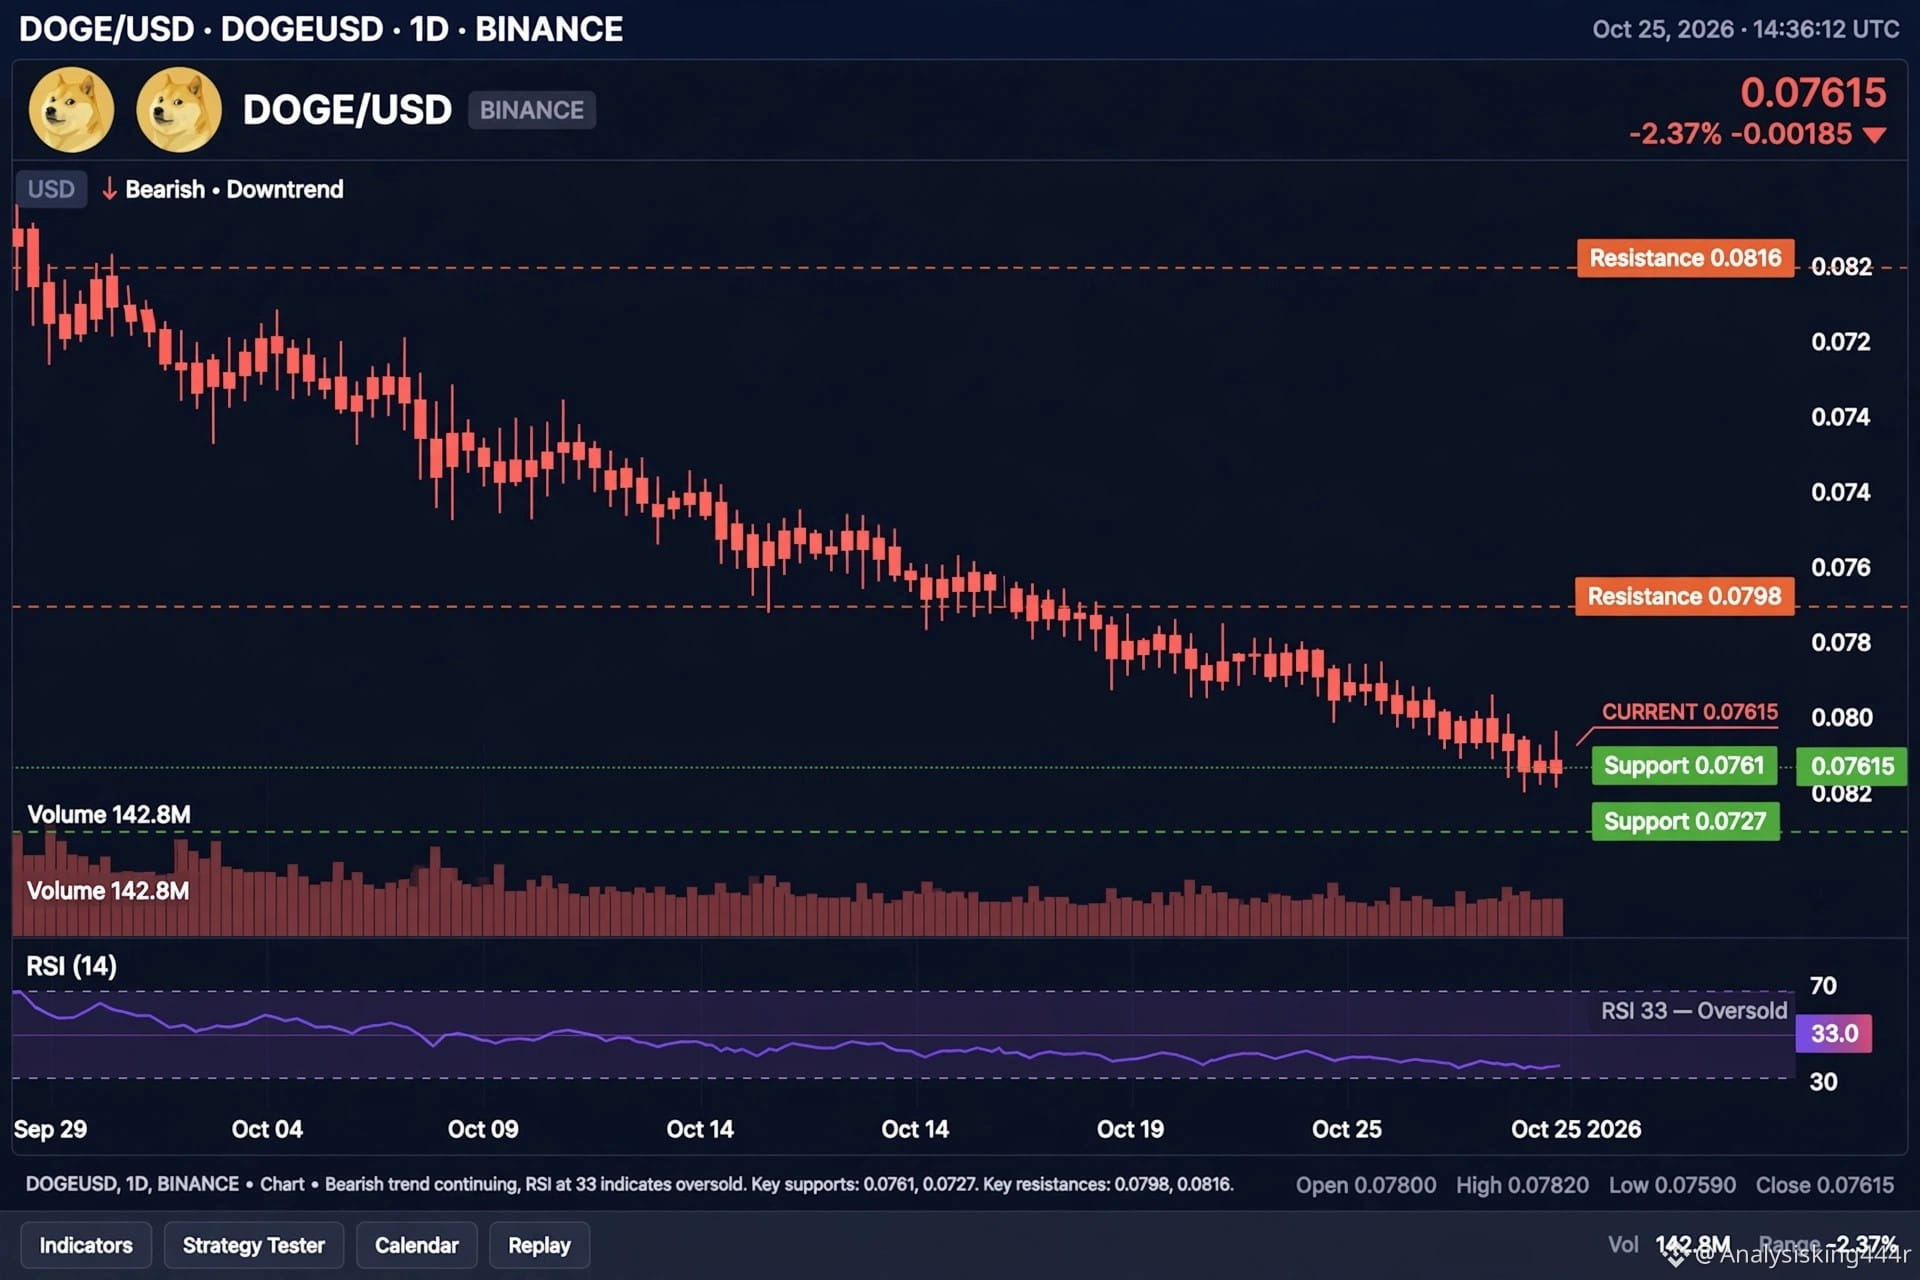
$DOGE
DOGEは本日0.076ドルで、やや弱含みです。
正直なところ、今は売り手が主導権を握っており、すべての移動平均線を下回って取引されています。
0.08ドルを再び上回れば、0.084ドルまで反発する可能性を考えられます。
一方、0.076ドルを割り込むと、0.072ドルまで下落する可能性が高そうです。
今は様子見しています。焦って飛びつく必要はありません。
$DOGE
DOGEは本日0.076ドルで、やや弱含みです。
正直なところ、今は売り手が主導権を握っており、すべての移動平均線を下回って取引されています。
0.08ドルを再び上回れば、0.084ドルまで反発する可能性を考えられます。
一方、0.076ドルを割り込むと、0.072ドルまで下落する可能性が高そうです。
今は様子見しています。焦って飛びつく必要はありません。
DOGEは本日0.076ドルで、やや弱含みです。
正直なところ、今は売り手が主導権を握っており、すべての移動平均線を下回って取引されています。
0.08ドルを再び上回れば、0.084ドルまで反発する可能性を考えられます。
一方、0.076ドルを割り込むと、0.072ドルまで下落する可能性が高そうです。
今は様子見しています。焦って飛びつく必要はありません。
403
翻訳参照
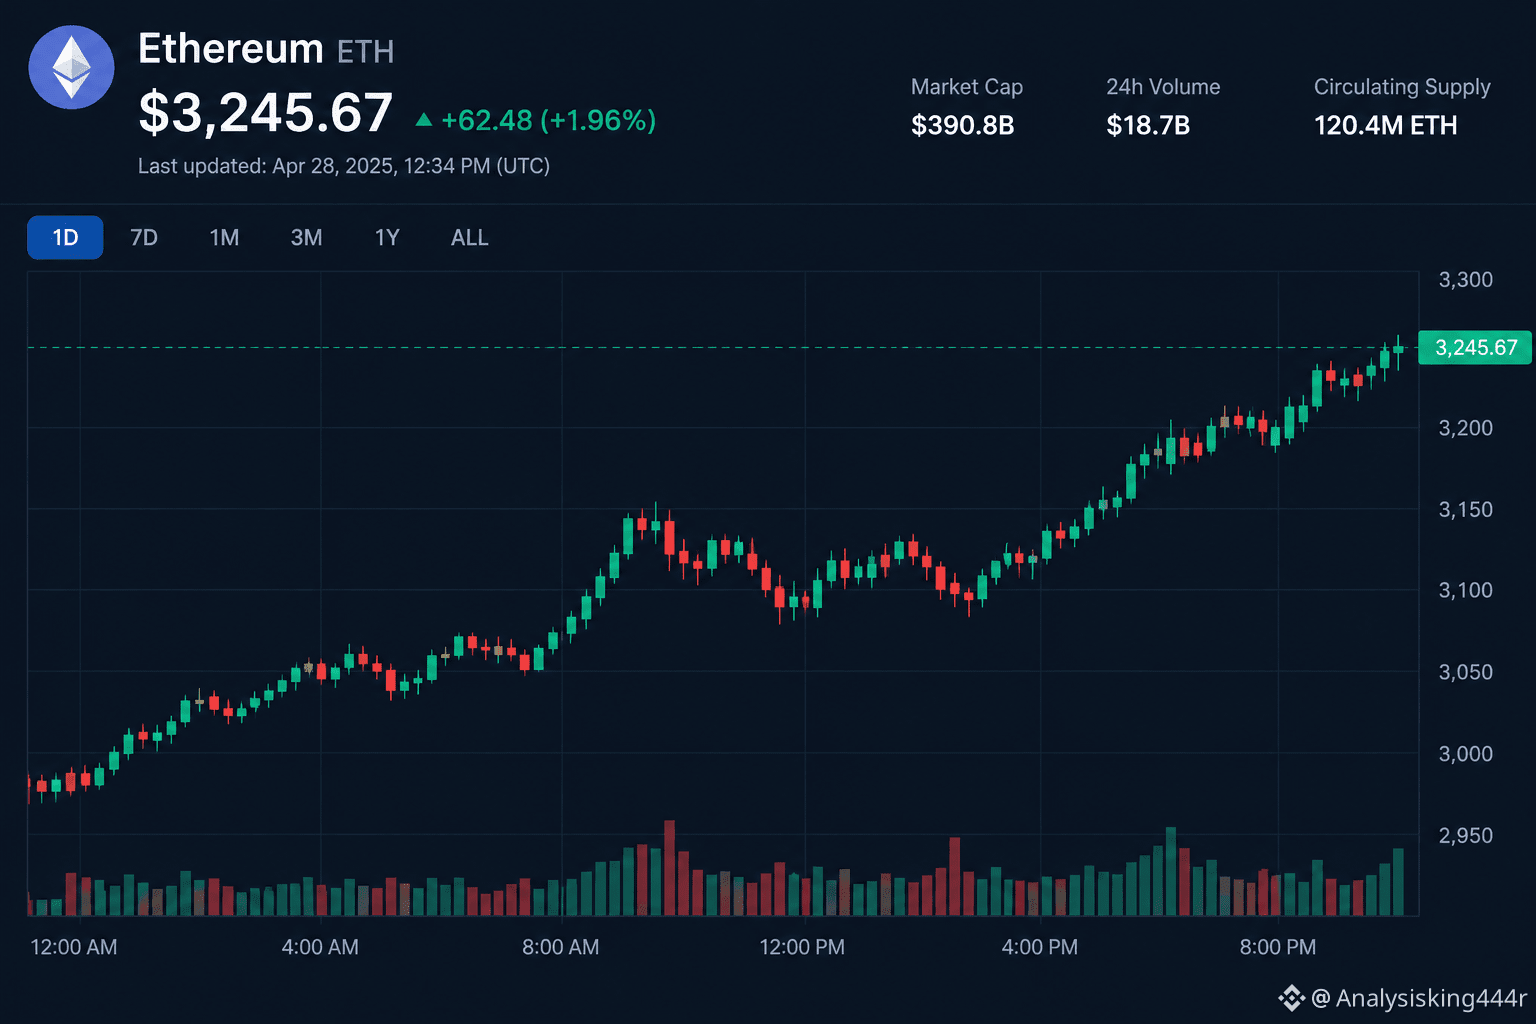
$ETH
Ethereum is showing a mixed technical structure, with short-term selling pressure still present while buyers attempt to defend important support levels.
According to recent market data, ETH was trading around $2,400, with price action suggesting that confirmation is more important than trying to predict the next move.
A confirmed daily close above $2,435, supported by stronger trading volume, could open the way toward $2,500 and potentially higher levels.
$ETH
Ethereum is showing a mixed technical structure, with short-term selling pressure still present while buyers attempt to defend important support levels.
According to recent market data, ETH was trading around $2,400, with price action suggesting that confirmation is more important than trying to predict the next move.
A confirmed daily close above $2,435, supported by stronger trading volume, could open the way toward $2,500 and potentially higher levels.
Ethereum is showing a mixed technical structure, with short-term selling pressure still present while buyers attempt to defend important support levels.
According to recent market data, ETH was trading around $2,400, with price action suggesting that confirmation is more important than trying to predict the next move.
A confirmed daily close above $2,435, supported by stronger trading volume, could open the way toward $2,500 and potentially higher levels.
66
翻訳参照
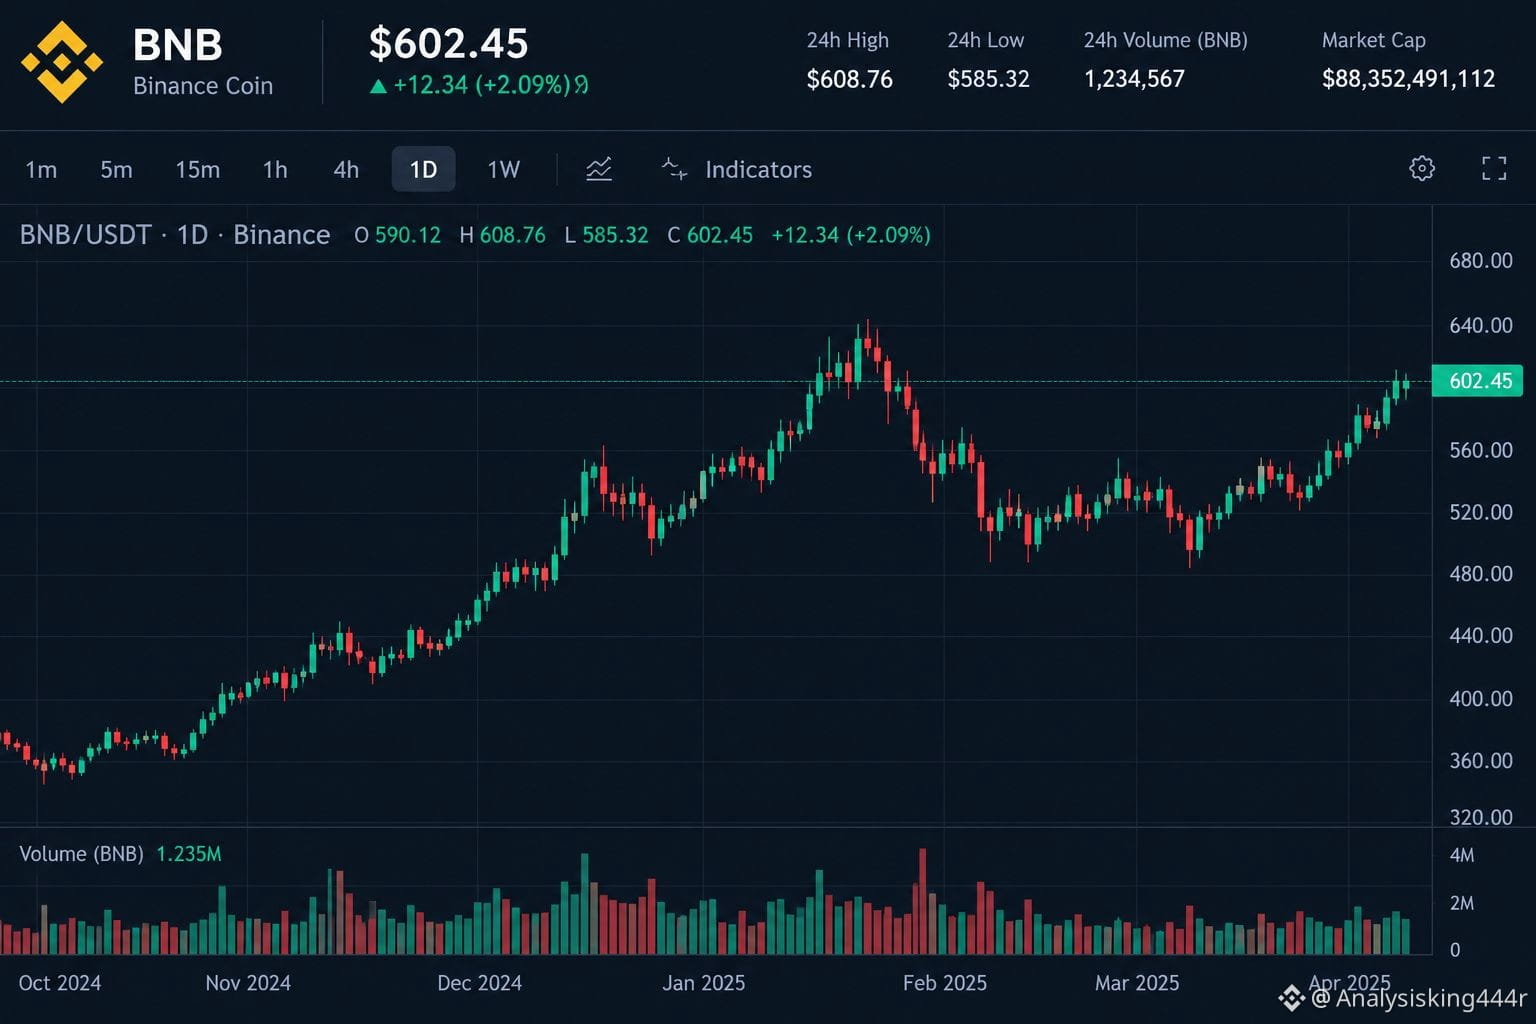
$BNB
BNB is trading around $743–$744 in the latest report available today. The price is below its 20-day and 50-day simple moving averages, which suggests that short-term buying strength is not yet firmly established.
The overall picture is mixed. BNB has shown strength over a longer period, but its recent price action suggests consolidation rather than a confirmed new rally. This means buyers and sellers are still competing to determine the next direction.
$BNB
BNB is trading around $743–$744 in the latest report available today. The price is below its 20-day and 50-day simple moving averages, which suggests that short-term buying strength is not yet firmly established.
The overall picture is mixed. BNB has shown strength over a longer period, but its recent price action suggests consolidation rather than a confirmed new rally. This means buyers and sellers are still competing to determine the next direction.
BNB is trading around $743–$744 in the latest report available today. The price is below its 20-day and 50-day simple moving averages, which suggests that short-term buying strength is not yet firmly established.
The overall picture is mixed. BNB has shown strength over a longer period, but its recent price action suggests consolidation rather than a confirmed new rally. This means buyers and sellers are still competing to determine the next direction.
72
翻訳参照
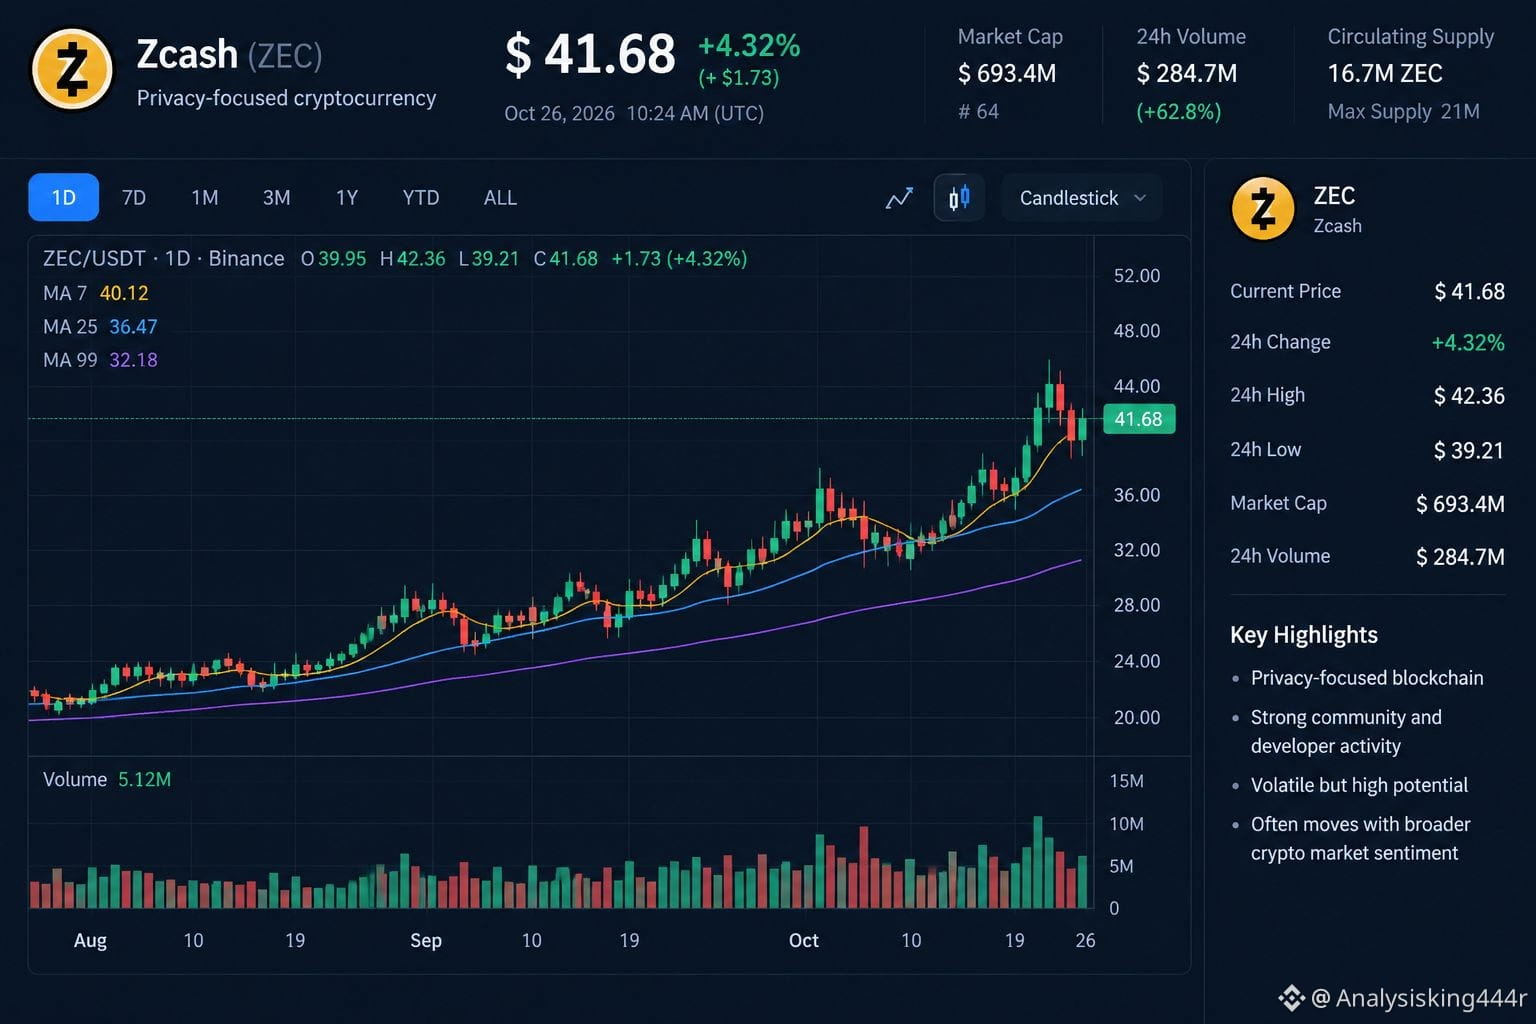
$ZEC
ZEC's recovery has been substantial, but buying immediately after a sharp rally exposes you to a pullback. I would watch the $1,360–1,380 region for a breakout and the $1,250–1,280 region for evidence that buyers are defending support. These levels need to be recalculated against the current Binance chart before placing a trade.
Zcash's privacy-focused technology and upcoming network developments can influence sentiment, but technical levels and catalysts do not guarantee price appreciation.
$ZEC
ZEC's recovery has been substantial, but buying immediately after a sharp rally exposes you to a pullback. I would watch the $1,360–1,380 region for a breakout and the $1,250–1,280 region for evidence that buyers are defending support. These levels need to be recalculated against the current Binance chart before placing a trade.
Zcash's privacy-focused technology and upcoming network developments can influence sentiment, but technical levels and catalysts do not guarantee price appreciation.
ZEC's recovery has been substantial, but buying immediately after a sharp rally exposes you to a pullback. I would watch the $1,360–1,380 region for a breakout and the $1,250–1,280 region for evidence that buyers are defending support. These levels need to be recalculated against the current Binance chart before placing a trade.
Zcash's privacy-focused technology and upcoming network developments can influence sentiment, but technical levels and catalysts do not guarantee price appreciation.
428
ログインして、さらにコンテンツを読む
厳選トピックで世界の暗号資産トレーダーの仲間入り
⚡️ 暗号資産に関する最新かつ有益な情報が見つかります。
💬 世界最大の暗号資産取引所から信頼されています。
👍 認証を受けたクリエイターから、有益なインサイトを得られます。
メール / 電話番号