

ch khizar998
21 投稿

ch khizar998
報告
ユーザーをブロック
4 フォロー
5 フォロワー
35 いいね
投稿
·
--
$BTC
🚀 BTC/USDT 市場シグナル
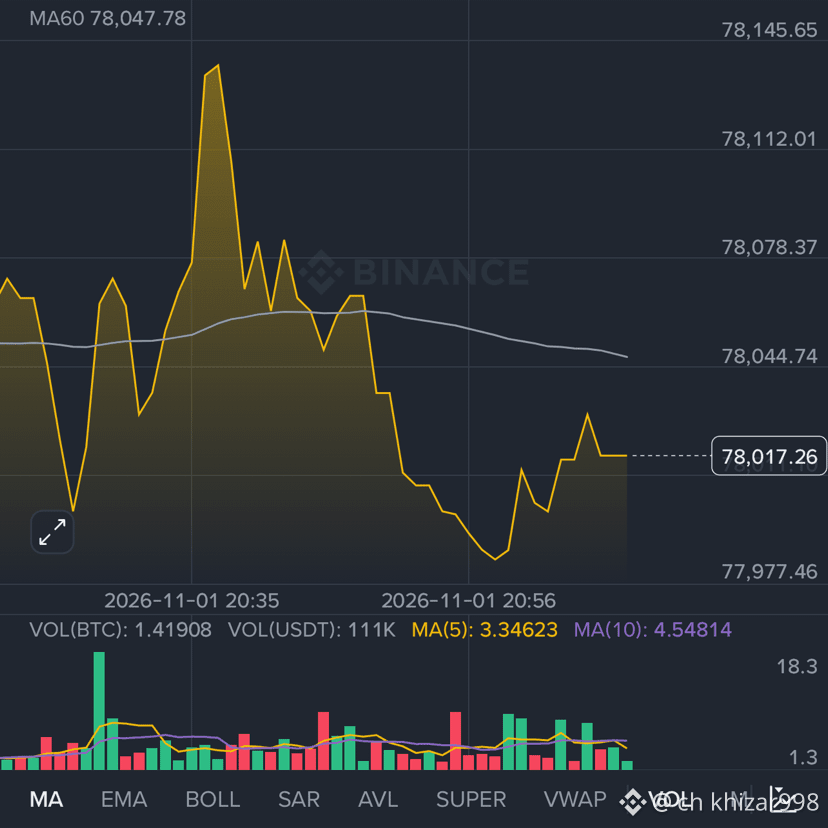
ビットコインは、最近の下落後、短期的な回復の兆しを見せています。BTCは現在、78,017.25 USDT(+0.50%)付近で取引されています。
📊 市場概要
* 現在価格:78,017.25 USDT
* 24時間高値:78,285 USDT
* 24時間安値:77,450 USDT
* 日次変動:+0.50%
📈 テクニカル分析
BTCは77,977のサポートゾーンを試した後、回復を試みています。しかし、価格は78,047付近のMA60を下回っており、強気の勢いが続くにはさらなる確認が必要です。
🟢 強気シナリオ
78,045~78,080を上抜ければ、78,112、さらに78,145を目指す展開が期待できます。
こちらから取引
#WithdrawalsBack: 15 networks live
1
80
·
--
翻訳参照
$BAT
🚨 BAT/USDT MARKET SIGNAL 🚨
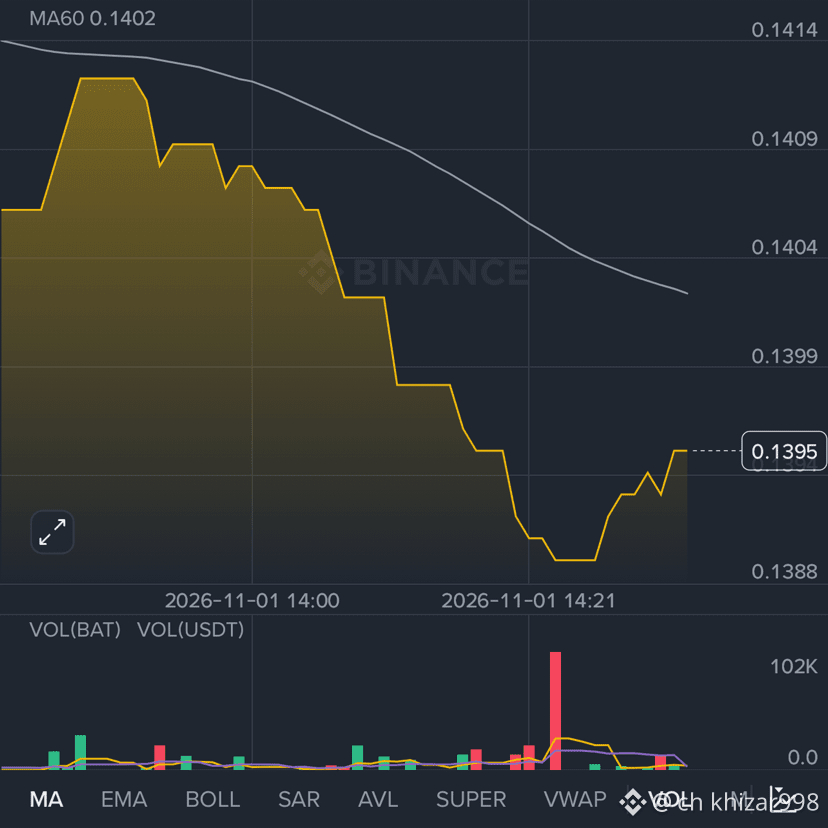
🟢 Current Price: 0.1395 USDT
📈 24H Change: +6.33%
📊 24H High: 0.1460
📉 24H Low: 0.1303
🔥 Market Analysis:
BAT is showing strong gains over the last 24 hours, but short-term price action indicates selling pressure. The price is currently attempting a recovery after a sharp decline.
📍 Key Levels:
* Resistance: 0.1402 – 0.1409
* Support: 0.1388 – 0.1390
* Breakout above 0.1409 may indicate bullish momentum.
* A breakdown below 0.1388 could bring further downside.
🎯 Trading Strategy:
Wait for confirmation before entering a trade. Monitor volume and price action around key levels.
Trade here
#BinanceHadAlreadyCovered$6BofHackLoss
157
·
--
翻訳参照
$BCH
🚀 BCH/USDT SIGNAL UPDATE 🚀
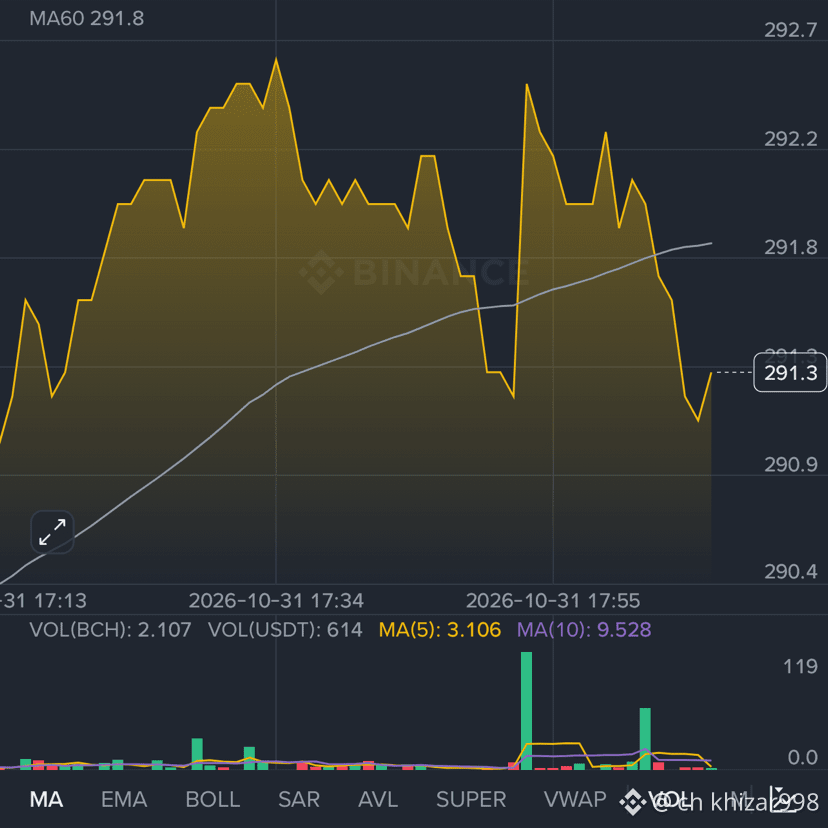
💰 Current Price: 291.3 USDT
📈 24H Change: +2.46%
🔝 24H High: 297.9
🔻 24H Low: 283.2
📊 Market Outlook:
BCH is holding above the 290.9 support zone after a recent pullback. Buyers are attempting to regain momentum, but confirmation is still needed.
🎯 Key Levels
🟢 Support: 290.9 – 290.4
🔴 Resistance: 291.8 – 292.2
🚀 Breakout Zone: Above 292.2
📈 Bullish Scenario:
A confirmed breakout above 292.2 could open the way toward 293.0 and 294.0.
Trade here
#CZSaysCompensationIsinPlaceUsersAreProtected
1
234
·
--
翻訳参照
$AAVE
AAVE/USDT — BULLISH MOMENTUM! 📈
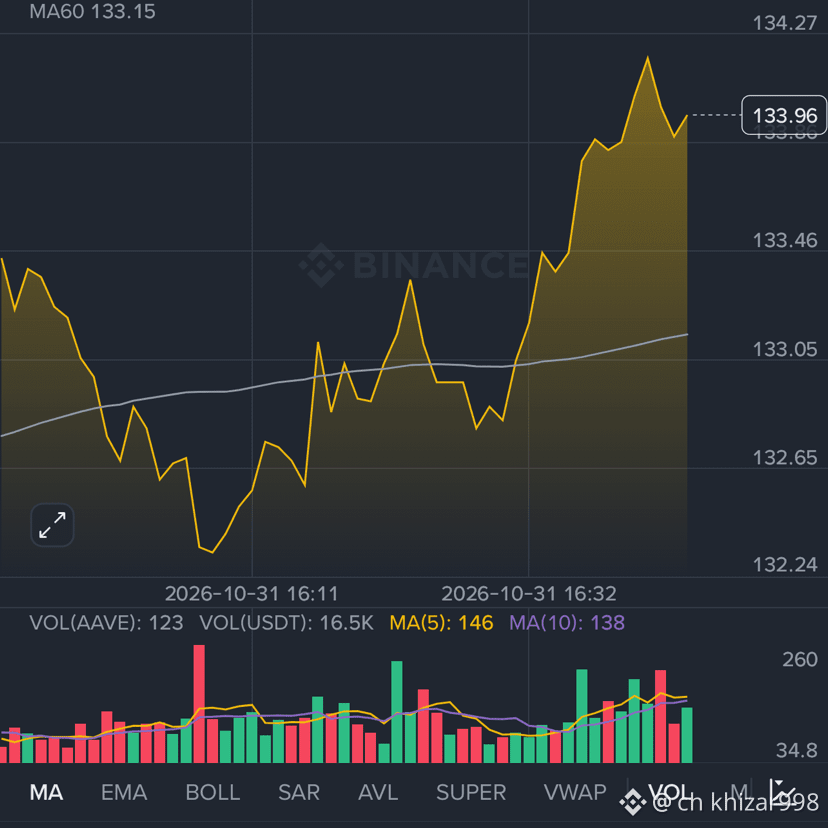
AAVE is showing strong upward momentum, currently trading at 133.96 USDT (+6.82%).
🔥 Market Update
💰 Current Price: 133.96 USDT
📈 24H High: 134.18 USDT
📉 24H Low: 123.06 USDT
🟢 Buyers are showing strength
⚡ Price is trading above MA60
🎯 Key Levels
Resistance: 134.18 – 134.50
Support: 133.05 – 132.65
📊 A breakout above 134.18 could bring further upside momentum, while a rejection may lead to a short-term pullback.
Trade here
#BinanceReports80%Recoveryof$6.3BillioninLossesfromHackIncident
1
110
·
--
翻訳参照
$RENDER
🚀 RENDER/USDT MARKET UPDATE 📊
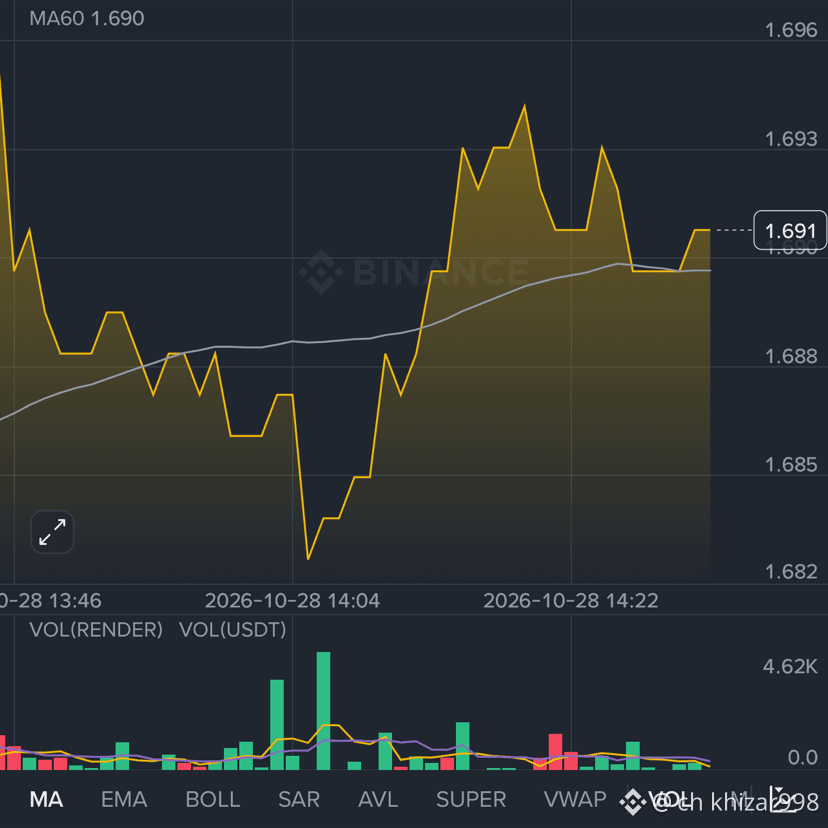
🟢 Current Price: $1.691 (+1.14%)
🔥 BULLISH MOMENTUM BUILDING!
📈 RENDER is showing signs of recovery after bouncing from the $1.682 support zone. Buyers are stepping in, and the price is holding near $1.691.
🎯 Key Levels to Watch
🟢 Support: $1.688 – $1.682
🔴 Resistance: $1.693 – $1.696
Trade here
#EarningsSeason
2
238
·
--
翻訳参照
$IO
🚀 IO/USDT MARKET UPDATE 🚀
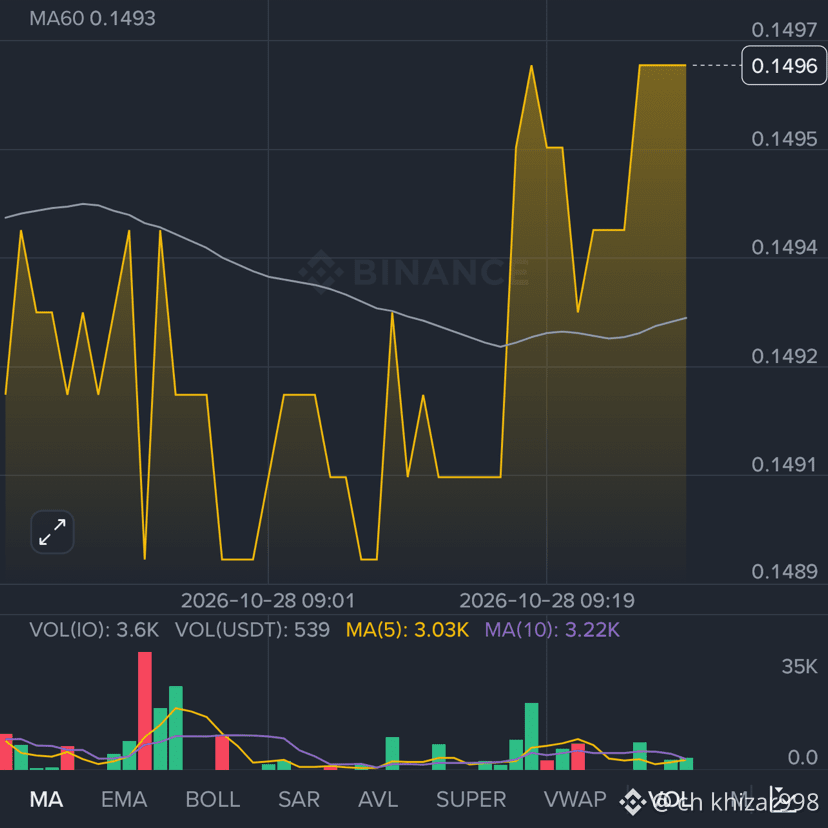
🟢 Current Price: $0.1496 (+4.32%)
📈 Bullish Momentum Building!
🔥 IO is showing strong short-term buying pressure, with price pushing toward the $0.1500 resistance zone. Trading Insight: A sustained move above $0.1500 could open the door toward $0.1527. Rejection near resistance may bring a pullback toward support.
Trade here
#FOMCWatch
4
450
·
--
翻訳参照
$FIDA
🚀 FIDA/USDT SIGNAL UPDATE 🚀
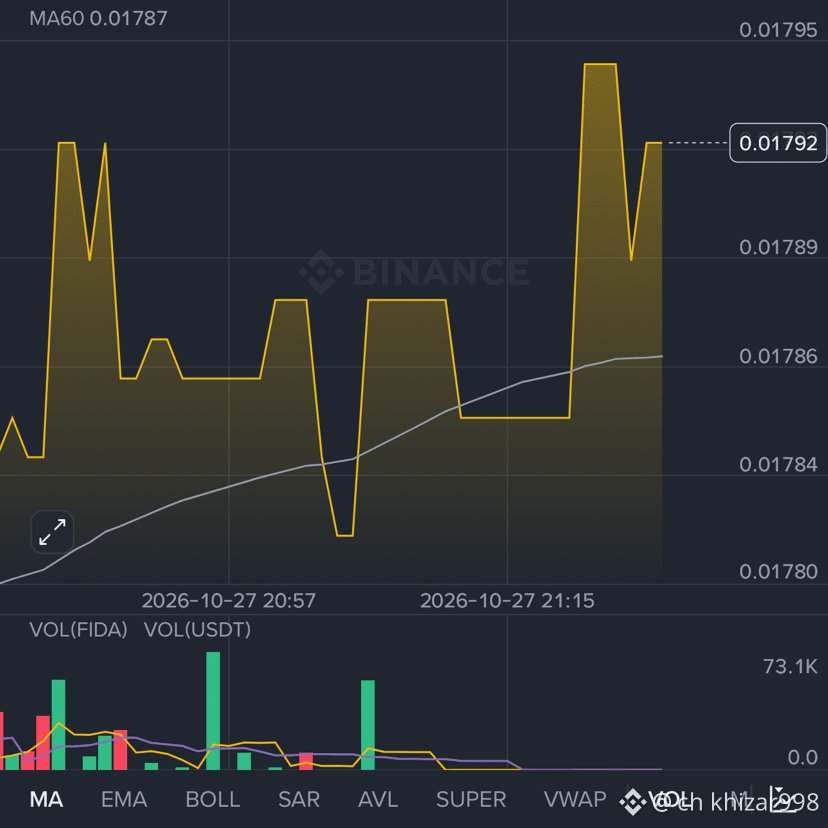
🟢 Current Price: 0.01792 USDT
📈 24H Change: +1.36%
📊 24H High: 0.01794
📉 24H Low: 0.01738
🔍 Market Analysis:
FIDA is showing short-term bullish momentum and trading above its MA60 (0.01787). Buyers currently have the advantage, but resistance near 0.01794–0.01795 needs to be broken for further upside.
🎯 Key Levels:
* 🟢 Resistance: 0.01794–0.01795
* 🔵 Support: 0.01787
* 🟡 Lower Support: 0.01784–0.01780
Trade here
#FOMCWatch
2
411
·
--
翻訳参照
$W
🚀 W/USDT (WORMHOLE) — MARKET SIGNAL 🔥
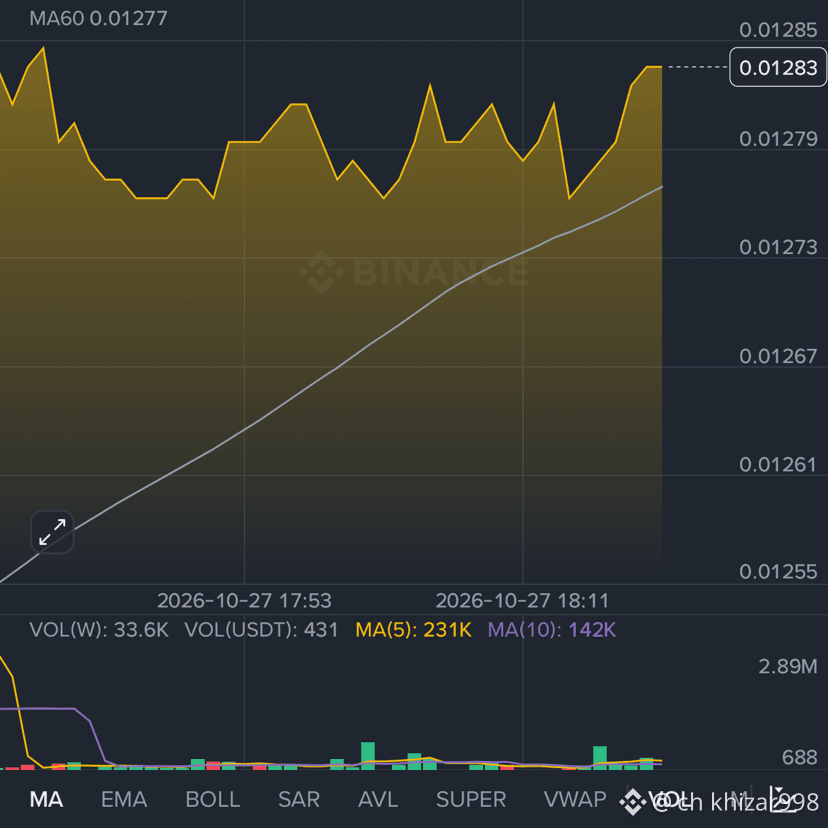
💰 Current Price: $0.01283
📈 24H Change: +7.36%
⬆️ 24H High: $0.01297
⬇️ 24H Low: $0.01186
📊 Technical Analysis
W/USDT is showing short-term bullish momentum and trading above the MA60 ($0.01277). Buyers currently have an advantage, but resistance near $0.01285–$0.01297 needs to be cleared for further upside.
🎯 Key Levels
🟢 Support: $0.01277 – $0.01273
🔴 Resistance: $0.01285 – $0.01297
Trade here
#FOMCWatch
2
408
·
--
翻訳参照
$ETH
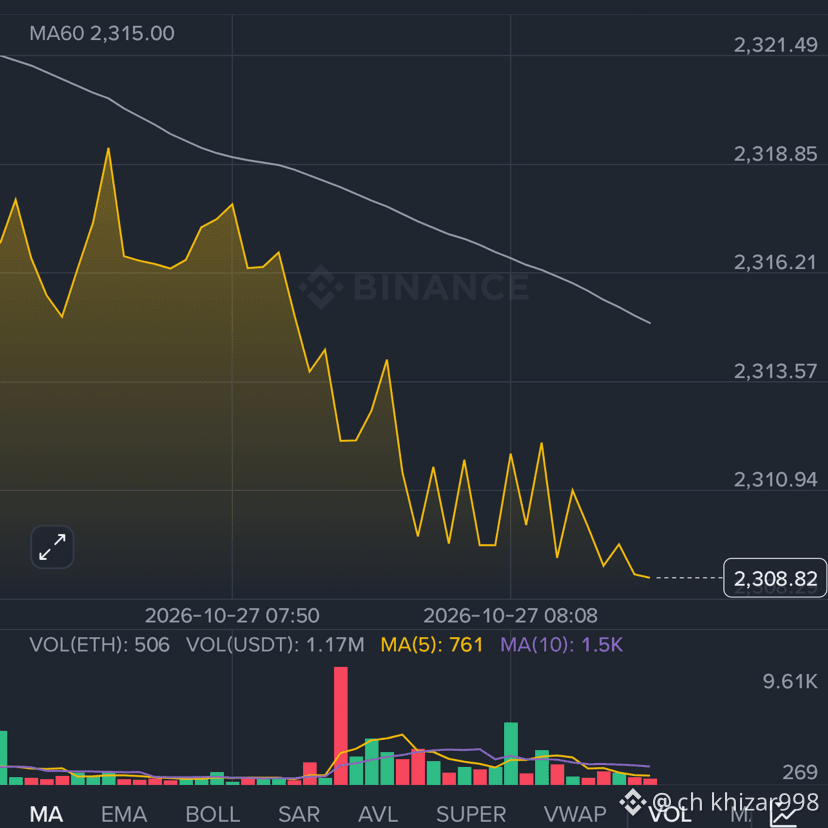
📉 ETH/USDT MARKET UPDATE 🔥
🔴 Current Price: $2,308.82
📉 Market Trend: Bearish Pressure
📊 24H High: $2,343.79
📊 24H Low: $2,292.00
🔍 Technical Analysis:
• ETH is trading below the MA60, indicating short-term bearish momentum.
• Sellers are controlling the recent price movement.
• Order book shows 58.83% buy pressure vs. 41.17% sell pressure.
• Key support zone: $2,300–$2,292.
• Resistance zone: $2,315–$2,320.
Trade here
#EarningsSeason
2
92
·
--
$ETH
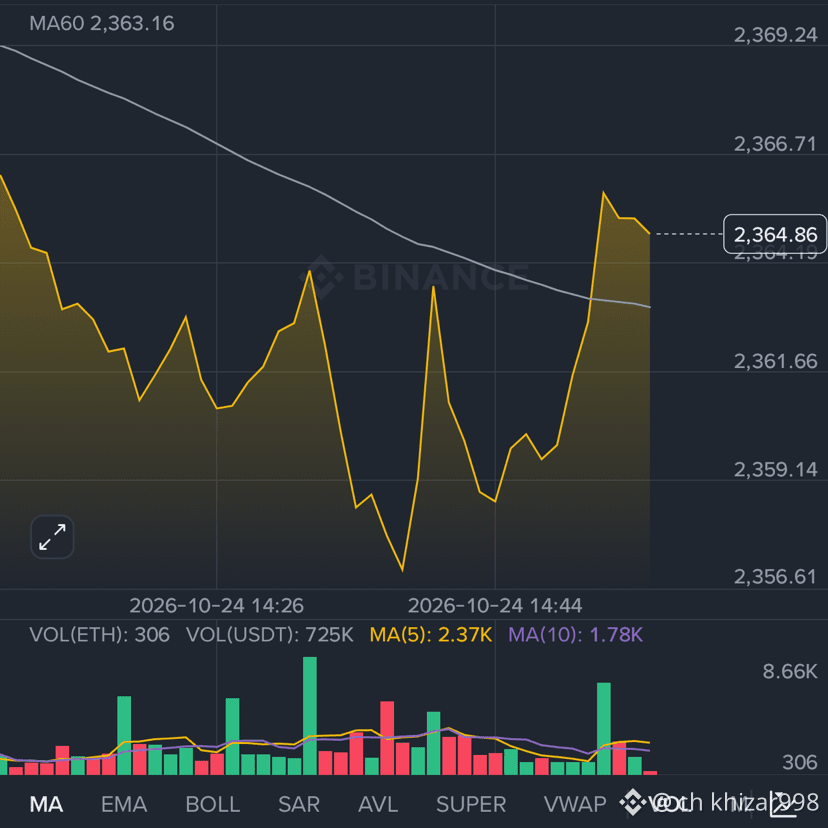
🚨 ETHUSDT 市場アップデート 🚨
📊 現在価格: $2,364.86
🔴 24時間変動率: -1.42%
📉 市場分析:
ETHは$2,356付近まで下落した後、短期的な回復を見せています。買い手が入り始めていますが、上値には依然として抵抗があります。
🎯 重要な価格帯
🟢 レジスタンス: $2,366 – $2,370
🔴 サポート: $2,359 – $2,356
📈 取引戦略
🟢 ロング: $2,370を上抜けたことが確認された場合のみ
こちらで取引
#BinancePick
$ETH
🚨 ETHUSDT 市場アップデート 🚨
📊 現在価格: $2,364.86
🔴 24時間変動率: -1.42%
📉 市場分析:
ETHは$2,356付近まで下落した後、短期的な回復を見せています。買い手が入り始めていますが、上値には依然として抵抗があります。
🎯 重要な価格帯
🟢 レジスタンス: $2,366 – $2,370
🔴 サポート: $2,359 – $2,356
📈 取引戦略
🟢 ロング: $2,370を上抜けたことが確認された場合のみ
こちらで取引
#BinancePick
🚨 ETHUSDT 市場アップデート 🚨
📊 現在価格: $2,364.86
🔴 24時間変動率: -1.42%
📉 市場分析:
ETHは$2,356付近まで下落した後、短期的な回復を見せています。買い手が入り始めていますが、上値には依然として抵抗があります。
🎯 重要な価格帯
🟢 レジスタンス: $2,366 – $2,370
🔴 サポート: $2,359 – $2,356
📈 取引戦略
🟢 ロング: $2,370を上抜けたことが確認された場合のみ
こちらで取引
#BinancePick
2
64
·
--
$LINK
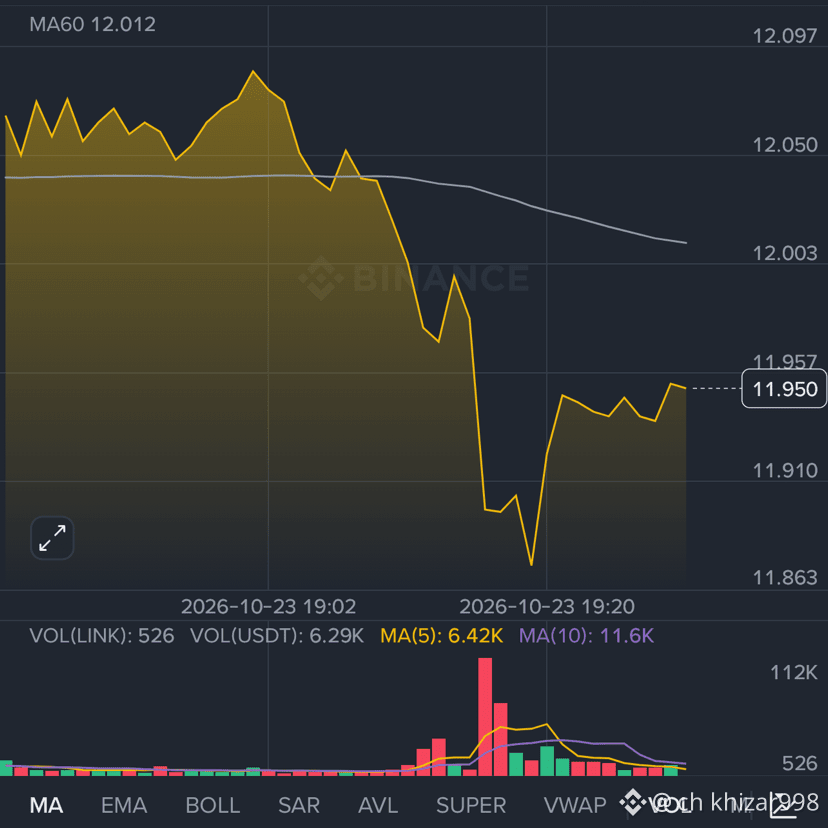
🎯 重要な価格水準
🟢 サポート: $11.86 – $11.90
🔴 レジスタンス: $11.96 – $12.02
🚀 主要レジスタンス: $
🚨 LINK/USDT 無期限先物 — 市場アップデート 📉
🔴 現在価格: $11.951
📉 24時間変動率: -0.77%
📊 24時間高値: $12.274
📊 24時間安値: $11.765
こちらで取引
#EarningsSeason
$LINK
🎯 重要な価格水準
🟢 サポート: $11.86 – $11.90
🔴 レジスタンス: $11.96 – $12.02
🚀 主要レジスタンス: $
🚨 LINK/USDT 無期限先物 — 市場アップデート 📉
🔴 現在価格: $11.951
📉 24時間変動率: -0.77%
📊 24時間高値: $12.274
📊 24時間安値: $11.765
こちらで取引
#EarningsSeason
🎯 重要な価格水準
🟢 サポート: $11.86 – $11.90
🔴 レジスタンス: $11.96 – $12.02
🚀 主要レジスタンス: $
🚨 LINK/USDT 無期限先物 — 市場アップデート 📉
🔴 現在価格: $11.951
📉 24時間変動率: -0.77%
📊 24時間高値: $12.274
📊 24時間安値: $11.765
こちらで取引
#EarningsSeason
2
86
·
--
翻訳参照
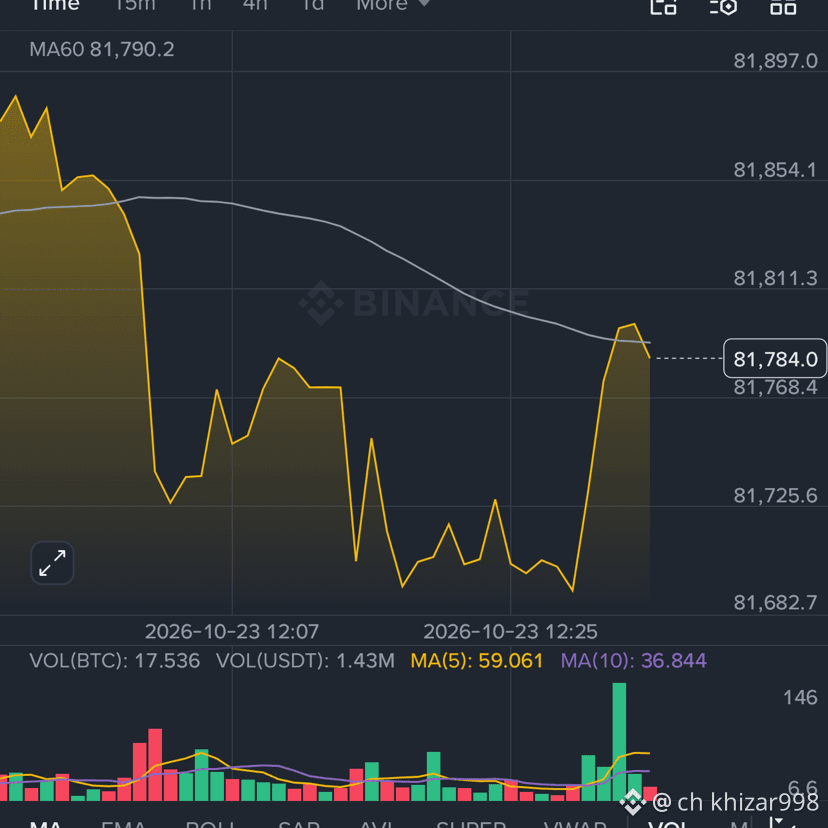
📉 BTCUSDT Market Update 📊
Bitcoin is trading around $81,784, down 0.59% on the session.
🔻 Strong bearish momentum followed by a sharp recovery.
📊 Selling pressure remains significant.
⚠️ Watch the $81,700–$81,800 zone for the next move.
Trade here
#EarningsSeason
📉 BTCUSDT Market Update 📊
Bitcoin is trading around $81,784, down 0.59% on the session.
🔻 Strong bearish momentum followed by a sharp recovery.
📊 Selling pressure remains significant.
⚠️ Watch the $81,700–$81,800 zone for the next move.
Trade here
#EarningsSeason
Bitcoin is trading around $81,784, down 0.59% on the session.
🔻 Strong bearish momentum followed by a sharp recovery.
📊 Selling pressure remains significant.
⚠️ Watch the $81,700–$81,800 zone for the next move.
Trade here
#EarningsSeason
2
54
·
--
翻訳参照
$BTC
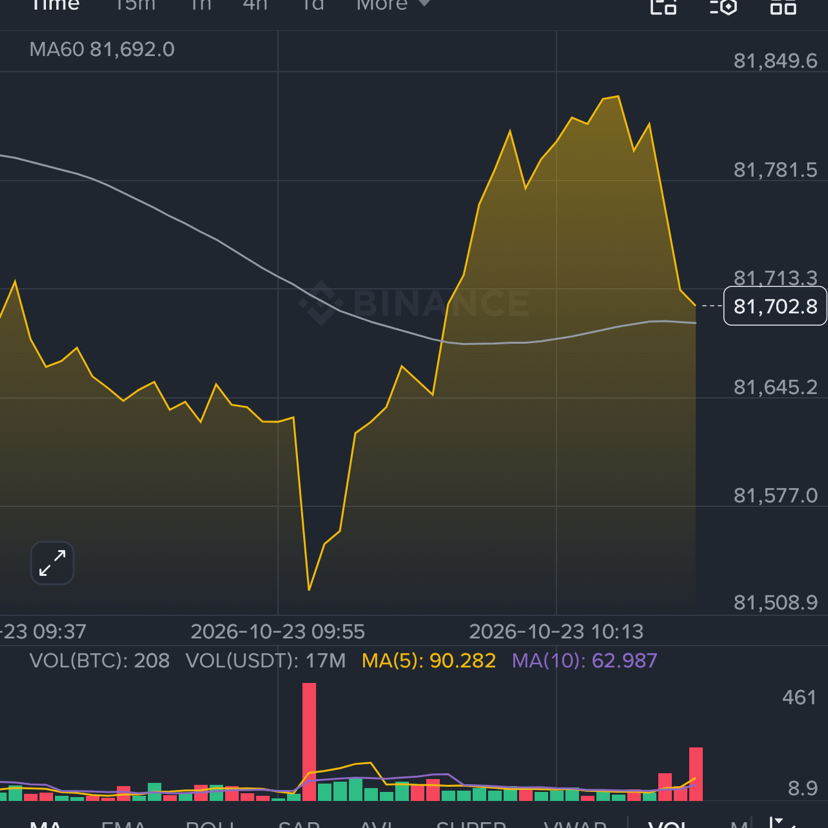
BTCUSDT — 15M Chart Analysis 📊
I’ve checked your screenshot. BTC is around 81,702.7 USDT on the 15-minute chart.
🔍 Technical Analysis
* Current price: 81,702.7
* MA60: 81,692 — price is slightly above it.
* Resistance: 81,780–81,850
* Support: 81,645 → 81,577
* Major local low: Around 81,520
* 24H high: 82,955
* 24H low: 80,888.9
Trade here
{future}(BTCUSDT)
#EarningsSeason
$BTC
BTCUSDT — 15M Chart Analysis 📊
I’ve checked your screenshot. BTC is around 81,702.7 USDT on the 15-minute chart.
🔍 Technical Analysis
* Current price: 81,702.7
* MA60: 81,692 — price is slightly above it.
* Resistance: 81,780–81,850
* Support: 81,645 → 81,577
* Major local low: Around 81,520
* 24H high: 82,955
* 24H low: 80,888.9
Trade here
#EarningsSeason
1
2
88
ログインして、さらにコンテンツを読む
厳選トピックで世界の暗号資産トレーダーの仲間入り
⚡️ 暗号資産に関する最新かつ有益な情報が見つかります。
💬 世界最大の暗号資産取引所から信頼されています。
👍 認証を受けたクリエイターから、有益なインサイトを得られます。
メール / 電話番号