
PMSAPRICE
14 投稿

PMSAPRICE
報告
ユーザーをブロック
💸📈💰
9 フォロー
2 フォロワー
2 いいね
投稿
すべて
動画
·
--
翻訳参照
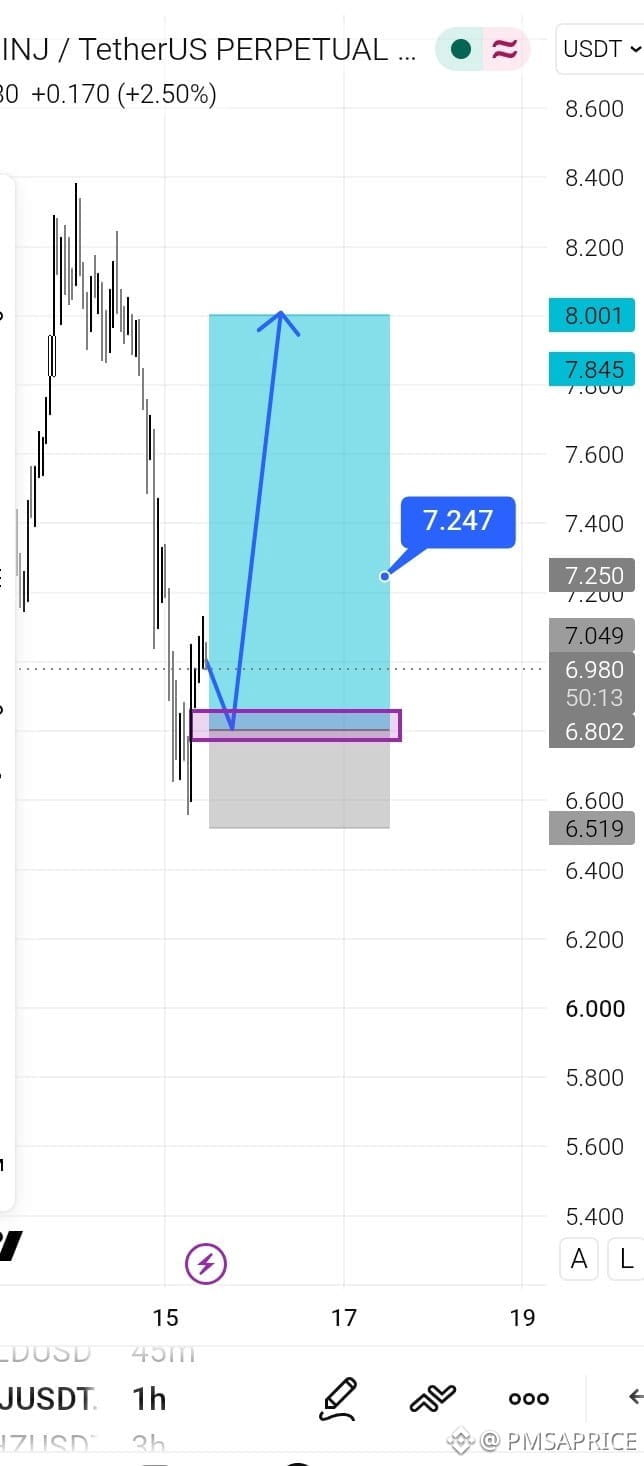
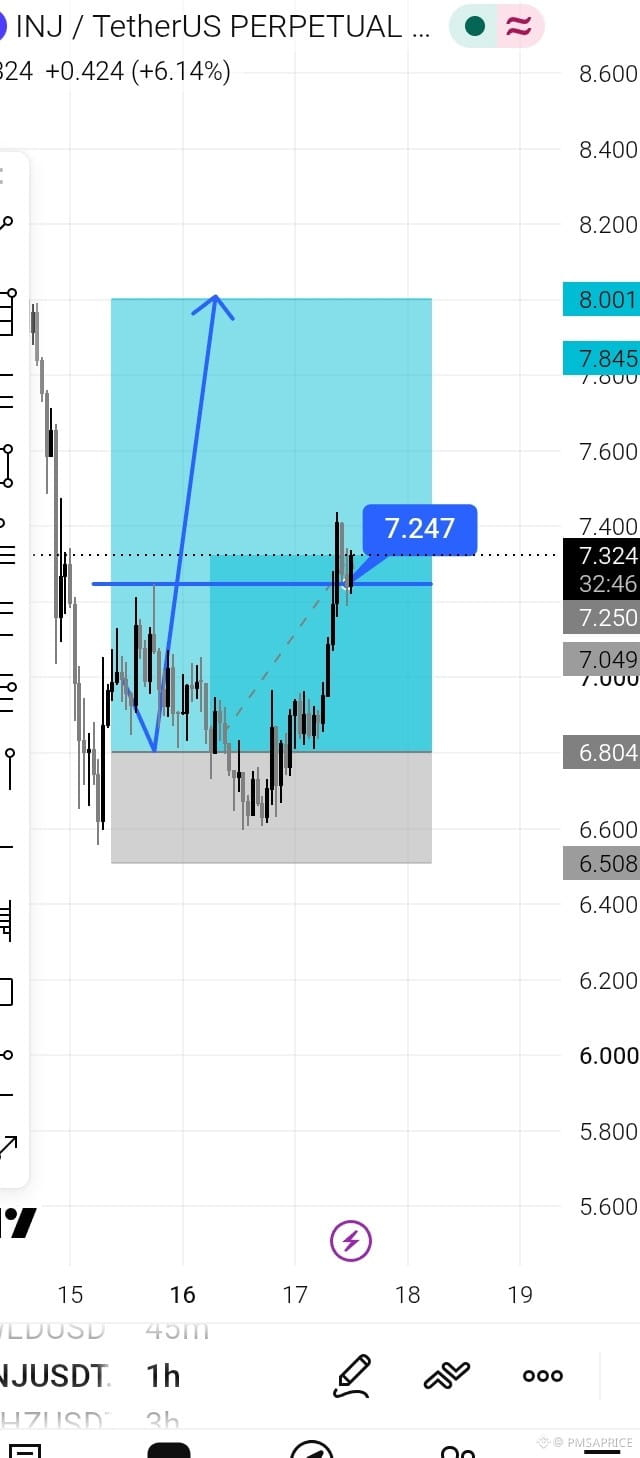
📈 HOW TO IDENTIFY A MARKET REVERSAL USING CANDLESTICKS
Want to spot market reversals early? Watch these 4 important steps:
1️⃣ Find the Trend: Higher highs and higher lo ws indicate an uptrend. Lower highs and lower lows indicate a downtrend.
2️⃣ Watch Key Zones: Focus on important support, resistance, and previous swing highs/lows.
3️⃣ Wait for Candle Clues: Look for rejection wicks, engulfing candles, and strong candle closes.
4️⃣ Confirm the Break: A bullish reversal needs a break above a key swing high. A bearish reversal needs a break below a key swing low.
📈
#Binace
$BTC $ETH
📈 HOW TO IDENTIFY A MARKET REVERSAL USING CANDLESTICKS
Want to spot market reversals early? Watch these 4 important steps:
1️⃣ Find the Trend: Higher highs and higher lo ws indicate an uptrend. Lower highs and lower lows indicate a downtrend.
2️⃣ Watch Key Zones: Focus on important support, resistance, and previous swing highs/lows.
3️⃣ Wait for Candle Clues: Look for rejection wicks, engulfing candles, and strong candle closes.
4️⃣ Confirm the Break: A bullish reversal needs a break above a key swing high. A bearish reversal needs a break below a key swing low.
📈
#Binace
$BTC $ETH
Want to spot market reversals early? Watch these 4 important steps:
1️⃣ Find the Trend: Higher highs and higher lo ws indicate an uptrend. Lower highs and lower lows indicate a downtrend.
2️⃣ Watch Key Zones: Focus on important support, resistance, and previous swing highs/lows.
3️⃣ Wait for Candle Clues: Look for rejection wicks, engulfing candles, and strong candle closes.
4️⃣ Confirm the Break: A bullish reversal needs a break above a key swing high. A bearish reversal needs a break below a key swing low.
📈
#Binace
$BTC $ETH
72
·
--
翻訳参照
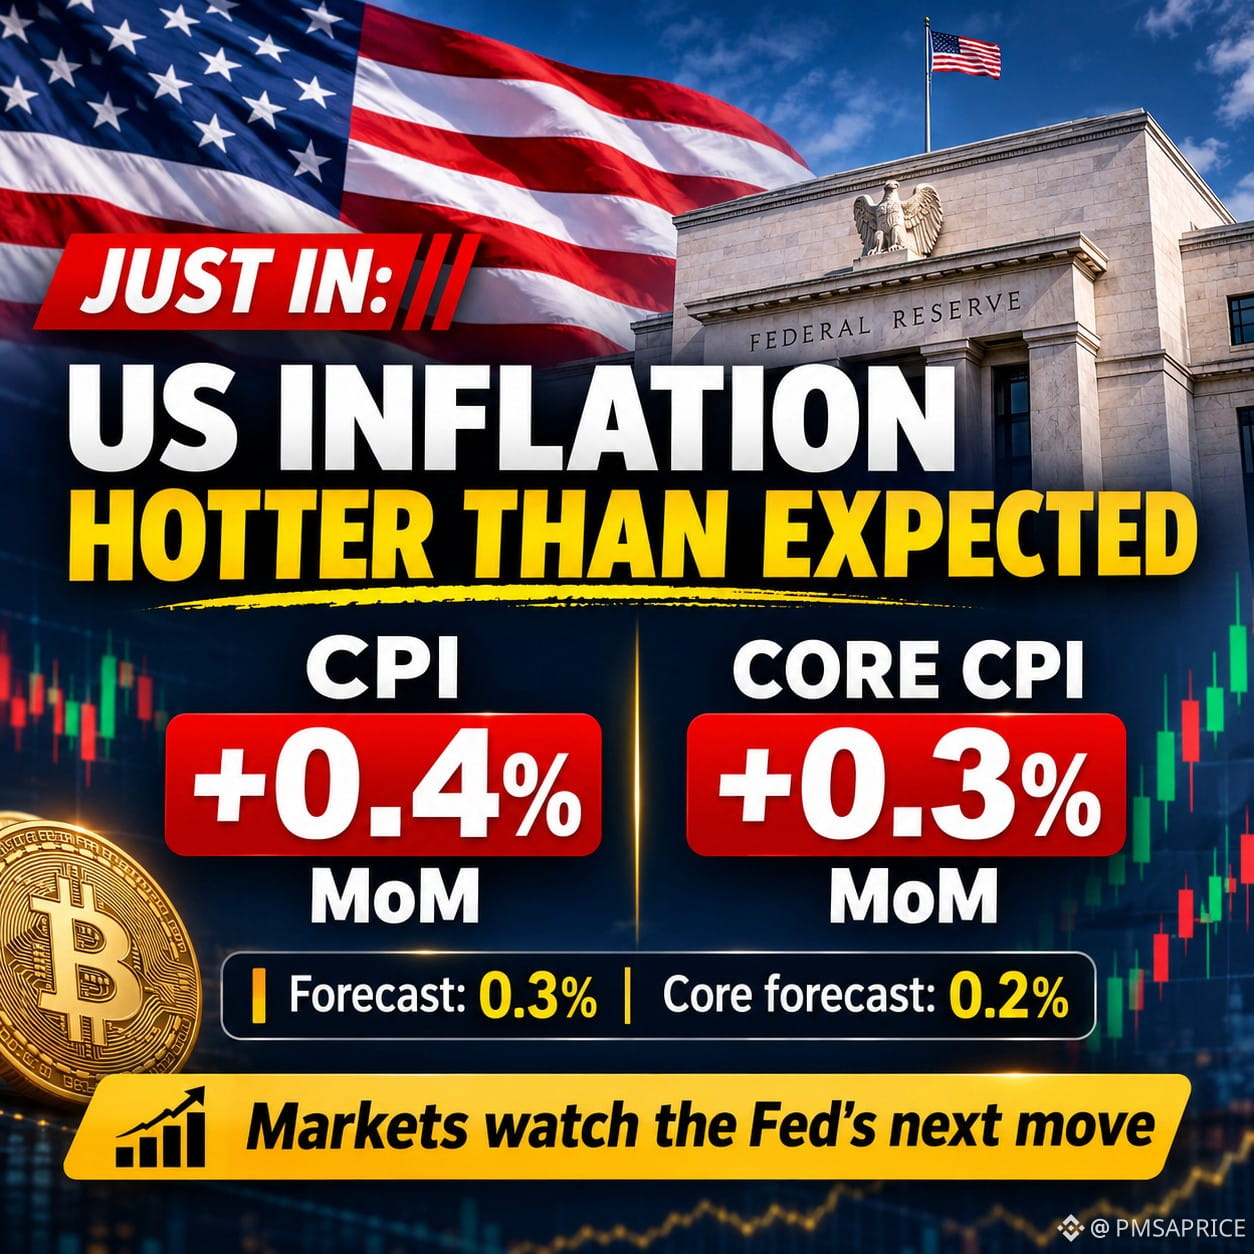
🇺🇸 JUST IN: US CPI rises 0.4% month over month in October, above the 0.3% estimate.
Core CPI rises 0.3%, above the 0.2% estimate and matching September’s pace.
#HotCPIDecemberHikePriced #AnthropicRejectsIPODelayValuationinQuestion #CanNvidiaEarningsEaseMarketConcerns?
🇺🇸 JUST IN: US CPI rises 0.4% month over month in October, above the 0.3% estimate.
Core CPI rises 0.3%, above the 0.2% estimate and matching September’s pace.
#HotCPIDecemberHikePriced #AnthropicRejectsIPODelayValuationinQuestion #CanNvidiaEarningsEaseMarketConcerns?
Core CPI rises 0.3%, above the 0.2% estimate and matching September’s pace.
#HotCPIDecemberHikePriced #AnthropicRejectsIPODelayValuationinQuestion #CanNvidiaEarningsEaseMarketConcerns?
68

·
--
記事
翻訳参照
👀💰🪙AIN/USDT is making a huge move!
AIN/USDT has suddenly attracted strong market attention after a powerful move on the 4H chart. 📈
At the time of the chart snapshot:
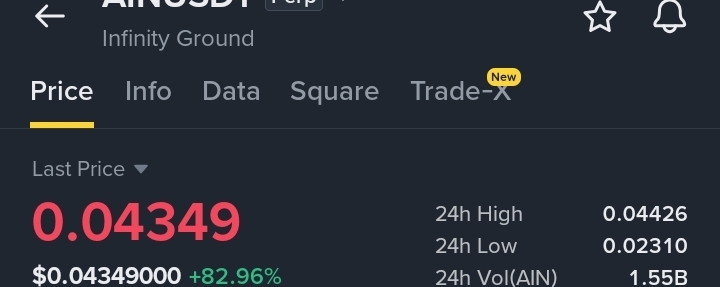
💰 Price: $0.04349
📈 24H Change: +82.96%
🔺 24H High: $0.04426
🔻 24H Low: $0.02310
📊 24H Volume: ~$53.27M USDT
One of the biggest things standing out is the massive volume spike accompanying the price move. 🚀 This suggests that market activity has increased significantly compared with the previous candles.
The 4H chart also shows price moving far above the recent consolidation area around $0.02–$0.03, creating a very strong breakout-style move.
⚠️ However, after such a rapid increase, volatility can be extremely high. Traders should watch how price behaves around the recent high and whether the market can maintain the momentum.
👀 Key levels to watch:
🔹 $0.04426 — recent high
🔹 $0.0435 — current area
🔹 $0.039 — nearby psychological/technical area
🔹 $0.029–$0.030 — previous breakout region
📌 Remember: A huge green candle doesn't automatically mean price will continue straight up. Confirmation, volume, and risk management are important.
🔥 AIN/USDT is definitely a pair worth watching right now.
$AIN
{future}(AINUSDT)
👀💰🪙
AIN/USDT is making a huge move!
AIN/USDT has suddenly attracted strong market attention after a powerful move on the 4H chart. 📈
At the time of the chart snapshot:
💰 Price: $0.04349
📈 24H Change: +82.96%
🔺 24H High: $0.04426
🔻 24H Low: $0.02310
📊 24H Volume: ~$53.27M USDT
One of the biggest things standing out is the massive volume spike accompanying the price move. 🚀 This suggests that market activity has increased significantly compared with the previous candles.
The 4H chart also shows price moving far above the recent consolidation area around $0.02–$0.03, creating a very strong breakout-style move.
⚠️ However, after such a rapid increase, volatility can be extremely high. Traders should watch how price behaves around the recent high and whether the market can maintain the momentum.
👀 Key levels to watch:
🔹 $0.04426 — recent high
🔹 $0.0435 — current area
🔹 $0.039 — nearby psychological/technical area
🔹 $0.029–$0.030 — previous breakout region
📌 Remember: A huge green candle doesn't automatically mean price will continue straight up. Confirmation, volume, and risk management are important.
🔥 AIN/USDT is definitely a pair worth watching right now.
$AIN
AIN/USDT has suddenly attracted strong market attention after a powerful move on the 4H chart. 📈
At the time of the chart snapshot:
💰 Price: $0.04349
📈 24H Change: +82.96%
🔺 24H High: $0.04426
🔻 24H Low: $0.02310
📊 24H Volume: ~$53.27M USDT
One of the biggest things standing out is the massive volume spike accompanying the price move. 🚀 This suggests that market activity has increased significantly compared with the previous candles.
The 4H chart also shows price moving far above the recent consolidation area around $0.02–$0.03, creating a very strong breakout-style move.
⚠️ However, after such a rapid increase, volatility can be extremely high. Traders should watch how price behaves around the recent high and whether the market can maintain the momentum.
👀 Key levels to watch:
🔹 $0.04426 — recent high
🔹 $0.0435 — current area
🔹 $0.039 — nearby psychological/technical area
🔹 $0.029–$0.030 — previous breakout region
📌 Remember: A huge green candle doesn't automatically mean price will continue straight up. Confirmation, volume, and risk management are important.
🔥 AIN/USDT is definitely a pair worth watching right now.
$AIN
349
·
--
記事
翻訳参照
CT/USDT 4H Analysis — Important Levels to Watch 👀📊
🔥 CT/USDT has been showing strong volatility,CT/USDT 4H Analysis — Important Levels to Watch 👀📊
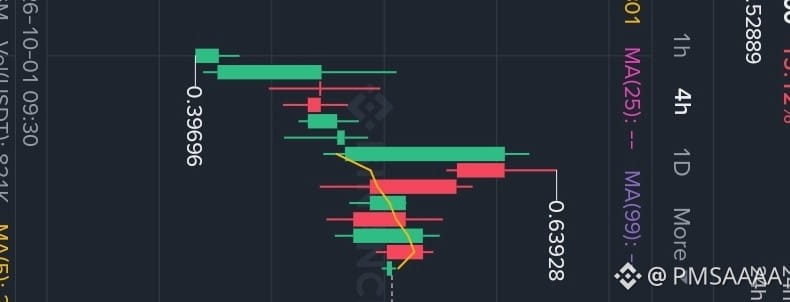
🔥 CT/USDT has been showing strong volatility, with price making a powerful move from around $0.3969 to a recent high near $0.6393.
Currently, CT is trading around $0.5288, after a significant pullback from the recent high. 📉
📊 4H Chart Structure
The chart shows a strong bullish move followed by a correction and consolidation phase. 🔄
📍 Current Price: ~$0.529
🟢 Support: $0.48
🟡 Resistance: $0.55–$0.60
🔴 Major Resistance: $0.625–$0.639
🟢 Bullish Scenario 🚀
If CT can reclaim and hold above the $0.55 zone with strong 4H candles, buyers may attempt to push price toward:
🎯 $0.60
🎯 $0.625
🎯 $0.639
A clean breakout above $0.639 would be an important level to watch for further confirmation. 👀🔥
🔴 Bearish Scenario ⚠️
If price fails to recover $0.55 and selling pressure increases, the $0.48 support becomes very important.
❗ A confirmed breakdown below $0.48 could open the way toward lower support areas.
🧠 Key Point
Don't chase the price after a big move. ⚠️
Wait for confirmation + volume + candle structure before making a trading decision. 📈📉
The most important zones to watch are:
🔥 $0.55 — short-term breakout area
🛡️ $0.48 — key support
🚀 $0.60–$0.639 — major resistance zone
What do you think? 👇
Will CT reclaim $0.55 and continue higher, or will sellers push it back toward $0.48?
#CT #CTUSDT #Crypto #Binance #CryptoTrading #TechnicalAnalysis #Altcoins #Trading 🚀📊
$CT ❤️
#SECProposesCryptoCustodyRules
CT/USDT 4H Analysis — Important Levels to Watch 👀📊 🔥 CT/USDT has been showing strong volatility,
CT/USDT 4H Analysis — Important Levels to Watch 👀📊
🔥 CT/USDT has been showing strong volatility, with price making a powerful move from around $0.3969 to a recent high near $0.6393.
Currently, CT is trading around $0.5288, after a significant pullback from the recent high. 📉
📊 4H Chart Structure
The chart shows a strong bullish move followed by a correction and consolidation phase. 🔄
📍 Current Price: ~$0.529
🟢 Support: $0.48
🟡 Resistance: $0.55–$0.60
🔴 Major Resistance: $0.625–$0.639
🟢 Bullish Scenario 🚀
If CT can reclaim and hold above the $0.55 zone with strong 4H candles, buyers may attempt to push price toward:
🎯 $0.60
🎯 $0.625
🎯 $0.639
A clean breakout above $0.639 would be an important level to watch for further confirmation. 👀🔥
🔴 Bearish Scenario ⚠️
If price fails to recover $0.55 and selling pressure increases, the $0.48 support becomes very important.
❗ A confirmed breakdown below $0.48 could open the way toward lower support areas.
🧠 Key Point
Don't chase the price after a big move. ⚠️
Wait for confirmation + volume + candle structure before making a trading decision. 📈📉
The most important zones to watch are:
🔥 $0.55 — short-term breakout area
🛡️ $0.48 — key support
🚀 $0.60–$0.639 — major resistance zone
What do you think? 👇
Will CT reclaim $0.55 and continue higher, or will sellers push it back toward $0.48?
#CT #CTUSDT #Crypto #Binance #CryptoTrading #TechnicalAnalysis #Altcoins #Trading 🚀📊
$CT ❤️
#SECProposesCryptoCustodyRules
🔥 CT/USDT has been showing strong volatility, with price making a powerful move from around $0.3969 to a recent high near $0.6393.
Currently, CT is trading around $0.5288, after a significant pullback from the recent high. 📉
📊 4H Chart Structure
The chart shows a strong bullish move followed by a correction and consolidation phase. 🔄
📍 Current Price: ~$0.529
🟢 Support: $0.48
🟡 Resistance: $0.55–$0.60
🔴 Major Resistance: $0.625–$0.639
🟢 Bullish Scenario 🚀
If CT can reclaim and hold above the $0.55 zone with strong 4H candles, buyers may attempt to push price toward:
🎯 $0.60
🎯 $0.625
🎯 $0.639
A clean breakout above $0.639 would be an important level to watch for further confirmation. 👀🔥
🔴 Bearish Scenario ⚠️
If price fails to recover $0.55 and selling pressure increases, the $0.48 support becomes very important.
❗ A confirmed breakdown below $0.48 could open the way toward lower support areas.
🧠 Key Point
Don't chase the price after a big move. ⚠️
Wait for confirmation + volume + candle structure before making a trading decision. 📈📉
The most important zones to watch are:
🔥 $0.55 — short-term breakout area
🛡️ $0.48 — key support
🚀 $0.60–$0.639 — major resistance zone
What do you think? 👇
Will CT reclaim $0.55 and continue higher, or will sellers push it back toward $0.48?
#CT #CTUSDT #Crypto #Binance #CryptoTrading #TechnicalAnalysis #Altcoins #Trading 🚀📊
$CT ❤️
#SECProposesCryptoCustodyRules
1
618
ログインして、さらにコンテンツを読む
厳選トピックで世界の暗号資産トレーダーの仲間入り
⚡️ 暗号資産に関する最新かつ有益な情報が見つかります。
💬 世界最大の暗号資産取引所から信頼されています。
👍 認証を受けたクリエイターから、有益なインサイトを得られます。
メール / 電話番号