
Bessie Bramall me55
8 投稿

Bessie Bramall me55
報告
ユーザーをブロック
3 フォロー
0 フォロワー
5 いいね
投稿
すべて
引用
{spot}(BNBUSDT)
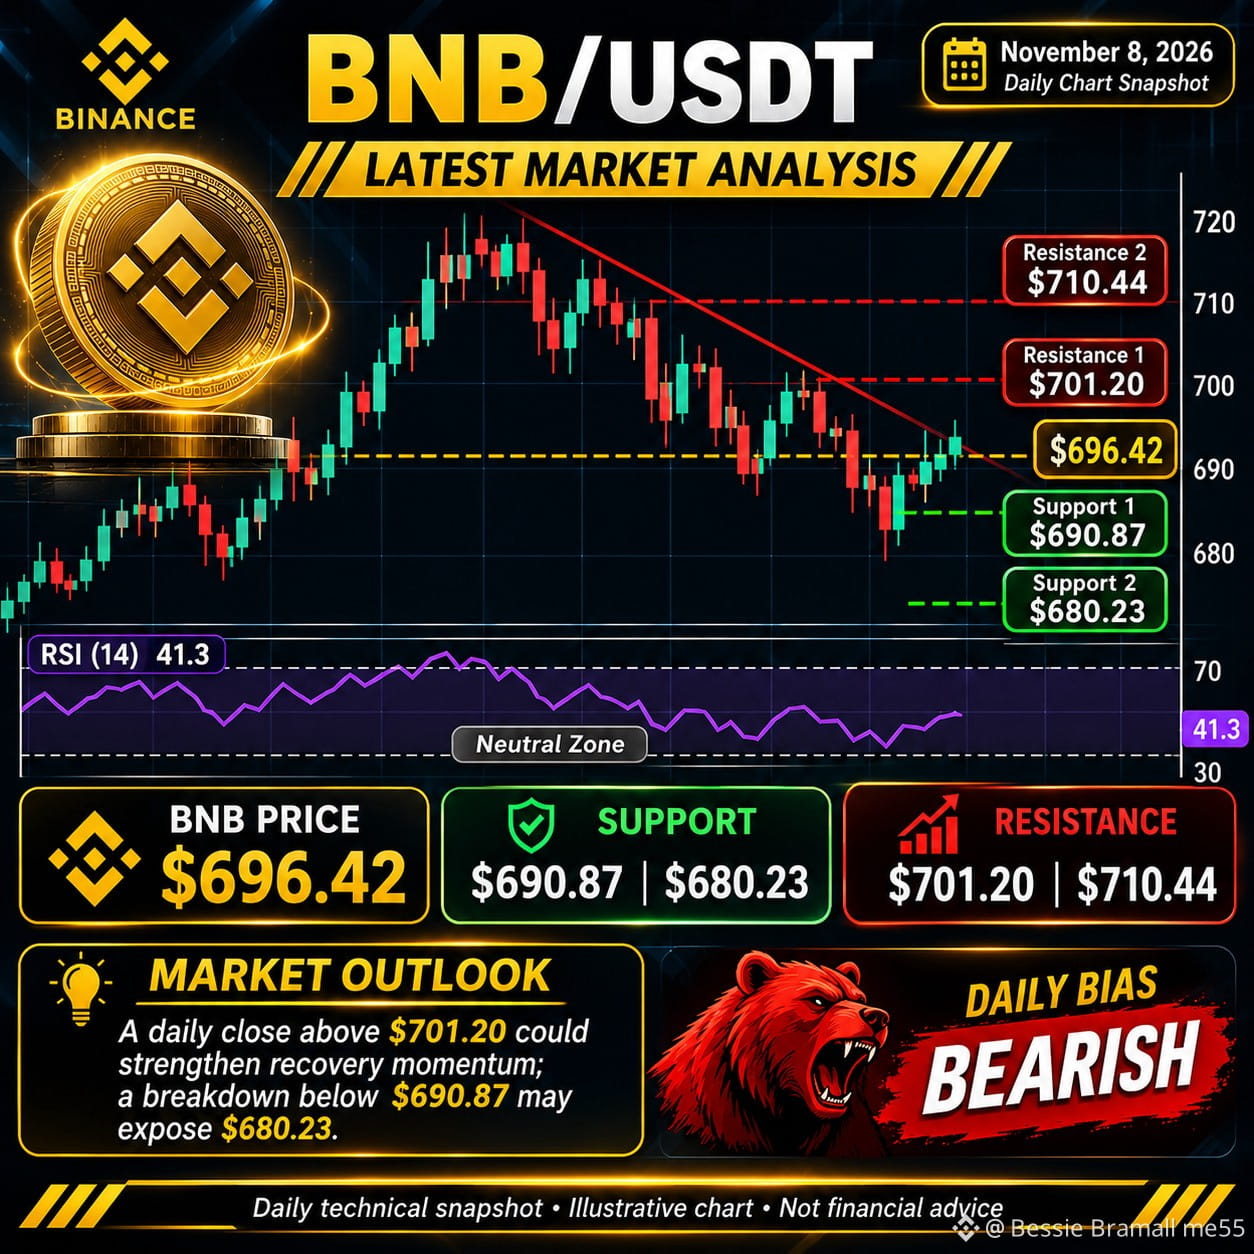
$BNB は696.42ドル付近で取引されており、短期的な勢いは引き続き弱い状態です。
現在価格:696.42ドル
サポート1:690.87ドル
サポート2:680.23ドル
レジスタンス1:701.20ドル
レジスタンス2:710.44ドル
RSI(14):41.3 – 中立圏
市場見通し:701.20ドルを上回って日足が引ければ、回復の勢いが強まる可能性があります。690.87ドルを下回ると、次のサポートである680.23ドルまで下落する可能性があります。
#KeplrAdvisesSocialLoginUsersToTransferAssets #TetherPlans€28.8MForJuventusCapitalIncrease #JobsReportRaisesHikeOdds #WillAnthropicListOnTime #CPITestsDecemberRateOutlook
$BNB は696.42ドル付近で取引されており、短期的な勢いは引き続き弱い状態です。
現在価格:696.42ドル
サポート1:690.87ドル
サポート2:680.23ドル
レジスタンス1:701.20ドル
レジスタンス2:710.44ドル
RSI(14):41.3 – 中立圏
市場見通し:701.20ドルを上回って日足が引ければ、回復の勢いが強まる可能性があります。690.87ドルを下回ると、次のサポートである680.23ドルまで下落する可能性があります。
#KeplrAdvisesSocialLoginUsersToTransferAssets #TetherPlans€28.8MForJuventusCapitalIncrease #JobsReportRaisesHikeOdds #WillAnthropicListOnTime #CPITestsDecemberRateOutlook
現在価格:696.42ドル
サポート1:690.87ドル
サポート2:680.23ドル
レジスタンス1:701.20ドル
レジスタンス2:710.44ドル
RSI(14):41.3 – 中立圏
市場見通し:701.20ドルを上回って日足が引ければ、回復の勢いが強まる可能性があります。690.87ドルを下回ると、次のサポートである680.23ドルまで下落する可能性があります。
#KeplrAdvisesSocialLoginUsersToTransferAssets #TetherPlans€28.8MForJuventusCapitalIncrease #JobsReportRaisesHikeOdds #WillAnthropicListOnTime #CPITestsDecemberRateOutlook
8
翻訳参照
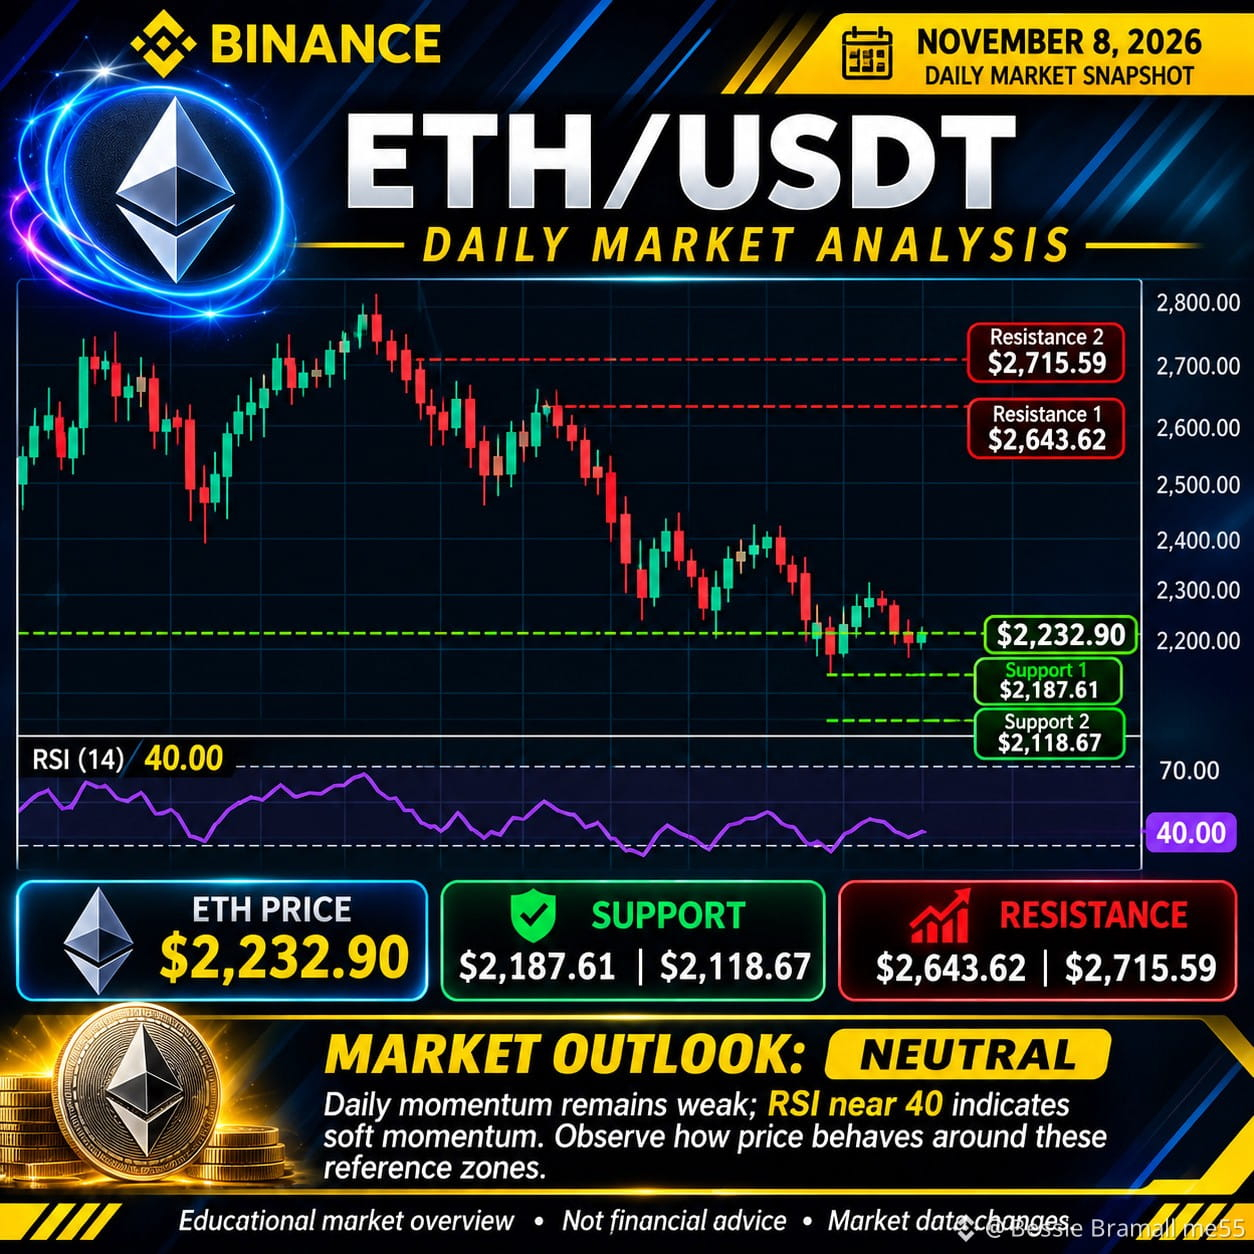
$ETH is showing weak daily momentum, with RSI (14) near 40.
📍 Reference Price: $2,232.90
🟢 Support: $2,187.61 | $2,118.67
🔴 Resistance: $2,643.62 | $2,715.59
#HKSFCPlansToRestrictCryptoAndExchangeTerms #WillUS-IranTensionsBoostSafe-HavenDemand? #JobsReportRaisesHikeOdds #WillAnthropicListOnTime #TradFiForBeginners
{spot}(ETHUSDT)
$ETH is showing weak daily momentum, with RSI (14) near 40.
📍 Reference Price: $2,232.90
🟢 Support: $2,187.61 | $2,118.67
🔴 Resistance: $2,643.62 | $2,715.59
#HKSFCPlansToRestrictCryptoAndExchangeTerms #WillUS-IranTensionsBoostSafe-HavenDemand? #JobsReportRaisesHikeOdds #WillAnthropicListOnTime #TradFiForBeginners
📍 Reference Price: $2,232.90
🟢 Support: $2,187.61 | $2,118.67
🔴 Resistance: $2,643.62 | $2,715.59
#HKSFCPlansToRestrictCryptoAndExchangeTerms #WillUS-IranTensionsBoostSafe-HavenDemand? #JobsReportRaisesHikeOdds #WillAnthropicListOnTime #TradFiForBeginners
59
翻訳参照
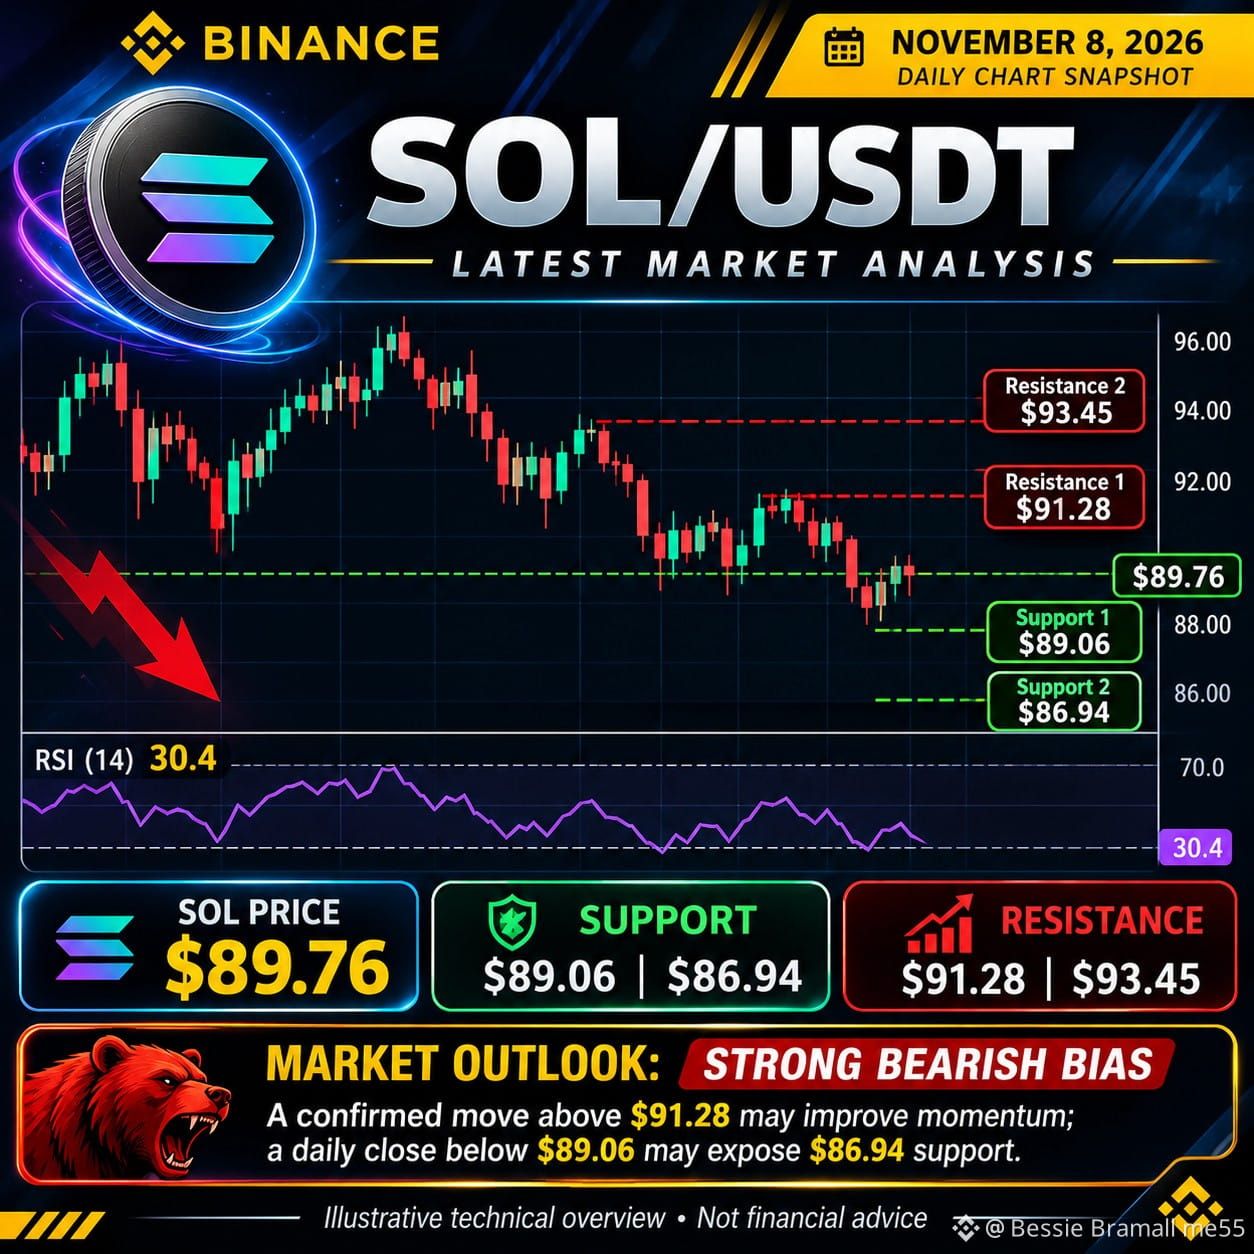
$SOL
is showing significant selling pressure.
Reference price: $89.76
Support 1: $89.06
Support 2: $86.94
Resistance 1: $91.28
Resistance 2: $93.45
RSI (14): 30.4 – Weak momentum.
Market Outlook: SOL remains bearish on the daily chart. A confirmed move above $91.28 could improve momentum, while a daily close below $89.06 may expose lower support at $86.94.
SOL is testing a critical support zone! Can buyers defend $89, or will sellers push the price lower? Watch RSI and daily candle confirmation.
#JobsReportRaisesHikeOdds #CPITestsDecemberRateOutlook #WillAnthropicListOnTime #HKSFCPlansToRestrictCryptoAndExchangeTerms #TradFiForBeginners
{spot}(SOLUSDT)
$SOL
is showing significant selling pressure.
Reference price: $89.76
Support 1: $89.06
Support 2: $86.94
Resistance 1: $91.28
Resistance 2: $93.45
RSI (14): 30.4 – Weak momentum.
Market Outlook: SOL remains bearish on the daily chart. A confirmed move above $91.28 could improve momentum, while a daily close below $89.06 may expose lower support at $86.94.
SOL is testing a critical support zone! Can buyers defend $89, or will sellers push the price lower? Watch RSI and daily candle confirmation.
#JobsReportRaisesHikeOdds #CPITestsDecemberRateOutlook #WillAnthropicListOnTime #HKSFCPlansToRestrictCryptoAndExchangeTerms #TradFiForBeginners
is showing significant selling pressure.
Reference price: $89.76
Support 1: $89.06
Support 2: $86.94
Resistance 1: $91.28
Resistance 2: $93.45
RSI (14): 30.4 – Weak momentum.
Market Outlook: SOL remains bearish on the daily chart. A confirmed move above $91.28 could improve momentum, while a daily close below $89.06 may expose lower support at $86.94.
SOL is testing a critical support zone! Can buyers defend $89, or will sellers push the price lower? Watch RSI and daily candle confirmation.
#JobsReportRaisesHikeOdds #CPITestsDecemberRateOutlook #WillAnthropicListOnTime #HKSFCPlansToRestrictCryptoAndExchangeTerms #TradFiForBeginners
66
翻訳参照
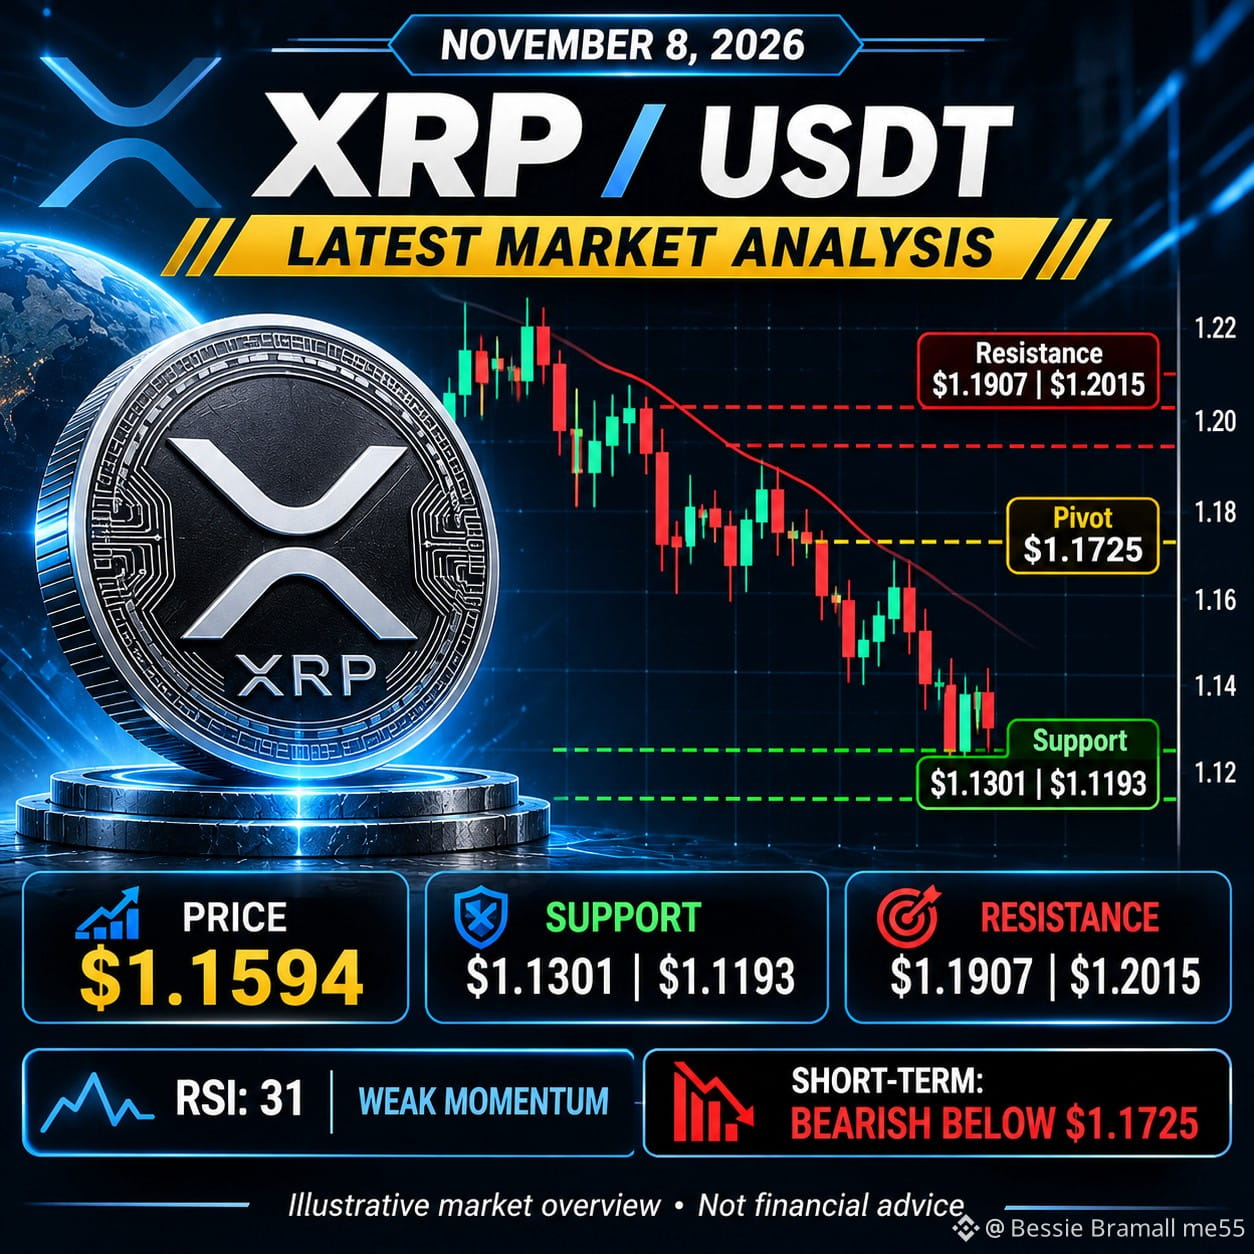
$XRP
{spot}(XRPUSDT)
is facing selling pressure as bearish momentum continues.
Current price: $1.1594
Support 1: $1.1301
Support 2: $1.1193
Resistance 1: $1.1725
Resistance 2: $1.1907
RSI: Around 31 (weak momentum)
Technical Outlook: XRP remains under pressure below $1.1725. A recovery above this level could improve momentum, while a breakdown below $1.1301 may expose lower support.
Key level to watch: $1.1725.
XRP is testing an important support zone. Can buyers reclaim $1.1725, or will selling pressure continue? Volume and candle confirmation will be key.
#TradFiForBeginners #HKSFCPlansToRestrictCryptoAndExchangeTerms #WillUS-IranTensionsBoostSafe-HavenDemand? #WillAnthropicListOnTime #JobsReportRaisesHikeOdds
$XRP
is facing selling pressure as bearish momentum continues.
Current price: $1.1594
Support 1: $1.1301
Support 2: $1.1193
Resistance 1: $1.1725
Resistance 2: $1.1907
RSI: Around 31 (weak momentum)
Technical Outlook: XRP remains under pressure below $1.1725. A recovery above this level could improve momentum, while a breakdown below $1.1301 may expose lower support.
Key level to watch: $1.1725.
XRP is testing an important support zone. Can buyers reclaim $1.1725, or will selling pressure continue? Volume and candle confirmation will be key.
#TradFiForBeginners #HKSFCPlansToRestrictCryptoAndExchangeTerms #WillUS-IranTensionsBoostSafe-HavenDemand? #WillAnthropicListOnTime #JobsReportRaisesHikeOdds
is facing selling pressure as bearish momentum continues.
Current price: $1.1594
Support 1: $1.1301
Support 2: $1.1193
Resistance 1: $1.1725
Resistance 2: $1.1907
RSI: Around 31 (weak momentum)
Technical Outlook: XRP remains under pressure below $1.1725. A recovery above this level could improve momentum, while a breakdown below $1.1301 may expose lower support.
Key level to watch: $1.1725.
XRP is testing an important support zone. Can buyers reclaim $1.1725, or will selling pressure continue? Volume and candle confirmation will be key.
#TradFiForBeginners #HKSFCPlansToRestrictCryptoAndExchangeTerms #WillUS-IranTensionsBoostSafe-HavenDemand? #WillAnthropicListOnTime #JobsReportRaisesHikeOdds
146
$BNB は、トレーダーが次の市場の方向性を見極める中、注目されています。
トレンド:直近の値動きによる確認が必要です。
サポート:直近のスイング安値に注目してください。
レジスタンス:直近のスイング高値に注目してください。
強気シナリオ:レジスタンスを明確に上抜ければ、モメンタムの改善を示す可能性があります。
弱気シナリオ:サポートを明確に下抜ければ、さらなる弱さを示す可能性があります。
市場見通し:結論を出す前に、出来高とローソク足の終値で確認しましょう。未確認の価格水準に頼るのは避けてください。
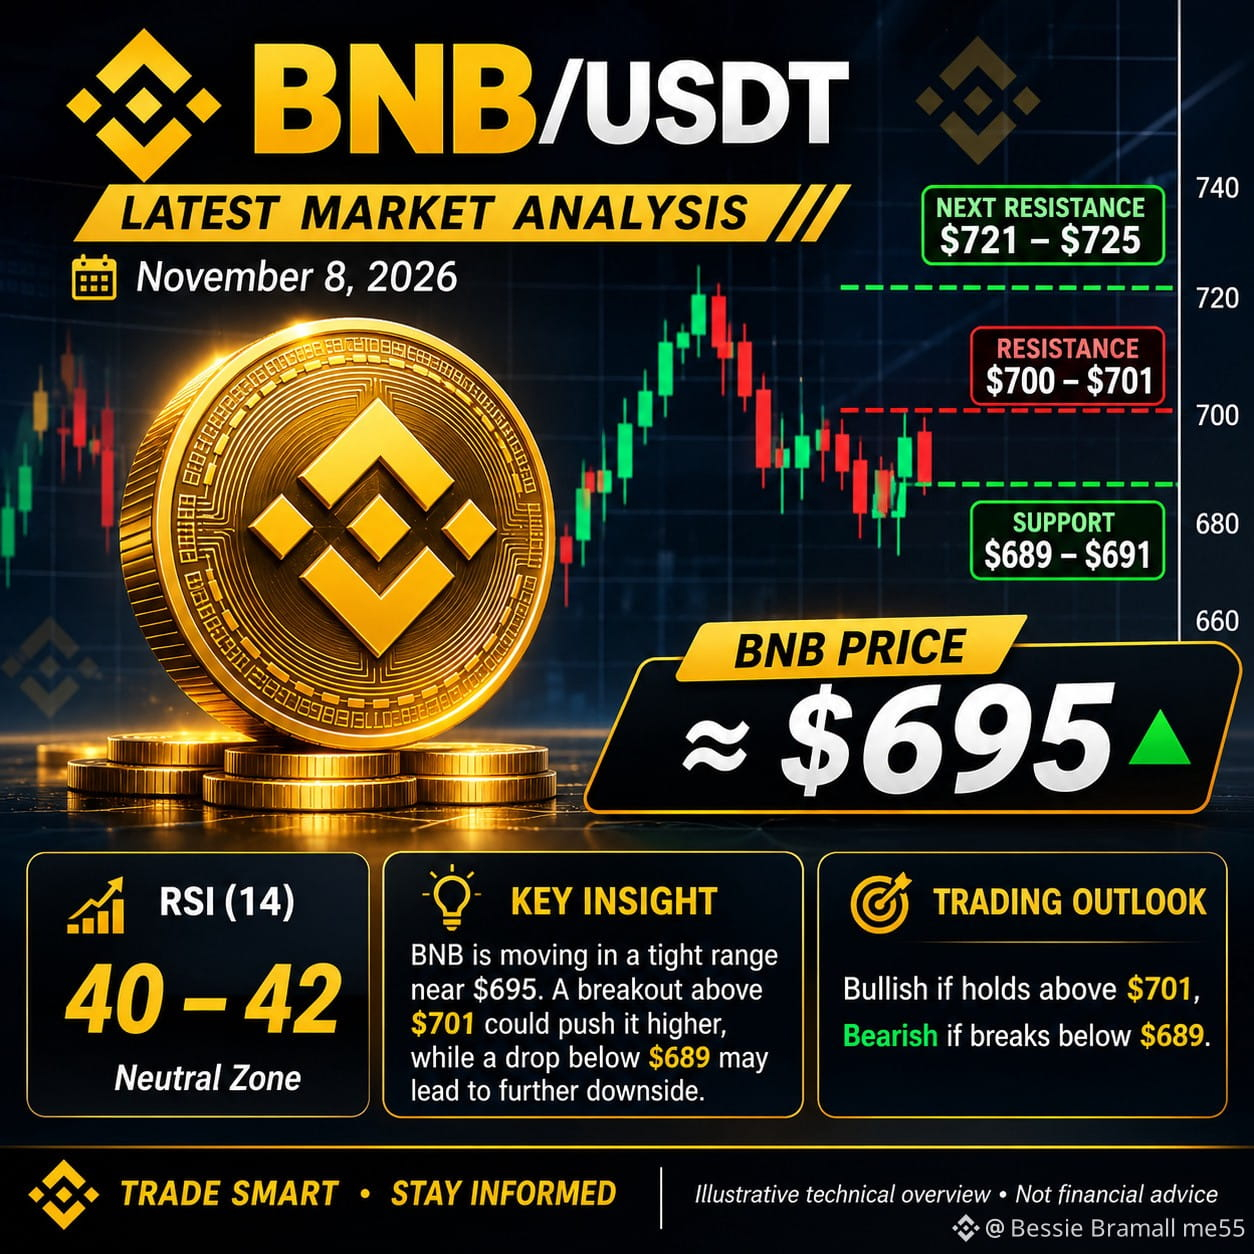
BNB価格:約695ドル
サポートゾーン:689~691ドル
レジスタンス:700~701ドル
次のレジスタンス:721~725ドル
RSI:約40~42で、モメンタムは比較的弱いことを示しています。
テクニカル見通し:中立から弱気。短期的な見通しを強めるには、BNBが701ドルを回復する必要があります。689ドルを下回ると、677ドル付近のサポートが視野に入る可能性があります。
チャート上の水準は11月7日に公表されたデータに基づくもので、リアルタイムの取引所データではありません。
Binance Square向け投稿文案:
BNBは重要な判断ゾーンに近づいています。買い手は701ドルを回復できるでしょうか、それとも売り手が価格を689ドルより下に押し下げるでしょうか?出来高と日足ローソク足の確定に注目してください。
#JobsReportRaisesHikeOdds #CPITestsDecemberRateOutlook #WillAnthropicListOnTime #WillUS-IranTensionsBoostSafe-HavenDemand? #HKSFCPlansToRestrictCryptoAndExchangeTerms
{spot}(BNBUSDT)
$BNB は、トレーダーが次の市場の方向性を見極める中、注目されています。
トレンド:直近の値動きによる確認が必要です。
サポート:直近のスイング安値に注目してください。
レジスタンス:直近のスイング高値に注目してください。
強気シナリオ:レジスタンスを明確に上抜ければ、モメンタムの改善を示す可能性があります。
弱気シナリオ:サポートを明確に下抜ければ、さらなる弱さを示す可能性があります。
市場見通し:結論を出す前に、出来高とローソク足の終値で確認しましょう。未確認の価格水準に頼るのは避けてください。
BNB価格:約695ドル
サポートゾーン:689~691ドル
レジスタンス:700~701ドル
次のレジスタンス:721~725ドル
RSI:約40~42で、モメンタムは比較的弱いことを示しています。
テクニカル見通し:中立から弱気。短期的な見通しを強めるには、BNBが701ドルを回復する必要があります。689ドルを下回ると、677ドル付近のサポートが視野に入る可能性があります。
チャート上の水準は11月7日に公表されたデータに基づくもので、リアルタイムの取引所データではありません。
Binance Square向け投稿文案:
BNBは重要な判断ゾーンに近づいています。買い手は701ドルを回復できるでしょうか、それとも売り手が価格を689ドルより下に押し下げるでしょうか?出来高と日足ローソク足の確定に注目してください。
#JobsReportRaisesHikeOdds #CPITestsDecemberRateOutlook #WillAnthropicListOnTime #WillUS-IranTensionsBoostSafe-HavenDemand? #HKSFCPlansToRestrictCryptoAndExchangeTerms
トレンド:直近の値動きによる確認が必要です。
サポート:直近のスイング安値に注目してください。
レジスタンス:直近のスイング高値に注目してください。
強気シナリオ:レジスタンスを明確に上抜ければ、モメンタムの改善を示す可能性があります。
弱気シナリオ:サポートを明確に下抜ければ、さらなる弱さを示す可能性があります。
市場見通し:結論を出す前に、出来高とローソク足の終値で確認しましょう。未確認の価格水準に頼るのは避けてください。
BNB価格:約695ドル
サポートゾーン:689~691ドル
レジスタンス:700~701ドル
次のレジスタンス:721~725ドル
RSI:約40~42で、モメンタムは比較的弱いことを示しています。
テクニカル見通し:中立から弱気。短期的な見通しを強めるには、BNBが701ドルを回復する必要があります。689ドルを下回ると、677ドル付近のサポートが視野に入る可能性があります。
チャート上の水準は11月7日に公表されたデータに基づくもので、リアルタイムの取引所データではありません。
Binance Square向け投稿文案:
BNBは重要な判断ゾーンに近づいています。買い手は701ドルを回復できるでしょうか、それとも売り手が価格を689ドルより下に押し下げるでしょうか?出来高と日足ローソク足の確定に注目してください。
#JobsReportRaisesHikeOdds #CPITestsDecemberRateOutlook #WillAnthropicListOnTime #WillUS-IranTensionsBoostSafe-HavenDemand? #HKSFCPlansToRestrictCryptoAndExchangeTerms
3
221
·
--
ブリッシュ
翻訳参照
$BTC
{spot}(BTCUSDT)
# is facing strong selling pressure.
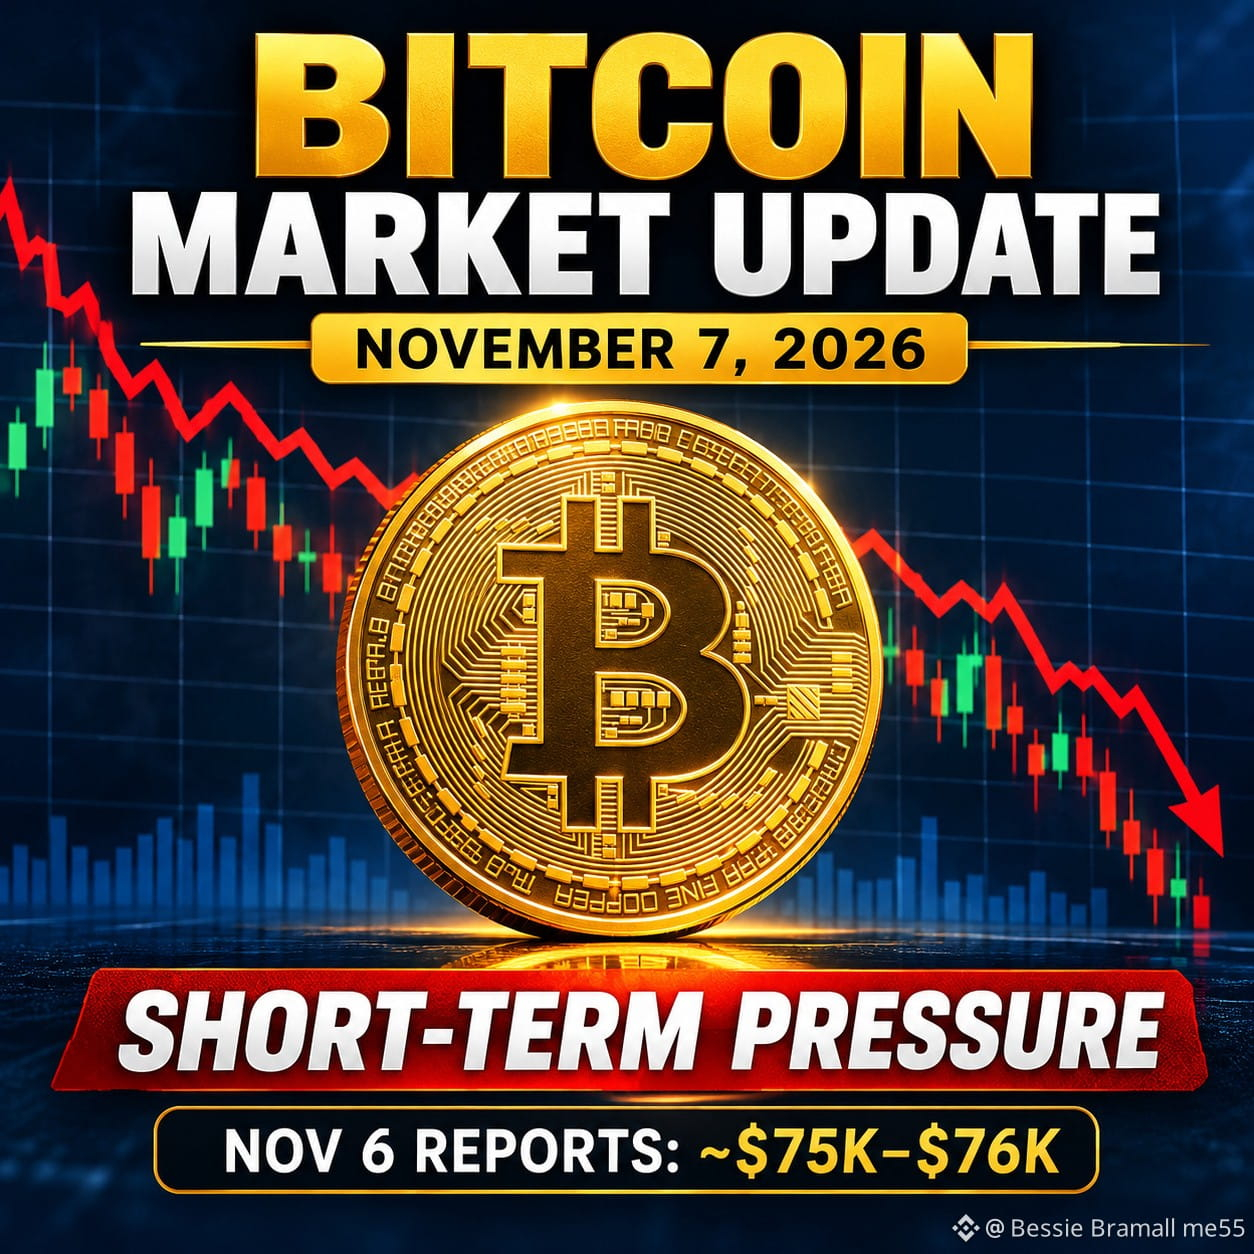
Price: Around $75,000–$76,000 in November 6 market reports.
Trend: Short-term bearish.
Support: $75,000, followed by $73,200.
Resistance: $78,000–$80,000.
Market sentiment: Cautious, with investors watching economic data and institutional fund outflows.
Market outlook: If BTC holds above $75,000, a recovery may develop. A sustained break below this level could increase downside pressure. Reclaiming $80,000 would improve the short-term outlook.
#JobsReportRaisesHikeOdds #WillAnthropicListOnTime #USNovemberMichiganExpectationsIndexPrelimAt50.9 #TradFiForBeginners #USMidtermsCouldShakeUpUS-IranTies
$BTC
# is facing strong selling pressure.
Price: Around $75,000–$76,000 in November 6 market reports.
Trend: Short-term bearish.
Support: $75,000, followed by $73,200.
Resistance: $78,000–$80,000.
Market sentiment: Cautious, with investors watching economic data and institutional fund outflows.
Market outlook: If BTC holds above $75,000, a recovery may develop. A sustained break below this level could increase downside pressure. Reclaiming $80,000 would improve the short-term outlook.
#JobsReportRaisesHikeOdds #WillAnthropicListOnTime #USNovemberMichiganExpectationsIndexPrelimAt50.9 #TradFiForBeginners #USMidtermsCouldShakeUpUS-IranTies
# is facing strong selling pressure.
Price: Around $75,000–$76,000 in November 6 market reports.
Trend: Short-term bearish.
Support: $75,000, followed by $73,200.
Resistance: $78,000–$80,000.
Market sentiment: Cautious, with investors watching economic data and institutional fund outflows.
Market outlook: If BTC holds above $75,000, a recovery may develop. A sustained break below this level could increase downside pressure. Reclaiming $80,000 would improve the short-term outlook.
#JobsReportRaisesHikeOdds #WillAnthropicListOnTime #USNovemberMichiganExpectationsIndexPrelimAt50.9 #TradFiForBeginners #USMidtermsCouldShakeUpUS-IranTies
1
64
103009
103009


Binance Square Official
·
--
BTC価格を予測して最大$300 USDCを獲得しよう!
🚀 ビットコインが109kを超え、ATHを打ち破りました!次はどこへ行くのでしょうか?
今週の$BTCの終値予測をこの投稿のコメントに書き込んでください👇
🎁最も近い予測トップ3は、300 USDC、150 USDC、50 USDCを獲得します。今すぐ参加して予測を共有しましょう!
*キャンペーン期間: 2025-01-20 07:30 から 2025-01-26 20:00 (UTC)
‼️アプリを少なくともバージョン2.92に更新したことを確認してください。また、返信時に「再投稿する」ボックスがチェックされていることを確認して、エントリー資格を得てください。
利用規約:
今週の$BTCの終値予測をこの投稿のコメントに書き込んでください👇
🎁最も近い予測トップ3は、300 USDC、150 USDC、50 USDCを獲得します。今すぐ参加して予測を共有しましょう!
*キャンペーン期間: 2025-01-20 07:30 から 2025-01-26 20:00 (UTC)
‼️アプリを少なくともバージョン2.92に更新したことを確認してください。また、返信時に「再投稿する」ボックスがチェックされていることを確認して、エントリー資格を得てください。
利用規約:

147
ログインして、さらにコンテンツを読む
厳選トピックで世界の暗号資産トレーダーの仲間入り
⚡️ 暗号資産に関する最新かつ有益な情報が見つかります。
💬 世界最大の暗号資産取引所から信頼されています。
👍 認証を受けたクリエイターから、有益なインサイトを得られます。
メール / 電話番号
トレンドトピック
KeplrAdvisesSocialLoginUsersToTransferAssets
閲覧回数 574
50人が討論中
#KeplrAdvisesSocialLoginUsersToTransferAssets
KEPLR セキュリティ警告 — ソーシャルログインを利用した方はお読みください!
Keplrは、ソーシャルログイン(Google/Apple/メール)でウォレットを作成したユーザーに対し、リカバリーフレーズで保護されたウォレット、またはハードウェアウォレットに資産を移すよう推奨したと報じられています。
なぜでしょうか?
ソーシャルログイン=ウォレットへのアクセスを第三者に依存します。
リカバリーフレーズ/ハードウェアウォレット=自分自身で直接管理できます。
ソーシャルログインのウォレットを使っている場合は、今すぐ次のことをしてください。
1. リカバリーフレーズ付きの新しいウォレットを作成するか、Ledgerなどのハードウェアウォレットを接続します。
2. 送金前に、送金先アドレスとネットワークを慎重に確認します。ネットワークを間違えると、資金を失います。
3. まず少額のテスト送金をします。1~5ドルを送り、着金を確認してから、残高全額を移します。
4. リカバリーフレーズは紙に書き、オフラインで保管します。写真、クラウド、メモ、メッセージには絶対に保存しないでください。
5. シードフレーズは絶対に誰にも教えないでください。Keplrのサポートが尋ねることは絶対にありません。
6. 利用できる場合は、2要素認証を有効にします。
7. 偽のウォレットサポートメッセージやフィッシングサイトに注意してください。keplr.appのみを利用してください。
これはセキュリティ上の予防措置であり、価格についての意見ではありません。
偽の「Keplrサポート」からのDMで、すべてを失った人をあまりにも多く見てきました。次の被害者にならないでください。
KeplrはGoogleログインとシードフレーズのどちらで作成しましたか?
すでにハードウェアウォレットに移した方は、「保護済み」とコメントしてください。
#Keplr #CryptoSafety #SeedPhrase #Cosmos
$ATOM $OSMO $TIA
missCryptopkTrader-pk
·いいね:0件
·閲覧回数 15
TetherPlans€28.8MForJuventusCapitalIncrease
閲覧回数 604
54人が討論中
JobsReportRaisesHikeOdds
閲覧回数 630,917
3,896人が討論中