
Alamgir al
34 投稿

Alamgir al
報告
ユーザーをブロック
12 フォロー
4 フォロワー
38 いいね
投稿
·
--
翻訳参照
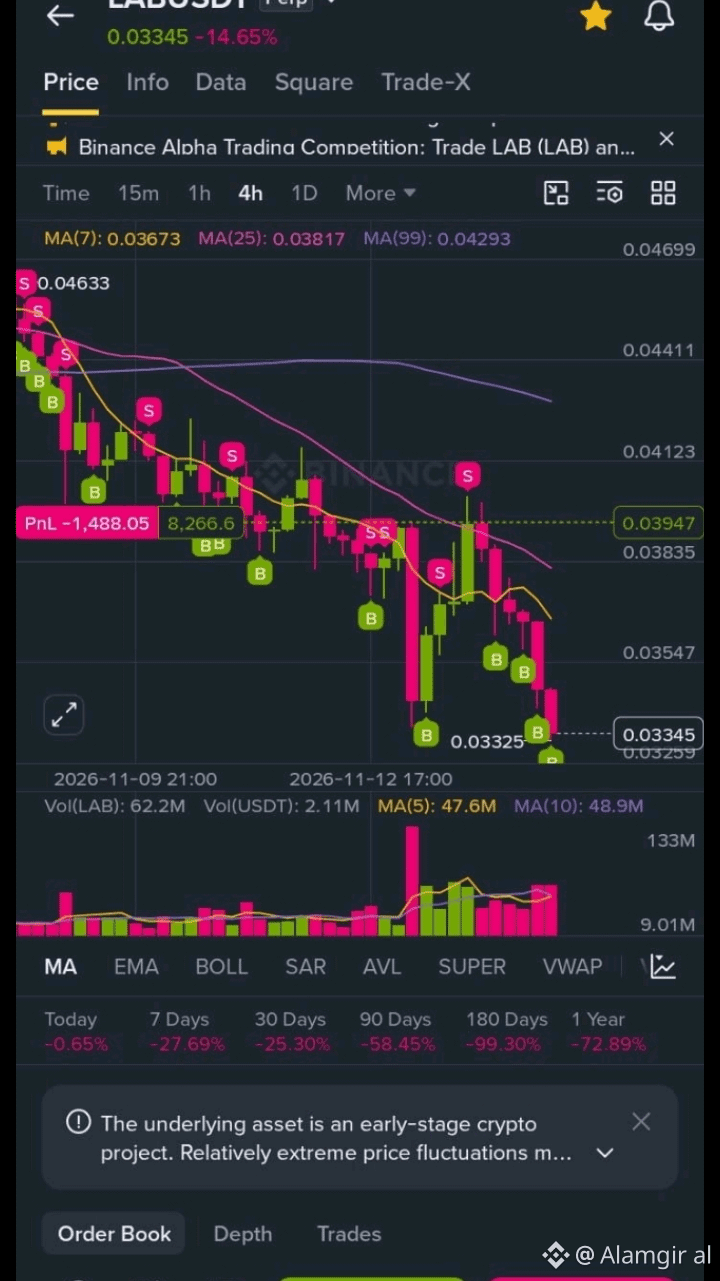
$LAB USDT
$LAB USDT Perp - 0.03345
Price: 0.03345 / Rs 9.25
Today: -14.65% DOWN
7 Days: -27.69% DOWN
180 Days: -99.30% DOWN
Chart is full downtrend. Price is below all MA lines - 7 0.03673, MA25 0.03817, MA99 0.04293.
Support: 0.03325 - If break, will go to 0.030
Resistance: 0.03673 - If go above, small bounce to 0.038
Don't buy now. Wait for price to go above 0.03673. Very risky coin.
#NvidiaBoardNotConsideringHuang’sReturnasCEO
$LAB USDT
$LAB USDT Perp - 0.03345
Price: 0.03345 / Rs 9.25
Today: -14.65% DOWN
7 Days: -27.69% DOWN
180 Days: -99.30% DOWN
Chart is full downtrend. Price is below all MA lines - 7 0.03673, MA25 0.03817, MA99 0.04293.
Support: 0.03325 - If break, will go to 0.030
Resistance: 0.03673 - If go above, small bounce to 0.038
Don't buy now. Wait for price to go above 0.03673. Very risky coin.
#NvidiaBoardNotConsideringHuang’sReturnasCEO
$LAB USDT Perp - 0.03345
Price: 0.03345 / Rs 9.25
Today: -14.65% DOWN
7 Days: -27.69% DOWN
180 Days: -99.30% DOWN
Chart is full downtrend. Price is below all MA lines - 7 0.03673, MA25 0.03817, MA99 0.04293.
Support: 0.03325 - If break, will go to 0.030
Resistance: 0.03673 - If go above, small bounce to 0.038
Don't buy now. Wait for price to go above 0.03673. Very risky coin.
#NvidiaBoardNotConsideringHuang’sReturnasCEO
1
68
·
--
ブリッシュ
翻訳参照
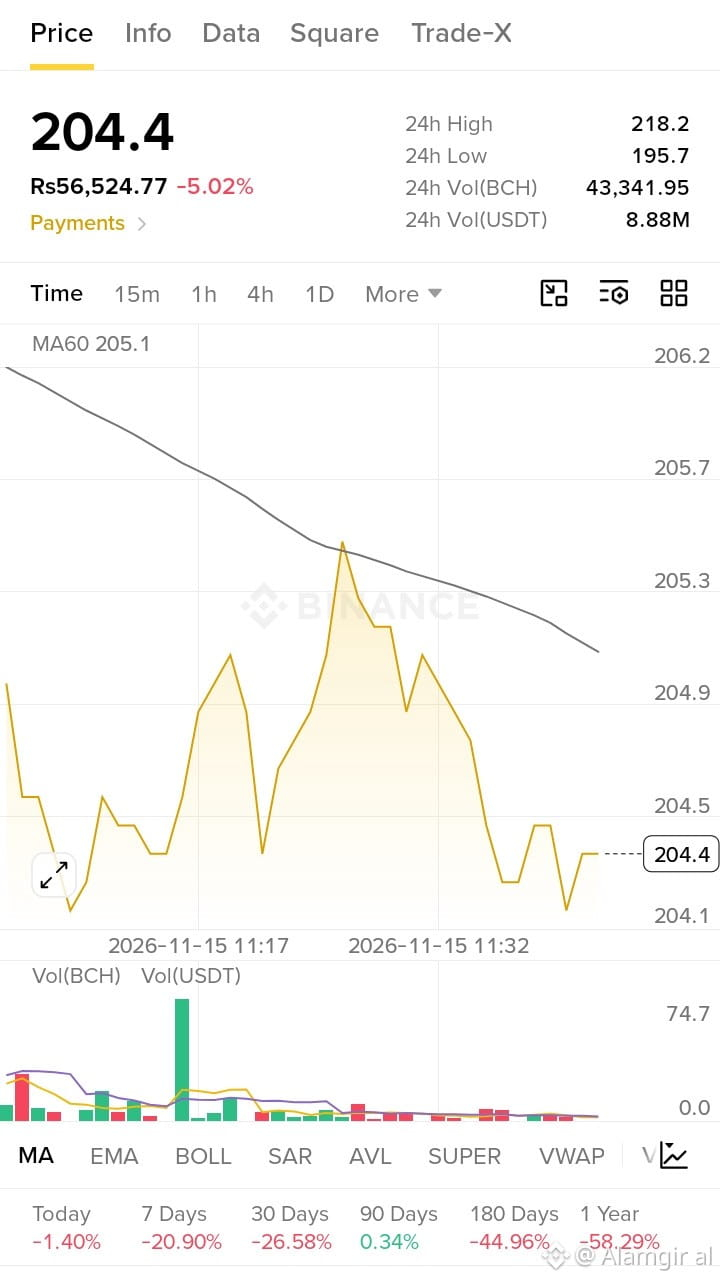
$BCH / USDT
1. Current Price
Price: 204.4 USDT
In Rupees: Rs 56,524.77
Today: -5.02% DOWN
1 BCH = 56 Thousand 524 Rupees.
2. Last 24 Hours
24h High: 218.2
24h Low: 195.7
24h Volume BCH: 43,341.95
24h Volume USDT: 8.88M
Volume is good. 8.88 Million dollars trading. This is a big, old coin, not a new small coin.
3. What Does The Chart Show
Look at the chart carefully. Price is falling.
Price was near 205.3, then it tried to go up 2-3 times to 205.0 and 205.2, but every time sellers pushed it down. At the end, it fell down to 204.1, then made a small bounce to 204.4.
The black line MA60 = 205.1. Price 204.4 is BELOW that line. That means sellers are winning now. Price is under the line. This is a weak sign.
At the bottom, you see one big green bar. That was one big buy. After that, volume is very low. No big buying, no big selling. Market is slow.
This is called a Downtrend. Lower high, lower low. Price is making a staircase going down.
4. Past Performance
Today: -1.40%
7 Days: -20.90%
30 Days: -26.58%
90 Days: +0.34%
180 Days: -44.96%
1 Year: -58.29%
Simple meaning: BCH is red in almost all. In 7 Days it fell -20.90%. In 1 Year it fell -58.29%.
If someone bought 1 year ago for 100 Rupees, now it is only 41 Rupees left. Very big loss.
BCH is the old brother of Bitcoin, but right now it is very weak.
$BCH is not a pump coin. It is a slow, old coin. Right now it is falling.
Buying now at 204.4 is risky because it is below MA60 and it is near its low.
Support.
195.7 This is the 24h Low. If it breaks this, it will go more down to 190 or 185.
Resistance: 205.1 This is MA60. If price goes above this and stays there, then it will be safe to buy again. Next target will be 218.2.
Don't catch a falling knife. Wait for it to come above 205.1.
#WhatWillDriveCryptoandStocks’NextRebound?
$BCH / USDT
1. Current Price
Price: 204.4 USDT
In Rupees: Rs 56,524.77
Today: -5.02% DOWN
1 BCH = 56 Thousand 524 Rupees.
2. Last 24 Hours
24h High: 218.2
24h Low: 195.7
24h Volume BCH: 43,341.95
24h Volume USDT: 8.88M
Volume is good. 8.88 Million dollars trading. This is a big, old coin, not a new small coin.
3. What Does The Chart Show
Look at the chart carefully. Price is falling.
Price was near 205.3, then it tried to go up 2-3 times to 205.0 and 205.2, but every time sellers pushed it down. At the end, it fell down to 204.1, then made a small bounce to 204.4.
The black line MA60 = 205.1. Price 204.4 is BELOW that line. That means sellers are winning now. Price is under the line. This is a weak sign.
At the bottom, you see one big green bar. That was one big buy. After that, volume is very low. No big buying, no big selling. Market is slow.
This is called a Downtrend. Lower high, lower low. Price is making a staircase going down.
4. Past Performance
Today: -1.40%
7 Days: -20.90%
30 Days: -26.58%
90 Days: +0.34%
180 Days: -44.96%
1 Year: -58.29%
Simple meaning: BCH is red in almost all. In 7 Days it fell -20.90%. In 1 Year it fell -58.29%.
If someone bought 1 year ago for 100 Rupees, now it is only 41 Rupees left. Very big loss.
BCH is the old brother of Bitcoin, but right now it is very weak.
$BCH is not a pump coin. It is a slow, old coin. Right now it is falling.
Buying now at 204.4 is risky because it is below MA60 and it is near its low.
Support.
195.7 This is the 24h Low. If it breaks this, it will go more down to 190 or 185.
Resistance: 205.1 This is MA60. If price goes above this and stays there, then it will be safe to buy again. Next target will be 218.2.
Don't catch a falling knife. Wait for it to come above 205.1.
#WhatWillDriveCryptoandStocks’NextRebound?
1. Current Price
Price: 204.4 USDT
In Rupees: Rs 56,524.77
Today: -5.02% DOWN
1 BCH = 56 Thousand 524 Rupees.
2. Last 24 Hours
24h High: 218.2
24h Low: 195.7
24h Volume BCH: 43,341.95
24h Volume USDT: 8.88M
Volume is good. 8.88 Million dollars trading. This is a big, old coin, not a new small coin.
3. What Does The Chart Show
Look at the chart carefully. Price is falling.
Price was near 205.3, then it tried to go up 2-3 times to 205.0 and 205.2, but every time sellers pushed it down. At the end, it fell down to 204.1, then made a small bounce to 204.4.
The black line MA60 = 205.1. Price 204.4 is BELOW that line. That means sellers are winning now. Price is under the line. This is a weak sign.
At the bottom, you see one big green bar. That was one big buy. After that, volume is very low. No big buying, no big selling. Market is slow.
This is called a Downtrend. Lower high, lower low. Price is making a staircase going down.
4. Past Performance
Today: -1.40%
7 Days: -20.90%
30 Days: -26.58%
90 Days: +0.34%
180 Days: -44.96%
1 Year: -58.29%
Simple meaning: BCH is red in almost all. In 7 Days it fell -20.90%. In 1 Year it fell -58.29%.
If someone bought 1 year ago for 100 Rupees, now it is only 41 Rupees left. Very big loss.
BCH is the old brother of Bitcoin, but right now it is very weak.
$BCH is not a pump coin. It is a slow, old coin. Right now it is falling.
Buying now at 204.4 is risky because it is below MA60 and it is near its low.
Support.
195.7 This is the 24h Low. If it breaks this, it will go more down to 190 or 185.
Resistance: 205.1 This is MA60. If price goes above this and stays there, then it will be safe to buy again. Next target will be 218.2.
Don't catch a falling knife. Wait for it to come above 205.1.
#WhatWillDriveCryptoandStocks’NextRebound?
1
126
·
--
翻訳参照
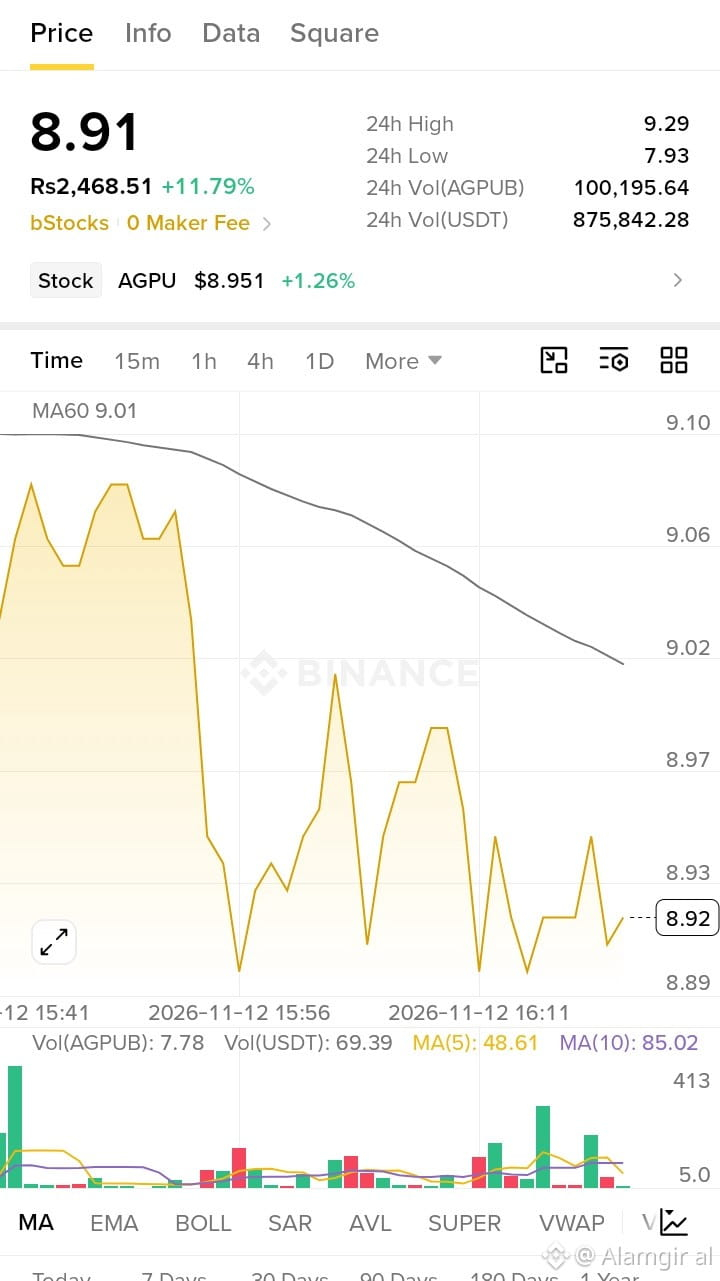
Support 1 $8.90
Support 2 $8.89
Lower support $8.80
3. Possible scenarios
If AGPUB breaks $9.02 and holds above it, the next possible targets are $9.10 and $9.29.
If the price breaks below $8.89, it could move towards $8.80.
4. My opinion
AGPUB has a strong daily gain, but its short-term chart is showing weakness. I would wait for confirmation above $9.02 rather than chase the price.
One question: Have you already bought AGPUB, or are you planning to buy?
I can help calculate entry price, stop-loss and take-profit levels.
Support 1 $8.90
Support 2 $8.89
Lower support $8.80
3. Possible scenarios
If AGPUB breaks $9.02 and holds above it, the next possible targets are $9.10 and $9.29.
If the price breaks below $8.89, it could move towards $8.80.
4. My opinion
AGPUB has a strong daily gain, but its short-term chart is showing weakness. I would wait for confirmation above $9.02 rather than chase the price.
One question: Have you already bought AGPUB, or are you planning to buy?
I can help calculate entry price, stop-loss and take-profit levels.
Support 2 $8.89
Lower support $8.80
3. Possible scenarios
If AGPUB breaks $9.02 and holds above it, the next possible targets are $9.10 and $9.29.
If the price breaks below $8.89, it could move towards $8.80.
4. My opinion
AGPUB has a strong daily gain, but its short-term chart is showing weakness. I would wait for confirmation above $9.02 rather than chase the price.
One question: Have you already bought AGPUB, or are you planning to buy?
I can help calculate entry price, stop-loss and take-profit levels.
1
56
·
--
弱気相場
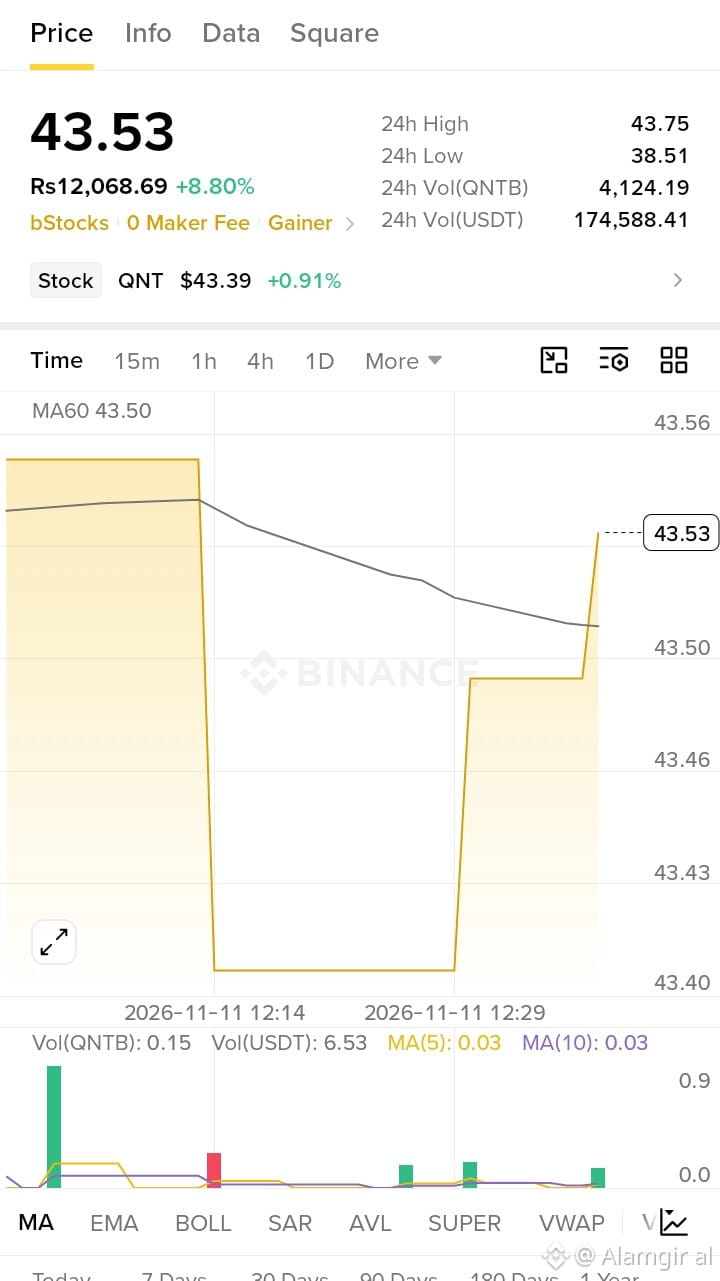
QNTB / USDT
これは普通の仮想通貨とは違います。一般的な仮想通貨ではありません。株式をトークン化したものです。
1. 現在価格
価格:43.53 USDT
ルピー換算:Rs 12,068.69
本日:+8.80% 上昇
実際の株価:QNT $43.39 +0.91%
実際の株価はわずか0.91%の上昇なのに、このトークンは8.80%も上昇しています。これは不思議です。
2. 過去24時間
24時間高値:43.75
24時間安値:38.51
24時間取引高:わずか174,588 USDT
取引高は非常に少なく、わずか17万4,000ドルです。つまり、ほとんど誰も取引していません。
3. チャートからわかること
チャートを見てください。普通のチャートではなく、階段のような形です。
最初は43.55で横ばいでしたが、その後43.40まで真っすぐ下落し、長い間その水準で横ばいになったあと、43.53まで一気に跳ね上がりました。
買い手も売り手もいないと、このようなことが起こります。価格が急に跳ねるのです。健全なチャートではありません。
黒い線のMA60は43.50です。価格の43.53はその線をわずかに上回っていますが、取引高がとても少ないため、ここでは何の意味もありません。
4. 過去の値動き
本日:+0.95%
7日間:+34.77%30日間:+5.32%
90日間:-36.28%
180日間:
1年間:
これは新しいトークンなので、過去の実績はありません。
簡単に言うと:
BTCやUNIのように取引しないでください。これはbStocksトークンです。米国株に連動しますが、Binanceでは取引する人がとても少ないため、価格が突然上下することがあり、売れなくなってしまう可能性があります。
ここで43.53で買って、明日誰も買いたがらなければ、簡単には売れません。
QNTB / USDT
これは普通の仮想通貨とは違います。一般的な仮想通貨ではありません。株式をトークン化したものです。
1. 現在価格
価格:43.53 USDT
ルピー換算:Rs 12,068.69
本日:+8.80% 上昇
実際の株価:QNT $43.39 +0.91%
実際の株価はわずか0.91%の上昇なのに、このトークンは8.80%も上昇しています。これは不思議です。
2. 過去24時間
24時間高値:43.75
24時間安値:38.51
24時間取引高:わずか174,588 USDT
取引高は非常に少なく、わずか17万4,000ドルです。つまり、ほとんど誰も取引していません。
3. チャートからわかること
チャートを見てください。普通のチャートではなく、階段のような形です。
最初は43.55で横ばいでしたが、その後43.40まで真っすぐ下落し、長い間その水準で横ばいになったあと、43.53まで一気に跳ね上がりました。
買い手も売り手もいないと、このようなことが起こります。価格が急に跳ねるのです。健全なチャートではありません。
黒い線のMA60は43.50です。価格の43.53はその線をわずかに上回っていますが、取引高がとても少ないため、ここでは何の意味もありません。
4. 過去の値動き
本日:+0.95%
7日間:+34.77%30日間:+5.32%
90日間:-36.28%
180日間:
1年間:
これは新しいトークンなので、過去の実績はありません。
簡単に言うと:
BTCやUNIのように取引しないでください。これはbStocksトークンです。米国株に連動しますが、Binanceでは取引する人がとても少ないため、価格が突然上下することがあり、売れなくなってしまう可能性があります。
ここで43.53で買って、明日誰も買いたがらなければ、簡単には売れません。
これは普通の仮想通貨とは違います。一般的な仮想通貨ではありません。株式をトークン化したものです。
1. 現在価格
価格:43.53 USDT
ルピー換算:Rs 12,068.69
本日:+8.80% 上昇
実際の株価:QNT $43.39 +0.91%
実際の株価はわずか0.91%の上昇なのに、このトークンは8.80%も上昇しています。これは不思議です。
2. 過去24時間
24時間高値:43.75
24時間安値:38.51
24時間取引高:わずか174,588 USDT
取引高は非常に少なく、わずか17万4,000ドルです。つまり、ほとんど誰も取引していません。
3. チャートからわかること
チャートを見てください。普通のチャートではなく、階段のような形です。
最初は43.55で横ばいでしたが、その後43.40まで真っすぐ下落し、長い間その水準で横ばいになったあと、43.53まで一気に跳ね上がりました。
買い手も売り手もいないと、このようなことが起こります。価格が急に跳ねるのです。健全なチャートではありません。
黒い線のMA60は43.50です。価格の43.53はその線をわずかに上回っていますが、取引高がとても少ないため、ここでは何の意味もありません。
4. 過去の値動き
本日:+0.95%
7日間:+34.77%30日間:+5.32%
90日間:-36.28%
180日間:
1年間:
これは新しいトークンなので、過去の実績はありません。
簡単に言うと:
BTCやUNIのように取引しないでください。これはbStocksトークンです。米国株に連動しますが、Binanceでは取引する人がとても少ないため、価格が突然上下することがあり、売れなくなってしまう可能性があります。
ここで43.53で買って、明日誰も買いたがらなければ、簡単には売れません。
2
91
·
--
翻訳参照
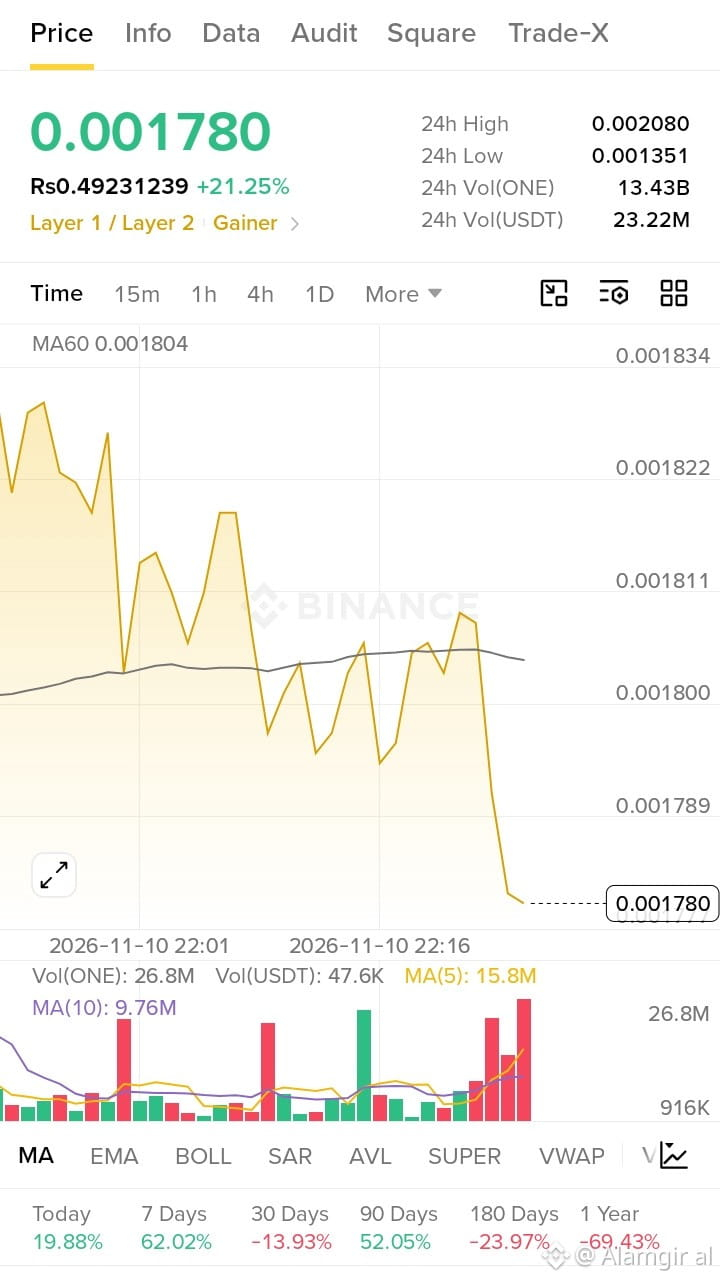
ONE / USDT
1. Current Price
Price: 0.001780 USDT
In Rupees: Rs 0.49
Today: +21.25% UP
It looks green, but look at the chart carefully.
2. Last 24 Hours
24h High: 0.002080
24h Low: 0.001351
24h Volume: 23.22M USDT
It means ONE was at 0.001351, it pumped up to 0.002080, and now it has fallen back to 0.001780.
3. What Does The Chart Show
In the chart, price was going up and down, then at the very end it fell down fast like a cliff.
The black line MA60 = 0.001804. Price 0.001780 is below that line now. That means the pump is finished for now, sellers are coming.
At the bottom, you see big RED bars. That means big selling volume at the end.
4. Past Performance
Today: +19.88%
7 Days: $AMZNB +62.02%
30 Days: 13.93%
90 Days: +52.05%
180 Days: -23.97%
1 Year: -69.43%
Simple meaning: ONE is up this week, but in 1 year it is still down -69%. Same like ADA. Old coin, big pump, big dump.
ONE is same story like INIT and JCT. It pumped today, now it is dumping. If you buy now, you are buying late.
If you already have ONE from low price, this is a good time to take profit. If you don't have it, don't chase it now.
Do you have ONE? Or you are thinking to buy because it is +21%
ONE / USDT
1. Current Price
Price: 0.001780 USDT
In Rupees: Rs 0.49
Today: +21.25% UP
It looks green, but look at the chart carefully.
2. Last 24 Hours
24h High: 0.002080
24h Low: 0.001351
24h Volume: 23.22M USDT
It means ONE was at 0.001351, it pumped up to 0.002080, and now it has fallen back to 0.001780.
3. What Does The Chart Show
In the chart, price was going up and down, then at the very end it fell down fast like a cliff.
The black line MA60 = 0.001804. Price 0.001780 is below that line now. That means the pump is finished for now, sellers are coming.
At the bottom, you see big RED bars. That means big selling volume at the end.
4. Past Performance
Today: +19.88%
7 Days: $AMZNB +62.02%
30 Days: 13.93%
90 Days: +52.05%
180 Days: -23.97%
1 Year: -69.43%
Simple meaning: ONE is up this week, but in 1 year it is still down -69%. Same like ADA. Old coin, big pump, big dump.
ONE is same story like INIT and JCT. It pumped today, now it is dumping. If you buy now, you are buying late.
If you already have ONE from low price, this is a good time to take profit. If you don't have it, don't chase it now.
Do you have ONE? Or you are thinking to buy because it is +21%
1. Current Price
Price: 0.001780 USDT
In Rupees: Rs 0.49
Today: +21.25% UP
It looks green, but look at the chart carefully.
2. Last 24 Hours
24h High: 0.002080
24h Low: 0.001351
24h Volume: 23.22M USDT
It means ONE was at 0.001351, it pumped up to 0.002080, and now it has fallen back to 0.001780.
3. What Does The Chart Show
In the chart, price was going up and down, then at the very end it fell down fast like a cliff.
The black line MA60 = 0.001804. Price 0.001780 is below that line now. That means the pump is finished for now, sellers are coming.
At the bottom, you see big RED bars. That means big selling volume at the end.
4. Past Performance
Today: +19.88%
7 Days: $AMZNB +62.02%
30 Days: 13.93%
90 Days: +52.05%
180 Days: -23.97%
1 Year: -69.43%
Simple meaning: ONE is up this week, but in 1 year it is still down -69%. Same like ADA. Old coin, big pump, big dump.
ONE is same story like INIT and JCT. It pumped today, now it is dumping. If you buy now, you are buying late.
If you already have ONE from low price, this is a good time to take profit. If you don't have it, don't chase it now.
Do you have ONE? Or you are thinking to buy because it is +21%
1
4
·
--
翻訳参照
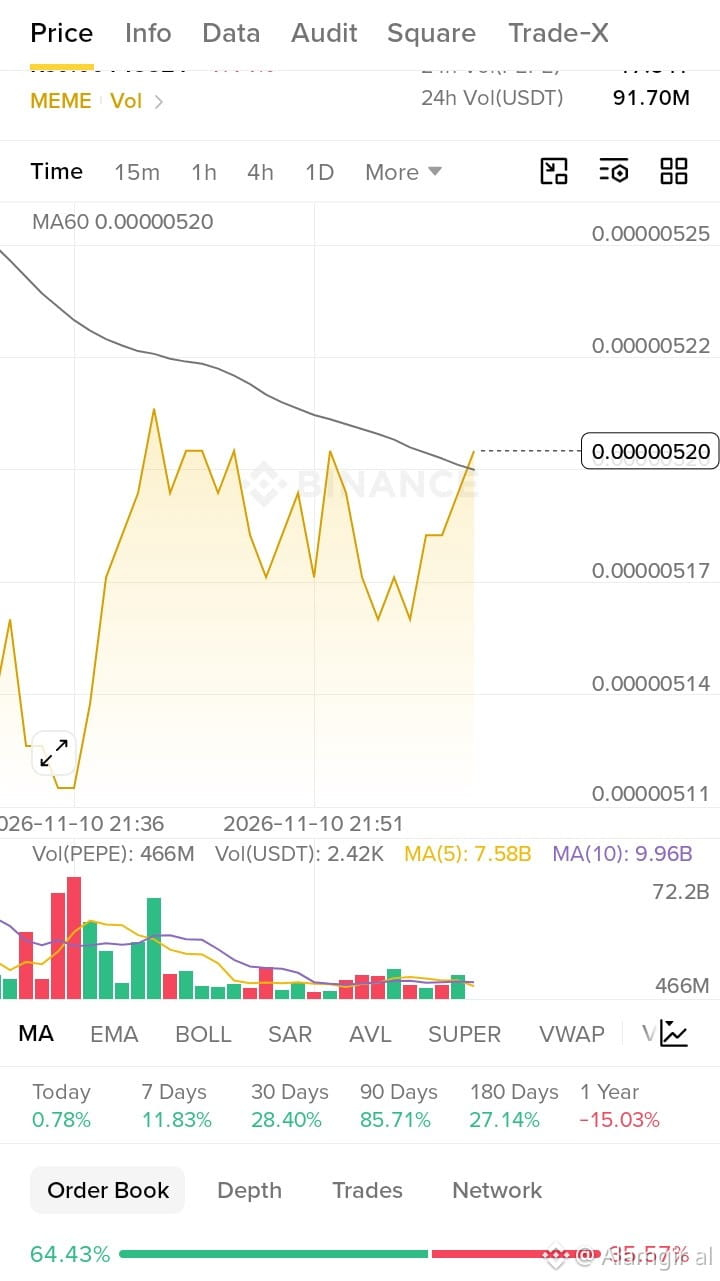
PEPE / USDT
1. Current Price
Price: 0.00000520 USDT
Today: 1.14% DOWN
Type: MEME coin it moves on hype, not on real use
Price has many zeros, so people buy it in billions.
2. Last 24 Hours
24h Volume: 91.70M USDT
That means many people are trading PEPE today. Volume is high.
3. What Does The Chart Show
In the chart, PEPE fell down, then went up again fast, and now it is at the top at 0.00000520.
The black line MA60 = 0.00000520. Price is exactly ON that line. That means PEPE is at a decision point. If it goes above, it can go up more. If it goes below, it can fall again.
4. Past Performance
Today: +0.78%
7 Days: +11.83%
30 Days: +28.40%
90 Days: +85.71%
180 Days: +27.14%
1 Year: 15.03%
Simple meaning: In the last 3 months, PEPE is up 85%, but in 1 year it is still down 15%. So it is recovering, but still not at its old high.
5. Order Book Very Important
At the bottom you see:
Green Buyers: 64.43%
Red Sellers: 35.57%
That means right now, more people want to BUY PEPE than SELL. That is a good short-term sign.
PEPE is better than XRP today. XRP is falling, PEPE is trying to go up.
But remember, PEPE is a MEME coin. It can go up 20% in one hour, and fall 20% in the next hour. Very fast, very risky.
Do you have PEPE Or you want to buy PEPE because it is cheap
PEPE / USDT
1. Current Price
Price: 0.00000520 USDT
Today: 1.14% DOWN
Type: MEME coin it moves on hype, not on real use
Price has many zeros, so people buy it in billions.
2. Last 24 Hours
24h Volume: 91.70M USDT
That means many people are trading PEPE today. Volume is high.
3. What Does The Chart Show
In the chart, PEPE fell down, then went up again fast, and now it is at the top at 0.00000520.
The black line MA60 = 0.00000520. Price is exactly ON that line. That means PEPE is at a decision point. If it goes above, it can go up more. If it goes below, it can fall again.
4. Past Performance
Today: +0.78%
7 Days: +11.83%
30 Days: +28.40%
90 Days: +85.71%
180 Days: +27.14%
1 Year: 15.03%
Simple meaning: In the last 3 months, PEPE is up 85%, but in 1 year it is still down 15%. So it is recovering, but still not at its old high.
5. Order Book Very Important
At the bottom you see:
Green Buyers: 64.43%
Red Sellers: 35.57%
That means right now, more people want to BUY PEPE than SELL. That is a good short-term sign.
PEPE is better than XRP today. XRP is falling, PEPE is trying to go up.
But remember, PEPE is a MEME coin. It can go up 20% in one hour, and fall 20% in the next hour. Very fast, very risky.
Do you have PEPE Or you want to buy PEPE because it is cheap
1. Current Price
Price: 0.00000520 USDT
Today: 1.14% DOWN
Type: MEME coin it moves on hype, not on real use
Price has many zeros, so people buy it in billions.
2. Last 24 Hours
24h Volume: 91.70M USDT
That means many people are trading PEPE today. Volume is high.
3. What Does The Chart Show
In the chart, PEPE fell down, then went up again fast, and now it is at the top at 0.00000520.
The black line MA60 = 0.00000520. Price is exactly ON that line. That means PEPE is at a decision point. If it goes above, it can go up more. If it goes below, it can fall again.
4. Past Performance
Today: +0.78%
7 Days: +11.83%
30 Days: +28.40%
90 Days: +85.71%
180 Days: +27.14%
1 Year: 15.03%
Simple meaning: In the last 3 months, PEPE is up 85%, but in 1 year it is still down 15%. So it is recovering, but still not at its old high.
5. Order Book Very Important
At the bottom you see:
Green Buyers: 64.43%
Red Sellers: 35.57%
That means right now, more people want to BUY PEPE than SELL. That is a good short-term sign.
PEPE is better than XRP today. XRP is falling, PEPE is trying to go up.
But remember, PEPE is a MEME coin. It can go up 20% in one hour, and fall 20% in the next hour. Very fast, very risky.
Do you have PEPE Or you want to buy PEPE because it is cheap
1
86
·
--
翻訳参照
BTC USDT
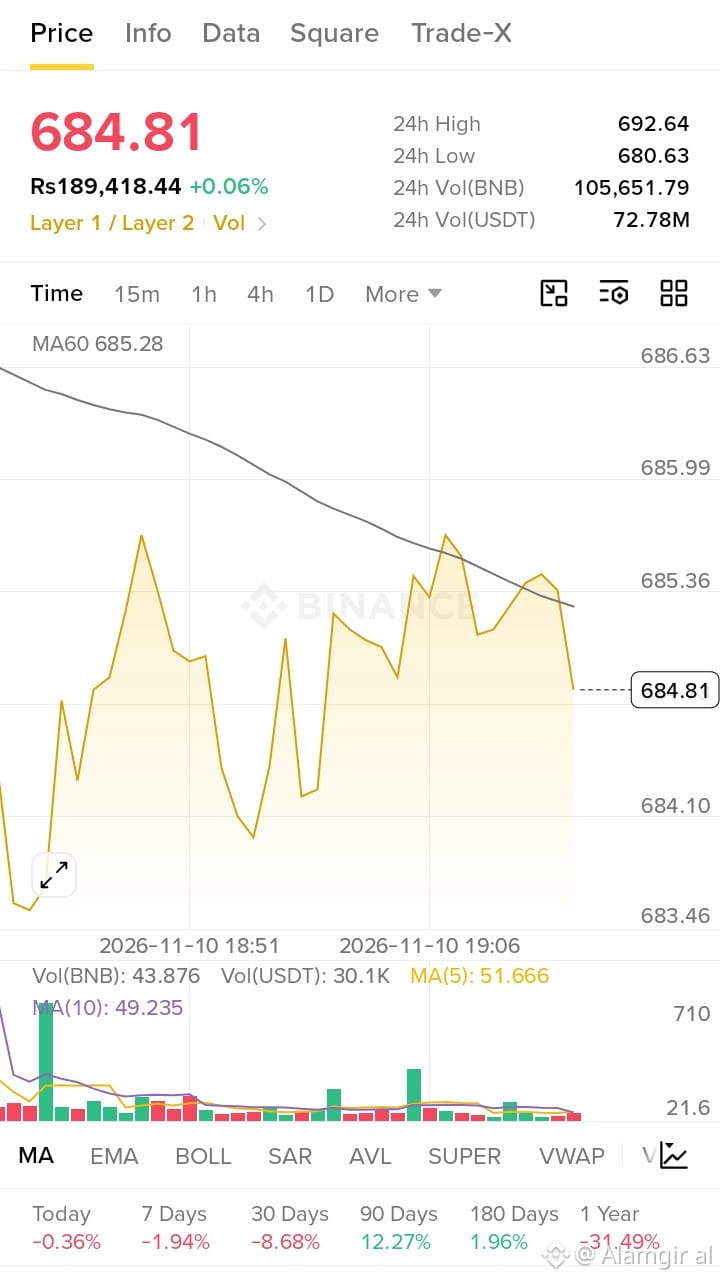
Here is your comparison of all 4 coins:
Coin Price Today Condition
BTC 74,073 -0.90% Going down slowly
XRP 1.0601 -3.13% Going down fast
BNB 684.81 +0.06% Stable, strongest today
JCT 0.0126 +352% Pump, very risky
*In one line:
BNB is the best today. XRP is the worst today. JCT is a trap, don't buy now.
BTC USDT
Here is your comparison of all 4 coins:
Coin Price Today Condition
BTC 74,073 -0.90% Going down slowly
XRP 1.0601 -3.13% Going down fast
BNB 684.81 +0.06% Stable, strongest today
JCT 0.0126 +352% Pump, very risky
*In one line:
BNB is the best today. XRP is the worst today. JCT is a trap, don't buy now.
Here is your comparison of all 4 coins:
Coin Price Today Condition
BTC 74,073 -0.90% Going down slowly
XRP 1.0601 -3.13% Going down fast
BNB 684.81 +0.06% Stable, strongest today
JCT 0.0126 +352% Pump, very risky
*In one line:
BNB is the best today. XRP is the worst today. JCT is a trap, don't buy now.
1
411
·
--
翻訳参照
A SOL post getting over 120,000 views doesn't mean I got the market right.
I said before I was planning to hold SOL until it hits 200. Some people supported me in the comments, others laughed at me for holding stubbornly.
But this is the most interesting thing about trading:
It's easy to talk bullish or bearish. It's totally different when you put your own money on the line and take the real risk.
I'm still holding. And yes, I'm still in unrealized loss.
Whether I make money or lose money, the market will decide.
I will keep documenting this trade publicly until the final result.
If I profit, I won't brag. If I lose, I won't hide it.
Would you rather follow people who predict price every day, or people who dare to share their real trade results?
#SOL #LiveTradeLog
A SOL post getting over 120,000 views doesn't mean I got the market right.
I said before I was planning to hold SOL until it hits 200. Some people supported me in the comments, others laughed at me for holding stubbornly.
But this is the most interesting thing about trading:
It's easy to talk bullish or bearish. It's totally different when you put your own money on the line and take the real risk.
I'm still holding. And yes, I'm still in unrealized loss.
Whether I make money or lose money, the market will decide.
I will keep documenting this trade publicly until the final result.
If I profit, I won't brag. If I lose, I won't hide it.
Would you rather follow people who predict price every day, or people who dare to share their real trade results?
#SOL #LiveTradeLog
I said before I was planning to hold SOL until it hits 200. Some people supported me in the comments, others laughed at me for holding stubbornly.
But this is the most interesting thing about trading:
It's easy to talk bullish or bearish. It's totally different when you put your own money on the line and take the real risk.
I'm still holding. And yes, I'm still in unrealized loss.
Whether I make money or lose money, the market will decide.
I will keep documenting this trade publicly until the final result.
If I profit, I won't brag. If I lose, I won't hide it.
Would you rather follow people who predict price every day, or people who dare to share their real trade results?
#SOL #LiveTradeLog
1
29
·
--
翻訳参照
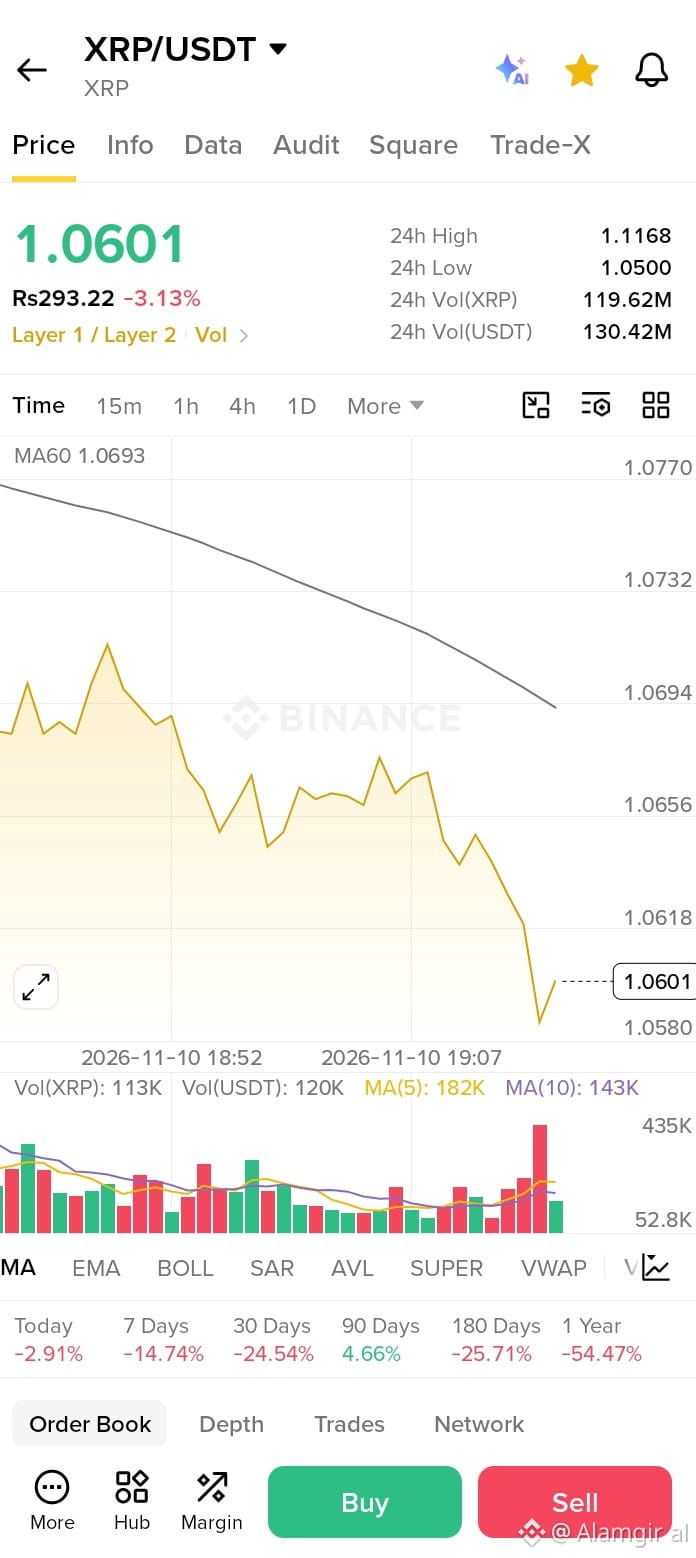
XRP/USDT
1. BTC - Bitcoin
Price: 74,073 USDT
Today: -0.90% down
2. XRP - Ripple
Price: 1.0601 USDT
Today: -3.13% down
Simple meaning in English:
Both coins are going DOWN today.
But XRP is falling much faster than BTC.
BTC in 1 month = -10%
XRP in 1 month = -24%
So BTC is stronger than XRP right now.
Tell me in English, what do you want to do?
1. Do you want to BUY?
2. Do you want to SELL?
3. Do you just want to LEARN?
XRP/USDT
1. BTC - Bitcoin
Price: 74,073 USDT
Today: -0.90% down
2. XRP - Ripple
Price: 1.0601 USDT
Today: -3.13% down
Simple meaning in English:
Both coins are going DOWN today.
But XRP is falling much faster than BTC.
BTC in 1 month = -10%
XRP in 1 month = -24%
So BTC is stronger than XRP right now.
Tell me in English, what do you want to do?
1. Do you want to BUY?
2. Do you want to SELL?
3. Do you just want to LEARN?
1. BTC - Bitcoin
Price: 74,073 USDT
Today: -0.90% down
2. XRP - Ripple
Price: 1.0601 USDT
Today: -3.13% down
Simple meaning in English:
Both coins are going DOWN today.
But XRP is falling much faster than BTC.
BTC in 1 month = -10%
XRP in 1 month = -24%
So BTC is stronger than XRP right now.
Tell me in English, what do you want to do?
1. Do you want to BUY?
2. Do you want to SELL?
3. Do you just want to LEARN?
1
137
·
--
翻訳参照
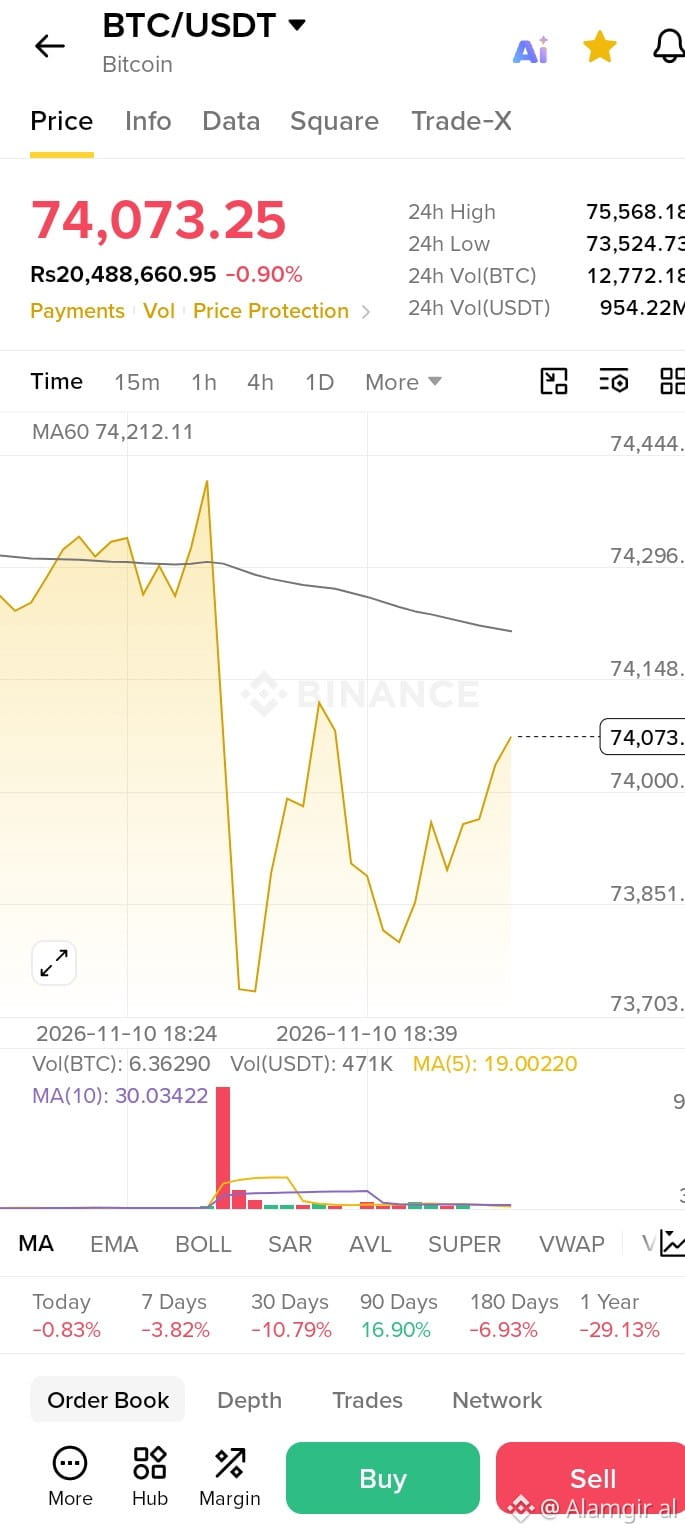
BTC/USDT (Bitcoin)chart on Binance.
1. Current Price
2.Price: 74,073.25 USDT
3. In Pakistani Rupees: Rs 20,488,660.95
4.Today: 0.90% down
2 Last 24 Hours
24h High: 75,568.18
24h Low: 73,524.73
24h Volume: 954.22M USDT
It means Bitcoin went up to 75,568 and then fell down to 73,524 today.
3. What Does The Chart Show?
You can see in the chart, the price suddenly dropped from around 75,000 to 73,700, and now it has recovered a little to 74,073.
The black line on top is MA60 = 74,212.11. The price is below this line. That means the market is a little weak right now (downtrend).
4. Past Performance
Today: -0.83%
7 Days: -3.82%
30 Days: -10.79%
90 Days: +16.90%
1 Year: -29.13%
So Bitcoin has been going down for the last 1 month, and in 1 year it is down 29%.
*What does it mean for you?*
If you have already bought Bitcoin, you are in loss right now. If you are thinking to buy new, don't hurry because the market is still going down.
BTC/USDT (Bitcoin)chart on Binance.
1. Current Price
2.Price: 74,073.25 USDT
3. In Pakistani Rupees: Rs 20,488,660.95
4.Today: 0.90% down
2 Last 24 Hours
24h High: 75,568.18
24h Low: 73,524.73
24h Volume: 954.22M USDT
It means Bitcoin went up to 75,568 and then fell down to 73,524 today.
3. What Does The Chart Show?
You can see in the chart, the price suddenly dropped from around 75,000 to 73,700, and now it has recovered a little to 74,073.
The black line on top is MA60 = 74,212.11. The price is below this line. That means the market is a little weak right now (downtrend).
4. Past Performance
Today: -0.83%
7 Days: -3.82%
30 Days: -10.79%
90 Days: +16.90%
1 Year: -29.13%
So Bitcoin has been going down for the last 1 month, and in 1 year it is down 29%.
*What does it mean for you?*
If you have already bought Bitcoin, you are in loss right now. If you are thinking to buy new, don't hurry because the market is still going down.
1. Current Price
2.Price: 74,073.25 USDT
3. In Pakistani Rupees: Rs 20,488,660.95
4.Today: 0.90% down
2 Last 24 Hours
24h High: 75,568.18
24h Low: 73,524.73
24h Volume: 954.22M USDT
It means Bitcoin went up to 75,568 and then fell down to 73,524 today.
3. What Does The Chart Show?
You can see in the chart, the price suddenly dropped from around 75,000 to 73,700, and now it has recovered a little to 74,073.
The black line on top is MA60 = 74,212.11. The price is below this line. That means the market is a little weak right now (downtrend).
4. Past Performance
Today: -0.83%
7 Days: -3.82%
30 Days: -10.79%
90 Days: +16.90%
1 Year: -29.13%
So Bitcoin has been going down for the last 1 month, and in 1 year it is down 29%.
*What does it mean for you?*
If you have already bought Bitcoin, you are in loss right now. If you are thinking to buy new, don't hurry because the market is still going down.
1
86
·
--
翻訳参照
Without being greedy, how much money do you need right now to solve all your problems?
Without being greedy, how much money do you need right now to solve all your problems?

1
77
·
--
翻訳参照
$USDC : around $86,000
📈 Trend: Short-term bullish
🔼 Resistance: $87,000–$87,500
🔽 Support: $84,300–$85,300
🎯 Upside: A confirmed break above $87,500 could open the way toward $90,000.
$USDC
⚠️ A drop below $84,300 could weaken the bullish setup and bring $82,000 into focus.
#USDC✅ #EthereumValidatorExitQueueJumps392%
#Nikkei225Jumps2.5%ToThreeMonthHigh
#DriftHackVictimsBeginClaims
USDC
1.00107
-0.01%
$USDC : around $86,000
📈 Trend: Short-term bullish
🔼 Resistance: $87,000–$87,500
🔽 Support: $84,300–$85,300
🎯 Upside: A confirmed break above $87,500 could open the way toward $90,000.
$USDC
⚠️ A drop below $84,300 could weaken the bullish setup and bring $82,000 into focus.
#USDC✅ #EthereumValidatorExitQueueJumps392%
#Nikkei225Jumps2.5%ToThreeMonthHigh
#DriftHackVictimsBeginClaims
USDC
1.00107
-0.01%
📈 Trend: Short-term bullish
🔼 Resistance: $87,000–$87,500
🔽 Support: $84,300–$85,300
🎯 Upside: A confirmed break above $87,500 could open the way toward $90,000.
$USDC
⚠️ A drop below $84,300 could weaken the bullish setup and bring $82,000 into focus.
#USDC✅ #EthereumValidatorExitQueueJumps392%
#Nikkei225Jumps2.5%ToThreeMonthHigh
#DriftHackVictimsBeginClaims
USDC
1.00107
-0.01%
1
30
ログインして、さらにコンテンツを読む
厳選トピックで世界の暗号資産トレーダーの仲間入り
⚡️ 暗号資産に関する最新かつ有益な情報が見つかります。
💬 世界最大の暗号資産取引所から信頼されています。
👍 認証を受けたクリエイターから、有益なインサイトを得られます。
メール / 電話番号