
AREm0n
取引を発注

LISTAホルダー
高頻度トレーダー
1.7年
9 フォロー
38 フォロワー
46 いいね
投稿
ポートフォリオ
すべて
引用


Crypto PM
·
--
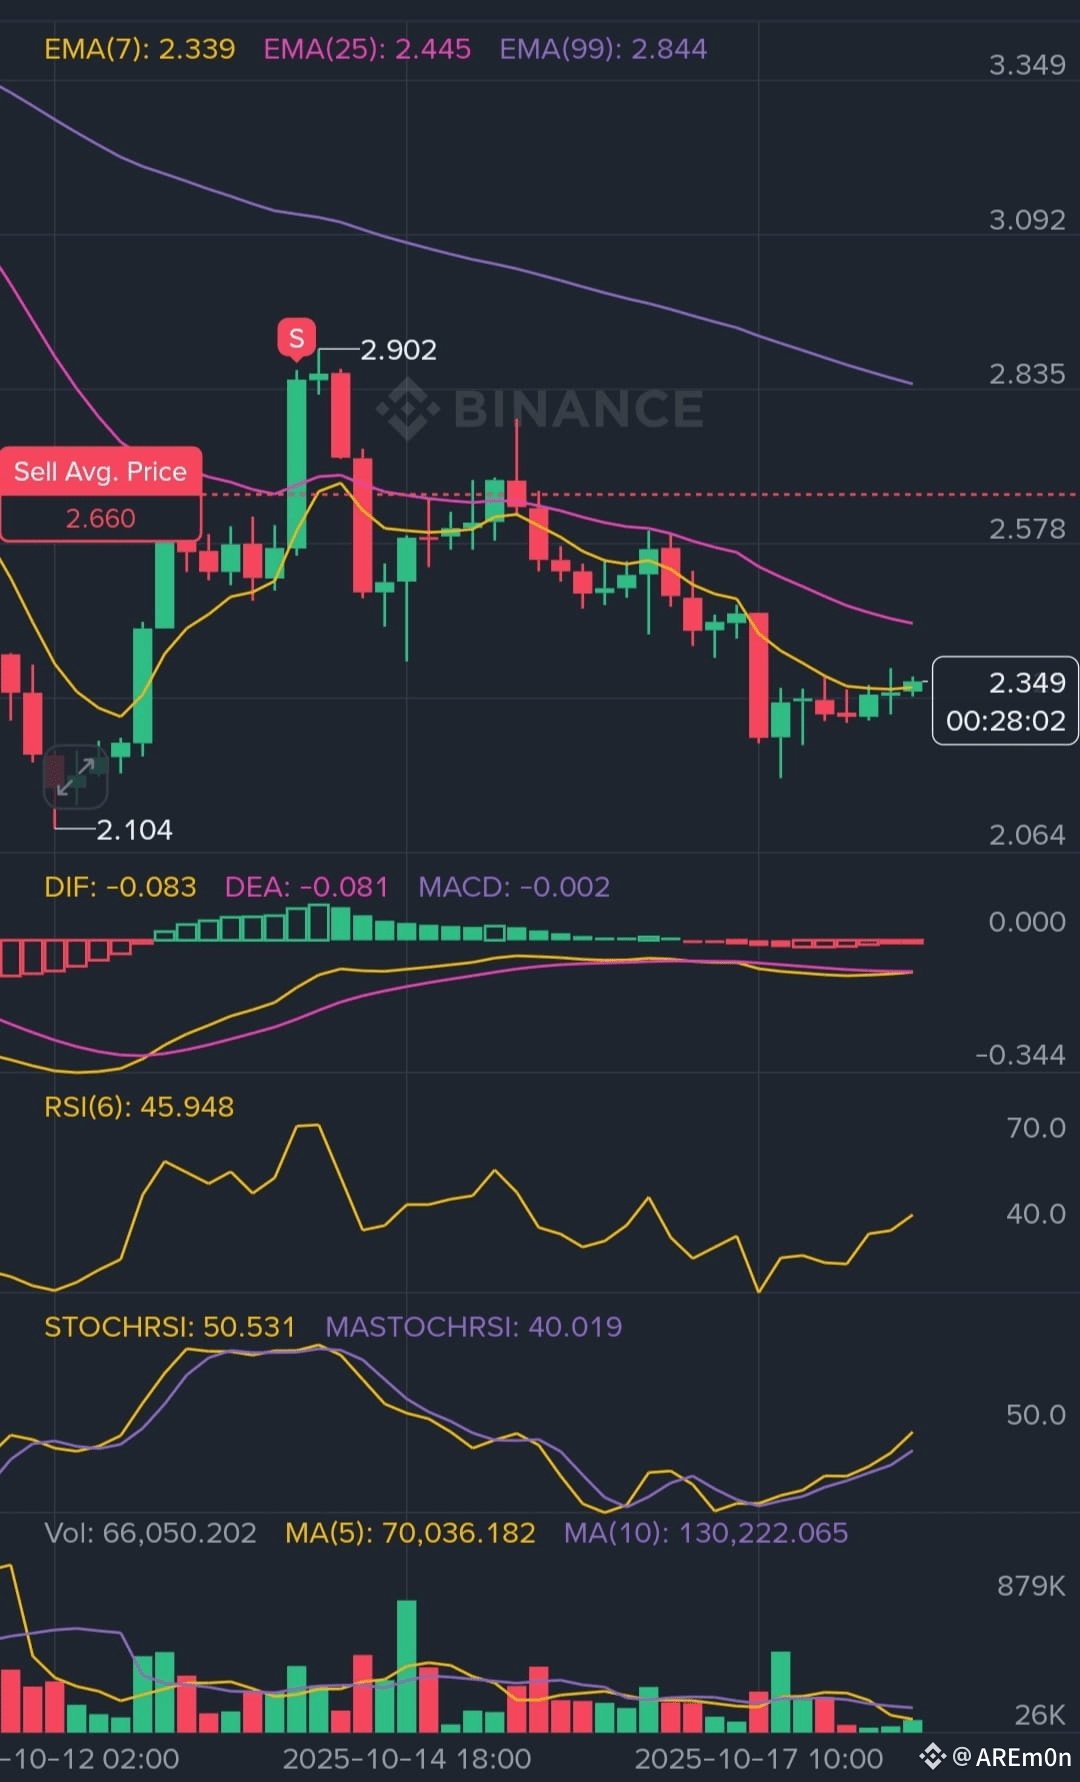
ブリッシュどんなに状況が悪くなっても、俺の相棒はいつでもトレードする準備ができてる $BTC 😂


Bozitari
·
--
🚀 ミリオネアアラート! 🚀
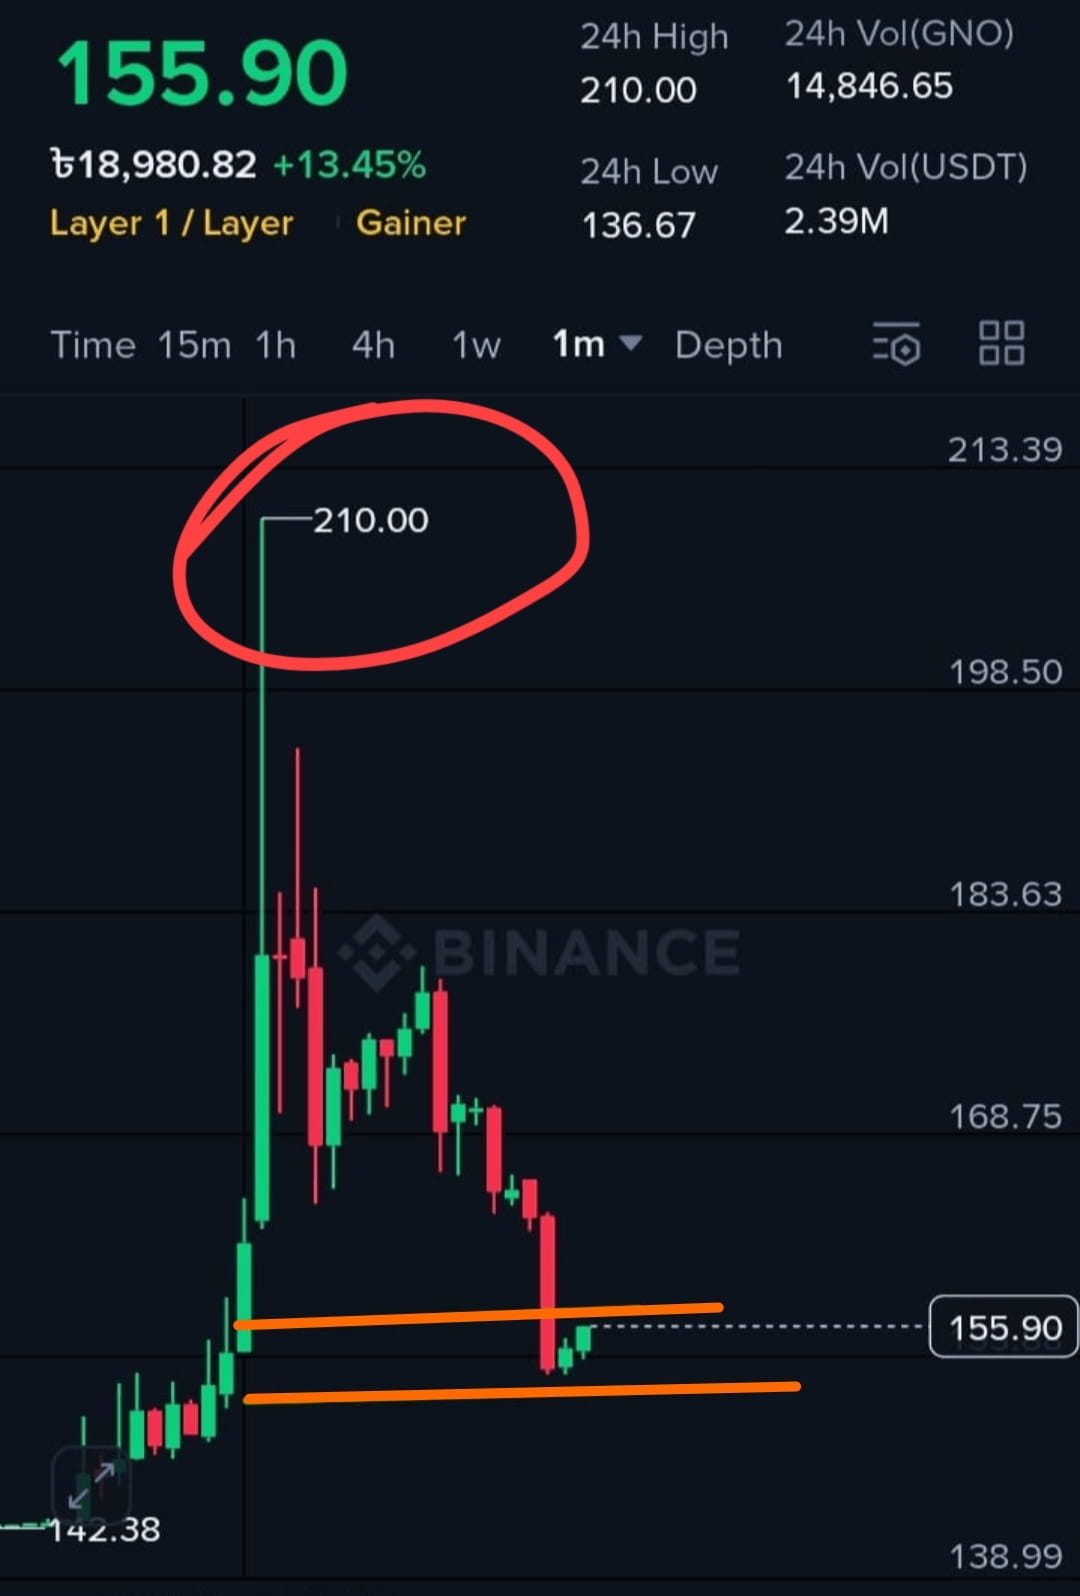
$GNO が次の大きな火の動きのために準備中 🔥
$155 から $300 がもうすぐ来る? 👀💥
このチャートは #BOOOOOOLISH と叫んでいます🥳🤩
私は買って、保持して、月への飛躍を待っています 🌙✨
他に誰が私と一緒にこの波に乗っていますか? 💎🙌
#GNO #CryptoArmy
$GNO が次の大きな火の動きのために準備中 🔥
$155 から $300 がもうすぐ来る? 👀💥
このチャートは #BOOOOOOLISH と叫んでいます🥳🤩
私は買って、保持して、月への飛躍を待っています 🌙✨
他に誰が私と一緒にこの波に乗っていますか? 💎🙌
#GNO #CryptoArmy

Hua BNB
·
--
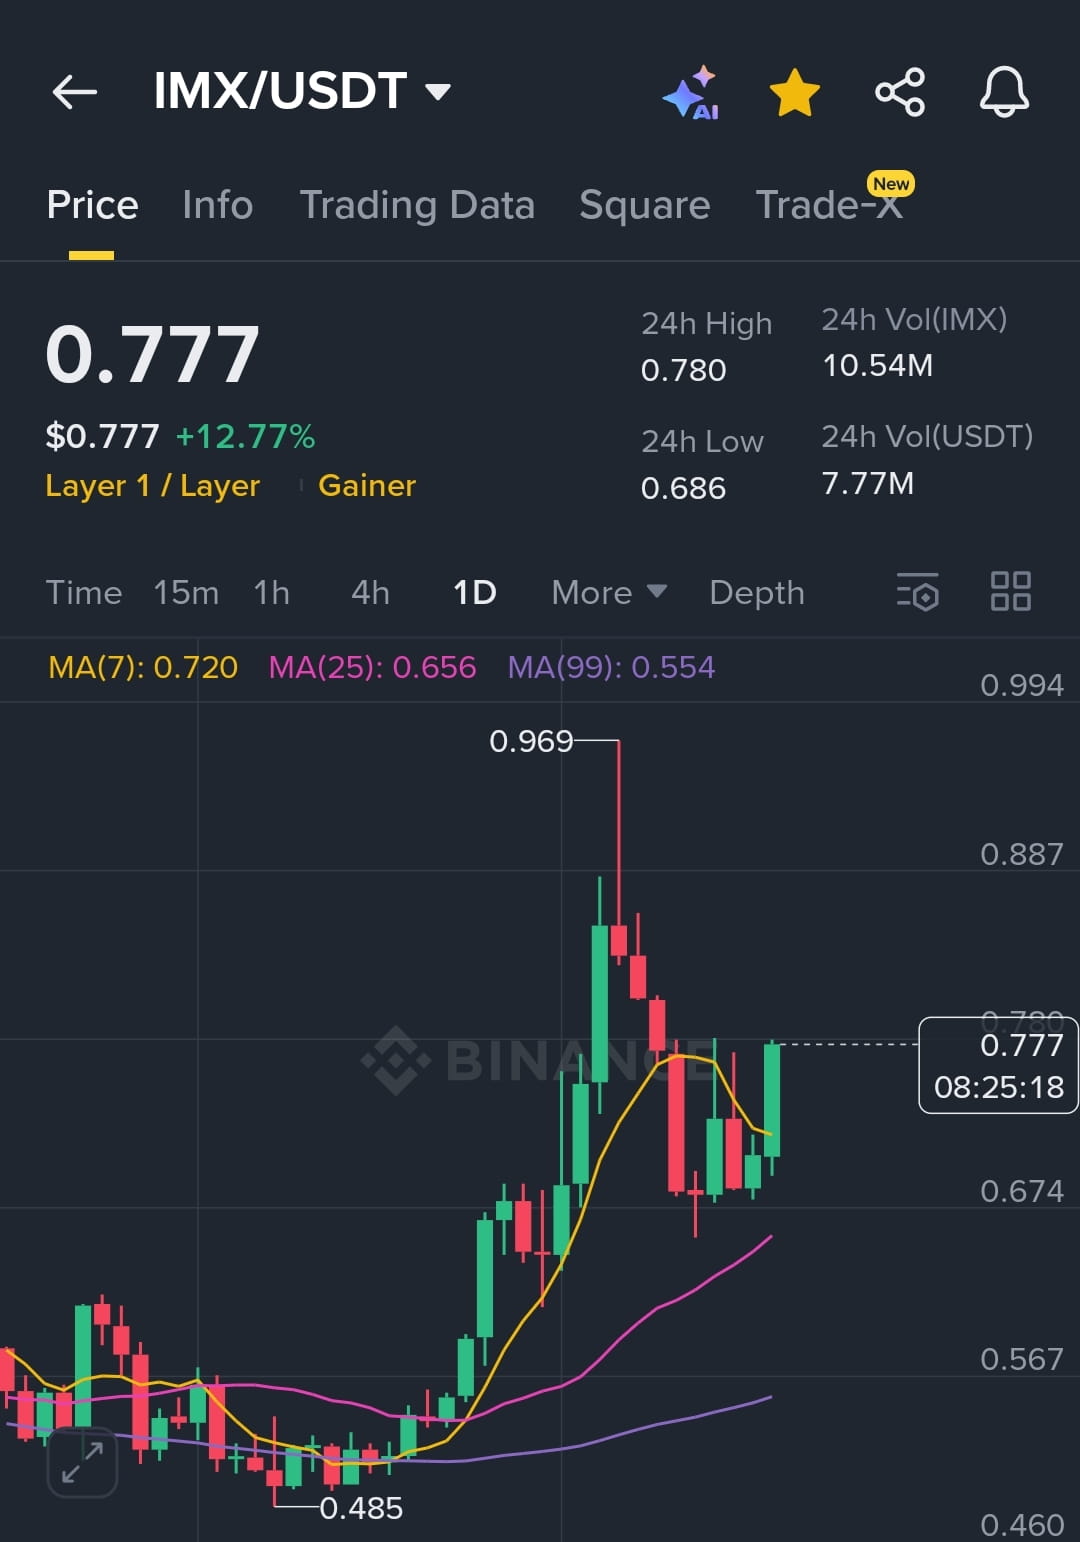
ブリッシュ🚀 $IMX Bulls Gearing Up — ブレイクアウトの可能性は$0.80!
取引のセットアップ:
🎯 エントリーゾーン: $0.75 – $0.77
💰 利益確定: $0.80 | $0.85 | $0.90
🛑 ストップロス: $0.70
市場の雰囲気:
🔥 24時間の取引量: $84.7M — 強い流動性
📈 最近の急騰: 過去24時間で+11.7% — モメンタムが高まっている
📉 サポートレベル: $0.70 & $0.68 — 注目すべき重要なゾーン
プロのヒント:
もし$IMX が$0.75以上を維持し、$0.80を突破すれば、上昇ターゲットに向けた強気のラリーが引き起こされる可能性があります。アラートを設定して準備しておきましょう!
#PCEInflationWatch #MarketPullback #DogecoinETFProgress #PerpDEXRace #AltcoinStrategicReserves
取引のセットアップ:
🎯 エントリーゾーン: $0.75 – $0.77
💰 利益確定: $0.80 | $0.85 | $0.90
🛑 ストップロス: $0.70
市場の雰囲気:
🔥 24時間の取引量: $84.7M — 強い流動性
📈 最近の急騰: 過去24時間で+11.7% — モメンタムが高まっている
📉 サポートレベル: $0.70 & $0.68 — 注目すべき重要なゾーン
プロのヒント:
もし$IMX が$0.75以上を維持し、$0.80を突破すれば、上昇ターゲットに向けた強気のラリーが引き起こされる可能性があります。アラートを設定して準備しておきましょう!
#PCEInflationWatch #MarketPullback #DogecoinETFProgress #PerpDEXRace #AltcoinStrategicReserves
Hua BNB
·
--
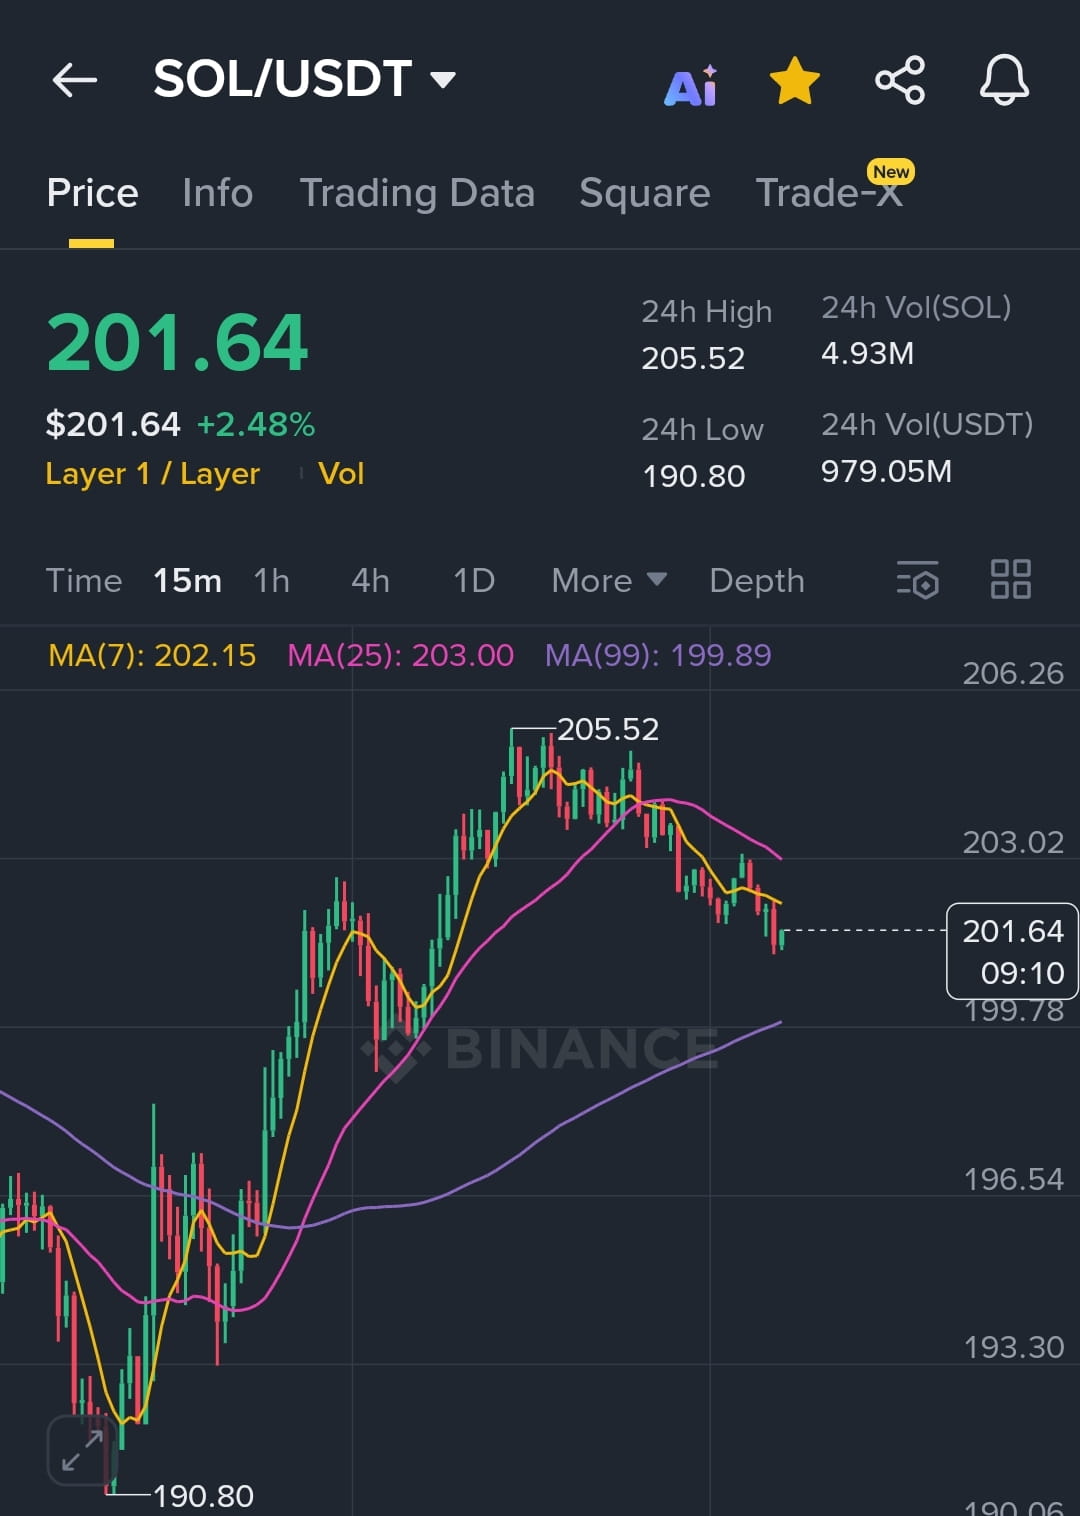
ブリッシュみんな、$SOL は今完璧な位置にいます 🚀 すでに上昇する兆しを見せています! 🔥 チャンスを逃さないで — スポットで買い込んで、次のレベルまで波に乗りましょう 🤝 そして、$220に達するまでしっかり持っていてください 🤝
Hua BNB
·
--
ブリッシュ市場は少し下落し、人々はさらに崩壊するのではないかとパニックになっています 📉😨…
しかし、賢いプレイヤーは知っています — これはさらなるディップを購入するための黄金の時期です! 🛒🔥
恐怖が支配すると、機会が生まれます。 🚀💰
$BTC $BNB $ETH
#BuyTheDip #CryptoMarket #SmartTrading #AltSeason #FearToFortune
しかし、賢いプレイヤーは知っています — これはさらなるディップを購入するための黄金の時期です! 🛒🔥
恐怖が支配すると、機会が生まれます。 🚀💰
$BTC $BNB $ETH
#BuyTheDip #CryptoMarket #SmartTrading #AltSeason #FearToFortune



Binance News
·
--
バイナンスマーケットアップデート: 暗号市場のトレンド | 2025年9月4日
CoinMarketCapのデータによると、世界の暗号通貨市場の時価総額は現在$3.83Tで、過去24時間で0.25%減少しています。[Bitcoin (BTC)](https://www.binance.com/en/trade/BTC_USDT?utm_source=news&utm_medium=flashnews&utm_term=cta-news)は、過去24時間で$110,280と$112,575の間で取引されています。今日の09:30 AM (UTC)時点で、BTCは$110,811で取引されており、0.28%下落しています。時価総額で最も主要な暗号通貨は混合取引を行っています。市場を上回るものには [TREE](https://www.binance.com/en/trade/TREE_USDT?utm_source=news&utm_medium=flashnews&utm_term=cta-news)、[NEWT](https://www.binance.com/en/trade/NEWT_USDT?utm_source=news&utm_medium=flashnews&utm_term=cta-news)、および [FORM](https://www.binance.com/en/trade/FORM_USDT?utm_source=news&utm_medium=flashnews&utm_term=cta-news) が含まれ、それぞれ14%、10%、および9%上昇しています。今日のトップストーリー:

TradeMaster2319
·
--
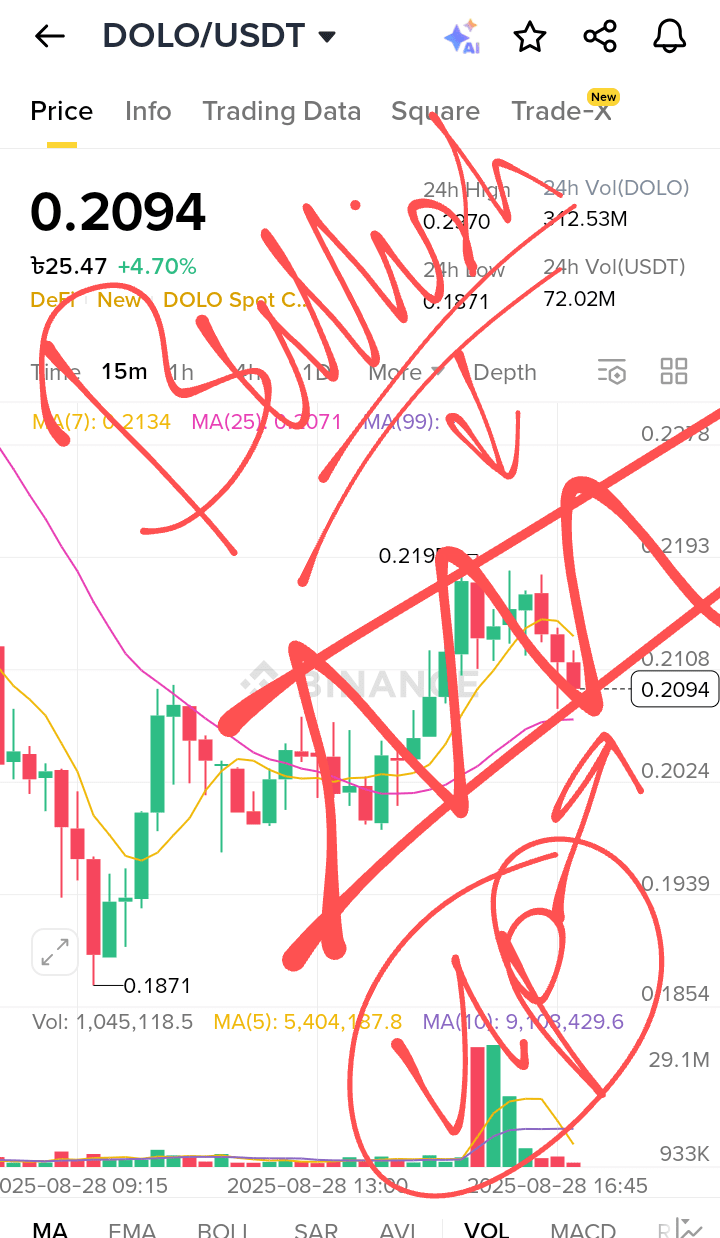
ブリッシュ$DOLO
🔥 大きな熱の爆発が来ています 🚀
ここで$DOLO からの大きな利益を得る良い機会があります🤑🤑⚡⚡💰
早く行って買ってください
$DOLO
.20
+8.80%
今月中に$1に達するでしょう。私のこのラインに注意してください。
今すぐ購入できます...💲💲
🔥 大きな熱の爆発が来ています 🚀
ここで$DOLO からの大きな利益を得る良い機会があります🤑🤑⚡⚡💰
早く行って買ってください
$DOLO
.20
+8.80%
今月中に$1に達するでしょう。私のこのラインに注意してください。
今すぐ購入できます...💲💲

MangoLegend
·
--
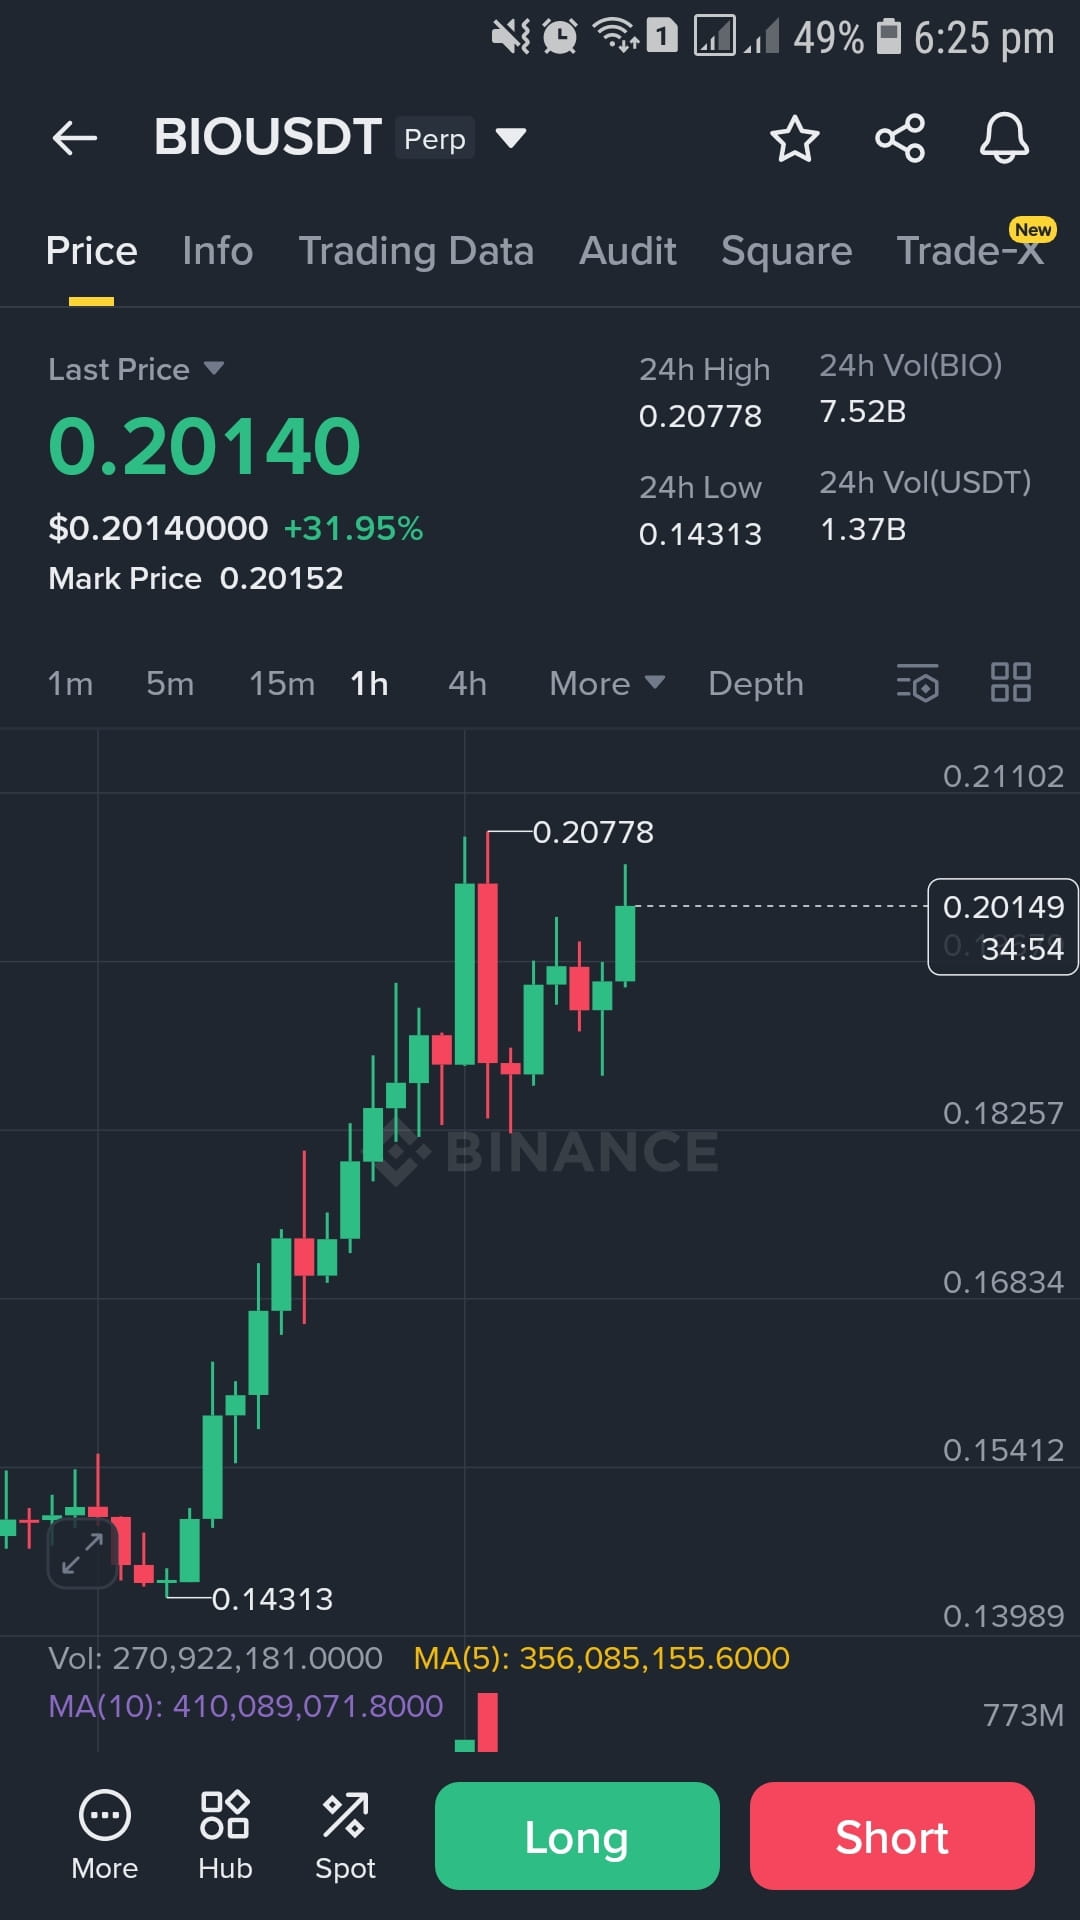
ブリッシュ$BIO 皆さん、もしすぐに甘い利益を得たいのであれば、午後7時の1時間キャンドルが開いた瞬間にロングポジションを開くことをお勧めします。ちょっとした迅速な利益です。
さて、なぜそれが重要なのかと思うかもしれませんが、それは0.22または0.25に直行するからです。これを逃さないでください。
さて、なぜそれが重要なのかと思うかもしれませんが、それは0.22または0.25に直行するからです。これを逃さないでください。

A L I Usman
·
--
ブリッシュ**\$ADA — 歴史は繰り返されるのか、それとも今回のランはさらに大きくなるのか?**
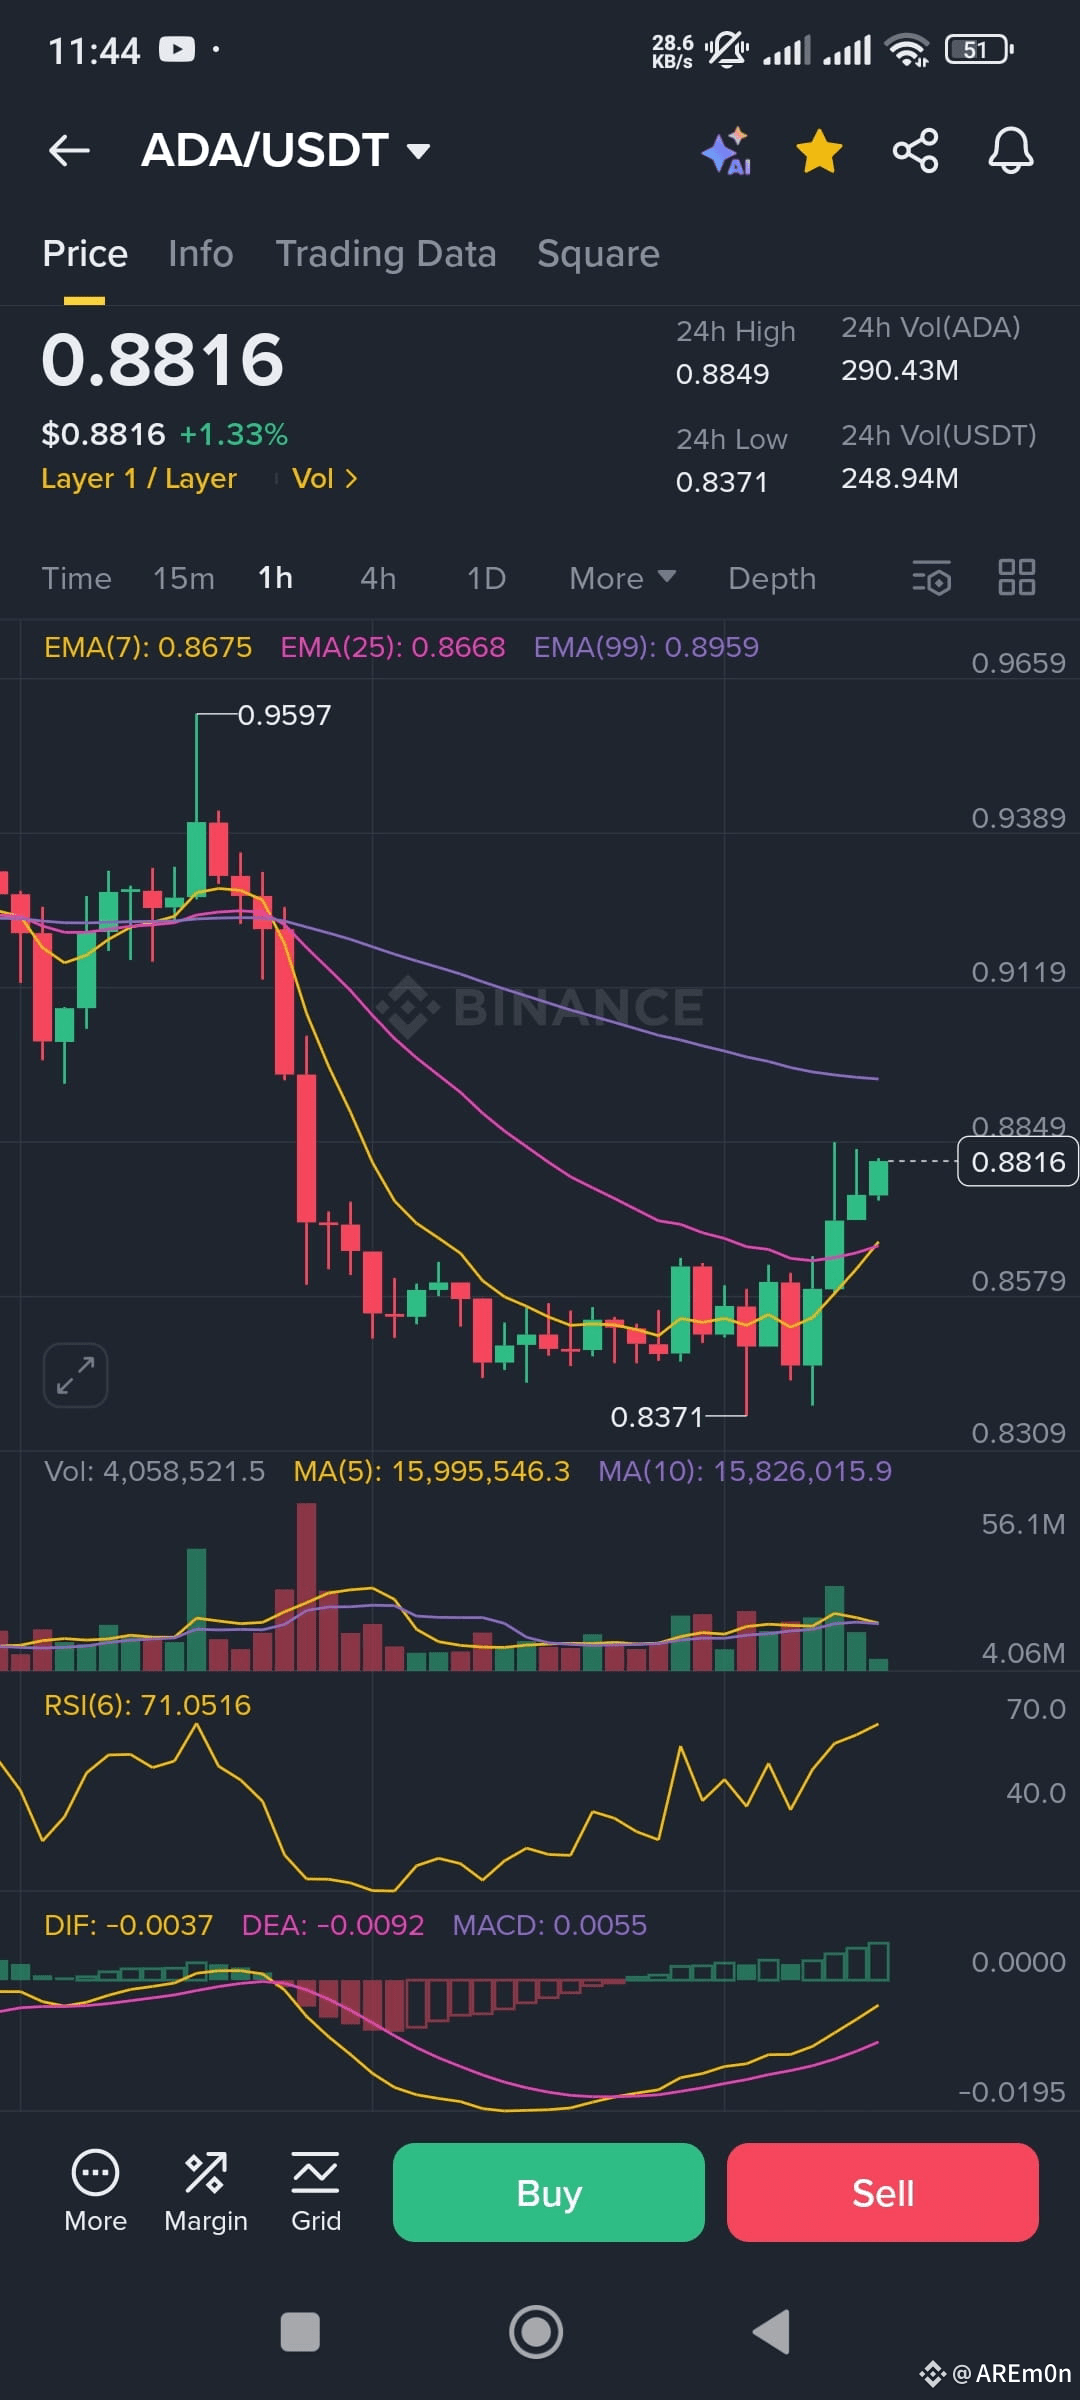
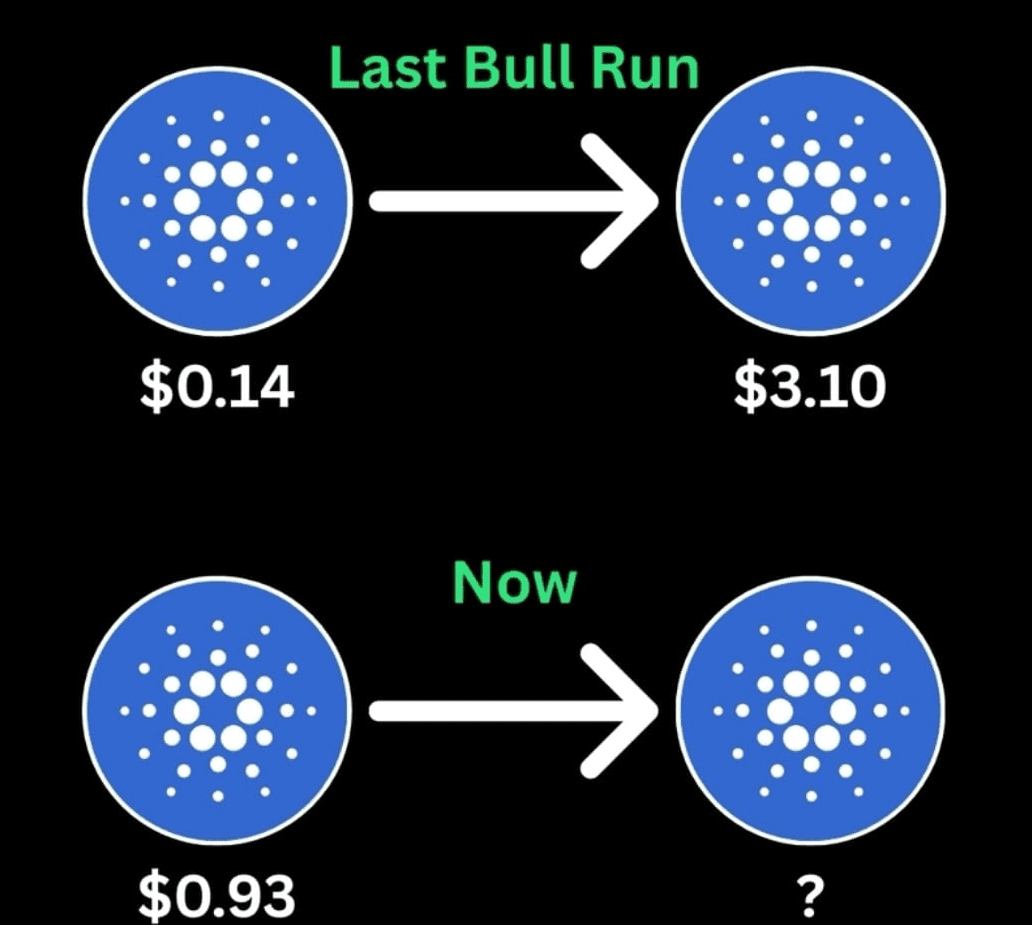
前回のブルサイクルでは、ADAは**\$0.14**から**\$3.10**まで爆発的に上昇しました — 巨額の**+2,114%**の急騰です。今日、ADAは**\$0.93**で取引されており、もし勢いが前回のサイクルと同じなら、**\$20+**のレベルを目指すことができるかもしれません。
**今回は違う理由:**
📈 ADAのエコシステムは成熟しました — より強力なDeFi、NFT、そして増大する機関投資家の関心。
🔥 前回のサイクルの盛り上がりは*可能性*についてでした;今回は*実現と採用*についてです。
💡 ブルランは指数関数的な感情に乗る — 市場が目覚めると、動きは早く起こります。
**注目すべき重要なレベル:**
* **\$1.20:** ブレイクアウトのトリガー
* **\$3.10:** 前回の$ATH
* ATH以上: 価格発見モード
もしADAが前回のラリーを繰り返すなら、上昇の可能性は巨大です。本当の質問は — あなたはそれに備えていますか?
\#Cardano #ADA #BullRun #altcoins #Binance
前回のブルサイクルでは、ADAは**\$0.14**から**\$3.10**まで爆発的に上昇しました — 巨額の**+2,114%**の急騰です。今日、ADAは**\$0.93**で取引されており、もし勢いが前回のサイクルと同じなら、**\$20+**のレベルを目指すことができるかもしれません。
**今回は違う理由:**
📈 ADAのエコシステムは成熟しました — より強力なDeFi、NFT、そして増大する機関投資家の関心。
🔥 前回のサイクルの盛り上がりは*可能性*についてでした;今回は*実現と採用*についてです。
💡 ブルランは指数関数的な感情に乗る — 市場が目覚めると、動きは早く起こります。
**注目すべき重要なレベル:**
* **\$1.20:** ブレイクアウトのトリガー
* **\$3.10:** 前回の$ATH
* ATH以上: 価格発見モード
もしADAが前回のラリーを繰り返すなら、上昇の可能性は巨大です。本当の質問は — あなたはそれに備えていますか?
\#Cardano #ADA #BullRun #altcoins #Binance
ログインして、さらにコンテンツを読む