

Ch _ Arslan
16 投稿

Ch _ Arslan
報告
ユーザーをブロック
1 フォロー
19 フォロワー
37 いいね
投稿
すべて
引用
·
--
⚡️ ホワイトハウスが水曜日の午後2時30分(ET)に暗号資産の会合を確認
トランプ氏、SEC議長、CFTC議長を含む当局者の出席が見込まれています。あわせてCME、Nasdaq、ICE、DTCC、NYSE、そして暗号資産企業のCoinbase、a16z、Gemini、Robinhoodの代表者も参加予定です。
@just 📄
⚡️ ホワイトハウスが水曜日の午後2時30分(ET)に暗号資産の会合を確認
トランプ氏、SEC議長、CFTC議長を含む当局者の出席が見込まれています。あわせてCME、Nasdaq、ICE、DTCC、NYSE、そして暗号資産企業のCoinbase、a16z、Gemini、Robinhoodの代表者も参加予定です。
@just 📄
トランプ氏、SEC議長、CFTC議長を含む当局者の出席が見込まれています。あわせてCME、Nasdaq、ICE、DTCC、NYSE、そして暗号資産企業のCoinbase、a16z、Gemini、Robinhoodの代表者も参加予定です。
@just 📄
75

·
--
翻訳参照
⚡️ Donald Trump has just announced 10%–25% tariffs on EU goods to pressure Denmark into selling Greenland
Countries include:
• France
• Finland
• Norway
• Sweden
• Denmark
• Germany
• Netherlands
• United Kingdom
Trump administration says these tariffs will rise to 25% starting June 1st unless an agreement is reached to acquire Greenland.
⚡️ Donald Trump has just announced 10%–25% tariffs on EU goods to pressure Denmark into selling Greenland
Countries include:
• France
• Finland
• Norway
• Sweden
• Denmark
• Germany
• Netherlands
• United Kingdom
Trump administration says these tariffs will rise to 25% starting June 1st unless an agreement is reached to acquire Greenland.
Countries include:
• France
• Finland
• Norway
• Sweden
• Denmark
• Germany
• Netherlands
• United Kingdom
Trump administration says these tariffs will rise to 25% starting June 1st unless an agreement is reached to acquire Greenland.
2
62
·
--
翻訳参照
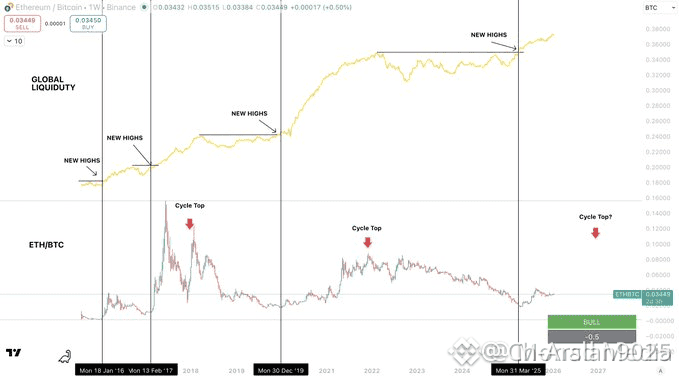
I think when a chart like ETH/BTC gets posted, most people don't understand that it follows a very strict pattern.
They think that it doesn't matter if its going up today... they think it could just reverse tomorrow and go all the way down again.
But that is not how it works.
Different charts follow different patterns, and ETH/BTC is one of the most important ones to understand when it comes to overall market position.
Ethereum is a risky asset and highly sensitive to liquidity.
And as we can see from this chart, ETH/BTC begins to outperform and get stronger against Bitcoin, only once the Global liquidity index breaks into new highs.
After the GLI breaks into new highs and continues then continues higher, is when Ethereum really finds its strength and goes into its own price discovery...
Sending ETH/BTC into aggressive moves higher and reaching the cycle top.
A very interesting thing to note is that each GLI breakout is getting higher and longer...
And this one has only been happening for 9 months, with ETH/BTC reversing exactly around that time.
So, again...
This is not the phase in which the cycle has peaked.
This is the phase in which liquidity is becoming abundant and moving up the risk curve.
We are not just seeing this in Crypto with ETH/BTC, we are seeing the exact same thing in Stocks with the Russell 2000.
What I am trying to help you understand here is that once these charts enter the next phase of these patterns, they don't just stop.
This is a cyclical event, not because of time, but because of liquidity.
And liquidity has not peaked yet.
I think when a chart like ETH/BTC gets posted, most people don't understand that it follows a very strict pattern.
They think that it doesn't matter if its going up today... they think it could just reverse tomorrow and go all the way down again.
But that is not how it works.
Different charts follow different patterns, and ETH/BTC is one of the most important ones to understand when it comes to overall market position.
Ethereum is a risky asset and highly sensitive to liquidity.
And as we can see from this chart, ETH/BTC begins to outperform and get stronger against Bitcoin, only once the Global liquidity index breaks into new highs.
After the GLI breaks into new highs and continues then continues higher, is when Ethereum really finds its strength and goes into its own price discovery...
Sending ETH/BTC into aggressive moves higher and reaching the cycle top.
A very interesting thing to note is that each GLI breakout is getting higher and longer...
And this one has only been happening for 9 months, with ETH/BTC reversing exactly around that time.
So, again...
This is not the phase in which the cycle has peaked.
This is the phase in which liquidity is becoming abundant and moving up the risk curve.
We are not just seeing this in Crypto with ETH/BTC, we are seeing the exact same thing in Stocks with the Russell 2000.
What I am trying to help you understand here is that once these charts enter the next phase of these patterns, they don't just stop.
This is a cyclical event, not because of time, but because of liquidity.
And liquidity has not peaked yet.
They think that it doesn't matter if its going up today... they think it could just reverse tomorrow and go all the way down again.
But that is not how it works.
Different charts follow different patterns, and ETH/BTC is one of the most important ones to understand when it comes to overall market position.
Ethereum is a risky asset and highly sensitive to liquidity.
And as we can see from this chart, ETH/BTC begins to outperform and get stronger against Bitcoin, only once the Global liquidity index breaks into new highs.
After the GLI breaks into new highs and continues then continues higher, is when Ethereum really finds its strength and goes into its own price discovery...
Sending ETH/BTC into aggressive moves higher and reaching the cycle top.
A very interesting thing to note is that each GLI breakout is getting higher and longer...
And this one has only been happening for 9 months, with ETH/BTC reversing exactly around that time.
So, again...
This is not the phase in which the cycle has peaked.
This is the phase in which liquidity is becoming abundant and moving up the risk curve.
We are not just seeing this in Crypto with ETH/BTC, we are seeing the exact same thing in Stocks with the Russell 2000.
What I am trying to help you understand here is that once these charts enter the next phase of these patterns, they don't just stop.
This is a cyclical event, not because of time, but because of liquidity.
And liquidity has not peaked yet.
1
25
·
--
COVID以外での最大の貨幣拡張の一つ。
兆の新しい元がREAL資産を追いかけている:
• 金
• 銀
• 銅
• レアアース
ここに問題があります:
年間の銀生産量 ≈ 800M オンス。
推定銀行のショートエクスポージャー ≈ 4.4 BILLION オンス。
もう一度読んでください。
それは地球の年間供給の>5倍です。
もし銀が上昇し続ければ、大手銀行は存続の危機に直面します。
これはもはや投機ではありません。
これはプレッシャーです。🔥📉
COVID以外での最大の貨幣拡張の一つ。
兆の新しい元がREAL資産を追いかけている:
• 金
• 銀
• 銅
• レアアース
ここに問題があります:
年間の銀生産量 ≈ 800M オンス。
推定銀行のショートエクスポージャー ≈ 4.4 BILLION オンス。
もう一度読んでください。
それは地球の年間供給の>5倍です。
もし銀が上昇し続ければ、大手銀行は存続の危機に直面します。
これはもはや投機ではありません。
これはプレッシャーです。🔥📉
兆の新しい元がREAL資産を追いかけている:
• 金
• 銀
• 銅
• レアアース
ここに問題があります:
年間の銀生産量 ≈ 800M オンス。
推定銀行のショートエクスポージャー ≈ 4.4 BILLION オンス。
もう一度読んでください。
それは地球の年間供給の>5倍です。
もし銀が上昇し続ければ、大手銀行は存続の危機に直面します。
これはもはや投機ではありません。
これはプレッシャーです。🔥📉
2
646


·
--

155
ログインして、さらにコンテンツを読む
厳選トピックで世界の暗号資産トレーダーの仲間入り
⚡️ 暗号資産に関する最新かつ有益な情報が見つかります。
💬 世界最大の暗号資産取引所から信頼されています。
👍 認証を受けたクリエイターから、有益なインサイトを得られます。
メール / 電話番号
トレンドトピック
QNTRises287%
閲覧回数 6,052
213人が討論中
🚨 QNTが爆発!+287%! 🔥
+287%は“正常な動き”ではありません。👀
QNTが突然放物線状(パラボリック)に上昇し、モメンタムと出来高の急増によってトレーダーが警戒を強めています。
⚠️ このような激しい値動きの後は、FOMO(取り残される不安)が危険になることもあります。ボラティリティは
どちらにも転び得ます。
📈 注目:継続する出来高 + ブレイク確認
📉 リスク:急な利確 / 押し戻し
🔥 QNTはまだ始まったばかり…それともこの値動きは大きな調整の準備ができている?
あなたのQNT目標は?👇
#qntrises287% #QNT #Quant #crypto #BinanceSquare
$QNT
ASHFAQ NAEEM
·いいね:6件
·閲覧回数 4k
HSBCNamesStablecoinRedCoinForPhasedLaunch
閲覧回数 326
31人が討論中
TrumpRejectsAIRulesForVoluntaryAudits
閲覧回数 9,953
329人が討論中