

Expert _Guide
3.1k 投稿
Expert _Guide
 厳選トピック確認済
報告
ユーザーをブロック
Free Trading Signal for Begginers.Future price predictions and latest crypto update ✅
低高頻度トレーダー
2.5年
13 フォロー
50.6K+ フォロワー
38.3K いいね
投稿
すべて
引用
動画
PINNED
·
--
#Write2Earn
[Binance square write to earn](https://www.binance.com/en/square/WritetoEarn)
バイナンスに感謝します
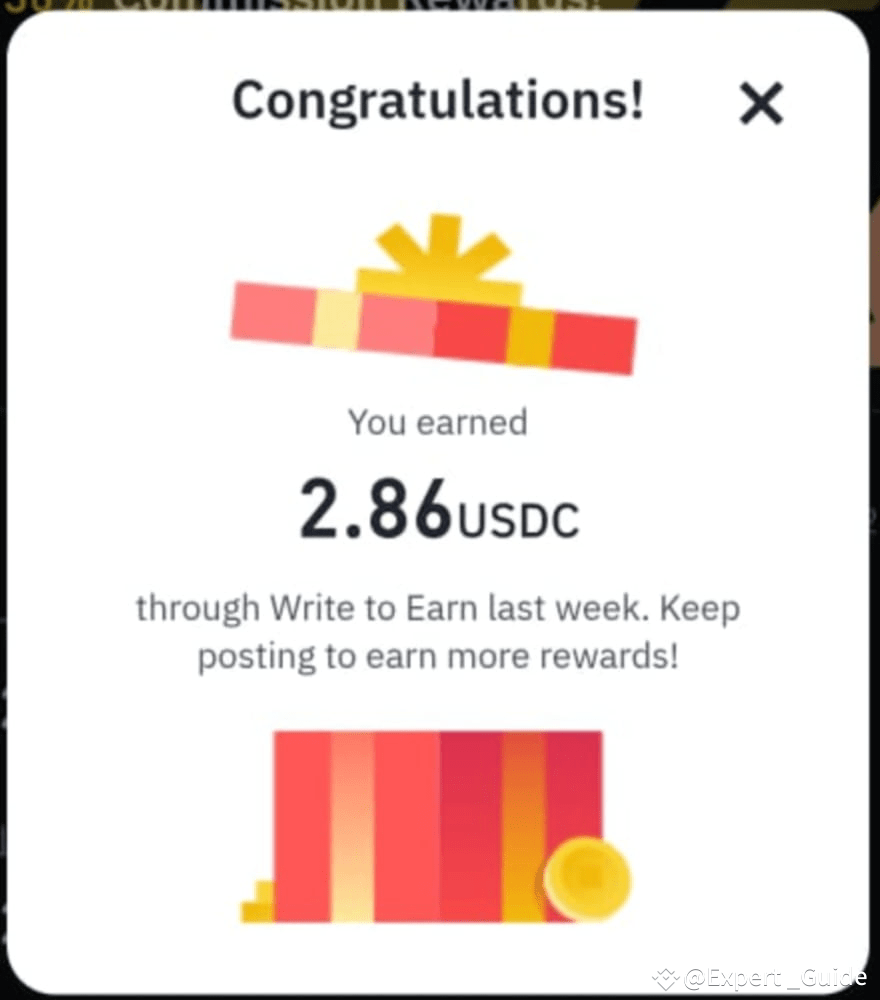
🚀💯💯初心者が2$ から$10を稼ぐ方法 これは2ヶ月で学びました、バイナンスで「書いて稼ぐ」方法を使って、週にたった2分の時間が必要です。以下のステップに従ってください。
ステップ 1: バイナンスアカウントを作成する
バイナンスアカウントを持っていない場合は、Binance.comでサインアップしてください。
完全なプラットフォーム機能を有効にするために、本人確認(KYC)を完了してください。
ステップ 2: バイナンスフィードプラットフォームに参加する
バイナンスフィードは、ユーザーが暗号関連のコンテンツを投稿するバイナンスのソーシャルメディアのようなプラットフォームです。
バイナンスアプリまたはウェブサイトを通じてバイナンスフィードにアクセスします。
ステップ 3: コンテンツクリエイターの役割に応募する
バイナンスフィードに移動し、「書いて稼ぐ」プログラムを探します。
寄稿者として応募します(一部のユーザーには直接の招待が届く場合があります)。
申請が承認されると、コンテンツを投稿することで収入を得ることができます。
ステップ 4: 高品質の暗号コンテンツを作成する
市場動向、取引戦略、または暗号ニュースに関する情報豊富な投稿を書きます。
短い投稿、市場分析、または教育的コンテンツのような魅力的な形式を使用します。
ステップ 5: 投稿の一貫性を維持する
プログラムに参加するために、週に少なくとも3〜5回投稿します。
あなたのコンテンツがより魅力的で洞察に満ちているほど、稼ぐチャンスが高くなります。
ステップ 6: コミュニティと関わる
他のユーザーといいね、コメント、投稿の共有を通じて交流します。
エンゲージメントは可視性と信頼性を高めます。
ステップ 7: バイナンスのコンテンツガイドラインに従う
盗作、誤解を招く情報、またはスパムを避けてください。
あなたのコンテンツがバイナンスの品質基準に合致していることを確認してください。
ステップ 8: 報酬を監視する
バイナンスはエンゲージメント、品質、一貫性に基づいて報酬を計算します。
支払いは通常、USDCで毎週行われます。
ステップ 9: 収入を引き出す
バイナンスウォレットで入金されたUSDC報酬を確認します。
USDCを他の暗号通貨に変換するか、銀行に引き出します。
ステップ 10: 収入を増やす
エンゲージメントを高めるために、コンテンツの質と頻度を向上させます。
投票、インフォグラフィック、または専門家の洞察など、さまざまな投稿形式を試してください。
ボーナスヒント:
#Write2Earn
Binance square write to earn
バイナンスに感謝します
🚀💯💯初心者が2$ から$10を稼ぐ方法 これは2ヶ月で学びました、バイナンスで「書いて稼ぐ」方法を使って、週にたった2分の時間が必要です。以下のステップに従ってください。
ステップ 1: バイナンスアカウントを作成する
バイナンスアカウントを持っていない場合は、Binance.comでサインアップしてください。
完全なプラットフォーム機能を有効にするために、本人確認(KYC)を完了してください。
ステップ 2: バイナンスフィードプラットフォームに参加する
バイナンスフィードは、ユーザーが暗号関連のコンテンツを投稿するバイナンスのソーシャルメディアのようなプラットフォームです。
バイナンスアプリまたはウェブサイトを通じてバイナンスフィードにアクセスします。
ステップ 3: コンテンツクリエイターの役割に応募する
バイナンスフィードに移動し、「書いて稼ぐ」プログラムを探します。
寄稿者として応募します(一部のユーザーには直接の招待が届く場合があります)。
申請が承認されると、コンテンツを投稿することで収入を得ることができます。
ステップ 4: 高品質の暗号コンテンツを作成する
市場動向、取引戦略、または暗号ニュースに関する情報豊富な投稿を書きます。
短い投稿、市場分析、または教育的コンテンツのような魅力的な形式を使用します。
ステップ 5: 投稿の一貫性を維持する
プログラムに参加するために、週に少なくとも3〜5回投稿します。
あなたのコンテンツがより魅力的で洞察に満ちているほど、稼ぐチャンスが高くなります。
ステップ 6: コミュニティと関わる
他のユーザーといいね、コメント、投稿の共有を通じて交流します。
エンゲージメントは可視性と信頼性を高めます。
ステップ 7: バイナンスのコンテンツガイドラインに従う
盗作、誤解を招く情報、またはスパムを避けてください。
あなたのコンテンツがバイナンスの品質基準に合致していることを確認してください。
ステップ 8: 報酬を監視する
バイナンスはエンゲージメント、品質、一貫性に基づいて報酬を計算します。
支払いは通常、USDCで毎週行われます。
ステップ 9: 収入を引き出す
バイナンスウォレットで入金されたUSDC報酬を確認します。
USDCを他の暗号通貨に変換するか、銀行に引き出します。
ステップ 10: 収入を増やす
エンゲージメントを高めるために、コンテンツの質と頻度を向上させます。
投票、インフォグラフィック、または専門家の洞察など、さまざまな投稿形式を試してください。
ボーナスヒント:
Binance square write to earn
バイナンスに感謝します
🚀💯💯初心者が2$ から$10を稼ぐ方法 これは2ヶ月で学びました、バイナンスで「書いて稼ぐ」方法を使って、週にたった2分の時間が必要です。以下のステップに従ってください。
ステップ 1: バイナンスアカウントを作成する
バイナンスアカウントを持っていない場合は、Binance.comでサインアップしてください。
完全なプラットフォーム機能を有効にするために、本人確認(KYC)を完了してください。
ステップ 2: バイナンスフィードプラットフォームに参加する
バイナンスフィードは、ユーザーが暗号関連のコンテンツを投稿するバイナンスのソーシャルメディアのようなプラットフォームです。
バイナンスアプリまたはウェブサイトを通じてバイナンスフィードにアクセスします。
ステップ 3: コンテンツクリエイターの役割に応募する
バイナンスフィードに移動し、「書いて稼ぐ」プログラムを探します。
寄稿者として応募します(一部のユーザーには直接の招待が届く場合があります)。
申請が承認されると、コンテンツを投稿することで収入を得ることができます。
ステップ 4: 高品質の暗号コンテンツを作成する
市場動向、取引戦略、または暗号ニュースに関する情報豊富な投稿を書きます。
短い投稿、市場分析、または教育的コンテンツのような魅力的な形式を使用します。
ステップ 5: 投稿の一貫性を維持する
プログラムに参加するために、週に少なくとも3〜5回投稿します。
あなたのコンテンツがより魅力的で洞察に満ちているほど、稼ぐチャンスが高くなります。
ステップ 6: コミュニティと関わる
他のユーザーといいね、コメント、投稿の共有を通じて交流します。
エンゲージメントは可視性と信頼性を高めます。
ステップ 7: バイナンスのコンテンツガイドラインに従う
盗作、誤解を招く情報、またはスパムを避けてください。
あなたのコンテンツがバイナンスの品質基準に合致していることを確認してください。
ステップ 8: 報酬を監視する
バイナンスはエンゲージメント、品質、一貫性に基づいて報酬を計算します。
支払いは通常、USDCで毎週行われます。
ステップ 9: 収入を引き出す
バイナンスウォレットで入金されたUSDC報酬を確認します。
USDCを他の暗号通貨に変換するか、銀行に引き出します。
ステップ 10: 収入を増やす
エンゲージメントを高めるために、コンテンツの質と頻度を向上させます。
投票、インフォグラフィック、または専門家の洞察など、さまざまな投稿形式を試してください。
ボーナスヒント:
15
13
30
10.4k
·
--
記事
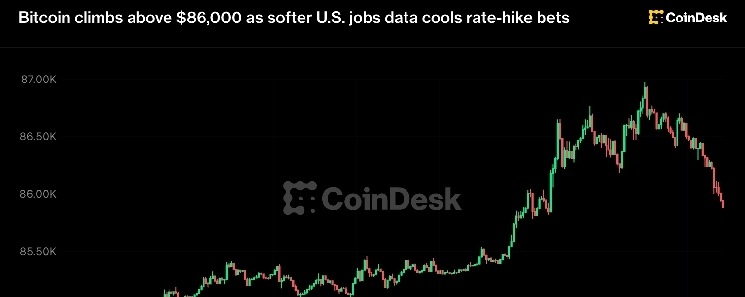
ビットコインが87,000ドルに迫り、8カ月ぶり高値をほぼ更新した後に反落ビットコインは月曜早朝に87,000ドル近くまで急騰し、8カ月ぶりの高値まであと約500ドルに迫った。その後反落し、月曜のアジア時間朝には86,000ドルをわずかに下回る水準となったが、24時間ではなお1.3%上昇している。
$DOGE は主要銘柄の中で最も大きく上昇し、3%超高の10セント弱となった。$XRP 、$BNB 、ZECはいずれも1〜2%上昇した一方、イーサとHYPEの上昇率は1%未満だった。CoinDeskのデータによると、SOLとTRXは横ばいだった。
日曜日を通じて上昇が続き、終盤には勢いを増したビットコインは、86,000ドルを突破して86,950ドルに迫る高値を付けた。その後、約1,000ドル下落している。
ビットコインが87,000ドルに迫り、8カ月ぶり高値をほぼ更新した後に反落
ビットコインは月曜早朝に87,000ドル近くまで急騰し、8カ月ぶりの高値まであと約500ドルに迫った。その後反落し、月曜のアジア時間朝には86,000ドルをわずかに下回る水準となったが、24時間ではなお1.3%上昇している。
$DOGE は主要銘柄の中で最も大きく上昇し、3%超高の10セント弱となった。$XRP 、$BNB 、ZECはいずれも1〜2%上昇した一方、イーサとHYPEの上昇率は1%未満だった。CoinDeskのデータによると、SOLとTRXは横ばいだった。
日曜日を通じて上昇が続き、終盤には勢いを増したビットコインは、86,000ドルを突破して86,950ドルに迫る高値を付けた。その後、約1,000ドル下落している。
$DOGE は主要銘柄の中で最も大きく上昇し、3%超高の10セント弱となった。$XRP 、$BNB 、ZECはいずれも1〜2%上昇した一方、イーサとHYPEの上昇率は1%未満だった。CoinDeskのデータによると、SOLとTRXは横ばいだった。
日曜日を通じて上昇が続き、終盤には勢いを増したビットコインは、86,000ドルを突破して86,950ドルに迫る高値を付けた。その後、約1,000ドル下落している。
63
·
--
記事
ビットコインに、1年以上見られなかった大きな強気シグナルが間もなく点灯ビットコイン $BTC 86024.31ドルは今日は下落していますが、より長期的なトレンドは異なる様相を示しています。
過去50日、100日、200日間の価格の単純移動平均線は、仮想通貨の短期・中期・長期のトレンドがすべて同時に上向く、完全な強気の並びになるまで、あと一度の「ゴールデンクロス」を残すのみです。実現すれば、2025年以来初めてとなります。
この並びは、50日移動平均線が100日移動平均線を上回り、さらに100日移動平均線が200日移動平均線を上回る状態を指します。実現まであと一歩です。この記事の執筆時点では、50日移動平均線は79,495ドルで、残る2つを大きく上回っています。一方、現在79,493ドルの100日移動平均線は上昇しており、79,539ドルの200日移動平均線を上回る寸前です。そうなれば、3本すべての時間軸で強気の勢いを示す順に並ぶことになります。トレーダーは移動平均線を使って、トレンドの方向を読み取ります。短期の移動平均線が長期のものを上回ると、最近の価格が以前より強いことを示し、上昇の勢いがあると判断できます。
ビットコインに、1年以上見られなかった大きな強気シグナルが間もなく点灯
ビットコイン $BTC 86024.31ドルは今日は下落していますが、より長期的なトレンドは異なる様相を示しています。
過去50日、100日、200日間の価格の単純移動平均線は、仮想通貨の短期・中期・長期のトレンドがすべて同時に上向く、完全な強気の並びになるまで、あと一度の「ゴールデンクロス」を残すのみです。実現すれば、2025年以来初めてとなります。
この並びは、50日移動平均線が100日移動平均線を上回り、さらに100日移動平均線が200日移動平均線を上回る状態を指します。実現まであと一歩です。この記事の執筆時点では、50日移動平均線は79,495ドルで、残る2つを大きく上回っています。一方、現在79,493ドルの100日移動平均線は上昇しており、79,539ドルの200日移動平均線を上回る寸前です。そうなれば、3本すべての時間軸で強気の勢いを示す順に並ぶことになります。トレーダーは移動平均線を使って、トレンドの方向を読み取ります。短期の移動平均線が長期のものを上回ると、最近の価格が以前より強いことを示し、上昇の勢いがあると判断できます。
過去50日、100日、200日間の価格の単純移動平均線は、仮想通貨の短期・中期・長期のトレンドがすべて同時に上向く、完全な強気の並びになるまで、あと一度の「ゴールデンクロス」を残すのみです。実現すれば、2025年以来初めてとなります。
この並びは、50日移動平均線が100日移動平均線を上回り、さらに100日移動平均線が200日移動平均線を上回る状態を指します。実現まであと一歩です。この記事の執筆時点では、50日移動平均線は79,495ドルで、残る2つを大きく上回っています。一方、現在79,493ドルの100日移動平均線は上昇しており、79,539ドルの200日移動平均線を上回る寸前です。そうなれば、3本すべての時間軸で強気の勢いを示す順に並ぶことになります。トレーダーは移動平均線を使って、トレンドの方向を読み取ります。短期の移動平均線が長期のものを上回ると、最近の価格が以前より強いことを示し、上昇の勢いがあると判断できます。
165
·
--
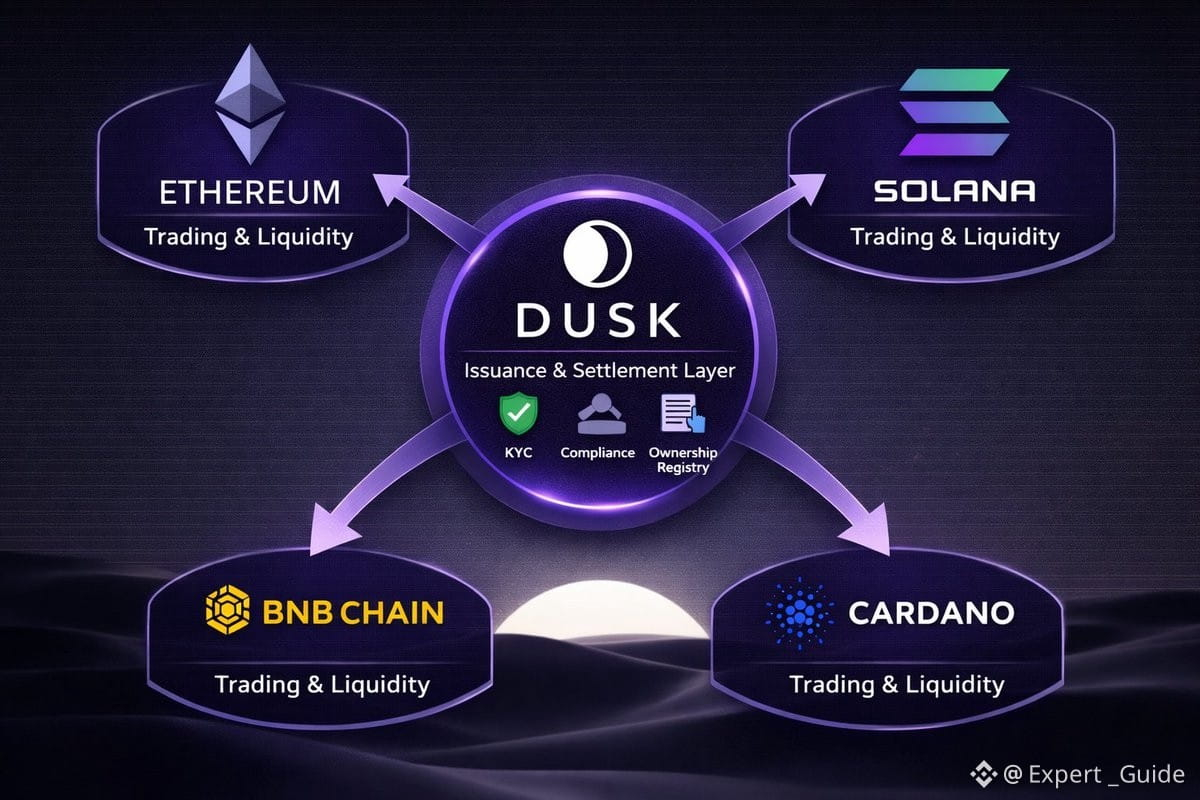
夕暮れ 価格アラート。夕暮れとは何ですか。
*$DUSK: 誰も語らないRWAチェーン*
Dusk Network L1は銀行向け+現実世界の資産(RWA)向けに構築。
プライバシー+コンプライアンスを標準搭載。EU MiCA対応。
現在の価格: ∼$0.13 | 時価総額: ∼$64M
見立て: トークン化された株式/債券が主流になれば、Duskは先行している。
*DUSKはオンチェーンの金融の未来なのか?
多くのチェーンがミームを追う中、Duskは機関向けに構築しています。
プライバシー+KYCを標準搭載したトークン化債券、ファンド、株式。
#dusk $DUSK
夕暮れ 価格アラート。夕暮れとは何ですか。
*$DUSK : 誰も語らないRWAチェーン*
Dusk Network L1は銀行向け+現実世界の資産(RWA)向けに構築。
プライバシー+コンプライアンスを標準搭載。EU MiCA対応。
現在の価格: ∼$0.13 | 時価総額: ∼$64M
見立て: トークン化された株式/債券が主流になれば、Duskは先行している。
*DUSKはオンチェーンの金融の未来なのか?
多くのチェーンがミームを追う中、Duskは機関向けに構築しています。
プライバシー+KYCを標準搭載したトークン化債券、ファンド、株式。
#dusk $DUSK
*$DUSK : 誰も語らないRWAチェーン*
Dusk Network L1は銀行向け+現実世界の資産(RWA)向けに構築。
プライバシー+コンプライアンスを標準搭載。EU MiCA対応。
現在の価格: ∼$0.13 | 時価総額: ∼$64M
見立て: トークン化された株式/債券が主流になれば、Duskは先行している。
*DUSKはオンチェーンの金融の未来なのか?
多くのチェーンがミームを追う中、Duskは機関向けに構築しています。
プライバシー+KYCを標準搭載したトークン化債券、ファンド、株式。
#dusk $DUSK
909
·
--
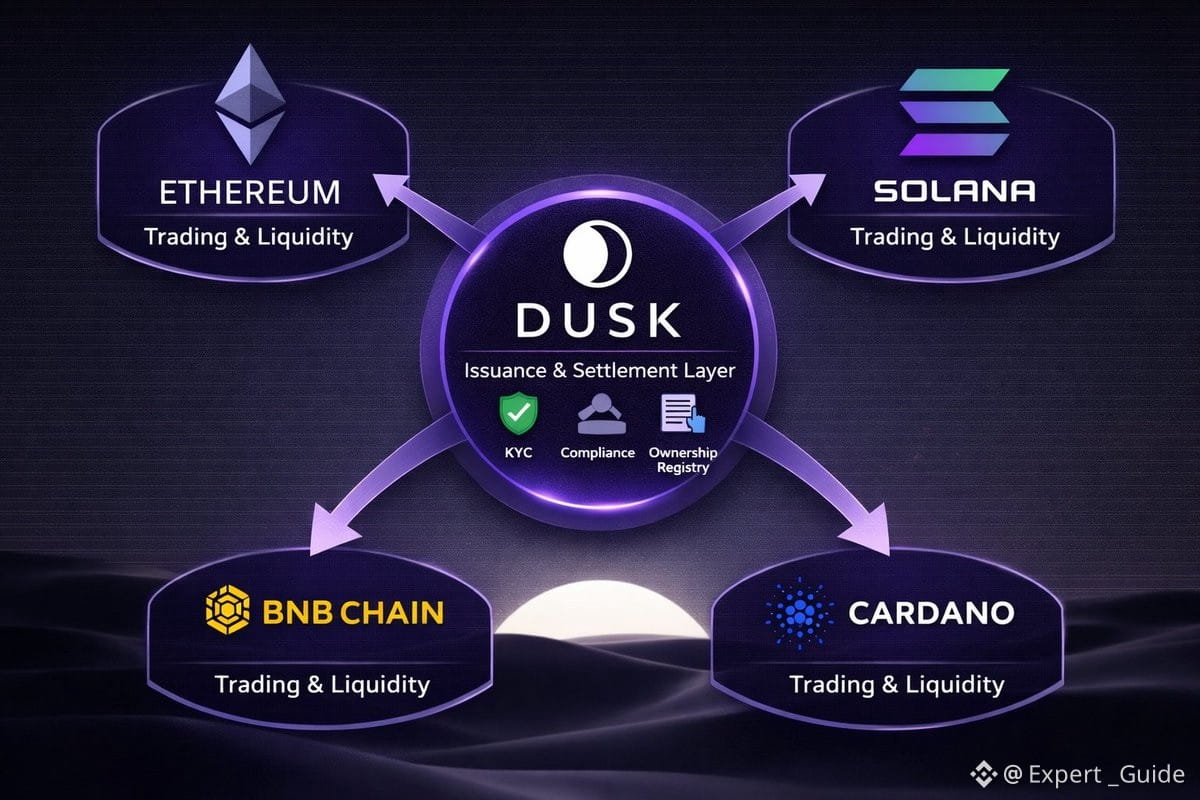
Dusk Networkとは何か。なぜEthereum/SolanaよりもDuskを選ぶのか?
DUSK 銀行家のためのブロックチェーン。
Dusk Networkは、金融機関が実物資産をオンチェーン化するために特化して作られたレイヤー1ブロックチェーンです。
Duskは、株式、債券、ファンド、その他の規制対象資産向けに構築されています。
Duskの仕組み 主要技術
機能 意味すること(未来のために)
1. プライバシーはデフォルト ゼロ知識証明を使用。オンチェーン上のすべてのデータを公開せずに、コンプライアンス/KYC済みであることを証明できます。銀行はこれを好みます。
2. 分離されたスマートコントラクト 各金融商品はそれぞれ独自の金庫で実行されます。1つが壊れても他は安全です。別々の銀行口座を持つようなものです。
3. ユーザーのガスレス 金融機関が手数料をスポンサーできるため、エンドユーザーは取引のためにDUSKを用意する必要がありません。通常の金融アプリのように感じられます。
4. 高速+低コストのL1自社ブロックチェーン。数秒でファイナリティ、低手数料。数百万件の規制対象取引に対応できるように設計されています。
今後どう機能するか 2026年〜2030年。
Duskは大きな1つのトレンドに賭けています:実世界資産(RWA)がオンチェーン化されること*
その市場は$16T+に達すると予測されています。
ステップ1:銀行が資産をトークン化*
例:欧州の銀行がDusk上でトークン化された政府債を発行します。債券は非公開ですが、規制当局は引き続き監査できます。
ステップ2:取引+決済
トークン化された株式/債券が、NPEXのようなDuskベースの取引所で24時間365日取引されます。決済は2日ではなく数秒で完了します。
ステップ3:機関向けDeFi
トークン化されたRWAで作られた、貸し借り、ファンドなど。しかしアクセスできるのはKYC済みのウォレットのみです。
なぜEthereum/SolanaよりもDuskを選ぶのか?
公開チェーンは開放されすぎています。規制当局は、顧客データとEthereum上の数十億ドルを許可しません。Duskはプライバシーとコンプライアンスを提供するため、銀行は実際に合法的に利用できます。
The $DUSK トークン - それは何のため?*
1. ガス:ネットワーク上の取引に支払う
#dusk $DUSK
@Dusk_Foundation (https://www.binance.com/en/square/profile/dusk_foundation), トークン $DUSK をタグ付けし、ハッシュタグ #dusk. を使用
Dusk Networkとは何か。なぜEthereum/SolanaよりもDuskを選ぶのか?
DUSK 銀行家のためのブロックチェーン。
Dusk Networkは、金融機関が実物資産をオンチェーン化するために特化して作られたレイヤー1ブロックチェーンです。
Duskは、株式、債券、ファンド、その他の規制対象資産向けに構築されています。
Duskの仕組み 主要技術
機能 意味すること(未来のために)
1. プライバシーはデフォルト ゼロ知識証明を使用。オンチェーン上のすべてのデータを公開せずに、コンプライアンス/KYC済みであることを証明できます。銀行はこれを好みます。
2. 分離されたスマートコントラクト 各金融商品はそれぞれ独自の金庫で実行されます。1つが壊れても他は安全です。別々の銀行口座を持つようなものです。
3. ユーザーのガスレス 金融機関が手数料をスポンサーできるため、エンドユーザーは取引のためにDUSKを用意する必要がありません。通常の金融アプリのように感じられます。
4. 高速+低コストのL1自社ブロックチェーン。数秒でファイナリティ、低手数料。数百万件の規制対象取引に対応できるように設計されています。
今後どう機能するか 2026年〜2030年。
Duskは大きな1つのトレンドに賭けています:実世界資産(RWA)がオンチェーン化されること*
その市場は$16T+に達すると予測されています。
ステップ1:銀行が資産をトークン化*
例:欧州の銀行がDusk上でトークン化された政府債を発行します。債券は非公開ですが、規制当局は引き続き監査できます。
ステップ2:取引+決済
トークン化された株式/債券が、NPEXのようなDuskベースの取引所で24時間365日取引されます。決済は2日ではなく数秒で完了します。
ステップ3:機関向けDeFi
トークン化されたRWAで作られた、貸し借り、ファンドなど。しかしアクセスできるのはKYC済みのウォレットのみです。
なぜEthereum/SolanaよりもDuskを選ぶのか?
公開チェーンは開放されすぎています。規制当局は、顧客データとEthereum上の数十億ドルを許可しません。Duskはプライバシーとコンプライアンスを提供するため、銀行は実際に合法的に利用できます。
The $DUSK トークン - それは何のため?*
1. ガス:ネットワーク上の取引に支払う
#dusk $DUSK
@Dusk (https://www.binance.com/en/square/profile/dusk_foundation), トークン $DUSK をタグ付けし、ハッシュタグ #dusk. を使用
DUSK 銀行家のためのブロックチェーン。
Dusk Networkは、金融機関が実物資産をオンチェーン化するために特化して作られたレイヤー1ブロックチェーンです。
Duskは、株式、債券、ファンド、その他の規制対象資産向けに構築されています。
Duskの仕組み 主要技術
機能 意味すること(未来のために)
1. プライバシーはデフォルト ゼロ知識証明を使用。オンチェーン上のすべてのデータを公開せずに、コンプライアンス/KYC済みであることを証明できます。銀行はこれを好みます。
2. 分離されたスマートコントラクト 各金融商品はそれぞれ独自の金庫で実行されます。1つが壊れても他は安全です。別々の銀行口座を持つようなものです。
3. ユーザーのガスレス 金融機関が手数料をスポンサーできるため、エンドユーザーは取引のためにDUSKを用意する必要がありません。通常の金融アプリのように感じられます。
4. 高速+低コストのL1自社ブロックチェーン。数秒でファイナリティ、低手数料。数百万件の規制対象取引に対応できるように設計されています。
今後どう機能するか 2026年〜2030年。
Duskは大きな1つのトレンドに賭けています:実世界資産(RWA)がオンチェーン化されること*
その市場は$16T+に達すると予測されています。
ステップ1:銀行が資産をトークン化*
例:欧州の銀行がDusk上でトークン化された政府債を発行します。債券は非公開ですが、規制当局は引き続き監査できます。
ステップ2:取引+決済
トークン化された株式/債券が、NPEXのようなDuskベースの取引所で24時間365日取引されます。決済は2日ではなく数秒で完了します。
ステップ3:機関向けDeFi
トークン化されたRWAで作られた、貸し借り、ファンドなど。しかしアクセスできるのはKYC済みのウォレットのみです。
なぜEthereum/SolanaよりもDuskを選ぶのか?
公開チェーンは開放されすぎています。規制当局は、顧客データとEthereum上の数十億ドルを許可しません。Duskはプライバシーとコンプライアンスを提供するため、銀行は実際に合法的に利用できます。
The $DUSK トークン - それは何のため?*
1. ガス:ネットワーク上の取引に支払う
#dusk $DUSK
@Dusk (https://www.binance.com/en/square/profile/dusk_foundation), トークン $DUSK をタグ付けし、ハッシュタグ #dusk. を使用
1
1
291
·
--
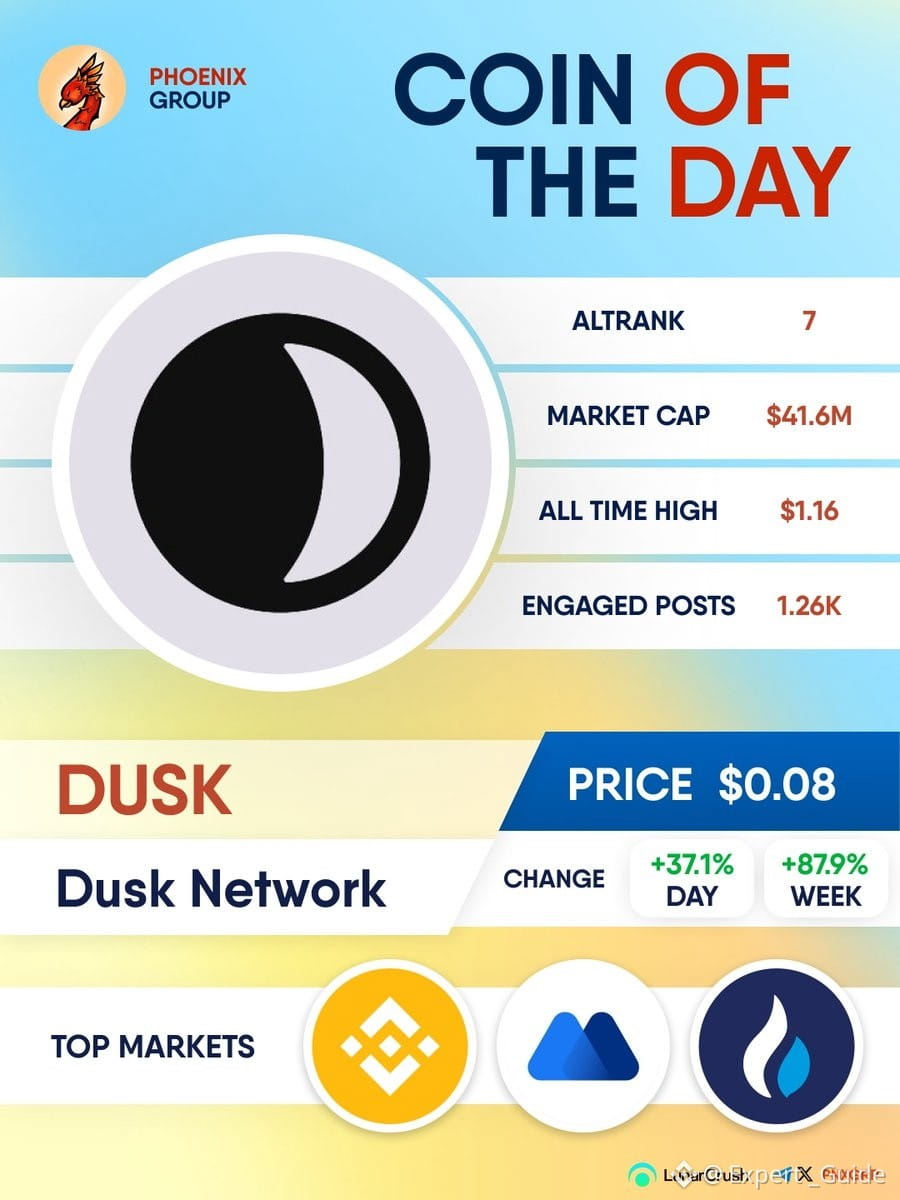
#dusk $DUSK
Dusk Network $DUSK の将来価格予測は?
Duskは暗号資産のコンプライアンス・チェーンとしての地位を確立しようとしています。
1. Dusk Networkの将来の注目点は?
エンタープライズ向けブロックチェーンの幅広い採用。
2. 現在の統計 - 2026年8月*
*価格:$0.1291〜$0.12〜$0.13
*時価総額:∼$64.57M
*流通量:500M $DUSK
*最大供給量:1B DUSK
3. 価格予測。
データによると、5年間で約27.6%の成長が見込まれ、年間の変化率は5%です。
*強気のモデル。
短期:もし「物語」が熱いままであれば、70%増の可能性があり、$0.50まで伸びるかもしれません。強気のケース:$1ゾーン
2026年。成長すれば、年末までに$0.50に到達する可能性があります。
一部のアナリストは、2027年に$1〜$2、2031年に$5〜$10の見通しを示しています。
#dusk
#dusk $DUSK
Dusk Network $DUSK の将来価格予測は?
Duskは暗号資産のコンプライアンス・チェーンとしての地位を確立しようとしています。
1. Dusk Networkの将来の注目点は?
エンタープライズ向けブロックチェーンの幅広い採用。
2. 現在の統計 - 2026年8月*
*価格:$0.1291〜$0.12〜$0.13
*時価総額:∼$64.57M
*流通量:500M $DUSK
*最大供給量:1B DUSK
3. 価格予測。
データによると、5年間で約27.6%の成長が見込まれ、年間の変化率は5%です。
*強気のモデル。
短期:もし「物語」が熱いままであれば、70%増の可能性があり、$0.50まで伸びるかもしれません。強気のケース:$1ゾーン
2026年。成長すれば、年末までに$0.50に到達する可能性があります。
一部のアナリストは、2027年に$1〜$2、2031年に$5〜$10の見通しを示しています。
#dusk
Dusk Network $DUSK の将来価格予測は?
Duskは暗号資産のコンプライアンス・チェーンとしての地位を確立しようとしています。
1. Dusk Networkの将来の注目点は?
エンタープライズ向けブロックチェーンの幅広い採用。
2. 現在の統計 - 2026年8月*
*価格:$0.1291〜$0.12〜$0.13
*時価総額:∼$64.57M
*流通量:500M $DUSK
*最大供給量:1B DUSK
3. 価格予測。
データによると、5年間で約27.6%の成長が見込まれ、年間の変化率は5%です。
*強気のモデル。
短期:もし「物語」が熱いままであれば、70%増の可能性があり、$0.50まで伸びるかもしれません。強気のケース:$1ゾーン
2026年。成長すれば、年末までに$0.50に到達する可能性があります。
一部のアナリストは、2027年に$1〜$2、2031年に$5〜$10の見通しを示しています。
#dusk
260
·
--
*$DUSK ネットワークとは何か、なぜ人々が注目しているのか。2030年の予測。
本日は短く、バイナンスでのDUSKについて話します。DUSKとは?
DUSKは、規制された金融商品向けに特別に構築された、プライバシー重視のLayer 1ブロックチェーンです。
*なぜ$DUSK が注目されているのか
トークン化された株式、債券、ファンドのために設計されています。
*プライバシー技術により、機関が利用できます。
バイナンスに上場しており、アクセスが簡単。
RWA市場は2030年までに160Tドルに到達する見込み。
今はまだ静かですが、もしTradFiがオンチェーンに参入してきても、DUSKにはすでにツールがあります。
#dusk $DUSK
*$DUSK ネットワークとは何か、なぜ人々が注目しているのか。2030年の予測。
本日は短く、バイナンスでのDUSKについて話します。DUSKとは?
DUSKは、規制された金融商品向けに特別に構築された、プライバシー重視のLayer 1ブロックチェーンです。
*なぜ$DUSK が注目されているのか
トークン化された株式、債券、ファンドのために設計されています。
*プライバシー技術により、機関が利用できます。
バイナンスに上場しており、アクセスが簡単。
RWA市場は2030年までに160Tドルに到達する見込み。
今はまだ静かですが、もしTradFiがオンチェーンに参入してきても、DUSKにはすでにツールがあります。
#dusk $DUSK
本日は短く、バイナンスでのDUSKについて話します。DUSKとは?
DUSKは、規制された金融商品向けに特別に構築された、プライバシー重視のLayer 1ブロックチェーンです。
*なぜ$DUSK が注目されているのか
トークン化された株式、債券、ファンドのために設計されています。
*プライバシー技術により、機関が利用できます。
バイナンスに上場しており、アクセスが簡単。
RWA市場は2030年までに160Tドルに到達する見込み。
今はまだ静かですが、もしTradFiがオンチェーンに参入してきても、DUSKにはすでにツールがあります。
#dusk $DUSK
323
·
--
記事
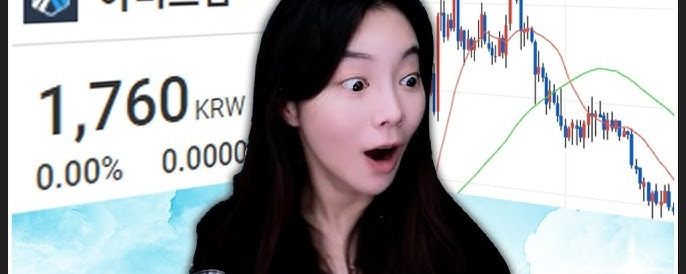
株が崩れたことで韓国の暗号資産取引高が82%急増 – 何が起きた?韓国で暗号資産の取引高が急増した。極端な株式市場の変動が、トレーダーを代替の流動性の場へと向かわせたためだ。
5つの主要取引所をまたいで、7月28日の取引高は9億6400万ドルに達した。これは前月の1日平均に比べて82%の増加に当たる。
なぜ韓国の暗号資産の取引量が急増したのか?
Upbitでは、KRW-USDTの取引高が600%急騰し、2,000万ドルから約1億4,000万ドルにまで上昇した。同取引所の総取引高は、2億9,270万ドルから約7億4,300万ドルへと伸びたものの、その後は後退した。
株が崩れたことで韓国の暗号資産取引高が82%急増 – 何が起きた?
韓国で暗号資産の取引高が急増した。極端な株式市場の変動が、トレーダーを代替の流動性の場へと向かわせたためだ。
5つの主要取引所をまたいで、7月28日の取引高は9億6400万ドルに達した。これは前月の1日平均に比べて82%の増加に当たる。
なぜ韓国の暗号資産の取引量が急増したのか?
Upbitでは、KRW-USDTの取引高が600%急騰し、2,000万ドルから約1億4,000万ドルにまで上昇した。同取引所の総取引高は、2億9,270万ドルから約7億4,300万ドルへと伸びたものの、その後は後退した。
5つの主要取引所をまたいで、7月28日の取引高は9億6400万ドルに達した。これは前月の1日平均に比べて82%の増加に当たる。
なぜ韓国の暗号資産の取引量が急増したのか?
Upbitでは、KRW-USDTの取引高が600%急騰し、2,000万ドルから約1億4,000万ドルにまで上昇した。同取引所の総取引高は、2億9,270万ドルから約7億4,300万ドルへと伸びたものの、その後は後退した。
1
443
·
--
BNB価格予測:強気派が609ドルを押し付ける一方で、混雑したロングの仕込みが“火遊び”をしている$BNB は、7月31日 07:12 UTC 時点で 591.84 ドルを出力しています。セッションでは +2.88% で、ぱっと見はきれいに見えます。ですが、このコインは2026年1月上旬に取引されていた 895ドル台からかなり遠いところまで下落しています。現在の値動きは、本格的なトレンド転換というよりは、修正的なリバウンドが自信を集めているような読みになっています。なお、200日SMA が 644.97ドルに重く居座っており、そこがまさに「部屋の中の象」です。ここからそこまでのあらゆるポイントが、争点となるテリトリーです。
短期の構造は建設的に強気です。近い期間の移動平均 3本――7日、20日、50日 SMA――が 573ドル〜577ドルの間にきわめて密集しており、価格がそこから説得力をもって切り離された“統一された土台”になっています。これは教科書的なブレイクアウトの構えです。問題は“伸び(エクステンション)”です。BNB はすでにボリンジャーバンド上限の 588.34ドルを突き抜けており、%B は 1.12 を記録。さらにストキャスティクスは高80台で調理中です。スポットのテイカー・フローは本物の強い攻勢を裏付けています――買い手が売り板(アスク)を叩いている。ですが、MACDヒストグラムはまさにゼロを印字しました。車が加速しているのにエンジン警告灯が点いている状態です。Blockchain.news は、$BNB がその 895ドルのピークから続く長い構造的下落を起こしていることを記録しています。そして、強い1つのセッションだけでは、8か月分のディストリビューション(売り圧)を帳消しにできません。
BNB価格予測:強気派が609ドルを押し付ける一方で、混雑したロングの仕込みが“火遊び”をしている
$BNB は、7月31日 07:12 UTC 時点で 591.84 ドルを出力しています。セッションでは +2.88% で、ぱっと見はきれいに見えます。ですが、このコインは2026年1月上旬に取引されていた 895ドル台からかなり遠いところまで下落しています。現在の値動きは、本格的なトレンド転換というよりは、修正的なリバウンドが自信を集めているような読みになっています。なお、200日SMA が 644.97ドルに重く居座っており、そこがまさに「部屋の中の象」です。ここからそこまでのあらゆるポイントが、争点となるテリトリーです。
短期の構造は建設的に強気です。近い期間の移動平均 3本――7日、20日、50日 SMA――が 573ドル〜577ドルの間にきわめて密集しており、価格がそこから説得力をもって切り離された“統一された土台”になっています。これは教科書的なブレイクアウトの構えです。問題は“伸び(エクステンション)”です。BNB はすでにボリンジャーバンド上限の 588.34ドルを突き抜けており、%B は 1.12 を記録。さらにストキャスティクスは高80台で調理中です。スポットのテイカー・フローは本物の強い攻勢を裏付けています――買い手が売り板(アスク)を叩いている。ですが、MACDヒストグラムはまさにゼロを印字しました。車が加速しているのにエンジン警告灯が点いている状態です。Blockchain.news は、$BNB がその 895ドルのピークから続く長い構造的下落を起こしていることを記録しています。そして、強い1つのセッションだけでは、8か月分のディストリビューション(売り圧)を帳消しにできません。
短期の構造は建設的に強気です。近い期間の移動平均 3本――7日、20日、50日 SMA――が 573ドル〜577ドルの間にきわめて密集しており、価格がそこから説得力をもって切り離された“統一された土台”になっています。これは教科書的なブレイクアウトの構えです。問題は“伸び(エクステンション)”です。BNB はすでにボリンジャーバンド上限の 588.34ドルを突き抜けており、%B は 1.12 を記録。さらにストキャスティクスは高80台で調理中です。スポットのテイカー・フローは本物の強い攻勢を裏付けています――買い手が売り板(アスク)を叩いている。ですが、MACDヒストグラムはまさにゼロを印字しました。車が加速しているのにエンジン警告灯が点いている状態です。Blockchain.news は、$BNB がその 895ドルのピークから続く長い構造的下落を起こしていることを記録しています。そして、強い1つのセッションだけでは、8か月分のディストリビューション(売り圧)を帳消しにできません。
1
2
457
·
--
記事
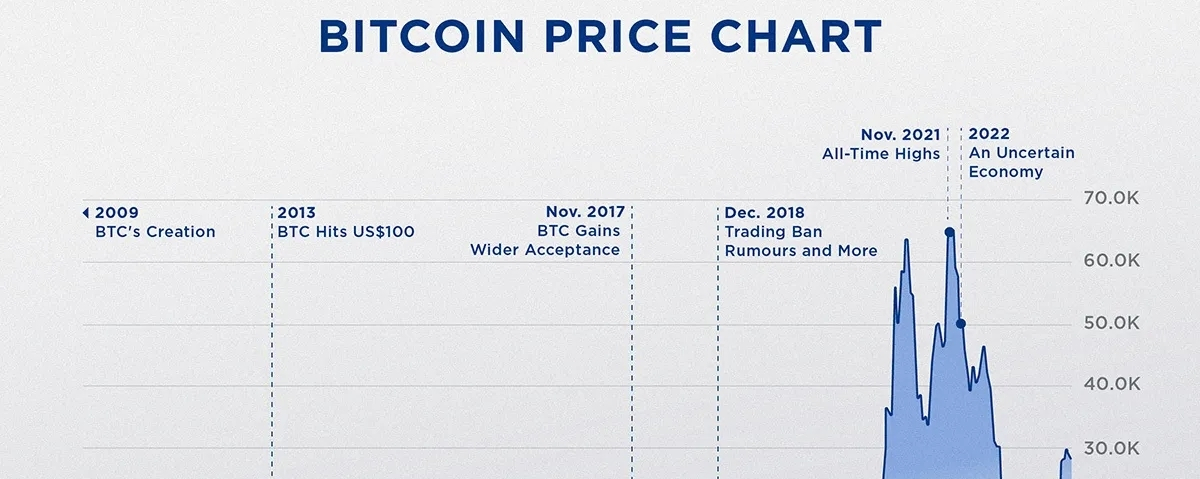
暗号資産市場概況:ビットコインはONDOとPUMPの上昇とともに勢いを増す。ビットコインは、金融政策の方向性を巡るFRBの賛否が割れたにもかかわらず、$65,000に向けてじり高となっている。
ONDOは主要移動平均線を上抜けてブレイクアウトを継続し、$0.45を超える高値を目指す買い手が優勢だ。
PUMPは上昇チャネル内で上昇トレンドを維持しており、50時間・100時間・200時間の4時間足EMAサポートにしっかり支えられている。
暗号資産市場概況:ビットコインはONDOとPUMPの上昇とともに勢いを増している。
暗号資産市場は、売り圧力が落ち着く中で木曜日も勢いを維持している。ビットコイン $BTC は3日連続で上昇し、現在は$64,000を上回る水準で取引されており、強気派は直近の$65,000抵抗線を上抜ける可能性を注視している。
暗号資産市場概況:ビットコインはONDOとPUMPの上昇とともに勢いを増す。
ビットコインは、金融政策の方向性を巡るFRBの賛否が割れたにもかかわらず、$65,000に向けてじり高となっている。
ONDOは主要移動平均線を上抜けてブレイクアウトを継続し、$0.45を超える高値を目指す買い手が優勢だ。
PUMPは上昇チャネル内で上昇トレンドを維持しており、50時間・100時間・200時間の4時間足EMAサポートにしっかり支えられている。
暗号資産市場概況:ビットコインはONDOとPUMPの上昇とともに勢いを増している。
暗号資産市場は、売り圧力が落ち着く中で木曜日も勢いを維持している。ビットコイン $BTC は3日連続で上昇し、現在は$64,000を上回る水準で取引されており、強気派は直近の$65,000抵抗線を上抜ける可能性を注視している。
ONDOは主要移動平均線を上抜けてブレイクアウトを継続し、$0.45を超える高値を目指す買い手が優勢だ。
PUMPは上昇チャネル内で上昇トレンドを維持しており、50時間・100時間・200時間の4時間足EMAサポートにしっかり支えられている。
暗号資産市場概況:ビットコインはONDOとPUMPの上昇とともに勢いを増している。
暗号資産市場は、売り圧力が落ち着く中で木曜日も勢いを維持している。ビットコイン $BTC は3日連続で上昇し、現在は$64,000を上回る水準で取引されており、強気派は直近の$65,000抵抗線を上抜ける可能性を注視している。
322
·
--

記事
LHCはP2Pの暗号資産取引だけでは詐欺を立証できないと判断ラホール高等裁判所(LHC)は、暗号資産に関連する事件について重要な判断を下し、単に個人間(P2P)の仮想資産取引を行うこと、または銀行口座で資金を受け取ることだけでは、それ自体が詐欺、偽造、または電子犯罪の立証にはならないと述べた。
ジャスティス・タリク・サレーム・シェイクは、詳細な15ページの判決の中で、暗号資産取引に関連して罪に問われている3人の事前逮捕保釈を認めるとともに、その内容を確認した。
連邦捜査機関(FIA)は、ハマド・アリ、アサド・アムジャド、ムハンマド・アサルを、パキスタン刑法(Pakistan Penal Code)の第419条、第420条、第468条、第471条に加え、2016年の電子犯罪防止法(PECA)の第13条および第14条の下で訴追するための事件を登録していた。捜査当局は、3人がP2Pのマーチャントとして働き、銀行口座を通じて申立人から資金を受け取ったと主張した。
LHCはP2Pの暗号資産取引だけでは詐欺を立証できないと判断
ラホール高等裁判所(LHC)は、暗号資産に関連する事件について重要な判断を下し、単に個人間(P2P)の仮想資産取引を行うこと、または銀行口座で資金を受け取ることだけでは、それ自体が詐欺、偽造、または電子犯罪の立証にはならないと述べた。
ジャスティス・タリク・サレーム・シェイクは、詳細な15ページの判決の中で、暗号資産取引に関連して罪に問われている3人の事前逮捕保釈を認めるとともに、その内容を確認した。
連邦捜査機関(FIA)は、ハマド・アリ、アサド・アムジャド、ムハンマド・アサルを、パキスタン刑法(Pakistan Penal Code)の第419条、第420条、第468条、第471条に加え、2016年の電子犯罪防止法(PECA)の第13条および第14条の下で訴追するための事件を登録していた。捜査当局は、3人がP2Pのマーチャントとして働き、銀行口座を通じて申立人から資金を受け取ったと主張した。
ジャスティス・タリク・サレーム・シェイクは、詳細な15ページの判決の中で、暗号資産取引に関連して罪に問われている3人の事前逮捕保釈を認めるとともに、その内容を確認した。
連邦捜査機関(FIA)は、ハマド・アリ、アサド・アムジャド、ムハンマド・アサルを、パキスタン刑法(Pakistan Penal Code)の第419条、第420条、第468条、第471条に加え、2016年の電子犯罪防止法(PECA)の第13条および第14条の下で訴追するための事件を登録していた。捜査当局は、3人がP2Pのマーチャントとして働き、銀行口座を通じて申立人から資金を受け取ったと主張した。
128
·
--
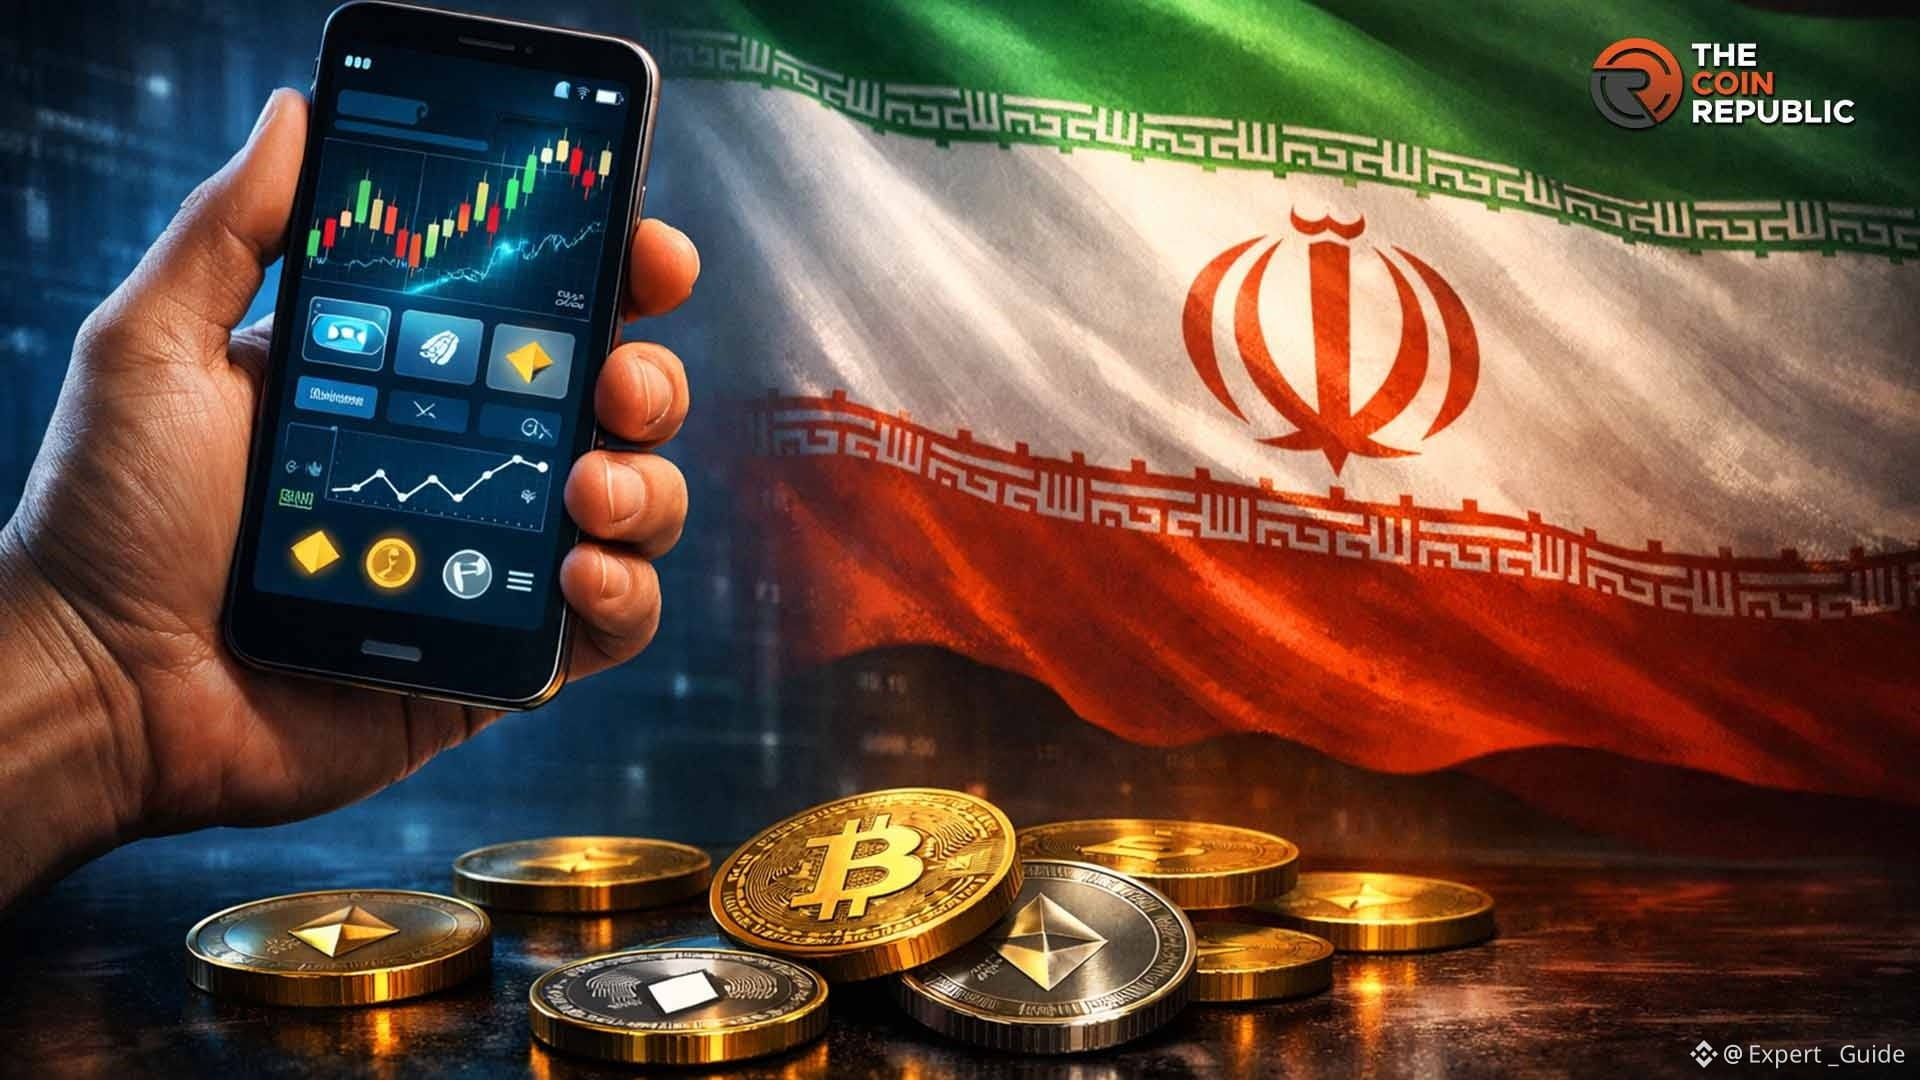
なぜイランは暗号にとって重要なのか*
1. *石油+インフレ*:ホルムズ海峡には世界の原油の1/5が通過する。戦争=原油$110+。平和=原油$80。原油が高い=インフレが高い=FRBは金利を高く維持=$BTC にとって悪材料
2. *リスク・センチメント*:暗号は「リスクオン」資産のように取引される。地政学が落ち着くと資金がBTC/$ETH へ戻る
3. *制裁の観点*:米国は4月、イラン関連の暗号資産で$344Mを凍結した。イランは暗号をNobitexのようにして活用してきた
*現在の状況 - 7月30日*
- *状況*:「脆い停戦」が維持中。イランは、米国が
- *BTC価格*:今日$63,978だが、平和のニュースでは$65,363だった
- *FRB+イランの組み合わせ*:今週は両方が市場を動かしている。FRBの決定+イラン外交=ボラティリティ
*トレーダー向けの重要な要点*
シナリオ 暗号の反応
**外交/一時停止** BTCが上昇、原油が下落、アルトがローテーション
**エスカレーション/攻撃** BTCが$60K〜$62Kへ下落、原油が急騰、アルトは換金
**合意が署名** 「リスクオン」の上昇相場。$ETH は原油とのこれまでで最強の逆相関を持つ。
#FOMCWatching
#SouthKoreaProposesSuspiciousCryptoAccountFreeze
#KoreanStocksReboundOnSamsungResults
なぜイランは暗号にとって重要なのか*
1. *石油+インフレ*:ホルムズ海峡には世界の原油の1/5が通過する。戦争=原油$110+。平和=原油$80。原油が高い=インフレが高い=FRBは金利を高く維持=$BTC にとって悪材料
2. *リスク・センチメント*:暗号は「リスクオン」資産のように取引される。地政学が落ち着くと資金がBTC/$ETH へ戻る
3. *制裁の観点*:米国は4月、イラン関連の暗号資産で$344Mを凍結した。イランは暗号をNobitexのようにして活用してきた
*現在の状況 - 7月30日*
- *状況*:「脆い停戦」が維持中。イランは、米国が
- *BTC価格*:今日$63,978だが、平和のニュースでは$65,363だった
- *FRB+イランの組み合わせ*:今週は両方が市場を動かしている。FRBの決定+イラン外交=ボラティリティ
*トレーダー向けの重要な要点*
シナリオ 暗号の反応
**外交/一時停止** BTCが上昇、原油が下落、アルトがローテーション
**エスカレーション/攻撃** BTCが$60K〜$62Kへ下落、原油が急騰、アルトは換金
**合意が署名** 「リスクオン」の上昇相場。$ETH は原油とのこれまでで最強の逆相関を持つ。
#FOMCWatching
#SouthKoreaProposesSuspiciousCryptoAccountFreeze
#KoreanStocksReboundOnSamsungResults
1. *石油+インフレ*:ホルムズ海峡には世界の原油の1/5が通過する。戦争=原油$110+。平和=原油$80。原油が高い=インフレが高い=FRBは金利を高く維持=$BTC にとって悪材料
2. *リスク・センチメント*:暗号は「リスクオン」資産のように取引される。地政学が落ち着くと資金がBTC/$ETH へ戻る
3. *制裁の観点*:米国は4月、イラン関連の暗号資産で$344Mを凍結した。イランは暗号をNobitexのようにして活用してきた
*現在の状況 - 7月30日*
- *状況*:「脆い停戦」が維持中。イランは、米国が
- *BTC価格*:今日$63,978だが、平和のニュースでは$65,363だった
- *FRB+イランの組み合わせ*:今週は両方が市場を動かしている。FRBの決定+イラン外交=ボラティリティ
*トレーダー向けの重要な要点*
シナリオ 暗号の反応
**外交/一時停止** BTCが上昇、原油が下落、アルトがローテーション
**エスカレーション/攻撃** BTCが$60K〜$62Kへ下落、原油が急騰、アルトは換金
**合意が署名** 「リスクオン」の上昇相場。$ETH は原油とのこれまでで最強の逆相関を持つ。
#FOMCWatching
#SouthKoreaProposesSuspiciousCryptoAccountFreeze
#KoreanStocksReboundOnSamsungResults
106
·
--

記事
ビットコインが下落に転じる中、大口保有者は過去1週間で29,075 BTCを積み増した。ビットコインは出来高の大きい中で、狭い$63,000〜$64,000のレンジで取引された。一方イーサリアムは同様に狭い範囲で約$1,900付近にとどまった。XRPとドージコインも横ばいで推移した。
過去24時間で、暗号資産市場から約4億ドルが清算された。主に強気のロングポジションでの動きが中心だった。
ビットコインの建玉(オープン・インタレスト)は過去24時間で1.52%増加した。とはいえ、バイナンスにおける個人投資家とクジラ(大口)デリバティブ取引業者は、主要銘柄で引き続きネット買い(強気)だった。
FRBの強硬な姿勢を受けて下落、株は赤字
株は水曜日に大幅な売りが相次いだ。ダウ工業株30種平均は1,153.18ポイント、2.19%下落して51,594.14で取引を終えた。S&P 500は1.52%下落して7,316.1で着地し、ハイテク比率の高いナスダック総合指数は1.74%下落して24,442.94で終了した。
ビットコインが下落に転じる中、大口保有者は過去1週間で29,075 BTCを積み増した。
ビットコインは出来高の大きい中で、狭い$63,000〜$64,000のレンジで取引された。一方イーサリアムは同様に狭い範囲で約$1,900付近にとどまった。XRPとドージコインも横ばいで推移した。
過去24時間で、暗号資産市場から約4億ドルが清算された。主に強気のロングポジションでの動きが中心だった。
ビットコインの建玉(オープン・インタレスト)は過去24時間で1.52%増加した。とはいえ、バイナンスにおける個人投資家とクジラ(大口)デリバティブ取引業者は、主要銘柄で引き続きネット買い(強気)だった。
FRBの強硬な姿勢を受けて下落、株は赤字
株は水曜日に大幅な売りが相次いだ。ダウ工業株30種平均は1,153.18ポイント、2.19%下落して51,594.14で取引を終えた。S&P 500は1.52%下落して7,316.1で着地し、ハイテク比率の高いナスダック総合指数は1.74%下落して24,442.94で終了した。
過去24時間で、暗号資産市場から約4億ドルが清算された。主に強気のロングポジションでの動きが中心だった。
ビットコインの建玉(オープン・インタレスト)は過去24時間で1.52%増加した。とはいえ、バイナンスにおける個人投資家とクジラ(大口)デリバティブ取引業者は、主要銘柄で引き続きネット買い(強気)だった。
FRBの強硬な姿勢を受けて下落、株は赤字
株は水曜日に大幅な売りが相次いだ。ダウ工業株30種平均は1,153.18ポイント、2.19%下落して51,594.14で取引を終えた。S&P 500は1.52%下落して7,316.1で着地し、ハイテク比率の高いナスダック総合指数は1.74%下落して24,442.94で終了した。
91
·
--
記事
BTC分析 次に何が起こるべきですか?アナリストによると、ここから何が起こるべきですか?
*現在の価格: $63,978.62*
*24Hの値幅: $63,267.34 - $64,744.81*
*変化: +$20.62 | +0.032%*
*時価総額: $1.27兆*
*今日起きたこと*
1. *統合*: $BTC は、FRBの政策と経済データを消化する中で、狭い $63K - $66K のレンジで取引されています
2. *テクニカル*: 重要なEMAをまだ下回っています。50日EMAは$64,971、100日EMAは$67,676、200日EMAは$73,742。RSIは50をわずかに下回り、MACDは弱気で短期は下向きの兆候です。
3. *背景*: 7月1日の安値$57,800から回復しました。7月の高値は$66,910でした。 $BTC は2026年に対して-27.2%です 5bd3c2494d51b6d3
BTC分析 次に何が起こるべきですか?
アナリストによると、ここから何が起こるべきですか?
*現在の価格: $63,978.62*
*24Hの値幅: $63,267.34 - $64,744.81*
*変化: +$20.62 | +0.032%*
*時価総額: $1.27兆*
*今日起きたこと*
1. *統合*: $BTC は、FRBの政策と経済データを消化する中で、狭い $63K - $66K のレンジで取引されています
2. *テクニカル*: 重要なEMAをまだ下回っています。50日EMAは$64,971、100日EMAは$67,676、200日EMAは$73,742。RSIは50をわずかに下回り、MACDは弱気で短期は下向きの兆候です。
3. *背景*: 7月1日の安値$57,800から回復しました。7月の高値は$66,910でした。 $BTC は2026年に対して-27.2%です 5bd3c2494d51b6d3
*現在の価格: $63,978.62*
*24Hの値幅: $63,267.34 - $64,744.81*
*変化: +$20.62 | +0.032%*
*時価総額: $1.27兆*
*今日起きたこと*
1. *統合*: $BTC は、FRBの政策と経済データを消化する中で、狭い $63K - $66K のレンジで取引されています
2. *テクニカル*: 重要なEMAをまだ下回っています。50日EMAは$64,971、100日EMAは$67,676、200日EMAは$73,742。RSIは50をわずかに下回り、MACDは弱気で短期は下向きの兆候です。
3. *背景*: 7月1日の安値$57,800から回復しました。7月の高値は$66,910でした。 $BTC は2026年に対して-27.2%です 5bd3c2494d51b6d3
1
152
·
--
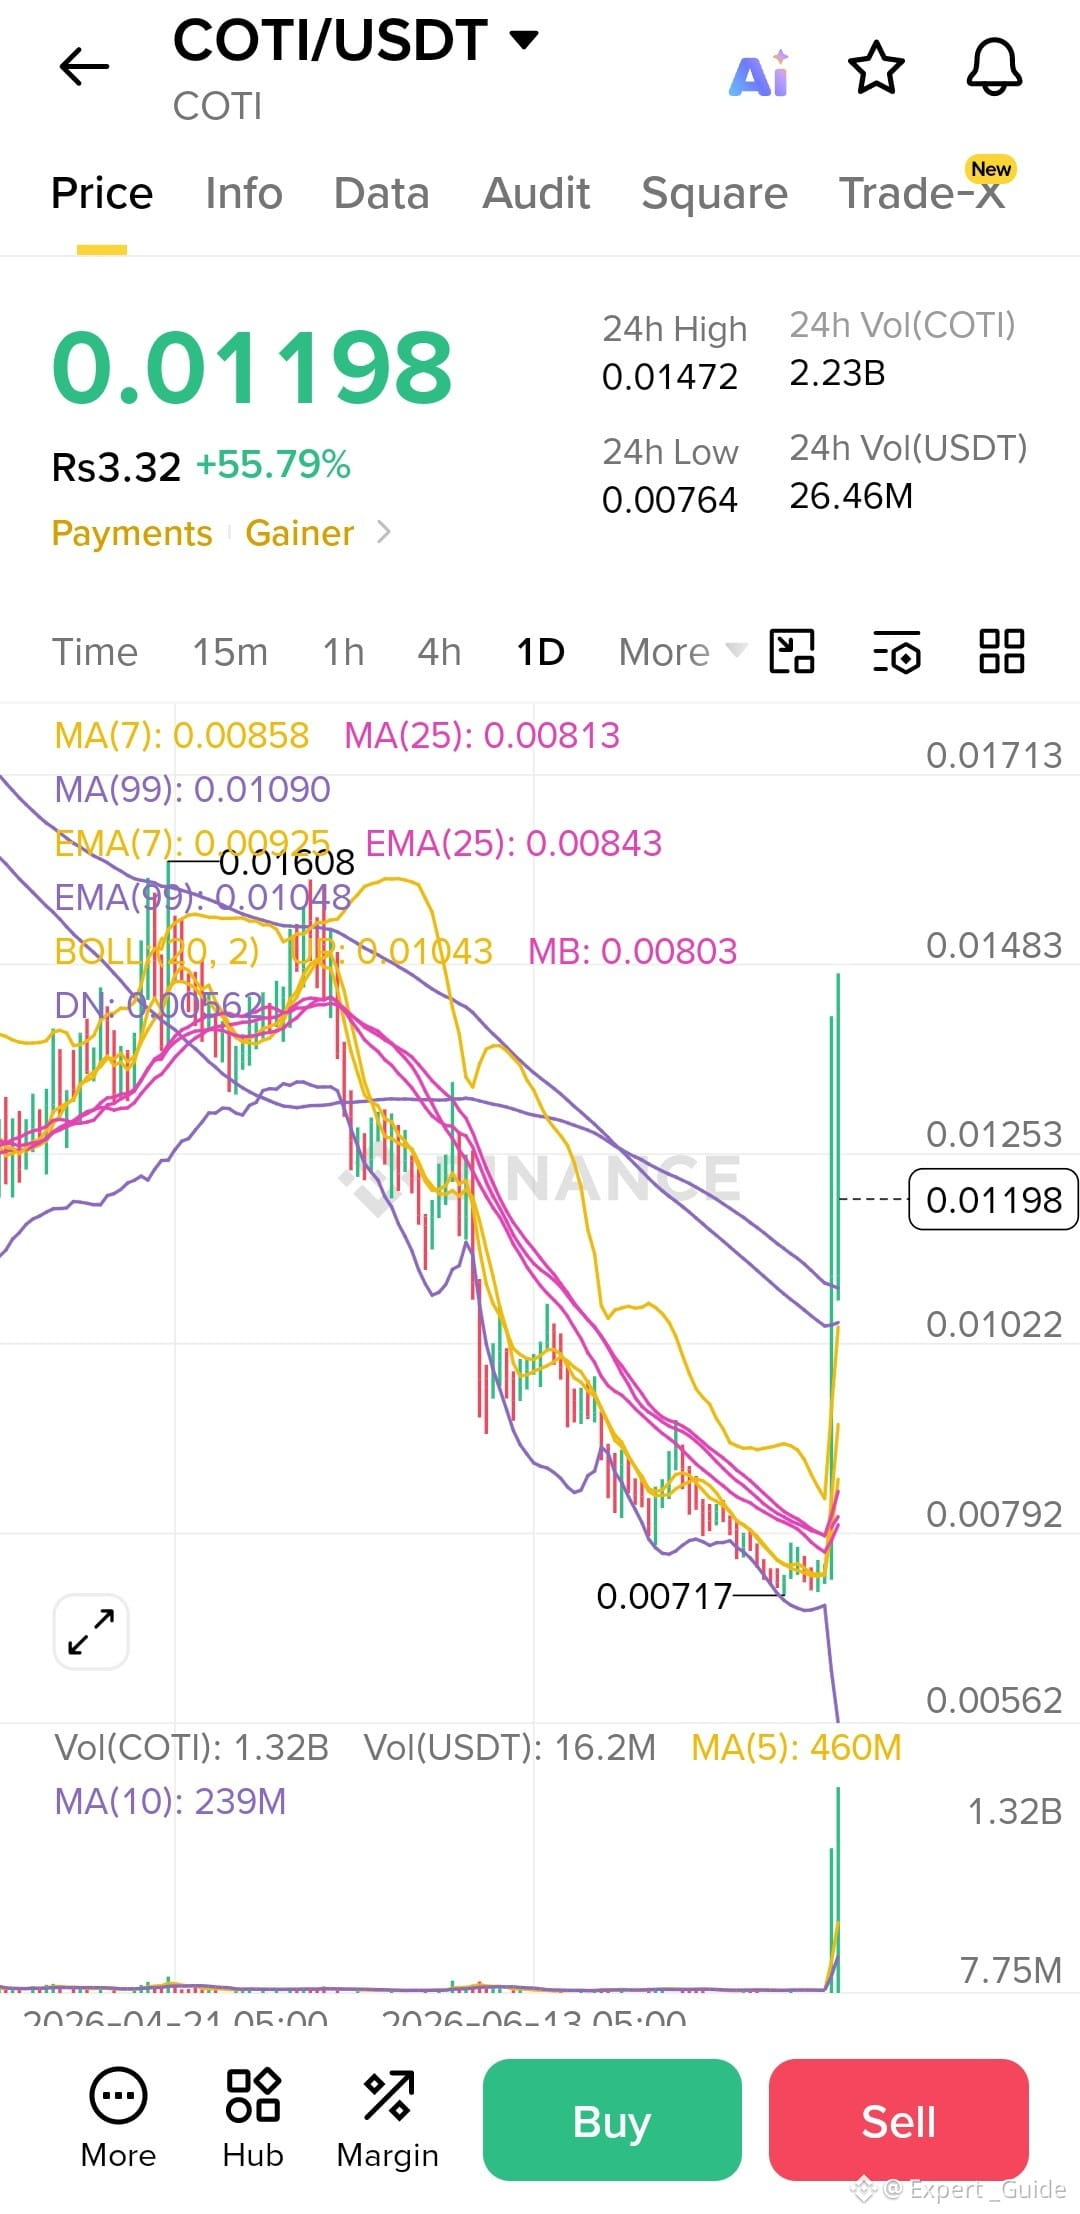
*$COTI /USDT 分析 - 📊
_現在価格: $0.01198 | 今日 +55.79%_
---
*📌 1. 今日起きたこと*
これは *非常に大きなポンプの陽線* です。
- *24H 安値*: $0.00764
- *24H 高値*: $0.01472
- *現在*: $0.01198
- *出来高スパイク*: 2.23B COTI が 239M 平均を上回って取引されました。出来高は 5〜10倍です。
理由: 「Payments | Gainer」タグ。COTI は決済に重点を置いた L1 です。このようなポンプは、通常ニュース、上場、または大きな提携によるものです。
*📌 2. テクニカル分析*
指標 値 意味
**価格 vs MA** $0.01198 vs MA7: 0.00858 価格はすべてのMAを大きく上回っています。短期的に強気
**EMA** EMA7: 0.00925 強い上昇トレンドですが、過熱
**ボリンジャー** 上限: 0.01043 価格が上部BBから抜けました。買われ過ぎ
**サポート** 直近: $0.00717 - $0.00792 跳ね返った地点
**レジスタンス** 直近: $0.01472 今日の高値。その後 $0.01608
*重要ポイント*: 55%のポンプの後、RSIはおそらく >80 です。これは「買われ過ぎ」で、調整(押し目)になりやすいです。
*📌 3. 高値 & 安値予測 - 次の1〜7日*
これは投資助言ではありません。COTI は非常に値動きが激しいです。
*強気シナリオ - 「ポンプが続く」*
出来高が維持され、$0.01472 を再テストしてブレイクした場合:
- *短期の高値*: `$0.01550 - $0.01608` ← チャート上の直前のスイング高値
- *次の目標*: `$0.01713` ← チャート上限
- *条件*:$BTC が安定 + 出来高が 1B を上回り続ける
*弱気/現実的シナリオ - 「押し目」*
50%+ のローソクの 90% はリトレースします。人々が利益確定するからです。
- *最初のサポート*: `$0.01022 - $0.01048` ← EMA99付近。おそらく押し目の目標
- *強いサポート*: `$0.00803 - $0.00858` ← MA7 + MA25 + ボリンジャー中線
- *最悪の安値*: `$0.00764 - $0.00717` ← 24h安値 / 直近の底。ここを割ると、下落トレンドへ戻る
*最も起こりやすいレンジ(次の3日): $0.00950 - $0.01400*
*📌 4. COTI のエキスパート向けトレーディングプラン*
1. *買っていない場合*: $0.01198 で FOMO 追いはしないでください。`$0.01020` のゾーンまでの押しを待ちます。
2. *安値で買った場合*: `$0.01470` で部分的に利益確定。保護のためストップロスを `$0.01000` に移動。
3. *無効化*: 日足のローソクが `$0.00950` を下回って終値を付けたら、ポンプは終わりの可能性が高いです。
*リスク*: $COTI I はこういうポンプを作って、同じくらいの速さで投げます。
#GrubMarketFilesConfidentiallyForUSIPO
*$COTI /USDT 分析 - 📊
_現在価格: $0.01198 | 今日 +55.79%_
---
*📌 1. 今日起きたこと*
これは *非常に大きなポンプの陽線* です。
- *24H 安値*: $0.00764
- *24H 高値*: $0.01472
- *現在*: $0.01198
- *出来高スパイク*: 2.23B COTI が 239M 平均を上回って取引されました。出来高は 5〜10倍です。
理由: 「Payments | Gainer」タグ。COTI は決済に重点を置いた L1 です。このようなポンプは、通常ニュース、上場、または大きな提携によるものです。
*📌 2. テクニカル分析*
指標 値 意味
**価格 vs MA** $0.01198 vs MA7: 0.00858 価格はすべてのMAを大きく上回っています。短期的に強気
**EMA** EMA7: 0.00925 強い上昇トレンドですが、過熱
**ボリンジャー** 上限: 0.01043 価格が上部BBから抜けました。買われ過ぎ
**サポート** 直近: $0.00717 - $0.00792 跳ね返った地点
**レジスタンス** 直近: $0.01472 今日の高値。その後 $0.01608
*重要ポイント*: 55%のポンプの後、RSIはおそらく >80 です。これは「買われ過ぎ」で、調整(押し目)になりやすいです。
*📌 3. 高値 & 安値予測 - 次の1〜7日*
これは投資助言ではありません。COTI は非常に値動きが激しいです。
*強気シナリオ - 「ポンプが続く」*
出来高が維持され、$0.01472 を再テストしてブレイクした場合:
- *短期の高値*: `$0.01550 - $0.01608` ← チャート上の直前のスイング高値
- *次の目標*: `$0.01713` ← チャート上限
- *条件*:$BTC が安定 + 出来高が 1B を上回り続ける
*弱気/現実的シナリオ - 「押し目」*
50%+ のローソクの 90% はリトレースします。人々が利益確定するからです。
- *最初のサポート*: `$0.01022 - $0.01048` ← EMA99付近。おそらく押し目の目標
- *強いサポート*: `$0.00803 - $0.00858` ← MA7 + MA25 + ボリンジャー中線
- *最悪の安値*: `$0.00764 - $0.00717` ← 24h安値 / 直近の底。ここを割ると、下落トレンドへ戻る
*最も起こりやすいレンジ(次の3日): $0.00950 - $0.01400*
*📌 4. COTI のエキスパート向けトレーディングプラン*
1. *買っていない場合*: $0.01198 で FOMO 追いはしないでください。`$0.01020` のゾーンまでの押しを待ちます。
2. *安値で買った場合*: `$0.01470` で部分的に利益確定。保護のためストップロスを `$0.01000` に移動。
3. *無効化*: 日足のローソクが `$0.00950` を下回って終値を付けたら、ポンプは終わりの可能性が高いです。
*リスク*: $COTI I はこういうポンプを作って、同じくらいの速さで投げます。
#GrubMarketFilesConfidentiallyForUSIPO
_現在価格: $0.01198 | 今日 +55.79%_
---
*📌 1. 今日起きたこと*
これは *非常に大きなポンプの陽線* です。
- *24H 安値*: $0.00764
- *24H 高値*: $0.01472
- *現在*: $0.01198
- *出来高スパイク*: 2.23B COTI が 239M 平均を上回って取引されました。出来高は 5〜10倍です。
理由: 「Payments | Gainer」タグ。COTI は決済に重点を置いた L1 です。このようなポンプは、通常ニュース、上場、または大きな提携によるものです。
*📌 2. テクニカル分析*
指標 値 意味
**価格 vs MA** $0.01198 vs MA7: 0.00858 価格はすべてのMAを大きく上回っています。短期的に強気
**EMA** EMA7: 0.00925 強い上昇トレンドですが、過熱
**ボリンジャー** 上限: 0.01043 価格が上部BBから抜けました。買われ過ぎ
**サポート** 直近: $0.00717 - $0.00792 跳ね返った地点
**レジスタンス** 直近: $0.01472 今日の高値。その後 $0.01608
*重要ポイント*: 55%のポンプの後、RSIはおそらく >80 です。これは「買われ過ぎ」で、調整(押し目)になりやすいです。
*📌 3. 高値 & 安値予測 - 次の1〜7日*
これは投資助言ではありません。COTI は非常に値動きが激しいです。
*強気シナリオ - 「ポンプが続く」*
出来高が維持され、$0.01472 を再テストしてブレイクした場合:
- *短期の高値*: `$0.01550 - $0.01608` ← チャート上の直前のスイング高値
- *次の目標*: `$0.01713` ← チャート上限
- *条件*:$BTC が安定 + 出来高が 1B を上回り続ける
*弱気/現実的シナリオ - 「押し目」*
50%+ のローソクの 90% はリトレースします。人々が利益確定するからです。
- *最初のサポート*: `$0.01022 - $0.01048` ← EMA99付近。おそらく押し目の目標
- *強いサポート*: `$0.00803 - $0.00858` ← MA7 + MA25 + ボリンジャー中線
- *最悪の安値*: `$0.00764 - $0.00717` ← 24h安値 / 直近の底。ここを割ると、下落トレンドへ戻る
*最も起こりやすいレンジ(次の3日): $0.00950 - $0.01400*
*📌 4. COTI のエキスパート向けトレーディングプラン*
1. *買っていない場合*: $0.01198 で FOMO 追いはしないでください。`$0.01020` のゾーンまでの押しを待ちます。
2. *安値で買った場合*: `$0.01470` で部分的に利益確定。保護のためストップロスを `$0.01000` に移動。
3. *無効化*: 日足のローソクが `$0.00950` を下回って終値を付けたら、ポンプは終わりの可能性が高いです。
*リスク*: $COTI I はこういうポンプを作って、同じくらいの速さで投げます。
#GrubMarketFilesConfidentiallyForUSIPO
270
·
--
こちらは現在Binanceでトレンド中の*コイン*です - 2026年7月* 👇
*🔥 Binance Square / コミュニティで話題*
1. *$ANSEM* - The Black Bull | 201件の言及
2. *$PENGU* - Pudgy Penguins | 114件の言及
3. *$PEPE * - Pepe | 63件の言及
4. *$VVV* - Venice Token | 96件の言及
5. *$TLM* - Alien Worlds | 951件の言及
6. *$LIT* - Lighter | 101件の言及
7. *$PUMP MP* - http://Pump.fun | 92件の言及
8. *$BONK* - Bonk | 113件の言及
9. *$AVAX AX* - Avalanche | 32件の言及
10. *$SIREN* - Siren | 385件の言及 6e59
*📈 今週のトップ実績 / 最も注目*
*2026年7月 第3週 - 2桁の上昇*
- *DEXE* - DeXe: 7月13日に$49.43を記録、現在は∼$44.14
- *ZEC* - Zcash: 7日で∼16%上昇、$533.62をテスト中
- *UNI* - Uniswap: ∼15%上昇して∼$3.56、$3.538のレジスタンス付近 1a74
*DeFiの上昇銘柄*:*AAVE*と*ONDO*が直近24時間のトップ実績として浮上。
#KospiCrashes11%OnChinaDUVChipThreat #USTreasuryYieldsRetreat #VisaToCut2600JobsExpandStablecoins
こちらは現在Binanceでトレンド中の*コイン*です - 2026年7月* 👇
*🔥 Binance Square / コミュニティで話題*
1. *$ANSEM* - The Black Bull | 201件の言及
2. *$PENGU* - Pudgy Penguins | 114件の言及
3. *$PEPE * - Pepe | 63件の言及
4. *$VVV* - Venice Token | 96件の言及
5. *$TLM* - Alien Worlds | 951件の言及
6. *$LIT* - Lighter | 101件の言及
7. *$PUMP MP* - http://Pump.fun | 92件の言及
8. *$BONK* - Bonk | 113件の言及
9. *$AVAX AX* - Avalanche | 32件の言及
10. *$SIREN* - Siren | 385件の言及 6e59
*📈 今週のトップ実績 / 最も注目*
*2026年7月 第3週 - 2桁の上昇*
- *DEXE* - DeXe: 7月13日に$49.43を記録、現在は∼$44.14
- *ZEC* - Zcash: 7日で∼16%上昇、$533.62をテスト中
- *UNI* - Uniswap: ∼15%上昇して∼$3.56、$3.538のレジスタンス付近 1a74
*DeFiの上昇銘柄*:*AAVE*と*ONDO*が直近24時間のトップ実績として浮上。
#KospiCrashes11%OnChinaDUVChipThreat #USTreasuryYieldsRetreat #VisaToCut2600JobsExpandStablecoins
*🔥 Binance Square / コミュニティで話題*
1. *$ANSEM* - The Black Bull | 201件の言及
2. *$PENGU* - Pudgy Penguins | 114件の言及
3. *$PEPE * - Pepe | 63件の言及
4. *$VVV* - Venice Token | 96件の言及
5. *$TLM* - Alien Worlds | 951件の言及
6. *$LIT* - Lighter | 101件の言及
7. *$PUMP MP* - http://Pump.fun | 92件の言及
8. *$BONK* - Bonk | 113件の言及
9. *$AVAX AX* - Avalanche | 32件の言及
10. *$SIREN* - Siren | 385件の言及 6e59
*📈 今週のトップ実績 / 最も注目*
*2026年7月 第3週 - 2桁の上昇*
- *DEXE* - DeXe: 7月13日に$49.43を記録、現在は∼$44.14
- *ZEC* - Zcash: 7日で∼16%上昇、$533.62をテスト中
- *UNI* - Uniswap: ∼15%上昇して∼$3.56、$3.538のレジスタンス付近 1a74
*DeFiの上昇銘柄*:*AAVE*と*ONDO*が直近24時間のトップ実績として浮上。
#KospiCrashes11%OnChinaDUVChipThreat #USTreasuryYieldsRetreat #VisaToCut2600JobsExpandStablecoins
458
·
--
記事
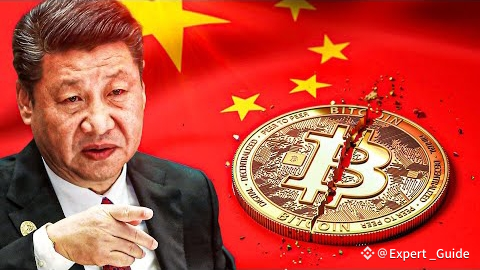
緊急速報:中国がすべての暗号を禁止。次に何が起こる?市場はどうなったのか?
パニック?
まあ、そんな感じ。
ビットコインは$111Kから$104K未満に数時間で急落した
イーサリアムはほぼ7%下落した
取引所は引き出しで活気づいた
USDTのようなステーブルコインの需要が高まった
でも、ここでのひねりは:
これを完璧な購入機会と呼ぶ人もいる。
恐怖が最も強く襲うとき — 賢いお金は積み増す。
🧠 中国はなぜこれをしているのか?
公式なストーリー?「金融の安全」、「資本管理」、そして「詐欺防止」。
しかし、本当の理由は?
彼らはデジタル人民元(CBDC)を唯一の重要な選択肢であるかのように推進している。
緊急速報:中国がすべての暗号を禁止。次に何が起こる?
市場はどうなったのか?
パニック?
まあ、そんな感じ。
ビットコインは$111Kから$104K未満に数時間で急落した
イーサリアムはほぼ7%下落した
取引所は引き出しで活気づいた
USDTのようなステーブルコインの需要が高まった
でも、ここでのひねりは:
これを完璧な購入機会と呼ぶ人もいる。
恐怖が最も強く襲うとき — 賢いお金は積み増す。
🧠 中国はなぜこれをしているのか?
公式なストーリー?「金融の安全」、「資本管理」、そして「詐欺防止」。
しかし、本当の理由は?
彼らはデジタル人民元(CBDC)を唯一の重要な選択肢であるかのように推進している。
パニック?
まあ、そんな感じ。
ビットコインは$111Kから$104K未満に数時間で急落した
イーサリアムはほぼ7%下落した
取引所は引き出しで活気づいた
USDTのようなステーブルコインの需要が高まった
でも、ここでのひねりは:
これを完璧な購入機会と呼ぶ人もいる。
恐怖が最も強く襲うとき — 賢いお金は積み増す。
🧠 中国はなぜこれをしているのか?
公式なストーリー?「金融の安全」、「資本管理」、そして「詐欺防止」。
しかし、本当の理由は?
彼らはデジタル人民元(CBDC)を唯一の重要な選択肢であるかのように推進している。
2
2.3k
·
--
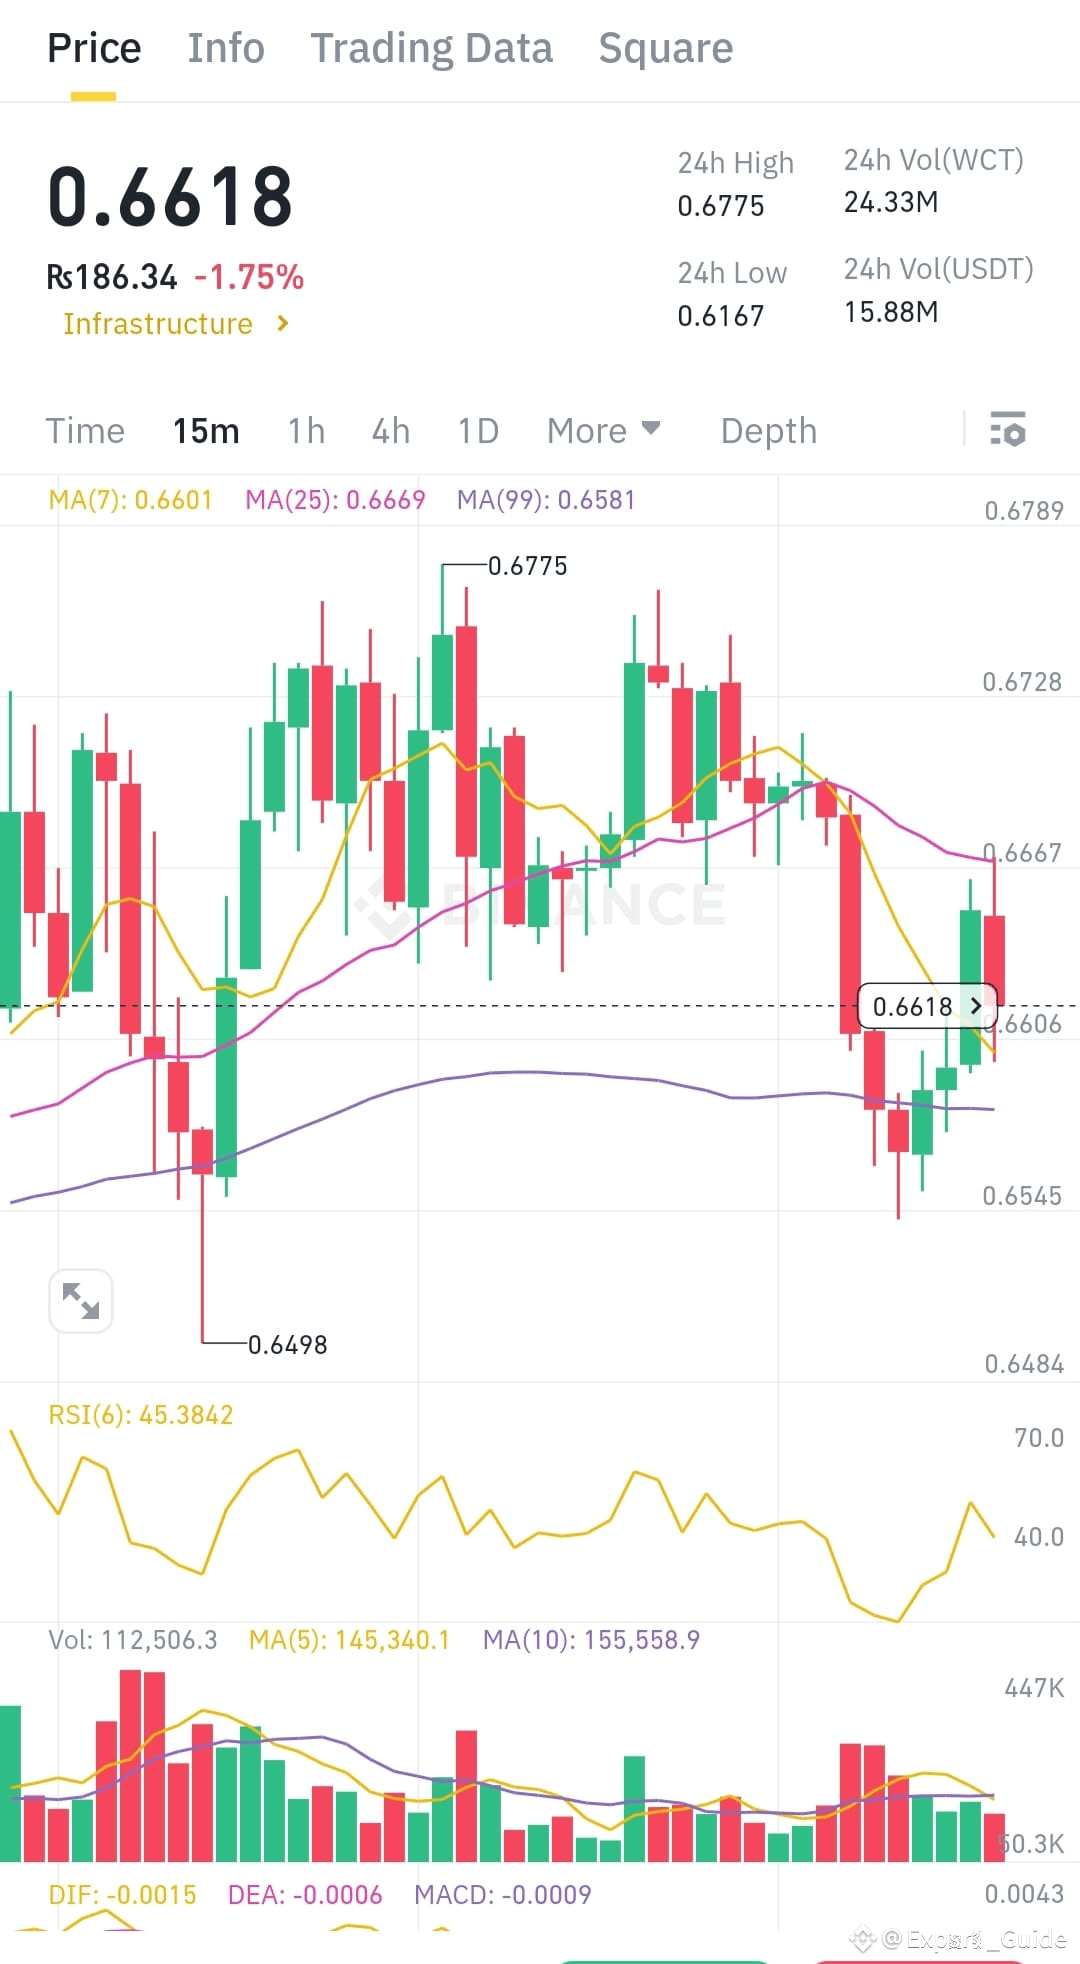
$WCT /USDT トレーディングシグナル 15分間の時間分析 💮💮
主な観察事項:
現在の価格: $0.6618
価格は-1.75%下落しており、わずかな弱気圧力を示しています。
移動平均:
MA(7): 0.6601 (黄色)
MA(25): 0.6669 (マゼンタ)
MA(99): 0.6581 (紫)
価格は25 MAの下にありますが、99 MAの上にあり、短期的な弱さを示していますが、長期的なサポートの可能性もあります。
サポートとレジスタンス:
24時間高値: 0.6775
24時間安値: 0.6167
最近のサポート: 約0.6498
レジスタンスゾーン: 約0.6670–0.6720
RSI(相対力指数):
RSI(6): 45.38
RSIは50未満で、わずかに弱気の勢いを示していますが、まだ売られすぎではありません。
MACD:
MACD値はわずかにネガティブです:
DIF: -0.0015
DEA: -0.0006
MACD: -0.0009
弱気のクロスオーバーを示しており、下向きの圧力を示唆しています。
ボリューム:
ボリュームはサポートまでの下落中に最近の急増を示しており、下位レベル(約0.65)でのバイヤーからの強い反応を暗示しています。
短期的展望(15分チャート):
短期的に弱気から中立バイアスで、価格が0.6670を取り戻せない場合はサポート(0.6550–0.6490)の再テストの可能性があります。
0.6670を強いボリュームで突破すれば、再び0.6775に向けて強気の勢いがシフトする可能性があります。
戦略の提案:
スカルプバイゾーン: 約0.6500–0.6550で、ストップロスを0.6480以下に設定。
売り/ショートゾーン: レジスタンスの近くで0.6670–0.6720。
$WCT
$WCT
#wct
#ETHMarketWatch
#BTCBreaksATH110K
$WCT /USDT トレーディングシグナル 15分間の時間分析 💮💮
主な観察事項:
現在の価格: $0.6618
価格は-1.75%下落しており、わずかな弱気圧力を示しています。
移動平均:
MA(7): 0.6601 (黄色)
MA(25): 0.6669 (マゼンタ)
MA(99): 0.6581 (紫)
価格は25 MAの下にありますが、99 MAの上にあり、短期的な弱さを示していますが、長期的なサポートの可能性もあります。
サポートとレジスタンス:
24時間高値: 0.6775
24時間安値: 0.6167
最近のサポート: 約0.6498
レジスタンスゾーン: 約0.6670–0.6720
RSI(相対力指数):
RSI(6): 45.38
RSIは50未満で、わずかに弱気の勢いを示していますが、まだ売られすぎではありません。
MACD:
MACD値はわずかにネガティブです:
DIF: -0.0015
DEA: -0.0006
MACD: -0.0009
弱気のクロスオーバーを示しており、下向きの圧力を示唆しています。
ボリューム:
ボリュームはサポートまでの下落中に最近の急増を示しており、下位レベル(約0.65)でのバイヤーからの強い反応を暗示しています。
短期的展望(15分チャート):
短期的に弱気から中立バイアスで、価格が0.6670を取り戻せない場合はサポート(0.6550–0.6490)の再テストの可能性があります。
0.6670を強いボリュームで突破すれば、再び0.6775に向けて強気の勢いがシフトする可能性があります。
戦略の提案:
スカルプバイゾーン: 約0.6500–0.6550で、ストップロスを0.6480以下に設定。
売り/ショートゾーン: レジスタンスの近くで0.6670–0.6720。
$WCT
$WCT
#wct
#ETHMarketWatch
#BTCBreaksATH110K
主な観察事項:
現在の価格: $0.6618
価格は-1.75%下落しており、わずかな弱気圧力を示しています。
移動平均:
MA(7): 0.6601 (黄色)
MA(25): 0.6669 (マゼンタ)
MA(99): 0.6581 (紫)
価格は25 MAの下にありますが、99 MAの上にあり、短期的な弱さを示していますが、長期的なサポートの可能性もあります。
サポートとレジスタンス:
24時間高値: 0.6775
24時間安値: 0.6167
最近のサポート: 約0.6498
レジスタンスゾーン: 約0.6670–0.6720
RSI(相対力指数):
RSI(6): 45.38
RSIは50未満で、わずかに弱気の勢いを示していますが、まだ売られすぎではありません。
MACD:
MACD値はわずかにネガティブです:
DIF: -0.0015
DEA: -0.0006
MACD: -0.0009
弱気のクロスオーバーを示しており、下向きの圧力を示唆しています。
ボリューム:
ボリュームはサポートまでの下落中に最近の急増を示しており、下位レベル(約0.65)でのバイヤーからの強い反応を暗示しています。
短期的展望(15分チャート):
短期的に弱気から中立バイアスで、価格が0.6670を取り戻せない場合はサポート(0.6550–0.6490)の再テストの可能性があります。
0.6670を強いボリュームで突破すれば、再び0.6775に向けて強気の勢いがシフトする可能性があります。
戦略の提案:
スカルプバイゾーン: 約0.6500–0.6550で、ストップロスを0.6480以下に設定。
売り/ショートゾーン: レジスタンスの近くで0.6670–0.6720。
$WCT
$WCT
#wct
#ETHMarketWatch
#BTCBreaksATH110K
1
4
1.7k
·
--
#ShareYourTrades
#TradeOfTheWeek $PORTAL 2025年5月10日現在、ポータル(PORTAL)の現在の価格は約0.0651米ドルで、前回の終値から0.0586%のわずかな増加を反映しています。
主な指標:
24時間の高値:$0.0671
24時間の安値:$0.0605
循環供給:約5億1980万PORTAL
最大供給:10億PORTAL
時価総額:約3040万米ドル
24時間の取引量:約4080万米ドル
私の注文を売る 注文 PORTAL/USDTを0.067 USDTの価格で122.5 PORTALトークンで
#ShareYourTrades
#TradeOfTheWeek $PORTAL 2025年5月10日現在、ポータル(PORTAL)の現在の価格は約0.0651米ドルで、前回の終値から0.0586%のわずかな増加を反映しています。
主な指標:
24時間の高値:$0.0671
24時間の安値:$0.0605
循環供給:約5億1980万PORTAL
最大供給:10億PORTAL
時価総額:約3040万米ドル
24時間の取引量:約4080万米ドル
私の注文を売る 注文 PORTAL/USDTを0.067 USDTの価格で122.5 PORTALトークンで
#TradeOfTheWeek $PORTAL 2025年5月10日現在、ポータル(PORTAL)の現在の価格は約0.0651米ドルで、前回の終値から0.0586%のわずかな増加を反映しています。
主な指標:
24時間の高値:$0.0671
24時間の安値:$0.0605
循環供給:約5億1980万PORTAL
最大供給:10億PORTAL
時価総額:約3040万米ドル
24時間の取引量:約4080万米ドル
私の注文を売る 注文 PORTAL/USDTを0.067 USDTの価格で122.5 PORTALトークンで
2
2.9k
·
--
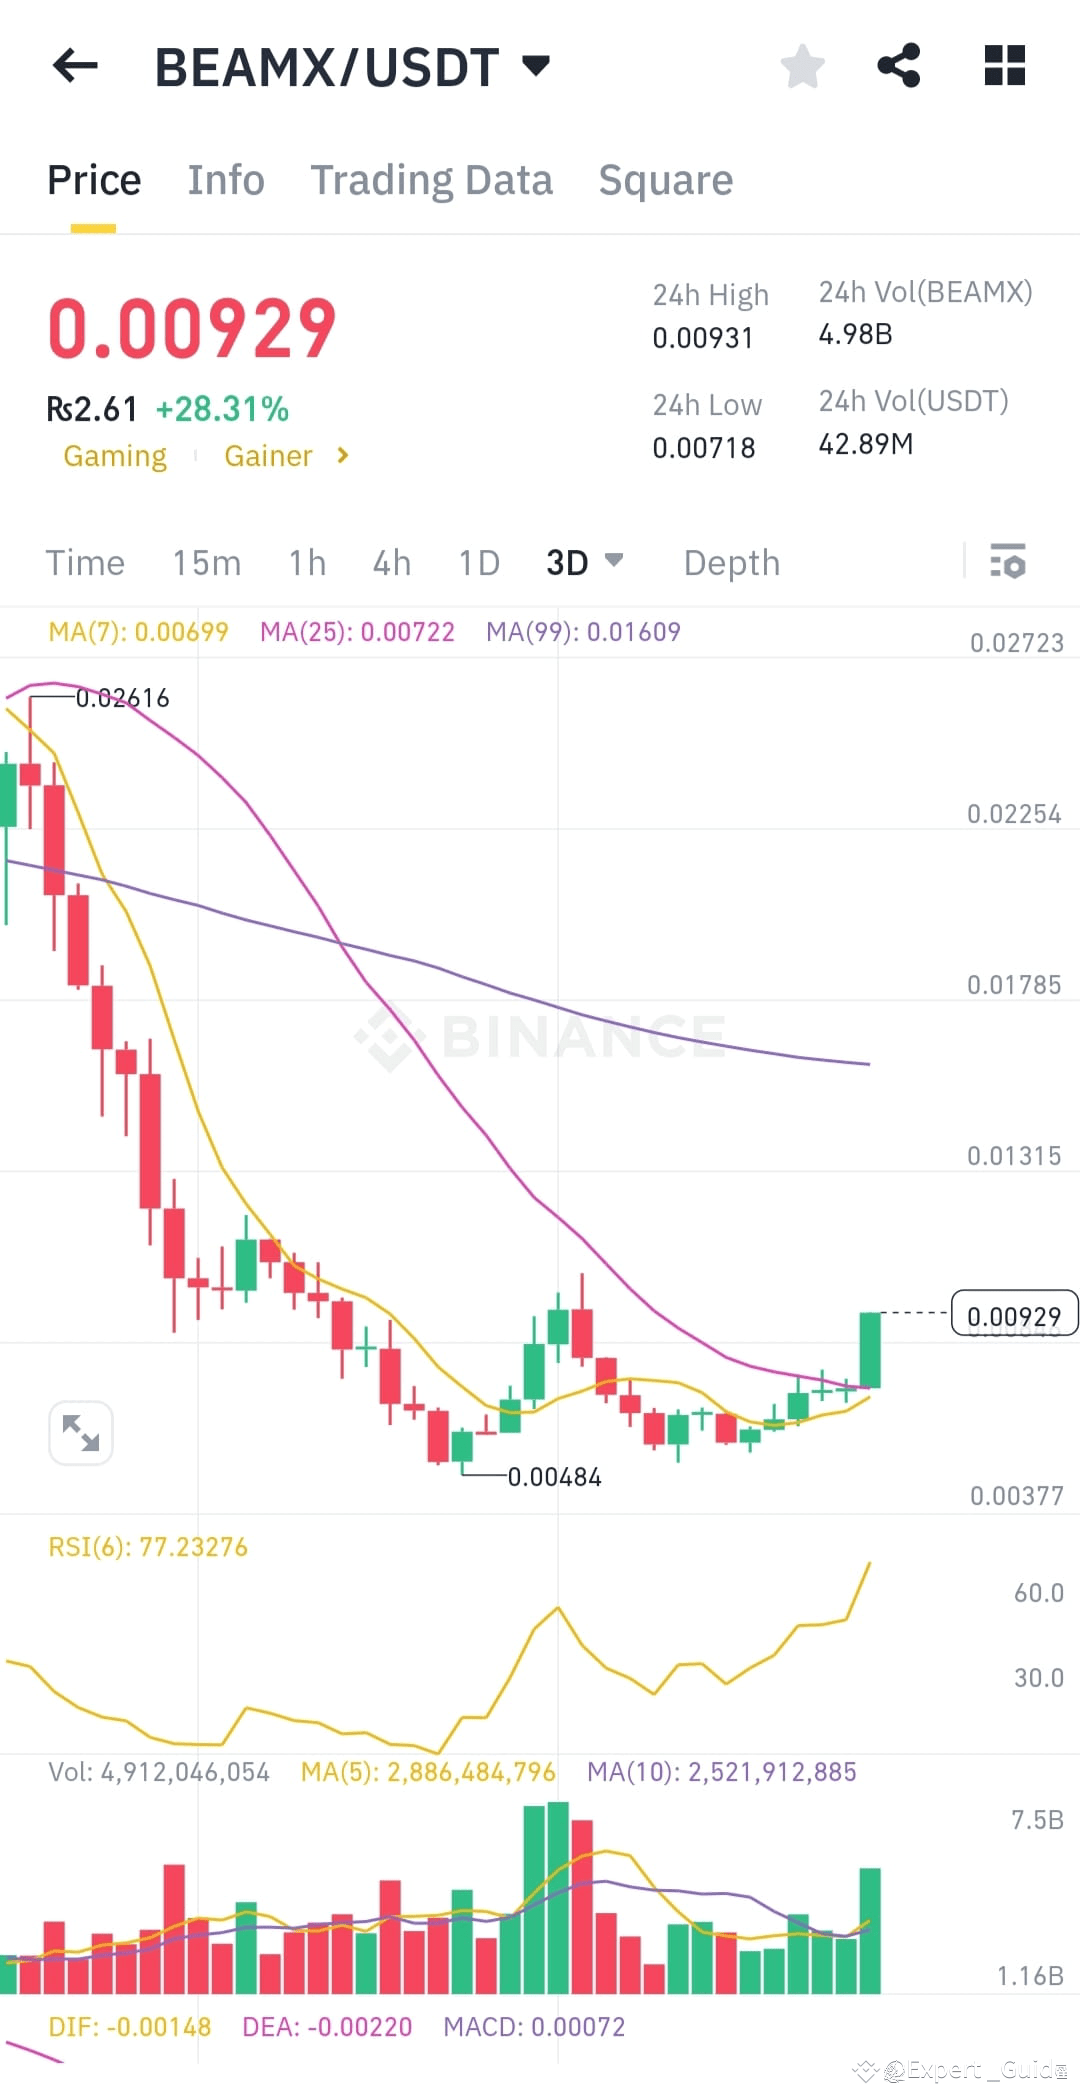
$BEAMX /USDTトレーディングシグナル、3日間の上昇、強い上昇モメンタムが形成中 🌟🌟
価格アクション
現在の価格: $0.00929
24時間の変化: +28.31% — 強い上昇運動。
最近の安値: $0.00484 — これはダブルボトムパターンが形成されているように見えます。
抵抗: 約$0.0093(最近の高値)および再度$0.013–$0.017付近(過去の構造に基づく)。
サポート: $0.0072(MA25)および$0.00699(MA7)。
インジケーター
移動平均:
MA(7): $0.00699(上向きにクロス — 強気)
MA(25): $0.00722
MA(99): $0.01609(まだ価格の上にあり、長期的なトレンドは弱気)
短期のMA(7 & 25)は上向きにカーブしており、潜在的なトレンド反転を示しています。
RSI(6): 77.23 — 買われすぎの領域。短期のプルバックに注意。
MACD:
MACDライン: 0.00072(シグナルラインを上回った — 強気のモメンタムが始まる)
DIF: -0.00148
DEA: -0.00220
この低レベルでのMACDクロスオーバーは、潜在的なトレンドの変化を示すことがよくあります。
ボリューム:
ボリュームスパイクは、現在の価格のブレイクアウトをサポートします。持続的なボリュームは、この上昇を確認するために不可欠です。
結論
このセットアップは、強気の反転の始まりを示唆しています:
ボリュームの増加を伴う統合からのブレイクアウト。
ポジティブなMACDクロスオーバー。
RSIは高い — 短期的には買われすぎ、可能な修正または統合。
短期トレーダーは、価格がプルバックした場合に$0.0075–$0.008でのエントリーを狙うかもしれません。
中期/長期の保有者は、モメンタムが続く場合、$0.016のMA(99)に向かう可能性を考慮するかもしれません。
$BTC
$BEAMX
#BTCRebound
#StablecoinPayments
#AirdropSafetyGuide
#AltcoinETFsPostponed
$BEAMX /USDTトレーディングシグナル、3日間の上昇、強い上昇モメンタムが形成中 🌟🌟
価格アクション
現在の価格: $0.00929
24時間の変化: +28.31% — 強い上昇運動。
最近の安値: $0.00484 — これはダブルボトムパターンが形成されているように見えます。
抵抗: 約$0.0093(最近の高値)および再度$0.013–$0.017付近(過去の構造に基づく)。
サポート: $0.0072(MA25)および$0.00699(MA7)。
インジケーター
移動平均:
MA(7): $0.00699(上向きにクロス — 強気)
MA(25): $0.00722
MA(99): $0.01609(まだ価格の上にあり、長期的なトレンドは弱気)
短期のMA(7 & 25)は上向きにカーブしており、潜在的なトレンド反転を示しています。
RSI(6): 77.23 — 買われすぎの領域。短期のプルバックに注意。
MACD:
MACDライン: 0.00072(シグナルラインを上回った — 強気のモメンタムが始まる)
DIF: -0.00148
DEA: -0.00220
この低レベルでのMACDクロスオーバーは、潜在的なトレンドの変化を示すことがよくあります。
ボリューム:
ボリュームスパイクは、現在の価格のブレイクアウトをサポートします。持続的なボリュームは、この上昇を確認するために不可欠です。
結論
このセットアップは、強気の反転の始まりを示唆しています:
ボリュームの増加を伴う統合からのブレイクアウト。
ポジティブなMACDクロスオーバー。
RSIは高い — 短期的には買われすぎ、可能な修正または統合。
短期トレーダーは、価格がプルバックした場合に$0.0075–$0.008でのエントリーを狙うかもしれません。
中期/長期の保有者は、モメンタムが続く場合、$0.016のMA(99)に向かう可能性を考慮するかもしれません。
$BTC
$BEAMX
#BTCRebound
#StablecoinPayments
#AirdropSafetyGuide
#AltcoinETFsPostponed
価格アクション
現在の価格: $0.00929
24時間の変化: +28.31% — 強い上昇運動。
最近の安値: $0.00484 — これはダブルボトムパターンが形成されているように見えます。
抵抗: 約$0.0093(最近の高値)および再度$0.013–$0.017付近(過去の構造に基づく)。
サポート: $0.0072(MA25)および$0.00699(MA7)。
インジケーター
移動平均:
MA(7): $0.00699(上向きにクロス — 強気)
MA(25): $0.00722
MA(99): $0.01609(まだ価格の上にあり、長期的なトレンドは弱気)
短期のMA(7 & 25)は上向きにカーブしており、潜在的なトレンド反転を示しています。
RSI(6): 77.23 — 買われすぎの領域。短期のプルバックに注意。
MACD:
MACDライン: 0.00072(シグナルラインを上回った — 強気のモメンタムが始まる)
DIF: -0.00148
DEA: -0.00220
この低レベルでのMACDクロスオーバーは、潜在的なトレンドの変化を示すことがよくあります。
ボリューム:
ボリュームスパイクは、現在の価格のブレイクアウトをサポートします。持続的なボリュームは、この上昇を確認するために不可欠です。
結論
このセットアップは、強気の反転の始まりを示唆しています:
ボリュームの増加を伴う統合からのブレイクアウト。
ポジティブなMACDクロスオーバー。
RSIは高い — 短期的には買われすぎ、可能な修正または統合。
短期トレーダーは、価格がプルバックした場合に$0.0075–$0.008でのエントリーを狙うかもしれません。
中期/長期の保有者は、モメンタムが続く場合、$0.016のMA(99)に向かう可能性を考慮するかもしれません。
$BTC
$BEAMX
#BTCRebound
#StablecoinPayments
#AirdropSafetyGuide
#AltcoinETFsPostponed
1
1
2.4k
ログインして、さらにコンテンツを読む
厳選トピックで世界の暗号資産トレーダーの仲間入り
⚡️ 暗号資産に関する最新かつ有益な情報が見つかります。
💬 世界最大の暗号資産取引所から信頼されています。
👍 認証を受けたクリエイターから、有益なインサイトを得られます。
メール / 電話番号
トレンドトピック
BinanceLaunchesBinanceIntelligence
閲覧回数 36,762
450人が討論中
🚨 BINANCEが取引所にAIを直接導入——個人投資家の取引のあり方が変わるかもしれない。
Binanceは、Binanceエコシステムに組み込まれた新たなAIレイヤー「Binance Intelligence」を正式にローンチしました。3つのプロダクトで構成されています。
日常的に利用するユーザー向けのBinance AI、
自動売買のワークフロー向けのBinance AI Pro、
金融エージェントを開発する開発者向けのAgent OSです。
トレーダーが注目すべきポイントは?
Binance AIは、市場の概要、スマートアラート、損益の振り返り、パーソナライズされた情報を提示できます。一方、AI Proは、平易な言葉で書いた取引アイデアを、視覚的な戦略ワークフローに変換するよう設計されています。
つまり、今後の取引所間の競争は、
手数料の安さ対流動性の深さ、
ではなくなるかもしれません。
競争の焦点は、
トレーダーに最も優れたAI執行レイヤーを提供できるのはどこか、
になる可能性があります。
Binance Intelligenceが実際にユーザーの利用増、自動化戦略の拡大、取引頻度の上昇を促すなら、まずは$BNBに注目です。
AIの普及 ↑
→ Binanceの利用拡大 ↑
→ 取引活動の活発化 ↑
→ エコシステムの追い風が強まる。
今注目したい材料は、
グローバル展開 + AI Proのローンチ + 測定可能なユーザー普及です。
AIが市場で何が起きているかを伝えるだけでなく……
……取引そのものの構築まで支援するようになったら?
そのとき、これは単なるチャットボットの登場より、はるかに大きな話になります。👀
#binancelaunchesbinanceintelligence #EvernorthXRPTreasuryCompletesSPACMerger #ADAGains10%Above$0.27 #ETHUp70%InQ3ButLiquidityFalls #EthStakingExitQueueHits2026High
KimHotbae
·いいね:20件
·閲覧回数 24.8k
EvernorthXRPTreasuryCompletesSPACMerger
閲覧回数 32,517
311人が討論中
ADAGains10%Above$0.27
閲覧回数 31,065
206人が討論中