

Ted Shaffner eHUT
3 投稿

Ted Shaffner eHUT
報告
ユーザーをブロック
16 フォロー
2 フォロワー
0 いいね
投稿
記事
翻訳参照
XPL: From $1.69 to $0.07 — What Went Wrong With Plasma, and Can It Recover?1. The Rise and Fall of XPL
Plasma entered the market with a strong narrative: building a Layer-1 blockchain designed specifically for stablecoin payments, offering zero-fee USDT transfers and EVM compatibility.
Following its market debut in September 2025, XPL experienced significant volatility and eventually reached approximately $1.69. Early investors were attracted by its ambitious vision, market attention, and expectations of growing stablecoin adoption.
However, the excitement did not last. Selling pressure gradually increased, and the token entered a prolonged downward trend. By October 2026, XPL had fallen to approximately $0.07.
At the current level, the token has lost roughly 95.4% of its peak value.
2. What Caused the Massive Price Decline?
Several factors may explain XPL's dramatic fall.
A. Massive Token Unlocks
One of the most important factors is token supply.
Plasma has a maximum supply of 10 billion XPL. Its token distribution includes allocations for ecosystem development, private investors, the team, and public sales.
In September 2026, the one-year vesting cliff for team and investor allocations ended. This resulted in a substantial increase in circulating supply.
According to recent market analysis, circulating supply increased approximately 71% around the September unlock period, reaching roughly 4.76 billion tokens.
Additional monthly unlocks create continued potential selling pressure.
B. Weak Buying Demand
Increasing supply is not necessarily a problem when demand grows at the same pace.
However, when more tokens become available while buying demand remains weak, prices can struggle to recover.
This appears to be one of the major challenges facing XPL.
C. Declining Investor Confidence
Investors who purchased XPL at higher prices have experienced substantial losses.
Some may have decided to exit their positions rather than continue holding during an extended bearish trend.
This can create a cycle of selling pressure, declining prices, and further negative sentiment.
D. Competition in the Stablecoin Sector
Plasma operates in a competitive blockchain environment.
Its long-term success depends on attracting stablecoin users, developers, liquidity, and real economic activity. Strong competition from established blockchain networks makes this challenging.
3. What Does the Technical Chart Tell Us?
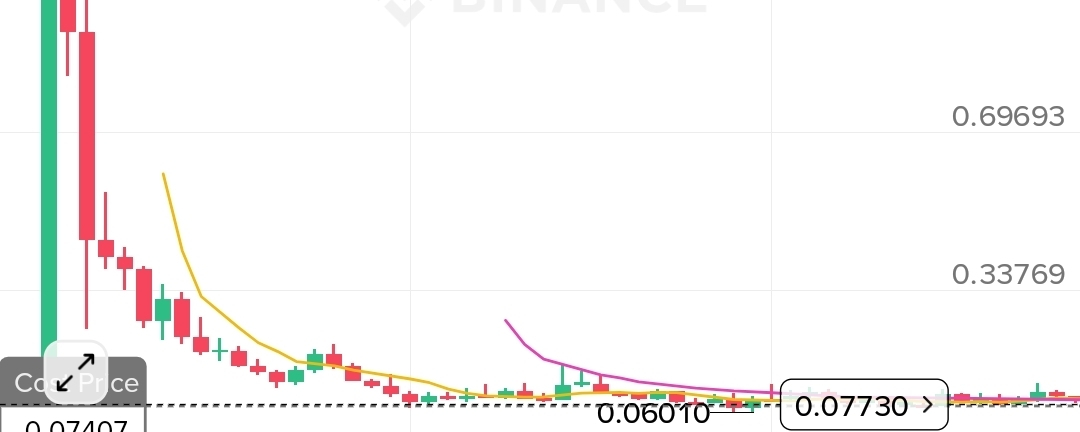
Looking at the Binance chart, XPL is showing a prolonged bearish structure.
The important observations include:
- All-time high: Approximately $1.69.
- Current price in the supplied screenshot: $0.07730.
- Historical low visible on the chart: Approximately $0.06010.
- Seven-day performance: +1.36%.
- Thirty-day performance: -21.74%.
- Ninety-day performance: +3.20%.
- One-year performance: -77.97%.
The price remains below both the 7-day and 25-day moving averages shown in the screenshot.
This indicates that the short-term trend is still weak.
The $0.060–$0.070 region is an important historical support area to watch. A sustained breakdown below that region could create further downside risk.
On the other hand, a recovery above $0.09–$0.10 could be an early sign of improving momentum, although confirmation would require stronger volume and sustained buying pressure.
4. Can XPL Recover?
Despite the massive decline, a recovery cannot be ruled out.
There are several factors that could potentially support a future recovery:
- Increased adoption of Plasma's stablecoin payment infrastructure.
- Growth in USDT transactions and network activity.
- New partnerships and integrations.
- Improved market sentiment toward altcoins.
- Stronger buying demand relative to newly unlocked supply.
However, investors should understand that a token trading 95% below its all-time high does not automatically mean it is undervalued.
A recovery requires genuine demand, stronger fundamentals, and improved market confidence.
5. Possible Price Scenarios
The following are hypothetical scenarios, not price predictions or guaranteed targets.
Scenario| Possible price
Bearish| $0.04–$0.06
Stabilization| $0.07–$0.10
Bullish recovery| $0.15–$0.25
Strong speculative rally| $0.30–$0.50
Returning to $1.69 would require an extraordinary increase in market value and demand. Investors should not assume that the previous all-time high will be revisited.
6. Is XPL Worth Watching?
In my view, XPL is a cryptocurrency worth monitoring, but it remains a high-risk recovery candidate.
Its technology and stablecoin-focused vision offer a potential long-term opportunity. Nevertheless, continued token unlocks, uncertain demand, and the prolonged bearish trend are serious concerns.
Before considering an investment, traders should monitor:
1. Monthly token unlocks.
2. Circulating supply and market capitalization.
3. Stablecoin deposits and network activity.
4. Trading volume and buying pressure.
5. Whether the token establishes a sustainable price floor.
Conclusion
The journey of XPL from $1.69 to approximately $0.07 is a reminder that even promising cryptocurrency projects can experience extraordinary losses.
The next chapter for Plasma will depend less on its previous all-time high and more on its ability to demonstrate real adoption, attract new capital, and manage its increasing token supply.
For now, patience and careful research may be more valuable than rushing into a falling market.
The real question is not how far XPL has fallen, but whether Plasma can build enough demand to justify a sustainable recovery.
Disclaimer: This article is for educational and informational purposes only. Cryptocurrency investments carry substantial risk, and the scenarios discussed are hypothetical, not financial advice.
XPL: From $1.69 to $0.07 — What Went Wrong With Plasma, and Can It Recover?
1. The Rise and Fall of XPL
Plasma entered the market with a strong narrative: building a Layer-1 blockchain designed specifically for stablecoin payments, offering zero-fee USDT transfers and EVM compatibility.
Following its market debut in September 2025, XPL experienced significant volatility and eventually reached approximately $1.69. Early investors were attracted by its ambitious vision, market attention, and expectations of growing stablecoin adoption.
However, the excitement did not last. Selling pressure gradually increased, and the token entered a prolonged downward trend. By October 2026, XPL had fallen to approximately $0.07.
At the current level, the token has lost roughly 95.4% of its peak value.
2. What Caused the Massive Price Decline?
Several factors may explain XPL's dramatic fall.
A. Massive Token Unlocks
One of the most important factors is token supply.
Plasma has a maximum supply of 10 billion XPL. Its token distribution includes allocations for ecosystem development, private investors, the team, and public sales.
In September 2026, the one-year vesting cliff for team and investor allocations ended. This resulted in a substantial increase in circulating supply.
According to recent market analysis, circulating supply increased approximately 71% around the September unlock period, reaching roughly 4.76 billion tokens.
Additional monthly unlocks create continued potential selling pressure.
B. Weak Buying Demand
Increasing supply is not necessarily a problem when demand grows at the same pace.
However, when more tokens become available while buying demand remains weak, prices can struggle to recover.
This appears to be one of the major challenges facing XPL.
C. Declining Investor Confidence
Investors who purchased XPL at higher prices have experienced substantial losses.
Some may have decided to exit their positions rather than continue holding during an extended bearish trend.
This can create a cycle of selling pressure, declining prices, and further negative sentiment.
D. Competition in the Stablecoin Sector
Plasma operates in a competitive blockchain environment.
Its long-term success depends on attracting stablecoin users, developers, liquidity, and real economic activity. Strong competition from established blockchain networks makes this challenging.
3. What Does the Technical Chart Tell Us?
Looking at the Binance chart, XPL is showing a prolonged bearish structure.
The important observations include:
- All-time high: Approximately $1.69.
- Current price in the supplied screenshot: $0.07730.
- Historical low visible on the chart: Approximately $0.06010.
- Seven-day performance: +1.36%.
- Thirty-day performance: -21.74%.
- Ninety-day performance: +3.20%.
- One-year performance: -77.97%.
The price remains below both the 7-day and 25-day moving averages shown in the screenshot.
This indicates that the short-term trend is still weak.
The $0.060–$0.070 region is an important historical support area to watch. A sustained breakdown below that region could create further downside risk.
On the other hand, a recovery above $0.09–$0.10 could be an early sign of improving momentum, although confirmation would require stronger volume and sustained buying pressure.
4. Can XPL Recover?
Despite the massive decline, a recovery cannot be ruled out.
There are several factors that could potentially support a future recovery:
- Increased adoption of Plasma's stablecoin payment infrastructure.
- Growth in USDT transactions and network activity.
- New partnerships and integrations.
- Improved market sentiment toward altcoins.
- Stronger buying demand relative to newly unlocked supply.
However, investors should understand that a token trading 95% below its all-time high does not automatically mean it is undervalued.
A recovery requires genuine demand, stronger fundamentals, and improved market confidence.
5. Possible Price Scenarios
The following are hypothetical scenarios, not price predictions or guaranteed targets.
Scenario| Possible price
Bearish| $0.04–$0.06
Stabilization| $0.07–$0.10
Bullish recovery| $0.15–$0.25
Strong speculative rally| $0.30–$0.50
Returning to $1.69 would require an extraordinary increase in market value and demand. Investors should not assume that the previous all-time high will be revisited.
6. Is XPL Worth Watching?
In my view, XPL is a cryptocurrency worth monitoring, but it remains a high-risk recovery candidate.
Its technology and stablecoin-focused vision offer a potential long-term opportunity. Nevertheless, continued token unlocks, uncertain demand, and the prolonged bearish trend are serious concerns.
Before considering an investment, traders should monitor:
1. Monthly token unlocks.
2. Circulating supply and market capitalization.
3. Stablecoin deposits and network activity.
4. Trading volume and buying pressure.
5. Whether the token establishes a sustainable price floor.
Conclusion
The journey of XPL from $1.69 to approximately $0.07 is a reminder that even promising cryptocurrency projects can experience extraordinary losses.
The next chapter for Plasma will depend less on its previous all-time high and more on its ability to demonstrate real adoption, attract new capital, and manage its increasing token supply.
For now, patience and careful research may be more valuable than rushing into a falling market.
The real question is not how far XPL has fallen, but whether Plasma can build enough demand to justify a sustainable recovery.
Disclaimer: This article is for educational and informational purposes only. Cryptocurrency investments carry substantial risk, and the scenarios discussed are hypothetical, not financial advice.
264
翻訳参照
Crypto Market Outlook: What Could Happen in November 2026?Bitcoin, Altcoins, Market Trends, and Potential Opportunities
Introduction
November 2026 could become an important month for the cryptocurrency market. After a difficult October, investors are watching Bitcoin's price movements, institutional investment flows, U.S. economic policy, and developments in major altcoins to determine whether the market is preparing for a recovery or another period of decline.
However, one important principle remains: a market recovery is possible, but it is not guaranteed. Investors should focus on market data, liquidity, and risk management rather than relying on social media predictions or hype.
1. Bitcoin: The Market's Main Directional Signal
Bitcoin remains the most important cryptocurrency to watch because its movements often influence the wider market.
Recent reporting indicates that Bitcoin spent much of October trading around the $80,000–$85,000 range, while facing pressure from institutional fund outflows and uncertainty over interest rates.
In November, three developments could influence Bitcoin:
Bullish scenario: Renewed institutional demand, stronger ETF inflows, and improving investor confidence could help Bitcoin break above resistance.
Neutral scenario: Bitcoin could continue moving sideways while buyers and sellers compete around important price levels.
Bearish scenario: Persistent selling pressure, tighter financial conditions, or negative economic news could push Bitcoin toward lower support levels.
Investors should watch trading volume, spot Bitcoin ETF flows, and whether Bitcoin can sustain a breakout instead of reacting to a brief price spike.
2. Could Altcoins Recover in November?
Altcoins could benefit if Bitcoin stabilizes and investors become more willing to take risks. However, not every altcoin will necessarily participate in a recovery.
Several projects worth monitoring include:
Ethereum (ETH): Network development, institutional demand, and activity across decentralized finance.
Solana (SOL): Network adoption, application activity, and developments around its ecosystem.
XRP: Regulatory developments, institutional adoption, and payment-related activity.
Chainlink (LINK): Demand for blockchain oracles and tokenization infrastructure.
Avalanche (AVAX): Network adoption, ecosystem growth, and actual usage.
These are assets to research, not guaranteed winners. Their prices can fall even when the wider market is recovering. Smaller cryptocurrencies may offer greater upside in a strong rally, but they also carry higher liquidity, volatility, and project-failure risks.
3. Four Major Factors That Could Move the Market
Interest rates and inflation
Interest-rate expectations are especially important. If investors expect financial conditions to become easier, risk assets may benefit. If inflation remains persistent and monetary policy becomes more restrictive, cryptocurrencies could face additional pressure.
U.S. midterm elections
The U.S. midterm elections on November 3, 2026, may influence expectations surrounding cryptocurrency regulation and future legislation. Nevertheless, election outcomes do not automatically produce a Bitcoin rally.
Institutional investment
ETF inflows and outflows can provide useful evidence of institutional demand. Sustained inflows may support prices, while continued withdrawals can indicate weakening demand.
Market sentiment and liquidity
Fear, leverage, and sudden changes in liquidity can create sharp price movements. Traders should monitor liquidation levels, funding rates, trading volume, and stablecoin liquidity instead of relying exclusively on fear-and-greed indicators.
4. Will November Bring a Bull Run?
There are three reasonable scenarios to consider.
Scenario A — Bullish recovery: Bitcoin breaks above resistance with strong volume and sustained buying. Ethereum and selected altcoins may follow, although performance will vary.
Scenario B — Sideways market: Bitcoin remains range-bound, and altcoins experience short-lived rallies. This environment can be difficult for inexperienced traders because frequent breakouts may fail.
Scenario C — Further correction: Economic uncertainty, weak institutional demand, or excessive leverage triggers additional selling. Smaller altcoins could fall more sharply than Bitcoin.
The most useful approach is to identify what evidence would support each scenario rather than selecting a direction in advance.
5. A Practical Strategy for Small Investors
For investors with limited capital, protecting money is more important than finding a coin that promises to multiply quickly.
Research established assets before considering small-cap tokens.
Avoid investing money needed for household expenses or emergencies.
Consider gradual entries instead of investing the entire amount at once.
Check token unlock schedules, circulating supply, liquidity, and project fundamentals.
Avoid excessive leverage and borrowing to trade.
Define your entry, exit, and maximum acceptable loss before buying.
For investors in Pakistan, remember that cryptocurrency prices are generally quoted in U.S. dollars, while your actual results also depend on the PKR exchange rate, trading fees, and platform risks.
Conclusion
November 2026 could bring a cryptocurrency recovery, continued consolidation, or another correction. Bitcoin's ability to hold support and break resistance, institutional investment flows, U.S. economic developments, and the performance of major altcoins will help determine the market's direction.
Rather than trying to predict the exact bottom, investors should look for confirmation from price action, volume, and fundamental developments. The best opportunity is not necessarily the coin that has fallen the most, but the one whose recovery case is supported by credible evidence.
Disclaimer: This article is for educational purposes only and is not financial advice. Cryptocurrency investments carry a substantial risk of loss, and no price target or recovery scenario is guaranteed.
#nextmove
#DumpandDump
#BitcoinCore32.1RaisesPeerConnectionLimit
Crypto Market Outlook: What Could Happen in November 2026?
Bitcoin, Altcoins, Market Trends, and Potential Opportunities
Introduction
November 2026 could become an important month for the cryptocurrency market. After a difficult October, investors are watching Bitcoin's price movements, institutional investment flows, U.S. economic policy, and developments in major altcoins to determine whether the market is preparing for a recovery or another period of decline.
However, one important principle remains: a market recovery is possible, but it is not guaranteed. Investors should focus on market data, liquidity, and risk management rather than relying on social media predictions or hype.
1. Bitcoin: The Market's Main Directional Signal
Bitcoin remains the most important cryptocurrency to watch because its movements often influence the wider market.
Recent reporting indicates that Bitcoin spent much of October trading around the $80,000–$85,000 range, while facing pressure from institutional fund outflows and uncertainty over interest rates.
In November, three developments could influence Bitcoin:
Bullish scenario: Renewed institutional demand, stronger ETF inflows, and improving investor confidence could help Bitcoin break above resistance.
Neutral scenario: Bitcoin could continue moving sideways while buyers and sellers compete around important price levels.
Bearish scenario: Persistent selling pressure, tighter financial conditions, or negative economic news could push Bitcoin toward lower support levels.
Investors should watch trading volume, spot Bitcoin ETF flows, and whether Bitcoin can sustain a breakout instead of reacting to a brief price spike.
2. Could Altcoins Recover in November?
Altcoins could benefit if Bitcoin stabilizes and investors become more willing to take risks. However, not every altcoin will necessarily participate in a recovery.
Several projects worth monitoring include:
Ethereum (ETH): Network development, institutional demand, and activity across decentralized finance.
Solana (SOL): Network adoption, application activity, and developments around its ecosystem.
XRP: Regulatory developments, institutional adoption, and payment-related activity.
Chainlink (LINK): Demand for blockchain oracles and tokenization infrastructure.
Avalanche (AVAX): Network adoption, ecosystem growth, and actual usage.
These are assets to research, not guaranteed winners. Their prices can fall even when the wider market is recovering. Smaller cryptocurrencies may offer greater upside in a strong rally, but they also carry higher liquidity, volatility, and project-failure risks.
3. Four Major Factors That Could Move the Market
Interest rates and inflation
Interest-rate expectations are especially important. If investors expect financial conditions to become easier, risk assets may benefit. If inflation remains persistent and monetary policy becomes more restrictive, cryptocurrencies could face additional pressure.
U.S. midterm elections
The U.S. midterm elections on November 3, 2026, may influence expectations surrounding cryptocurrency regulation and future legislation. Nevertheless, election outcomes do not automatically produce a Bitcoin rally.
Institutional investment
ETF inflows and outflows can provide useful evidence of institutional demand. Sustained inflows may support prices, while continued withdrawals can indicate weakening demand.
Market sentiment and liquidity
Fear, leverage, and sudden changes in liquidity can create sharp price movements. Traders should monitor liquidation levels, funding rates, trading volume, and stablecoin liquidity instead of relying exclusively on fear-and-greed indicators.
4. Will November Bring a Bull Run?
There are three reasonable scenarios to consider.
Scenario A — Bullish recovery: Bitcoin breaks above resistance with strong volume and sustained buying. Ethereum and selected altcoins may follow, although performance will vary.
Scenario B — Sideways market: Bitcoin remains range-bound, and altcoins experience short-lived rallies. This environment can be difficult for inexperienced traders because frequent breakouts may fail.
Scenario C — Further correction: Economic uncertainty, weak institutional demand, or excessive leverage triggers additional selling. Smaller altcoins could fall more sharply than Bitcoin.
The most useful approach is to identify what evidence would support each scenario rather than selecting a direction in advance.
5. A Practical Strategy for Small Investors
For investors with limited capital, protecting money is more important than finding a coin that promises to multiply quickly.
Research established assets before considering small-cap tokens.
Avoid investing money needed for household expenses or emergencies.
Consider gradual entries instead of investing the entire amount at once.
Check token unlock schedules, circulating supply, liquidity, and project fundamentals.
Avoid excessive leverage and borrowing to trade.
Define your entry, exit, and maximum acceptable loss before buying.
For investors in Pakistan, remember that cryptocurrency prices are generally quoted in U.S. dollars, while your actual results also depend on the PKR exchange rate, trading fees, and platform risks.
Conclusion
November 2026 could bring a cryptocurrency recovery, continued consolidation, or another correction. Bitcoin's ability to hold support and break resistance, institutional investment flows, U.S. economic developments, and the performance of major altcoins will help determine the market's direction.
Rather than trying to predict the exact bottom, investors should look for confirmation from price action, volume, and fundamental developments. The best opportunity is not necessarily the coin that has fallen the most, but the one whose recovery case is supported by credible evidence.
Disclaimer: This article is for educational purposes only and is not financial advice. Cryptocurrency investments carry a substantial risk of loss, and no price target or recovery scenario is guaranteed.
#nextmove
#DumpandDump
#BitcoinCore32.1RaisesPeerConnectionLimit
96
翻訳参照
#VIRTUALWhale the hidden market mover
#VIRTUALWhale the hidden market mover
158
ログインして、さらにコンテンツを読む
厳選トピックで世界の暗号資産トレーダーの仲間入り
⚡️ 暗号資産に関する最新かつ有益な情報が見つかります。
💬 世界最大の暗号資産取引所から信頼されています。
👍 認証を受けたクリエイターから、有益なインサイトを得られます。
メール / 電話番号
トレンドトピック
UniswapA16zSeekDeFiExemptionFromIllinoisCryptoTax
閲覧回数 38,832
894人が討論中
#CryptoTax 🚨 暗号資産市場・規制動向アップデート #HKDollarStablecoinHKDAPToLaunchOnSolana
#uniswapa16zseekdefiexemptionfromillinoiscryptotax Uniswap、a16z、DeFi Education Fundがイリノイ州の暗号資産税規則に異議
2026年10月30日 | 市場の変動と業界の動向
📊 1. 市場スナップショット
暗号資産市場はまちまちの動きを見せており、一部の資産が大幅に上昇する一方、複数の主要暗号資産は引き続き下落圧力にさらされています。
📈 主な上昇銘柄
SOPH: +60.81% — $0.00238
BEAMX: +37.94% — $0.004701
SKDDB: +16.81% — $9.38
📉 主な下落銘柄
INTWUSDT: −61.09% — $6.72
AKEUSDT: −31.47% — $0.013989
SNXXUSDT: −30.71% — $6.43
🔎 下落圧力にさらされる主要暗号資産
DOGE: −5.06%
PEPE: −4.91%
SUI: −4.83%
NEAR: −3.28%
XRP: −3.13%
Uniswap Labs、Andreessen Horowitz(a16z)、およびDeFi Education Fund(DEF)は、イリノイ州の適用除外を求めています。
#Uniswap #a16z #DeFi #CryptoRegulation #Illinois # #Web3 #BinanceSquare
#HKDollarStablecoinHKDAPToLaunchOnSolana #HKDAP #Stablecoin #CryptoNews #Blockchain #DeFi #DigitalPayments
⚖️ 3. UNISWAP、a16z、イリノイ州の暗号資産税規則
Uniswap Labs、Andreessen Horowitz(a16z)、およびDeFi Education Fundは、イリノイ州で提案されている暗号資産税の要件について、適用除外を求める取り組みに関わっています。
この議論では、重要な問いが浮き彫りになっています。従来型の金融仲介機関のようには運営されていない可能性のある分散型の事業者に、税務報告義務をどのように適用すべきでしょうか。
その結果は、DeFiのコンプライアンス、開発者の義務、そして今後の規制環境に影響を及ぼす可能性があります。
#BinanceSquare #CryptoNews #HKDAP #Stablecoin #Uniswap #a16z #DeFi #CryptoTax
CHASEPA SULUXù
·いいね:2件
·閲覧回数 404
HKDollarStablecoinHKDAPToLaunchOnSolana
閲覧回数 27,329
578人が討論中
$1.5BInLeveragedCryptoBetsLiquidated
閲覧回数 56,487
269人が討論中