
hazikusman
153 投稿

hazikusman
報告
ユーザーをブロック
0 フォロー
7 フォロワー
20 いいね
投稿
·
--
翻訳参照
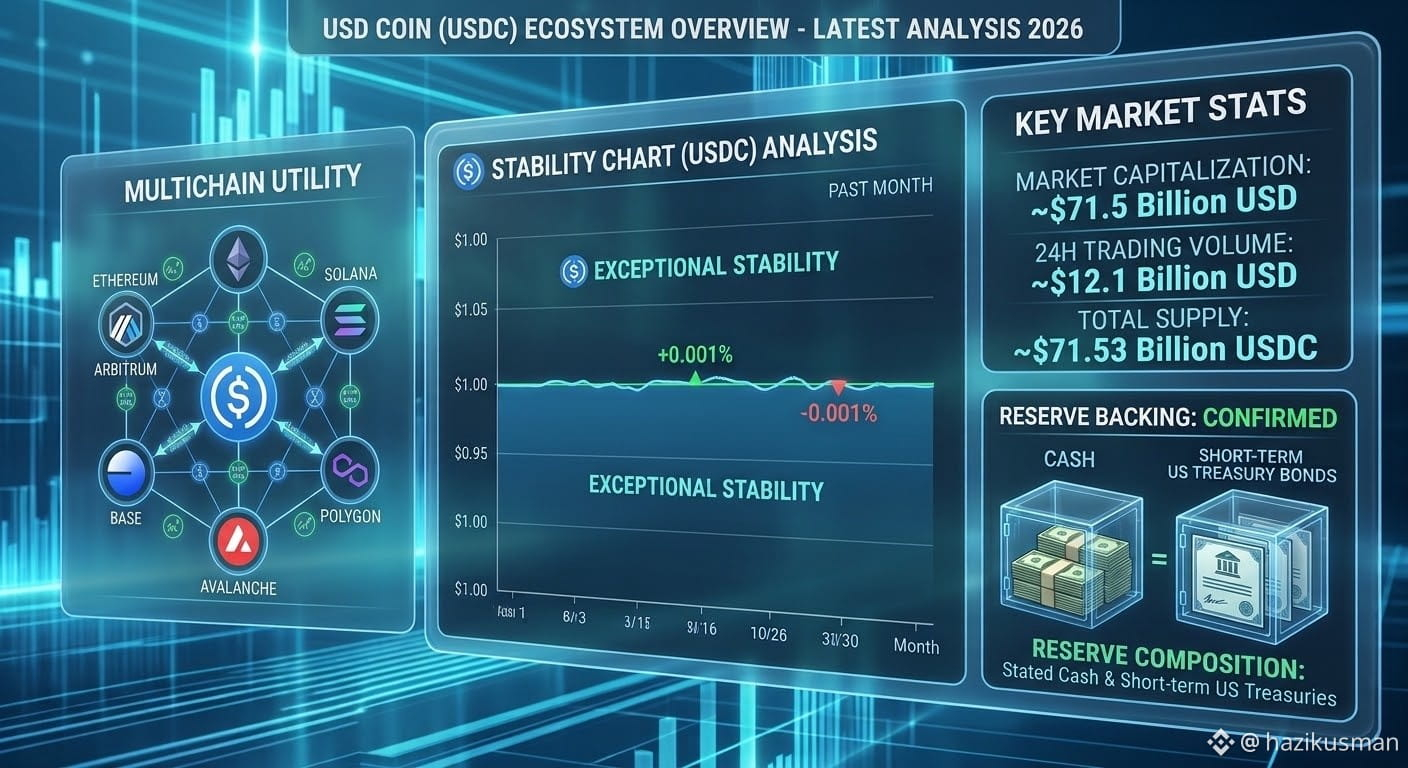
USDC maintains a remarkably stable peg, strictly adhering to the $1.00 USD value with negligible fluctuations. This stability is supported by a significant Market Capitalization, currently circulating at approximately $71.5 Billion USD, making it a vital pillar of liquidity for the entire decentralized finance (DeFi) sector.
Key Technical Pillars:
Fully Backed Reserves: USDC's primary metric of trust is its reserve backing. Monthly attestation reports confirm that USDC is 100% backed by a combination of cash and short-term US Treasury bonds, managed within the US regulatory framework.
Multichain Dominance: USDC has established strong interoperability, moving beyond its Ethereum roots to become a dominant native stablecoin on high-throughput networks like Solana, Polygon, and newer Layer-2 solutions. This cross-chain utility significantly reduces friction and transaction costs for users.
Outlook:
USDC remains the preferred asset for risk-averse institutional market participants and DeFi applications requiring a reliable store of value and unit of account. Future growth is likely to be driven by deeper integrations into traditional payment systems and the continued expansion of real-world asset (RWA) tokenization, where a trusted, stable digital currency is mandatory.
#BinanceSquareTalks #Write2Earn! #USDC
USDC maintains a remarkably stable peg, strictly adhering to the $1.00 USD value with negligible fluctuations. This stability is supported by a significant Market Capitalization, currently circulating at approximately $71.5 Billion USD, making it a vital pillar of liquidity for the entire decentralized finance (DeFi) sector.
Key Technical Pillars:
Fully Backed Reserves: USDC's primary metric of trust is its reserve backing. Monthly attestation reports confirm that USDC is 100% backed by a combination of cash and short-term US Treasury bonds, managed within the US regulatory framework.
Multichain Dominance: USDC has established strong interoperability, moving beyond its Ethereum roots to become a dominant native stablecoin on high-throughput networks like Solana, Polygon, and newer Layer-2 solutions. This cross-chain utility significantly reduces friction and transaction costs for users.
Outlook:
USDC remains the preferred asset for risk-averse institutional market participants and DeFi applications requiring a reliable store of value and unit of account. Future growth is likely to be driven by deeper integrations into traditional payment systems and the continued expansion of real-world asset (RWA) tokenization, where a trusted, stable digital currency is mandatory.
#BinanceSquareTalks #Write2Earn! #USDC
Key Technical Pillars:
Fully Backed Reserves: USDC's primary metric of trust is its reserve backing. Monthly attestation reports confirm that USDC is 100% backed by a combination of cash and short-term US Treasury bonds, managed within the US regulatory framework.
Multichain Dominance: USDC has established strong interoperability, moving beyond its Ethereum roots to become a dominant native stablecoin on high-throughput networks like Solana, Polygon, and newer Layer-2 solutions. This cross-chain utility significantly reduces friction and transaction costs for users.
Outlook:
USDC remains the preferred asset for risk-averse institutional market participants and DeFi applications requiring a reliable store of value and unit of account. Future growth is likely to be driven by deeper integrations into traditional payment systems and the continued expansion of real-world asset (RWA) tokenization, where a trusted, stable digital currency is mandatory.
#BinanceSquareTalks #Write2Earn! #USDC
2
·
--
翻訳参照
$HYPE market is buzzing, and all eyes are back on the "Hype Coins." After a period of consolidation, retail sentiment is exploding, and several assets are flashing massive buy signals. If you are looking for momentum, this is where the action is.
🔍 Latest Market Analysis: What’s Moving?
We are seeing a massive rotation of capital into high-beta altcoins. The formula right now is simple: High Volume + Strong Community Sentiment = Explosive Price Action.
Sentiment Check: The "Fear & Greed Index" is moving towards Extreme Greed for speculative assets. Social media mentions for trending coins are at monthly highs.
Technicals: Many hype assets are breaking out of multiple-week Bull Pennants and Ascending Triangles on the 4H charts. When these charts break resistance with high volume, the moves are swift and violent.
🛡️ The Smart Hype Strategy:
Rule #1: Take Profits Regularly. Hype moves are fast. Do not get greedy. Set laddered profit targets.
Rule #2: Tight Stop-Losses. Protect your capital from the eventual dip. Never trade without a plan.
Rule #3: Confirm Volume. Never chase a pump that doesn't have rising buy volume to support it.
#Hyperium #Write2Earn! #BinanceSquareTalks #besttrader
$HYPE market is buzzing, and all eyes are back on the "Hype Coins." After a period of consolidation, retail sentiment is exploding, and several assets are flashing massive buy signals. If you are looking for momentum, this is where the action is.
🔍 Latest Market Analysis: What’s Moving?
We are seeing a massive rotation of capital into high-beta altcoins. The formula right now is simple: High Volume + Strong Community Sentiment = Explosive Price Action.
Sentiment Check: The "Fear & Greed Index" is moving towards Extreme Greed for speculative assets. Social media mentions for trending coins are at monthly highs.
Technicals: Many hype assets are breaking out of multiple-week Bull Pennants and Ascending Triangles on the 4H charts. When these charts break resistance with high volume, the moves are swift and violent.
🛡️ The Smart Hype Strategy:
Rule #1: Take Profits Regularly. Hype moves are fast. Do not get greedy. Set laddered profit targets.
Rule #2: Tight Stop-Losses. Protect your capital from the eventual dip. Never trade without a plan.
Rule #3: Confirm Volume. Never chase a pump that doesn't have rising buy volume to support it.
#Hyperium #Write2Earn! #BinanceSquareTalks #besttrader
🔍 Latest Market Analysis: What’s Moving?
We are seeing a massive rotation of capital into high-beta altcoins. The formula right now is simple: High Volume + Strong Community Sentiment = Explosive Price Action.
Sentiment Check: The "Fear & Greed Index" is moving towards Extreme Greed for speculative assets. Social media mentions for trending coins are at monthly highs.
Technicals: Many hype assets are breaking out of multiple-week Bull Pennants and Ascending Triangles on the 4H charts. When these charts break resistance with high volume, the moves are swift and violent.
🛡️ The Smart Hype Strategy:
Rule #1: Take Profits Regularly. Hype moves are fast. Do not get greedy. Set laddered profit targets.
Rule #2: Tight Stop-Losses. Protect your capital from the eventual dip. Never trade without a plan.
Rule #3: Confirm Volume. Never chase a pump that doesn't have rising buy volume to support it.
#Hyperium #Write2Earn! #BinanceSquareTalks #besttrader

33
·
--
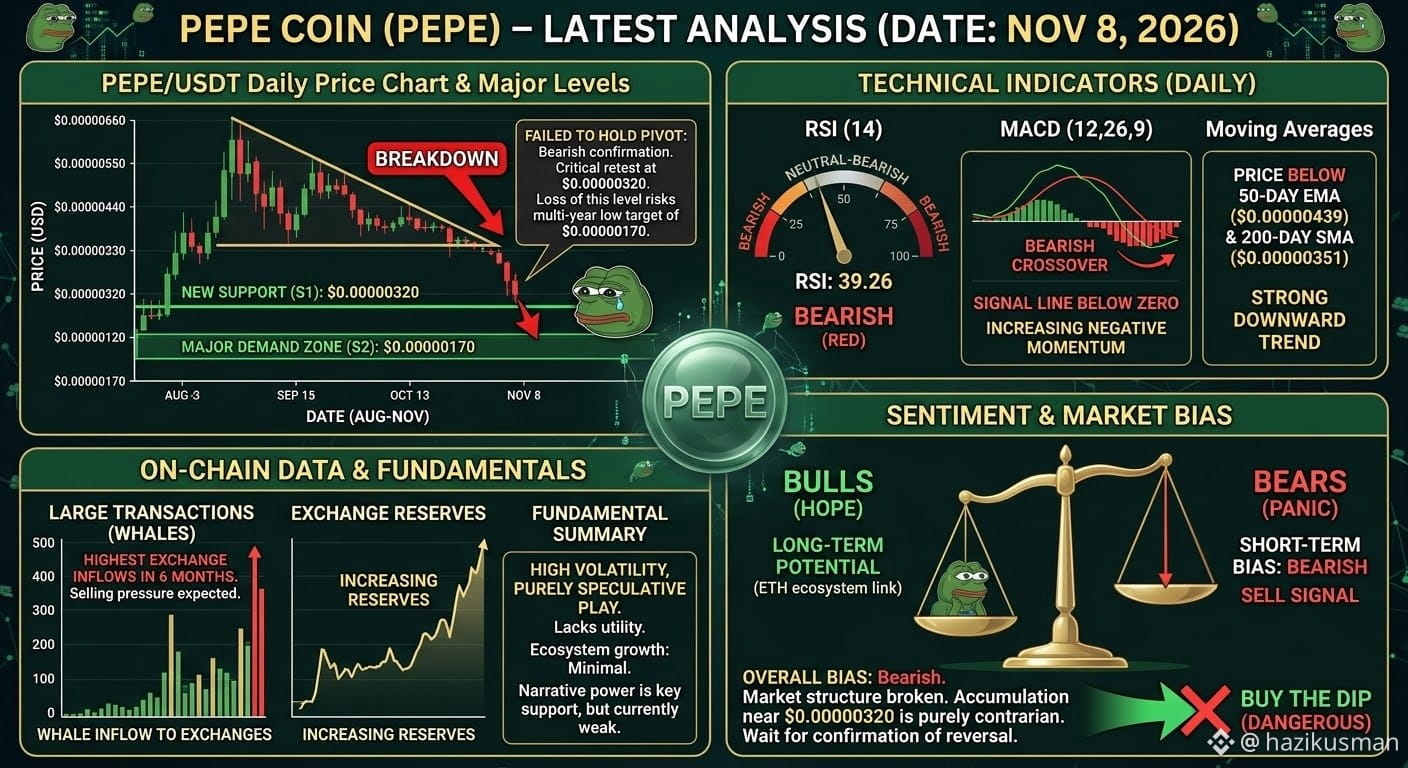
$PEPE は現在、$0.0000048~$0.0000049の範囲で推移しています。直近のレジスタンスは$0.0000053~$0.0000055付近にあります。このゾーンを明確に上抜ければ、$0.0000095にある次のレジスタンス帯に向けて上昇する可能性があります。下値については、主要なサポートが$0.00000405~$0.00000420に形成されています。
移動平均線とトレンド構造:PEPEは、50日EMA($0.00000420)や200日EMA($0.00000388)など、主要な移動平均線を上回る水準を維持しています。短期的な変動はあるものの、中長期的には良好で強気なトレンド構造が保たれています。
モメンタム指標:
RSI(14)は約60.8と中立的な水準にあり、買い意欲が安定している一方で、買われ過ぎの領域には達していません。
MACDはシグナルラインを上回るプラス圏を維持しており、日足の時間軸で強気のモメンタムが続いていることを示しています。
市場の見通し:短期は中立(レンジ相場)、中期は強気。レンジ相場の状況では、$0.0000042のサポート付近での買い集めが有利ですが、市場のボラティリティが高まっているため、リスク管理を徹底する必要があります。
#writetoearn #BinanceSquareFamily #ToptrandingCoin #pepe⚡
$PEPE は現在、$0.0000048~$0.0000049の範囲で推移しています。直近のレジスタンスは$0.0000053~$0.0000055付近にあります。このゾーンを明確に上抜ければ、$0.0000095にある次のレジスタンス帯に向けて上昇する可能性があります。下値については、主要なサポートが$0.00000405~$0.00000420に形成されています。
移動平均線とトレンド構造:PEPEは、50日EMA($0.00000420)や200日EMA($0.00000388)など、主要な移動平均線を上回る水準を維持しています。短期的な変動はあるものの、中長期的には良好で強気なトレンド構造が保たれています。
モメンタム指標:
RSI(14)は約60.8と中立的な水準にあり、買い意欲が安定している一方で、買われ過ぎの領域には達していません。
MACDはシグナルラインを上回るプラス圏を維持しており、日足の時間軸で強気のモメンタムが続いていることを示しています。
市場の見通し:短期は中立(レンジ相場)、中期は強気。レンジ相場の状況では、$0.0000042のサポート付近での買い集めが有利ですが、市場のボラティリティが高まっているため、リスク管理を徹底する必要があります。
#writetoearn #BinanceSquareFamily #ToptrandingCoin #pepe⚡
移動平均線とトレンド構造:PEPEは、50日EMA($0.00000420)や200日EMA($0.00000388)など、主要な移動平均線を上回る水準を維持しています。短期的な変動はあるものの、中長期的には良好で強気なトレンド構造が保たれています。
モメンタム指標:
RSI(14)は約60.8と中立的な水準にあり、買い意欲が安定している一方で、買われ過ぎの領域には達していません。
MACDはシグナルラインを上回るプラス圏を維持しており、日足の時間軸で強気のモメンタムが続いていることを示しています。
市場の見通し:短期は中立(レンジ相場)、中期は強気。レンジ相場の状況では、$0.0000042のサポート付近での買い集めが有利ですが、市場のボラティリティが高まっているため、リスク管理を徹底する必要があります。
#writetoearn #BinanceSquareFamily #ToptrandingCoin #pepe⚡
51
·
--
翻訳参照
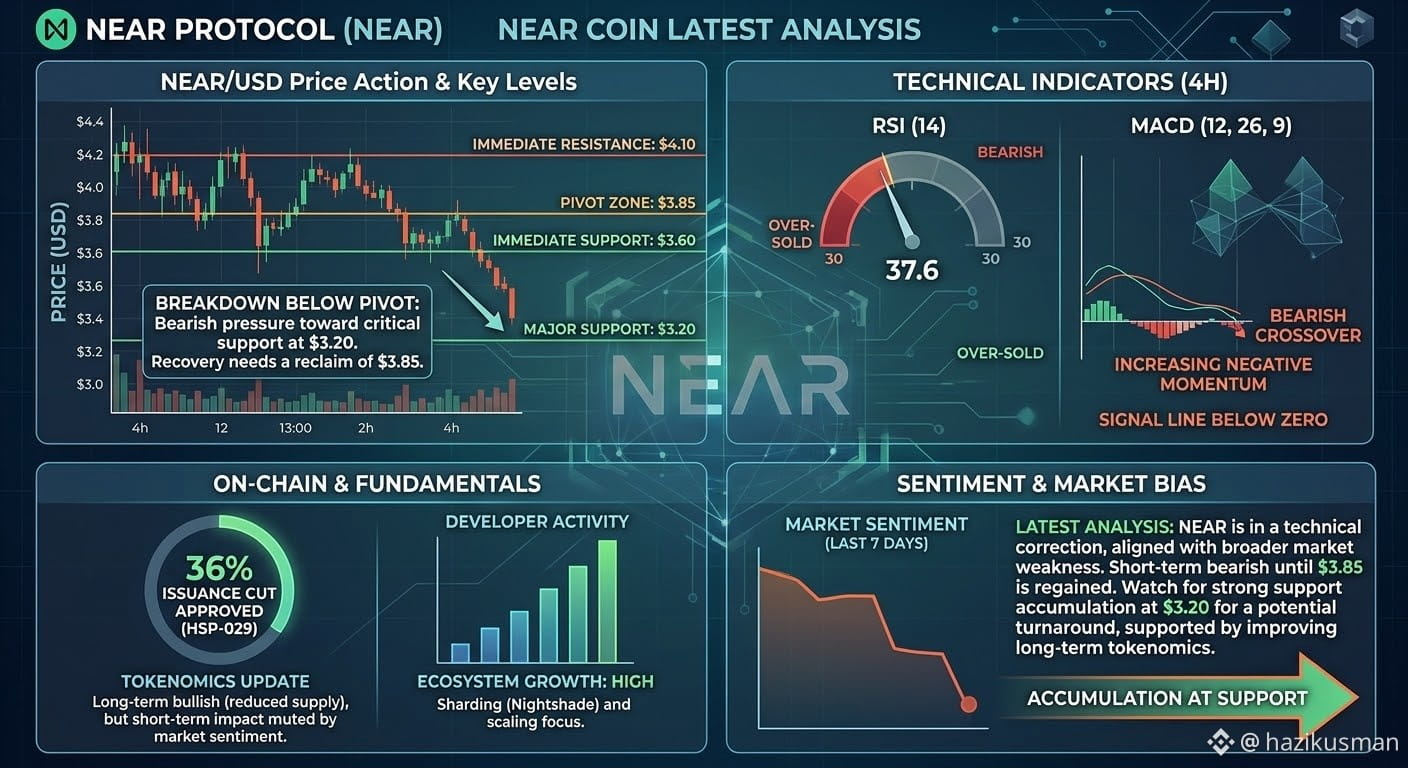
$NEAR has broken below its primary pivot range of $3.85, pulling back toward immediate support around $3.60. A failure to hold $3.60 opens the door for a retest of the strong demand zone at $3.20. Regaining $3.85 is essential to resume a bullish structure toward $4.10+.
Technical Indicators (4H): The 14-period RSI (~37–38) signals approaching over-sold conditions, suggesting momentum may slow down. Meanwhile, the MACD displays a bearish crossover below zero, confirming short-term downward pressure.
Fundamentals & Tokenomics: The approval of HSP-029 (a 36% annual issuance cut) improves long-term supply dynamics, providing strong structural support despite short-term market headwinds.
Market Bias: Neutral to Bearish short-term, Bullish medium-term. Accumulation near the $3.20–$3.60 support range offers potential value for long-term holders.
#besttranding #BinanceSquareTalks
#$NEAR
$NEAR has broken below its primary pivot range of $3.85, pulling back toward immediate support around $3.60. A failure to hold $3.60 opens the door for a retest of the strong demand zone at $3.20. Regaining $3.85 is essential to resume a bullish structure toward $4.10+.
Technical Indicators (4H): The 14-period RSI (~37–38) signals approaching over-sold conditions, suggesting momentum may slow down. Meanwhile, the MACD displays a bearish crossover below zero, confirming short-term downward pressure.
Fundamentals & Tokenomics: The approval of HSP-029 (a 36% annual issuance cut) improves long-term supply dynamics, providing strong structural support despite short-term market headwinds.
Market Bias: Neutral to Bearish short-term, Bullish medium-term. Accumulation near the $3.20–$3.60 support range offers potential value for long-term holders.
#besttranding #BinanceSquareTalks
#$NEAR
Technical Indicators (4H): The 14-period RSI (~37–38) signals approaching over-sold conditions, suggesting momentum may slow down. Meanwhile, the MACD displays a bearish crossover below zero, confirming short-term downward pressure.
Fundamentals & Tokenomics: The approval of HSP-029 (a 36% annual issuance cut) improves long-term supply dynamics, providing strong structural support despite short-term market headwinds.
Market Bias: Neutral to Bearish short-term, Bullish medium-term. Accumulation near the $3.20–$3.60 support range offers potential value for long-term holders.
#besttranding #BinanceSquareTalks
#$NEAR
66
·
--
翻訳参照
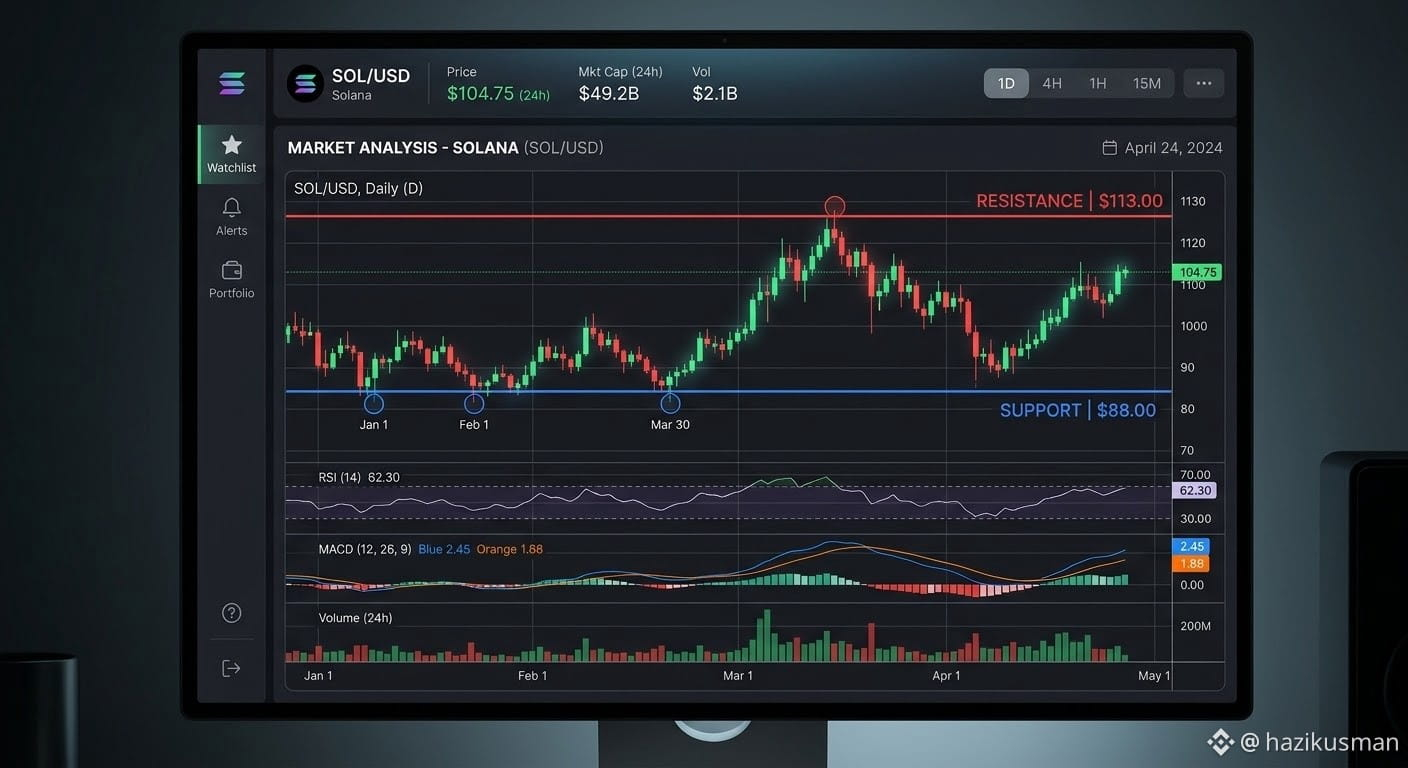
$SOL is trading near $89 - $90, experiencing short-term sell pressure in step with broader crypto market pullbacks. Following a decline over recent weeks, the market structure shows lower high patterns, putting key technical levels under test.
Key Technical Levels
Immediate Support Zone: $87.00 – $88.50 Holding this support floor is critical for buyers to prevent further downside risk toward the $80 psychological level.
Resistance Levels: $98.00 (Short-term) and $113.50 (Major Overhead) Reclaiming the $98 – $100 region is necessary to invalidate the short-term bearish trend and open a path back toward higher range targets around $113.40.
Market Outlook & Drivers
Sentiment: Bearish to neutral in the immediate short term, with 24-hour trading volumes reflecting consolidation rather than aggressive capitulation.
Recovery Forecast: Analysts project a potential baseline recovery into the $104 – $114 range by year-end if SOL consolidates above key moving averages.
#top Solana
#TrendingTopic #BinanceSquareTalks
$SOL is trading near $89 - $90, experiencing short-term sell pressure in step with broader crypto market pullbacks. Following a decline over recent weeks, the market structure shows lower high patterns, putting key technical levels under test.
Key Technical Levels
Immediate Support Zone: $87.00 – $88.50 Holding this support floor is critical for buyers to prevent further downside risk toward the $80 psychological level.
Resistance Levels: $98.00 (Short-term) and $113.50 (Major Overhead) Reclaiming the $98 – $100 region is necessary to invalidate the short-term bearish trend and open a path back toward higher range targets around $113.40.
Market Outlook & Drivers
Sentiment: Bearish to neutral in the immediate short term, with 24-hour trading volumes reflecting consolidation rather than aggressive capitulation.
Recovery Forecast: Analysts project a potential baseline recovery into the $104 – $114 range by year-end if SOL consolidates above key moving averages.
#top Solana
#TrendingTopic #BinanceSquareTalks
Key Technical Levels
Immediate Support Zone: $87.00 – $88.50 Holding this support floor is critical for buyers to prevent further downside risk toward the $80 psychological level.
Resistance Levels: $98.00 (Short-term) and $113.50 (Major Overhead) Reclaiming the $98 – $100 region is necessary to invalidate the short-term bearish trend and open a path back toward higher range targets around $113.40.
Market Outlook & Drivers
Sentiment: Bearish to neutral in the immediate short term, with 24-hour trading volumes reflecting consolidation rather than aggressive capitulation.
Recovery Forecast: Analysts project a potential baseline recovery into the $104 – $114 range by year-end if SOL consolidates above key moving averages.
#top Solana
#TrendingTopic #BinanceSquareTalks
79
·
--
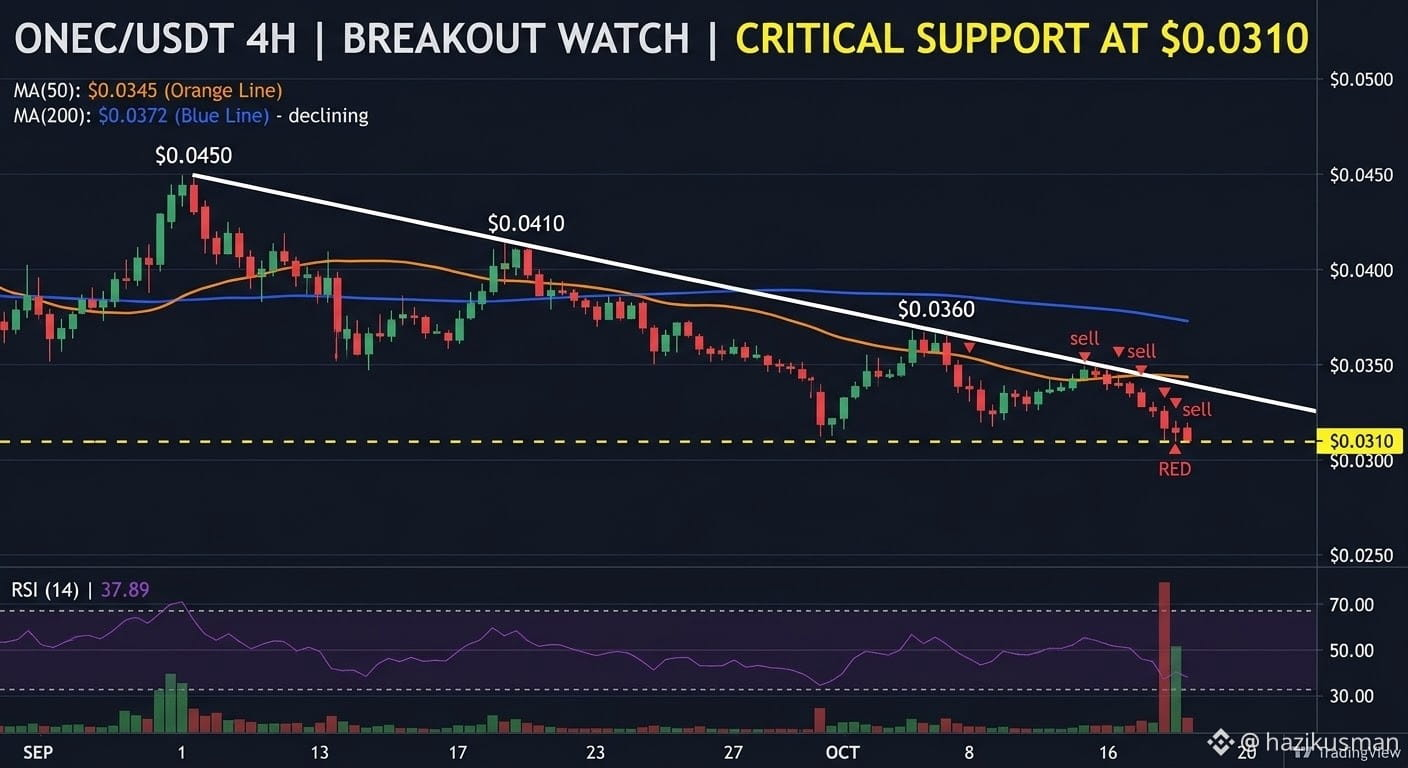
$ONE は約$0.000049~$0.00010で取引されており、時価総額は低く、24時間の取引高も控えめです。全体的な構造は引き続き流動性が低く、一定のレンジ内で推移しています。
主な価格水準:
レジスタンス:直近で上昇が阻まれた水平の供給上限である、$0.00011~$0.00017付近が意識されます。
サポート:目先の需要帯は$0.000045~$0.000085付近です。このゾーンを下回ると、さらに下落が拡大するリスクがあります。
テクニカル指標:
RSIとMACD:長期モメンタム指標は、方向感に乏しい弱気または中立的な状態を示しています。これは、暗号資産市場全体のセンチメントに追随するマイクロキャップ資産によく見られる傾向です。
取引高:日次取引高が低いことから、機関投資家の関与は限られていると考えられます。そのため、単一の注文による価格変動の影響を受けやすい状態です。
$ONE は約$0.000049~$0.00010で取引されており、時価総額は低く、24時間の取引高も控えめです。全体的な構造は引き続き流動性が低く、一定のレンジ内で推移しています。
主な価格水準:
レジスタンス:直近で上昇が阻まれた水平の供給上限である、$0.00011~$0.00017付近が意識されます。
サポート:目先の需要帯は$0.000045~$0.000085付近です。このゾーンを下回ると、さらに下落が拡大するリスクがあります。
テクニカル指標:
RSIとMACD:長期モメンタム指標は、方向感に乏しい弱気または中立的な状態を示しています。これは、暗号資産市場全体のセンチメントに追随するマイクロキャップ資産によく見られる傾向です。
取引高:日次取引高が低いことから、機関投資家の関与は限られていると考えられます。そのため、単一の注文による価格変動の影響を受けやすい状態です。
主な価格水準:
レジスタンス:直近で上昇が阻まれた水平の供給上限である、$0.00011~$0.00017付近が意識されます。
サポート:目先の需要帯は$0.000045~$0.000085付近です。このゾーンを下回ると、さらに下落が拡大するリスクがあります。
テクニカル指標:
RSIとMACD:長期モメンタム指標は、方向感に乏しい弱気または中立的な状態を示しています。これは、暗号資産市場全体のセンチメントに追随するマイクロキャップ資産によく見られる傾向です。
取引高:日次取引高が低いことから、機関投資家の関与は限られていると考えられます。そのため、単一の注文による価格変動の影響を受けやすい状態です。
3
·
--
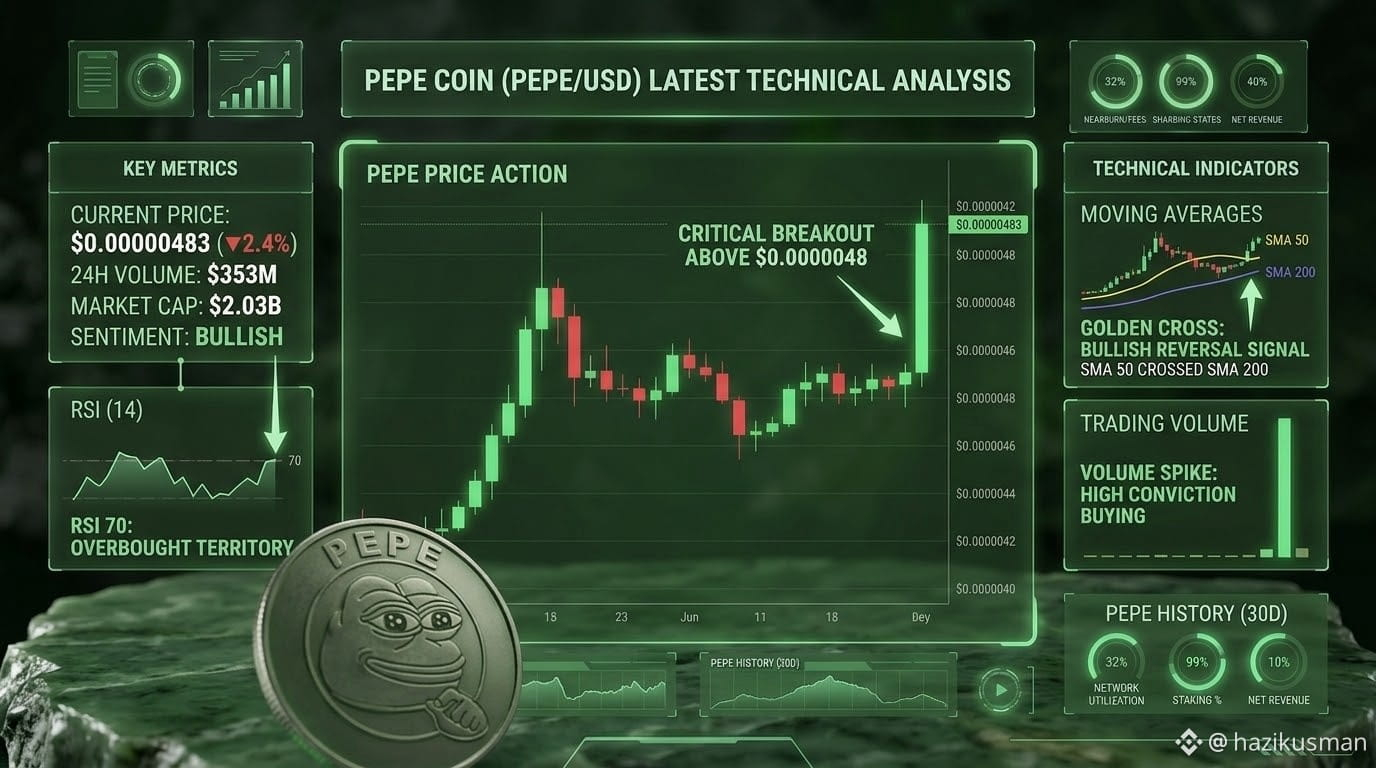
$PEPE (PEPE/USD)は、強い上昇モメンタムを示しています。生成された30日間のテクニカル分析インフォグラフィックは、確立されていた0.0000048ドルのレジスタンス水準を大きく上抜けた重要なブレイクアウトを捉えています。この動きは大幅な買い意欲を呼び起こし、取引高の急増にも表れています。
分析ダッシュボードでは、強気の反転を示す主な指標として、ブレイクアウトの成功と「ゴールデンクロス」の確認を挙げています。これは、50日単純移動平均線(SMA)が200日SMAを上抜けたことを指します。現在の価格は0.00000483ドルで、オンチェーン取引高も353Mドルと高水準にあるため、PEPEの市場心理は明確に強気です。ただし、RSIは70に達しており、短期的には買われ過ぎの領域に入ったことを示しています。そのため、価格がしばらく横ばいになるか、小幅に反落する可能性があります。
$PEPE (PEPE/USD)は、強い上昇モメンタムを示しています。生成された30日間のテクニカル分析インフォグラフィックは、確立されていた0.0000048ドルのレジスタンス水準を大きく上抜けた重要なブレイクアウトを捉えています。この動きは大幅な買い意欲を呼び起こし、取引高の急増にも表れています。
分析ダッシュボードでは、強気の反転を示す主な指標として、ブレイクアウトの成功と「ゴールデンクロス」の確認を挙げています。これは、50日単純移動平均線(SMA)が200日SMAを上抜けたことを指します。現在の価格は0.00000483ドルで、オンチェーン取引高も353Mドルと高水準にあるため、PEPEの市場心理は明確に強気です。ただし、RSIは70に達しており、短期的には買われ過ぎの領域に入ったことを示しています。そのため、価格がしばらく横ばいになるか、小幅に反落する可能性があります。
分析ダッシュボードでは、強気の反転を示す主な指標として、ブレイクアウトの成功と「ゴールデンクロス」の確認を挙げています。これは、50日単純移動平均線(SMA)が200日SMAを上抜けたことを指します。現在の価格は0.00000483ドルで、オンチェーン取引高も353Mドルと高水準にあるため、PEPEの市場心理は明確に強気です。ただし、RSIは70に達しており、短期的には買われ過ぎの領域に入ったことを示しています。そのため、価格がしばらく横ばいになるか、小幅に反落する可能性があります。
5
·
--
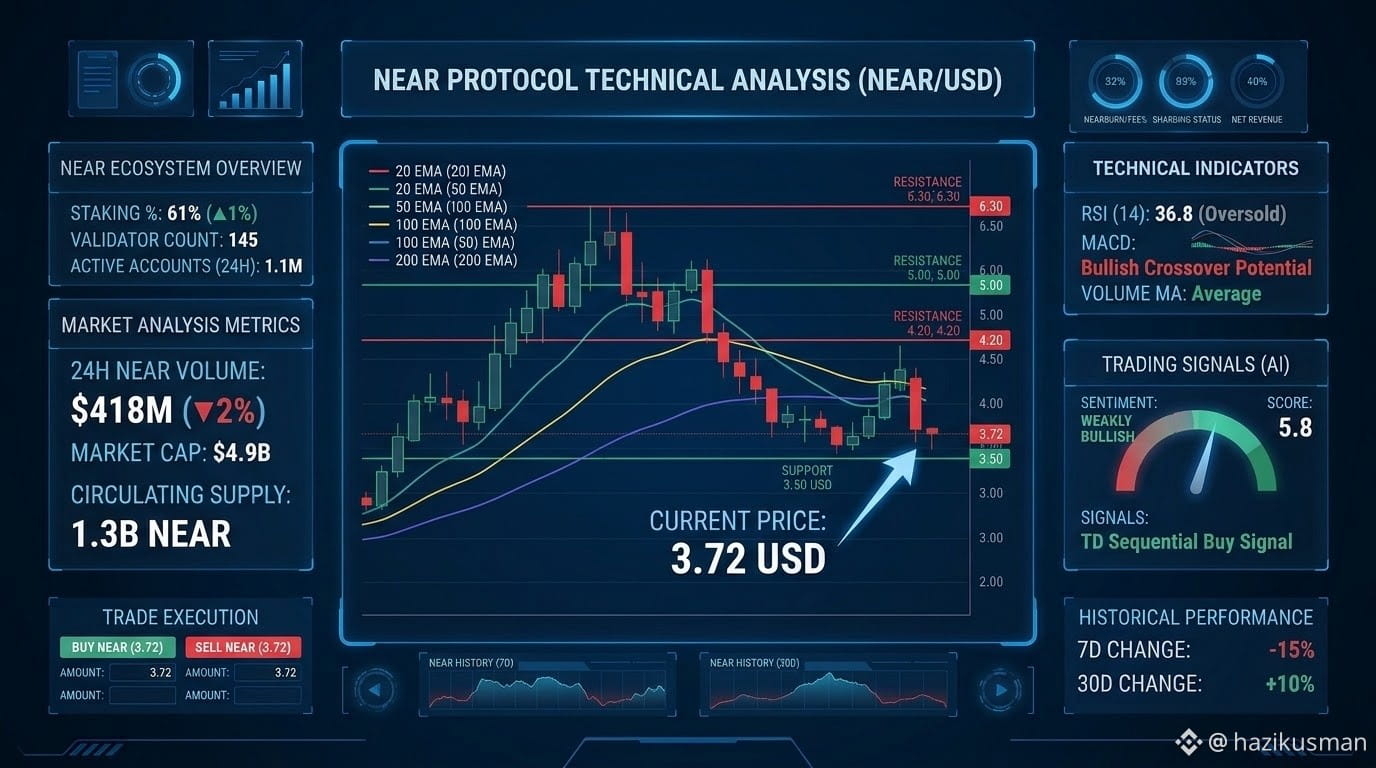
$NEAR は現在、約3.70~3.76米ドルで取引されており、市場全体で最近行われた再テストを経て値固めしています。短期的なマクロ経済の変動により値動きは3.50~3.75米ドルの範囲にとどまっていますが、日足のテクニカル指標には、主要な移動平均線のゴールデンクロスに支えられた強気モメンタムへの転換の初期兆候が見られます。
NEAR Protocol(NEAR/USD)のテクニカル分析チャート。主要なサポート、レジスタンス、テクニカル指標とともに、価格は約3.72米ドルを示しています。(市場データに基づいて生成されたビジュアルモデル)
主要な市場指標とスナップショット
現在価格:約3.72米ドル
24時間取引高:約4億1,000万~4億3,000万米ドル
時価総額:約49億1,000万米ドル(19位)
直近のサポートゾーン:3.50~3.63米ドル
直近のレジスタンスゾーン:3.95~4.20米ドル
テクニカル概要:中立から強気(RSIは36.8付近[売られ過ぎからの回復]、50日EMAは約3.33米ドルで強固な基盤サポートを提供)
重要なポイントと見通し
基盤サポートの防衛:NEARは3.50~3.60米ドルの需要ゾーンを繰り返し守ってきました。この下限を上回って維持することは、主要な上値目標に向けて相場の構造的な強さを保つうえで重要です。
移動平均線の位置:50日EMA(約3.33米ドル)は現在価格を下回る水準でしっかり推移し、明確なトレンドサポートとなっています。一方、200日EMA(約6.32米ドル)は長期的なマクロ環境における主要なレジスタンス目標として機能しています。
エコシステムとAIの追い風:AIネイティブなレイヤー1ブロックチェーンとしてのNEARの位置づけと、機関投資家の継続的な関与が、ユーザーの普及を後押ししています。これにより、より広範な市場の流動性が改善した際の上昇余地を支える、強固なファンダメンタルズ基盤が形成されています。
$NEAR は現在、約3.70~3.76米ドルで取引されており、市場全体で最近行われた再テストを経て値固めしています。短期的なマクロ経済の変動により値動きは3.50~3.75米ドルの範囲にとどまっていますが、日足のテクニカル指標には、主要な移動平均線のゴールデンクロスに支えられた強気モメンタムへの転換の初期兆候が見られます。
NEAR Protocol(NEAR/USD)のテクニカル分析チャート。主要なサポート、レジスタンス、テクニカル指標とともに、価格は約3.72米ドルを示しています。(市場データに基づいて生成されたビジュアルモデル)
主要な市場指標とスナップショット
現在価格:約3.72米ドル
24時間取引高:約4億1,000万~4億3,000万米ドル
時価総額:約49億1,000万米ドル(19位)
直近のサポートゾーン:3.50~3.63米ドル
直近のレジスタンスゾーン:3.95~4.20米ドル
テクニカル概要:中立から強気(RSIは36.8付近[売られ過ぎからの回復]、50日EMAは約3.33米ドルで強固な基盤サポートを提供)
重要なポイントと見通し
基盤サポートの防衛:NEARは3.50~3.60米ドルの需要ゾーンを繰り返し守ってきました。この下限を上回って維持することは、主要な上値目標に向けて相場の構造的な強さを保つうえで重要です。
移動平均線の位置:50日EMA(約3.33米ドル)は現在価格を下回る水準でしっかり推移し、明確なトレンドサポートとなっています。一方、200日EMA(約6.32米ドル)は長期的なマクロ環境における主要なレジスタンス目標として機能しています。
エコシステムとAIの追い風:AIネイティブなレイヤー1ブロックチェーンとしてのNEARの位置づけと、機関投資家の継続的な関与が、ユーザーの普及を後押ししています。これにより、より広範な市場の流動性が改善した際の上昇余地を支える、強固なファンダメンタルズ基盤が形成されています。
NEAR Protocol(NEAR/USD)のテクニカル分析チャート。主要なサポート、レジスタンス、テクニカル指標とともに、価格は約3.72米ドルを示しています。(市場データに基づいて生成されたビジュアルモデル)
主要な市場指標とスナップショット
現在価格:約3.72米ドル
24時間取引高:約4億1,000万~4億3,000万米ドル
時価総額:約49億1,000万米ドル(19位)
直近のサポートゾーン:3.50~3.63米ドル
直近のレジスタンスゾーン:3.95~4.20米ドル
テクニカル概要:中立から強気(RSIは36.8付近[売られ過ぎからの回復]、50日EMAは約3.33米ドルで強固な基盤サポートを提供)
重要なポイントと見通し
基盤サポートの防衛:NEARは3.50~3.60米ドルの需要ゾーンを繰り返し守ってきました。この下限を上回って維持することは、主要な上値目標に向けて相場の構造的な強さを保つうえで重要です。
移動平均線の位置:50日EMA(約3.33米ドル)は現在価格を下回る水準でしっかり推移し、明確なトレンドサポートとなっています。一方、200日EMA(約6.32米ドル)は長期的なマクロ環境における主要なレジスタンス目標として機能しています。
エコシステムとAIの追い風:AIネイティブなレイヤー1ブロックチェーンとしてのNEARの位置づけと、機関投資家の継続的な関与が、ユーザーの普及を後押ししています。これにより、より広範な市場の流動性が改善した際の上昇余地を支える、強固なファンダメンタルズ基盤が形成されています。
6
·
--
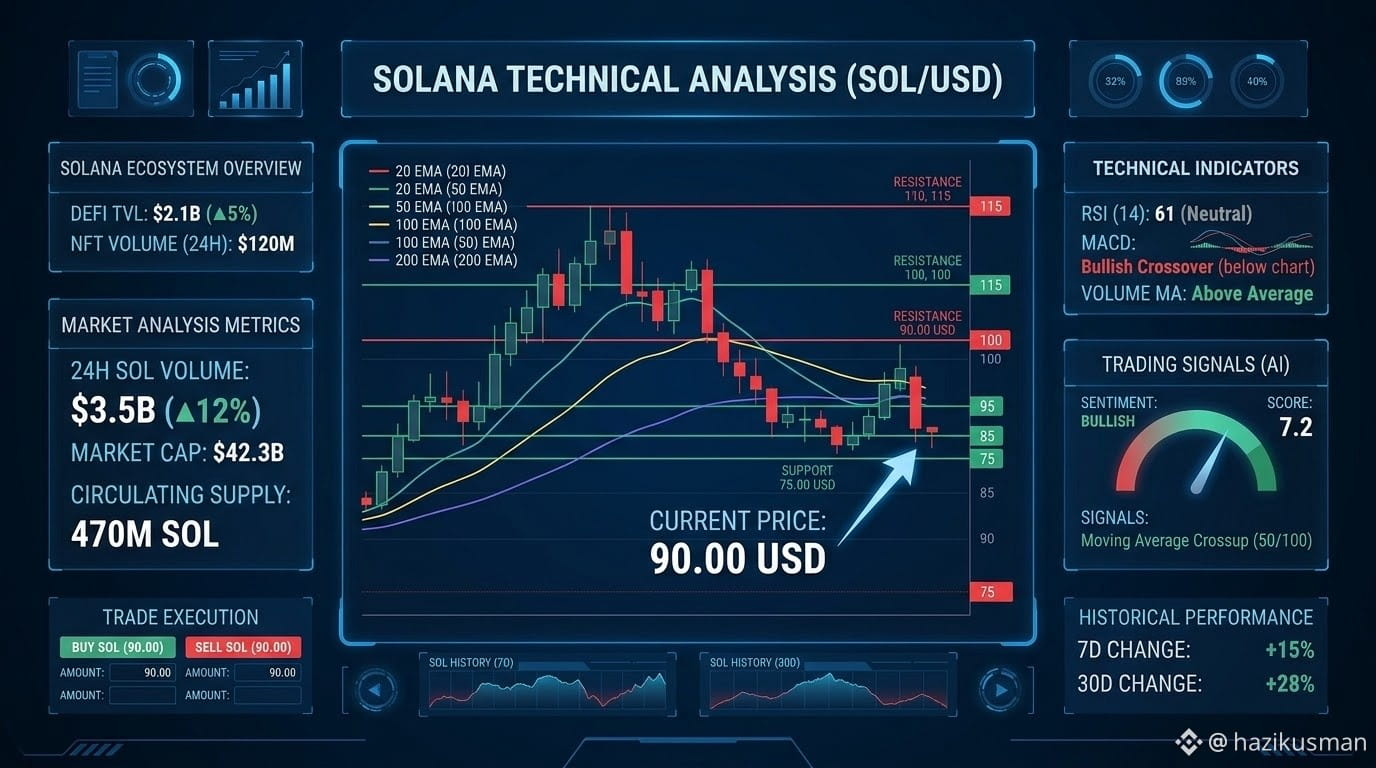
$SOL は、市場のボラティリティが高まるなか、現在、重要な構造的節目を試しています。89~90ドルのレンジ付近まで下落した後、資産価格は長期の主要移動平均線のすぐ近くで推移しています。
現在価格:約89.00~90.50米ドル
200日移動平均線:約88.90ドル(主要なマクロサポートとして機能)
直近のサポートゾーン:87.50~89.00ドル
主なレジスタンス水準:95.50ドル(短期的な壁)、98.70ドル(100日移動平均線)
50日移動平均線:約108.60ドル(トレンドの構造的な反転に必要)
主なポイントと見通し
200日移動平均線の攻防:ソラナは88.90ドル付近の200日移動平均線を積極的に試しています。このゾーンを維持することは、77.00ドルの二次サポートに向けたさらなる下落を防ぐうえで、強気派にとって不可欠です。
オンチェーンのファンダメンタルズ:最近の市場全体の清算やETFからの資金流出が現物市場の勢いに影響しているにもかかわらず、時価総額に対する分散型取引所(DEX)の取引高は堅調で、ネットワークへの参加も高水準を維持しています。
トレーダーの注目点:98.70ドル(100日移動平均線)を上回って日足を終えれば、100ドル超の水準に向けた強気転換を示す、初の具体的なテクニカルシグナルとなるでしょう。
$SOL は、市場のボラティリティが高まるなか、現在、重要な構造的節目を試しています。89~90ドルのレンジ付近まで下落した後、資産価格は長期の主要移動平均線のすぐ近くで推移しています。
現在価格:約89.00~90.50米ドル
200日移動平均線:約88.90ドル(主要なマクロサポートとして機能)
直近のサポートゾーン:87.50~89.00ドル
主なレジスタンス水準:95.50ドル(短期的な壁)、98.70ドル(100日移動平均線)
50日移動平均線:約108.60ドル(トレンドの構造的な反転に必要)
主なポイントと見通し
200日移動平均線の攻防:ソラナは88.90ドル付近の200日移動平均線を積極的に試しています。このゾーンを維持することは、77.00ドルの二次サポートに向けたさらなる下落を防ぐうえで、強気派にとって不可欠です。
オンチェーンのファンダメンタルズ:最近の市場全体の清算やETFからの資金流出が現物市場の勢いに影響しているにもかかわらず、時価総額に対する分散型取引所(DEX)の取引高は堅調で、ネットワークへの参加も高水準を維持しています。
トレーダーの注目点:98.70ドル(100日移動平均線)を上回って日足を終えれば、100ドル超の水準に向けた強気転換を示す、初の具体的なテクニカルシグナルとなるでしょう。
現在価格:約89.00~90.50米ドル
200日移動平均線:約88.90ドル(主要なマクロサポートとして機能)
直近のサポートゾーン:87.50~89.00ドル
主なレジスタンス水準:95.50ドル(短期的な壁)、98.70ドル(100日移動平均線)
50日移動平均線:約108.60ドル(トレンドの構造的な反転に必要)
主なポイントと見通し
200日移動平均線の攻防:ソラナは88.90ドル付近の200日移動平均線を積極的に試しています。このゾーンを維持することは、77.00ドルの二次サポートに向けたさらなる下落を防ぐうえで、強気派にとって不可欠です。
オンチェーンのファンダメンタルズ:最近の市場全体の清算やETFからの資金流出が現物市場の勢いに影響しているにもかかわらず、時価総額に対する分散型取引所(DEX)の取引高は堅調で、ネットワークへの参加も高水準を維持しています。
トレーダーの注目点:98.70ドル(100日移動平均線)を上回って日足を終えれば、100ドル超の水準に向けた強気転換を示す、初の具体的なテクニカルシグナルとなるでしょう。
·
--
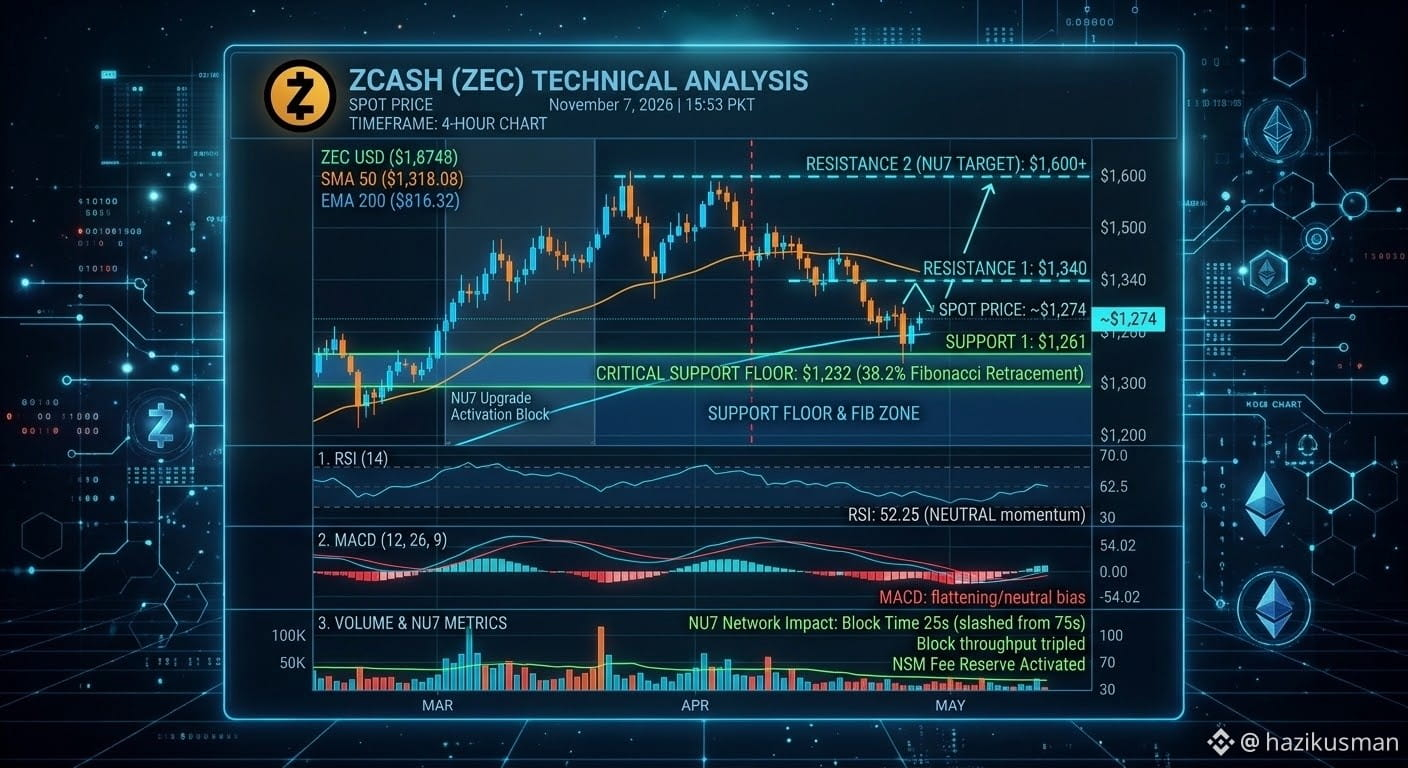
$ZEC は現在1,261~1,287ドル付近で取引されており、ネットワークの大型アップグレード「NU7」の展開に伴う変動や、市場全体での清算を受けた後、短期的な調整局面にあります。目先の利益確定が進む一方で、ZECは数か月にわたる堅調な相場構造を維持しています。現物ETP/ETF商品の枠組みを含む機関投資家の関心や、NU7の稼働によるブロックタイムの短縮が、その支えとなっています。
NU7ネットワークアップグレード:今回のアップグレードは無事に稼働し、ブロックの承認時間を25秒に短縮するとともに、ネットワーク持続可能性メカニズムを導入しました。移行に伴う小規模な議論はあるものの、長期的なファンダメンタルズを強く支える追い風となっています。
機関投資家の動向:プライバシーに特化したETP/ETF商品を通じて規制下での認知度が高まっており、ZECはレイヤー1のプライバシー資産の中でも独自の位置を築いています。
強気シナリオ:1,261ドルのサポートゾーンを維持できれば、1,340ドルを再び上抜ける展開が視野に入り、数週間ぶりの高値である1,600ドル超の再試しに向けた明確な道筋が開けます。
弱気シナリオ:日足終値が1,230ドルを明確に下回ると、1,180ドル付近にある、より深いフィボナッチ・サポート水準まで調整が長引くリスクがあります。
$ZEC は現在1,261~1,287ドル付近で取引されており、ネットワークの大型アップグレード「NU7」の展開に伴う変動や、市場全体での清算を受けた後、短期的な調整局面にあります。目先の利益確定が進む一方で、ZECは数か月にわたる堅調な相場構造を維持しています。現物ETP/ETF商品の枠組みを含む機関投資家の関心や、NU7の稼働によるブロックタイムの短縮が、その支えとなっています。
NU7ネットワークアップグレード:今回のアップグレードは無事に稼働し、ブロックの承認時間を25秒に短縮するとともに、ネットワーク持続可能性メカニズムを導入しました。移行に伴う小規模な議論はあるものの、長期的なファンダメンタルズを強く支える追い風となっています。
機関投資家の動向:プライバシーに特化したETP/ETF商品を通じて規制下での認知度が高まっており、ZECはレイヤー1のプライバシー資産の中でも独自の位置を築いています。
強気シナリオ:1,261ドルのサポートゾーンを維持できれば、1,340ドルを再び上抜ける展開が視野に入り、数週間ぶりの高値である1,600ドル超の再試しに向けた明確な道筋が開けます。
弱気シナリオ:日足終値が1,230ドルを明確に下回ると、1,180ドル付近にある、より深いフィボナッチ・サポート水準まで調整が長引くリスクがあります。
NU7ネットワークアップグレード:今回のアップグレードは無事に稼働し、ブロックの承認時間を25秒に短縮するとともに、ネットワーク持続可能性メカニズムを導入しました。移行に伴う小規模な議論はあるものの、長期的なファンダメンタルズを強く支える追い風となっています。
機関投資家の動向:プライバシーに特化したETP/ETF商品を通じて規制下での認知度が高まっており、ZECはレイヤー1のプライバシー資産の中でも独自の位置を築いています。
強気シナリオ:1,261ドルのサポートゾーンを維持できれば、1,340ドルを再び上抜ける展開が視野に入り、数週間ぶりの高値である1,600ドル超の再試しに向けた明確な道筋が開けます。
弱気シナリオ:日足終値が1,230ドルを明確に下回ると、1,180ドル付近にある、より深いフィボナッチ・サポート水準まで調整が長引くリスクがあります。
30
·
--
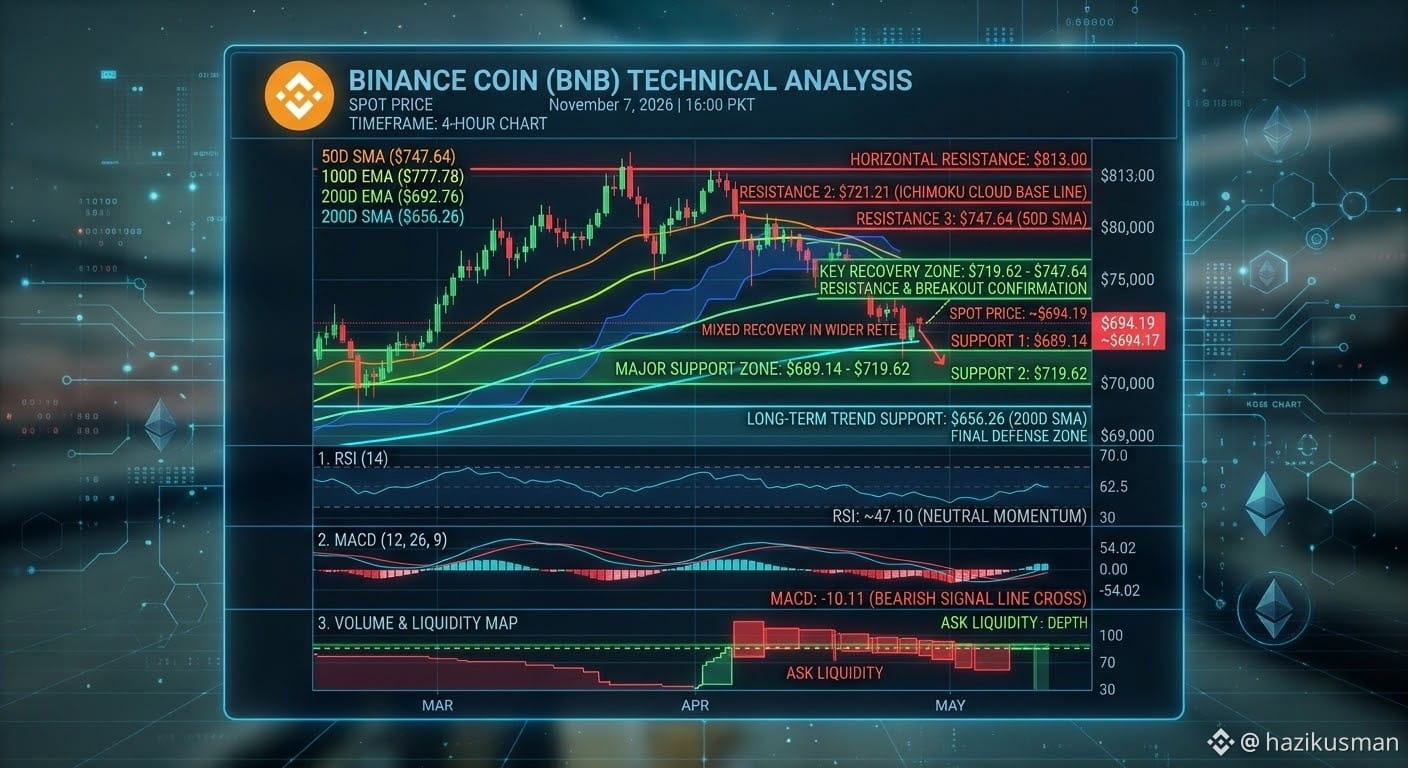
$BNB は現在、複雑な技術的環境の中で重要な局面を迎えています。2026年11月7日時点で、価格は重要な広範な需要ゾーンを試す一方、トレンドに基づく複数の抵抗帯に直面しており、「勝負の分かれ目」となる状況です。
分析の結論と見通し
BNBの価格構造は、頭上に強い抵抗があることが特徴です。中立的な回復を試みるには、まず直近の上値抵抗である692.76ドル(200日EMA)を突破する必要があります。それまでは、右肩下がりの抵抗線が連なる展開が優勢です。
強気シナリオ:強気の回復に向けて800ドル超を目指すには、複数段階の抵抗帯(721.21ドルまでの一目均衡表の雲と50日SMA)を、出来高を伴って明確に上抜けて終値をつける必要があります。
弱気シナリオ:BNBが現在の692.76ドルで反落し、689.14ドルにある広範なサポートゾーンを下抜けた場合、長期的な最後の防衛線である656.26ドルを目指す可能性が高いでしょう。
$BNB は現在、複雑な技術的環境の中で重要な局面を迎えています。2026年11月7日時点で、価格は重要な広範な需要ゾーンを試す一方、トレンドに基づく複数の抵抗帯に直面しており、「勝負の分かれ目」となる状況です。
分析の結論と見通し
BNBの価格構造は、頭上に強い抵抗があることが特徴です。中立的な回復を試みるには、まず直近の上値抵抗である692.76ドル(200日EMA)を突破する必要があります。それまでは、右肩下がりの抵抗線が連なる展開が優勢です。
強気シナリオ:強気の回復に向けて800ドル超を目指すには、複数段階の抵抗帯(721.21ドルまでの一目均衡表の雲と50日SMA)を、出来高を伴って明確に上抜けて終値をつける必要があります。
弱気シナリオ:BNBが現在の692.76ドルで反落し、689.14ドルにある広範なサポートゾーンを下抜けた場合、長期的な最後の防衛線である656.26ドルを目指す可能性が高いでしょう。
分析の結論と見通し
BNBの価格構造は、頭上に強い抵抗があることが特徴です。中立的な回復を試みるには、まず直近の上値抵抗である692.76ドル(200日EMA)を突破する必要があります。それまでは、右肩下がりの抵抗線が連なる展開が優勢です。
強気シナリオ:強気の回復に向けて800ドル超を目指すには、複数段階の抵抗帯(721.21ドルまでの一目均衡表の雲と50日SMA)を、出来高を伴って明確に上抜けて終値をつける必要があります。
弱気シナリオ:BNBが現在の692.76ドルで反落し、689.14ドルにある広範なサポートゾーンを下抜けた場合、長期的な最後の防衛線である656.26ドルを目指す可能性が高いでしょう。
43
·
--
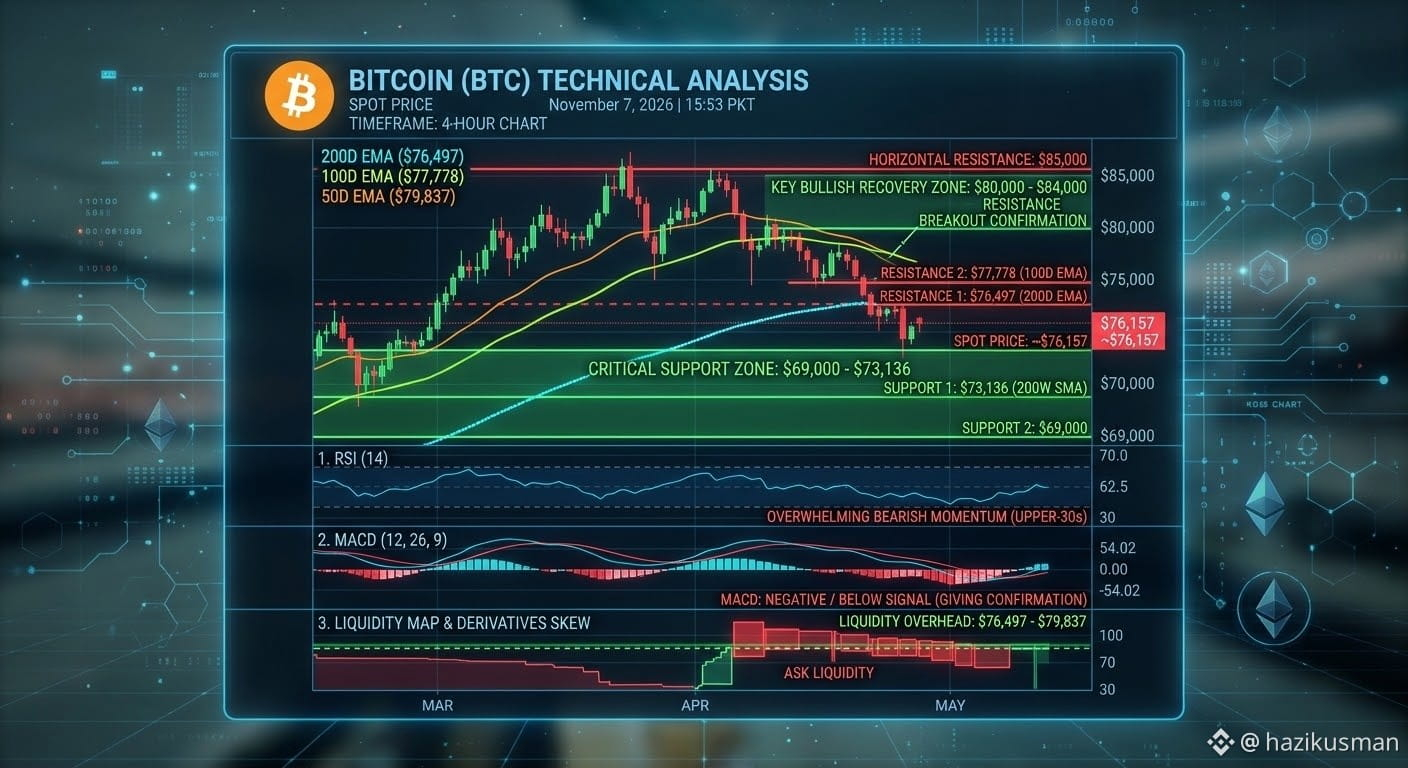
$BTC は重要な移動平均線の密集帯を下回って取引を終え、大きなトレンド転換の局面にあります。これは、短期的な弱気バイアスが再び強まったことを示しています。現在の相場環境で最も顕著なのは、中長期のトレンドに対する強い上値抵抗が密集していることで、最近の戻りを抑えてきました。
分析の結論と見通し
短期的に市場構造は崩れています。EMAの密集帯($76,497~$79,837)は現在、強い上値抵抗として機能しており、大きな出来高を伴うブレイクアウトが起きない限り、上昇は抑えられる可能性が高いことを示唆しています。
強気シナリオ:弱気バイアスを覆すには、まずBTCが200日EMAの$76,497を回復し、その水準を上回って定着する必要があります。水平抵抗線の$85,000を上回って日足が引ければ、より広い高ボラティリティのレンジに戻る可能性を示すでしょう。
弱気シナリオ(現在優勢):BTCがEMAの密集帯を下回っている限り、トレンドは調整局面の継続を示唆しています。すぐ下に水平サポートが見当たらないため、下落すれば、現在値を大きく下回る未確定の新たな底値を探る可能性が高いでしょう。戻り局面も不安定です。
$BTC は重要な移動平均線の密集帯を下回って取引を終え、大きなトレンド転換の局面にあります。これは、短期的な弱気バイアスが再び強まったことを示しています。現在の相場環境で最も顕著なのは、中長期のトレンドに対する強い上値抵抗が密集していることで、最近の戻りを抑えてきました。
分析の結論と見通し
短期的に市場構造は崩れています。EMAの密集帯($76,497~$79,837)は現在、強い上値抵抗として機能しており、大きな出来高を伴うブレイクアウトが起きない限り、上昇は抑えられる可能性が高いことを示唆しています。
強気シナリオ:弱気バイアスを覆すには、まずBTCが200日EMAの$76,497を回復し、その水準を上回って定着する必要があります。水平抵抗線の$85,000を上回って日足が引ければ、より広い高ボラティリティのレンジに戻る可能性を示すでしょう。
弱気シナリオ(現在優勢):BTCがEMAの密集帯を下回っている限り、トレンドは調整局面の継続を示唆しています。すぐ下に水平サポートが見当たらないため、下落すれば、現在値を大きく下回る未確定の新たな底値を探る可能性が高いでしょう。戻り局面も不安定です。
分析の結論と見通し
短期的に市場構造は崩れています。EMAの密集帯($76,497~$79,837)は現在、強い上値抵抗として機能しており、大きな出来高を伴うブレイクアウトが起きない限り、上昇は抑えられる可能性が高いことを示唆しています。
強気シナリオ:弱気バイアスを覆すには、まずBTCが200日EMAの$76,497を回復し、その水準を上回って定着する必要があります。水平抵抗線の$85,000を上回って日足が引ければ、より広い高ボラティリティのレンジに戻る可能性を示すでしょう。
弱気シナリオ(現在優勢):BTCがEMAの密集帯を下回っている限り、トレンドは調整局面の継続を示唆しています。すぐ下に水平サポートが見当たらないため、下落すれば、現在値を大きく下回る未確定の新たな底値を探る可能性が高いでしょう。戻り局面も不安定です。
57
·
--
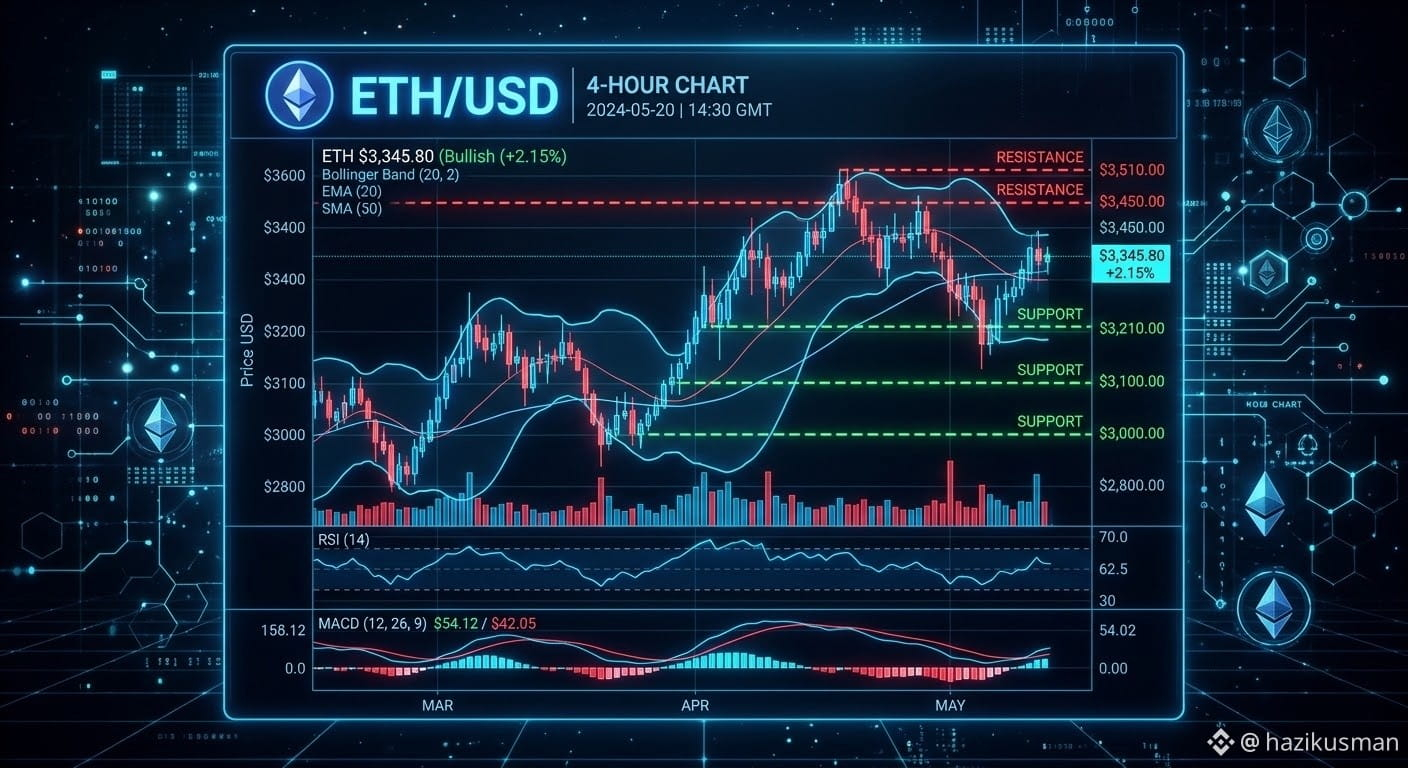
$ETH は現在2,225~2,250ドル付近で推移しており、以前の高値水準を試した後の押し戻しを経て、持ち合いゾーンを形成しています。時価総額は約2,740億ドルで、スマートコントラクト・プラットフォームの首位、時価総額で第2位の暗号資産としての地位を維持しています。
主な要因と見通し
レイヤー2の拡大とステーキング:プロトコルの活動が安定し、取引の摩擦が軽減されていることを背景に、レイヤー2ソリューション上のネットワーク活動は健全な状態を保っています。
マクロ経済の逆風と利回り:暗号資産価格は、米国債利回りの変動や、より広範なマクロ経済の金利見通しに引き続き強く左右されています。
強気シナリオ:2,500~2,550ドルのレジスタンス帯を明確に上抜け、日足終値でその水準を維持できれば、2,700ドル超を再び試す道が開けるでしょう。
弱気シナリオ:重要なサポートである2,150ドルを下回ると、持ち合いが長期化し、心理的節目の2,000ドル付近まで下落するリスクがあります。
$ETH は現在2,225~2,250ドル付近で推移しており、以前の高値水準を試した後の押し戻しを経て、持ち合いゾーンを形成しています。時価総額は約2,740億ドルで、スマートコントラクト・プラットフォームの首位、時価総額で第2位の暗号資産としての地位を維持しています。
主な要因と見通し
レイヤー2の拡大とステーキング:プロトコルの活動が安定し、取引の摩擦が軽減されていることを背景に、レイヤー2ソリューション上のネットワーク活動は健全な状態を保っています。
マクロ経済の逆風と利回り:暗号資産価格は、米国債利回りの変動や、より広範なマクロ経済の金利見通しに引き続き強く左右されています。
強気シナリオ:2,500~2,550ドルのレジスタンス帯を明確に上抜け、日足終値でその水準を維持できれば、2,700ドル超を再び試す道が開けるでしょう。
弱気シナリオ:重要なサポートである2,150ドルを下回ると、持ち合いが長期化し、心理的節目の2,000ドル付近まで下落するリスクがあります。
主な要因と見通し
レイヤー2の拡大とステーキング:プロトコルの活動が安定し、取引の摩擦が軽減されていることを背景に、レイヤー2ソリューション上のネットワーク活動は健全な状態を保っています。
マクロ経済の逆風と利回り:暗号資産価格は、米国債利回りの変動や、より広範なマクロ経済の金利見通しに引き続き強く左右されています。
強気シナリオ:2,500~2,550ドルのレジスタンス帯を明確に上抜け、日足終値でその水準を維持できれば、2,700ドル超を再び試す道が開けるでしょう。
弱気シナリオ:重要なサポートである2,150ドルを下回ると、持ち合いが長期化し、心理的節目の2,000ドル付近まで下落するリスクがあります。
64
·
--
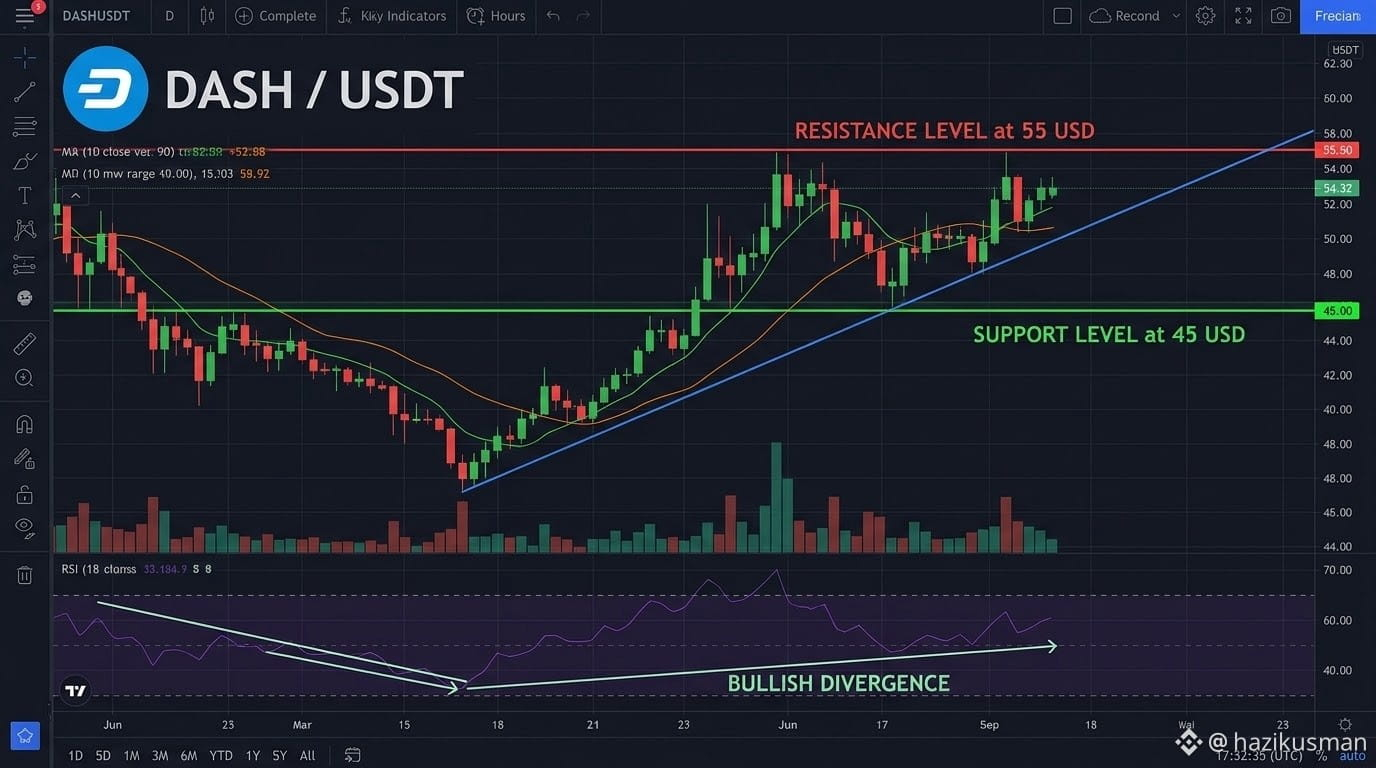
$DASH は、45.00~55.00ドルのレンジ内で広範な持ち合い局面を引き続き推移しています。価格は現在、重要なサポート付近で反応しており、短期的な暗号資産市場の下落圧力と主要なテクニカル防衛ゾーンの間で均衡しています。
重要なテクニカル分析
直近のサポートゾーン(41.00~45.00ドル):45.00ドルは、現在の構造を支える主要な下限として機能しています。41.00ドルを持続的に下回ると、数カ月ぶりの安値に向けて下落リスクが高まります。
主要なレジスタンスゾーン(55.00~60.00ドル):強気派は55.00~60.00ドル付近にある大きな上値抵抗に直面しています。中期的な上昇トレンドの継続を確認するには、強い出来高を伴ってこのゾーンを突破する必要があります。
チャートパターンとモメンタム:短期の時間足(4時間足/8時間足)では、下限付近を試す動きに、上昇トレンドラインに沿った強気のRSIダイバージェンスの兆候が見られます。このトレンドラインを維持することが、レンジ上限の再試行に向けて重要です。
市場センチメント:45.00ドルを上回っている限り、中立から慎重な強気です。65.00ドルに向けた上昇の拡大を見込む前に、55.00ドルを明確に上抜けるのを待ちましょう。
$DASH は、45.00~55.00ドルのレンジ内で広範な持ち合い局面を引き続き推移しています。価格は現在、重要なサポート付近で反応しており、短期的な暗号資産市場の下落圧力と主要なテクニカル防衛ゾーンの間で均衡しています。
重要なテクニカル分析
直近のサポートゾーン(41.00~45.00ドル):45.00ドルは、現在の構造を支える主要な下限として機能しています。41.00ドルを持続的に下回ると、数カ月ぶりの安値に向けて下落リスクが高まります。
主要なレジスタンスゾーン(55.00~60.00ドル):強気派は55.00~60.00ドル付近にある大きな上値抵抗に直面しています。中期的な上昇トレンドの継続を確認するには、強い出来高を伴ってこのゾーンを突破する必要があります。
チャートパターンとモメンタム:短期の時間足(4時間足/8時間足)では、下限付近を試す動きに、上昇トレンドラインに沿った強気のRSIダイバージェンスの兆候が見られます。このトレンドラインを維持することが、レンジ上限の再試行に向けて重要です。
市場センチメント:45.00ドルを上回っている限り、中立から慎重な強気です。65.00ドルに向けた上昇の拡大を見込む前に、55.00ドルを明確に上抜けるのを待ちましょう。
重要なテクニカル分析
直近のサポートゾーン(41.00~45.00ドル):45.00ドルは、現在の構造を支える主要な下限として機能しています。41.00ドルを持続的に下回ると、数カ月ぶりの安値に向けて下落リスクが高まります。
主要なレジスタンスゾーン(55.00~60.00ドル):強気派は55.00~60.00ドル付近にある大きな上値抵抗に直面しています。中期的な上昇トレンドの継続を確認するには、強い出来高を伴ってこのゾーンを突破する必要があります。
チャートパターンとモメンタム:短期の時間足(4時間足/8時間足)では、下限付近を試す動きに、上昇トレンドラインに沿った強気のRSIダイバージェンスの兆候が見られます。このトレンドラインを維持することが、レンジ上限の再試行に向けて重要です。
市場センチメント:45.00ドルを上回っている限り、中立から慎重な強気です。65.00ドルに向けた上昇の拡大を見込む前に、55.00ドルを明確に上抜けるのを待ちましょう。
33
·
--
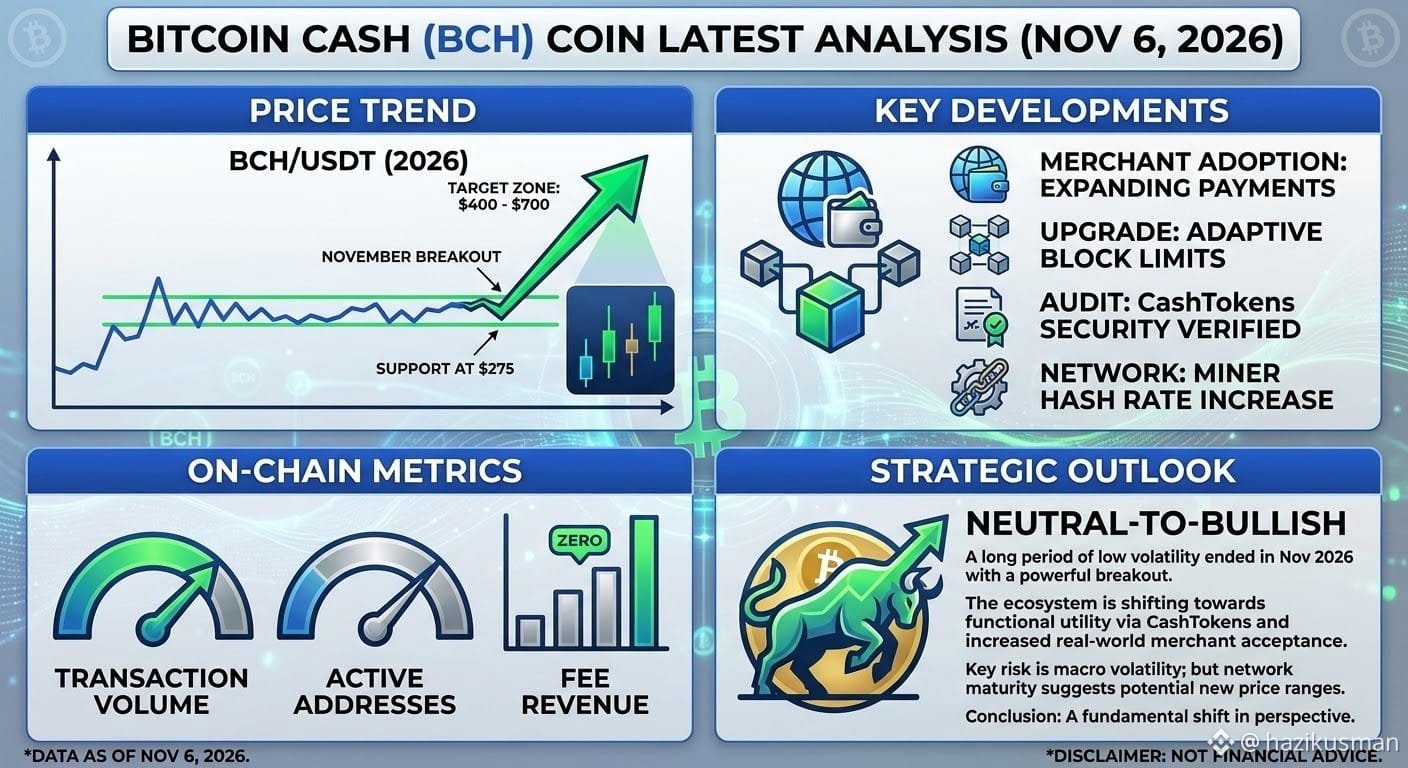
$BCH は約275ドルで重要なサポートを確認した後、力強い大規模な上昇を開始し、長年続いていたレジスタンスを打ち破りました。
目標ゾーン:市場構造は新たな取引レンジへの移行を示しており、アナリストは年末までの初期上値目標を400~700ドルと予測しています。ただし、上昇相場が持続することが条件です。
2. ネットワークの実用性:決済を超えて
CashTokensの統合:2026年のCashTokensアップグレードが成熟し、開発者はBCHブロックチェーン上で高度な分散型アプリケーション(dApps)を構築し、ネイティブトークンを発行できるようになりました。
スマートコントラクト:この機能拡張により、BCHは単なる交換手段から、拡張性の高いレイヤー1の実用ネットワークへと位置づけを変えています。
3. 柔軟なスケーリングとマイナーの支持
ネットワークの安定性:適応型ブロックサイズ上限アルゴリズムの継続的な導入により、取引手数料は1セント未満に保たれ、少額決済における優位性が強化されています。
ハッシュレートの安定性:最近の持続的なマイナーのハッシュレート上昇は、ネットワークの高いセキュリティと大規模事業者からの信頼を裏付けています。
戦略的見通し
ビットコインキャッシュ(BCH)については、中立から強気の見通しを維持しています。マクロ経済のボラティリティは引き続きリスクですが、明確なテクニカル上放れと、CashTokensによる大幅なファンダメンタルズの拡大が重なっていることから、資産の再評価につながる可能性が示唆されます。このネットワークは、高速決済ツールであると同時に、オンチェーン金融の拡張性に優れた基盤にもなり得ることを証明すべく、着実に方向転換を進めています。
$BCH は約275ドルで重要なサポートを確認した後、力強い大規模な上昇を開始し、長年続いていたレジスタンスを打ち破りました。
目標ゾーン:市場構造は新たな取引レンジへの移行を示しており、アナリストは年末までの初期上値目標を400~700ドルと予測しています。ただし、上昇相場が持続することが条件です。
2. ネットワークの実用性:決済を超えて
CashTokensの統合:2026年のCashTokensアップグレードが成熟し、開発者はBCHブロックチェーン上で高度な分散型アプリケーション(dApps)を構築し、ネイティブトークンを発行できるようになりました。
スマートコントラクト:この機能拡張により、BCHは単なる交換手段から、拡張性の高いレイヤー1の実用ネットワークへと位置づけを変えています。
3. 柔軟なスケーリングとマイナーの支持
ネットワークの安定性:適応型ブロックサイズ上限アルゴリズムの継続的な導入により、取引手数料は1セント未満に保たれ、少額決済における優位性が強化されています。
ハッシュレートの安定性:最近の持続的なマイナーのハッシュレート上昇は、ネットワークの高いセキュリティと大規模事業者からの信頼を裏付けています。
戦略的見通し
ビットコインキャッシュ(BCH)については、中立から強気の見通しを維持しています。マクロ経済のボラティリティは引き続きリスクですが、明確なテクニカル上放れと、CashTokensによる大幅なファンダメンタルズの拡大が重なっていることから、資産の再評価につながる可能性が示唆されます。このネットワークは、高速決済ツールであると同時に、オンチェーン金融の拡張性に優れた基盤にもなり得ることを証明すべく、着実に方向転換を進めています。
目標ゾーン:市場構造は新たな取引レンジへの移行を示しており、アナリストは年末までの初期上値目標を400~700ドルと予測しています。ただし、上昇相場が持続することが条件です。
2. ネットワークの実用性:決済を超えて
CashTokensの統合:2026年のCashTokensアップグレードが成熟し、開発者はBCHブロックチェーン上で高度な分散型アプリケーション(dApps)を構築し、ネイティブトークンを発行できるようになりました。
スマートコントラクト:この機能拡張により、BCHは単なる交換手段から、拡張性の高いレイヤー1の実用ネットワークへと位置づけを変えています。
3. 柔軟なスケーリングとマイナーの支持
ネットワークの安定性:適応型ブロックサイズ上限アルゴリズムの継続的な導入により、取引手数料は1セント未満に保たれ、少額決済における優位性が強化されています。
ハッシュレートの安定性:最近の持続的なマイナーのハッシュレート上昇は、ネットワークの高いセキュリティと大規模事業者からの信頼を裏付けています。
戦略的見通し
ビットコインキャッシュ(BCH)については、中立から強気の見通しを維持しています。マクロ経済のボラティリティは引き続きリスクですが、明確なテクニカル上放れと、CashTokensによる大幅なファンダメンタルズの拡大が重なっていることから、資産の再評価につながる可能性が示唆されます。このネットワークは、高速決済ツールであると同時に、オンチェーン金融の拡張性に優れた基盤にもなり得ることを証明すべく、着実に方向転換を進めています。
30
·
--
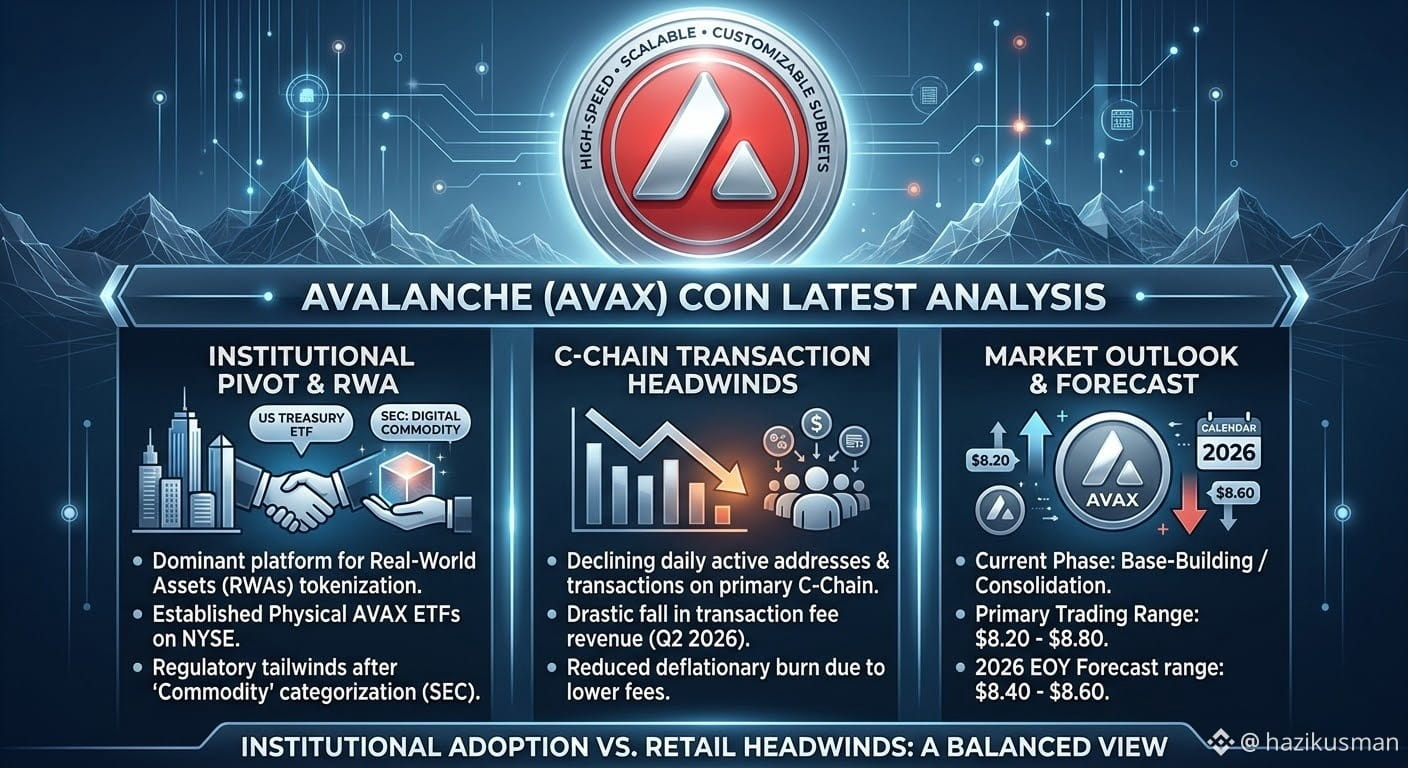
$AVAX 現在、NYSEなど世界の主要取引所に現物ETFが上場しており、従来型金融との距離をさらに縮めています。
規制の明確化:2026年3月、SECの解釈指針によりAVAXは「デジタル商品」に分類され、長期的な規制面で大きな追い風となりました。
.
ネットワークのパフォーマンスと利用状況(逆風):機関投資家向けの材料は力強い一方、個人投資家向けの主要な取引レイヤーであるC-Chainには弱さが見られます。
指標の低下:1日あたりの平均アクティブアドレス数や総取引件数などの利用指標は、2026年初頭のピークから大幅に低下しています。
手数料収入:利用の減少を反映し、2026年第2四半期にはネットワーク手数料収入が急減しました。AVAXの取引手数料はすべてバーンされるため、収入の減少はデフレ圧力の低下に直結し、特に重要です。
.
市場見通しと取引レンジ(テクニカル分析):AVAXの値動きは、数カ月にわたる底固めの期間が特徴で、主に8.20~8.80ドルのレンジで取引されています。
テクニカル面の分析:トークン価格は2021年の史上最高値を大きく下回ったままで、より大規模なエコシステムと比べてパフォーマンスが劣っています。
予測:アナリストは概して、2026年を新たな上昇トレンドの始まりではなく、「底固め」の年として終えると予想しています。年末の予測は8.40~8.60ドルのレンジに集中しています。
.
戦略的見通し
Avalancheへの投資仮説は今や、機関投資家からの資金流入の拡大、サブネット、トークン化資産の基盤が、予定されているトークンのロック解除と個人投資家向けエコシステムの現在の弱さを相殺するだけの、十分かつ持続的な需要を生み出せるかどうかに全面的にかかっています。インフラは堅固で、法的にも認められています。今後、ネットワークは資産の保管以外での有用性を証明する必要があります。
$AVAX 現在、NYSEなど世界の主要取引所に現物ETFが上場しており、従来型金融との距離をさらに縮めています。
規制の明確化:2026年3月、SECの解釈指針によりAVAXは「デジタル商品」に分類され、長期的な規制面で大きな追い風となりました。
.
ネットワークのパフォーマンスと利用状況(逆風):機関投資家向けの材料は力強い一方、個人投資家向けの主要な取引レイヤーであるC-Chainには弱さが見られます。
指標の低下:1日あたりの平均アクティブアドレス数や総取引件数などの利用指標は、2026年初頭のピークから大幅に低下しています。
手数料収入:利用の減少を反映し、2026年第2四半期にはネットワーク手数料収入が急減しました。AVAXの取引手数料はすべてバーンされるため、収入の減少はデフレ圧力の低下に直結し、特に重要です。
.
市場見通しと取引レンジ(テクニカル分析):AVAXの値動きは、数カ月にわたる底固めの期間が特徴で、主に8.20~8.80ドルのレンジで取引されています。
テクニカル面の分析:トークン価格は2021年の史上最高値を大きく下回ったままで、より大規模なエコシステムと比べてパフォーマンスが劣っています。
予測:アナリストは概して、2026年を新たな上昇トレンドの始まりではなく、「底固め」の年として終えると予想しています。年末の予測は8.40~8.60ドルのレンジに集中しています。
.
戦略的見通し
Avalancheへの投資仮説は今や、機関投資家からの資金流入の拡大、サブネット、トークン化資産の基盤が、予定されているトークンのロック解除と個人投資家向けエコシステムの現在の弱さを相殺するだけの、十分かつ持続的な需要を生み出せるかどうかに全面的にかかっています。インフラは堅固で、法的にも認められています。今後、ネットワークは資産の保管以外での有用性を証明する必要があります。
規制の明確化:2026年3月、SECの解釈指針によりAVAXは「デジタル商品」に分類され、長期的な規制面で大きな追い風となりました。
.
ネットワークのパフォーマンスと利用状況(逆風):機関投資家向けの材料は力強い一方、個人投資家向けの主要な取引レイヤーであるC-Chainには弱さが見られます。
指標の低下:1日あたりの平均アクティブアドレス数や総取引件数などの利用指標は、2026年初頭のピークから大幅に低下しています。
手数料収入:利用の減少を反映し、2026年第2四半期にはネットワーク手数料収入が急減しました。AVAXの取引手数料はすべてバーンされるため、収入の減少はデフレ圧力の低下に直結し、特に重要です。
.
市場見通しと取引レンジ(テクニカル分析):AVAXの値動きは、数カ月にわたる底固めの期間が特徴で、主に8.20~8.80ドルのレンジで取引されています。
テクニカル面の分析:トークン価格は2021年の史上最高値を大きく下回ったままで、より大規模なエコシステムと比べてパフォーマンスが劣っています。
予測:アナリストは概して、2026年を新たな上昇トレンドの始まりではなく、「底固め」の年として終えると予想しています。年末の予測は8.40~8.60ドルのレンジに集中しています。
.
戦略的見通し
Avalancheへの投資仮説は今や、機関投資家からの資金流入の拡大、サブネット、トークン化資産の基盤が、予定されているトークンのロック解除と個人投資家向けエコシステムの現在の弱さを相殺するだけの、十分かつ持続的な需要を生み出せるかどうかに全面的にかかっています。インフラは堅固で、法的にも認められています。今後、ネットワークは資産の保管以外での有用性を証明する必要があります。
41
·
--
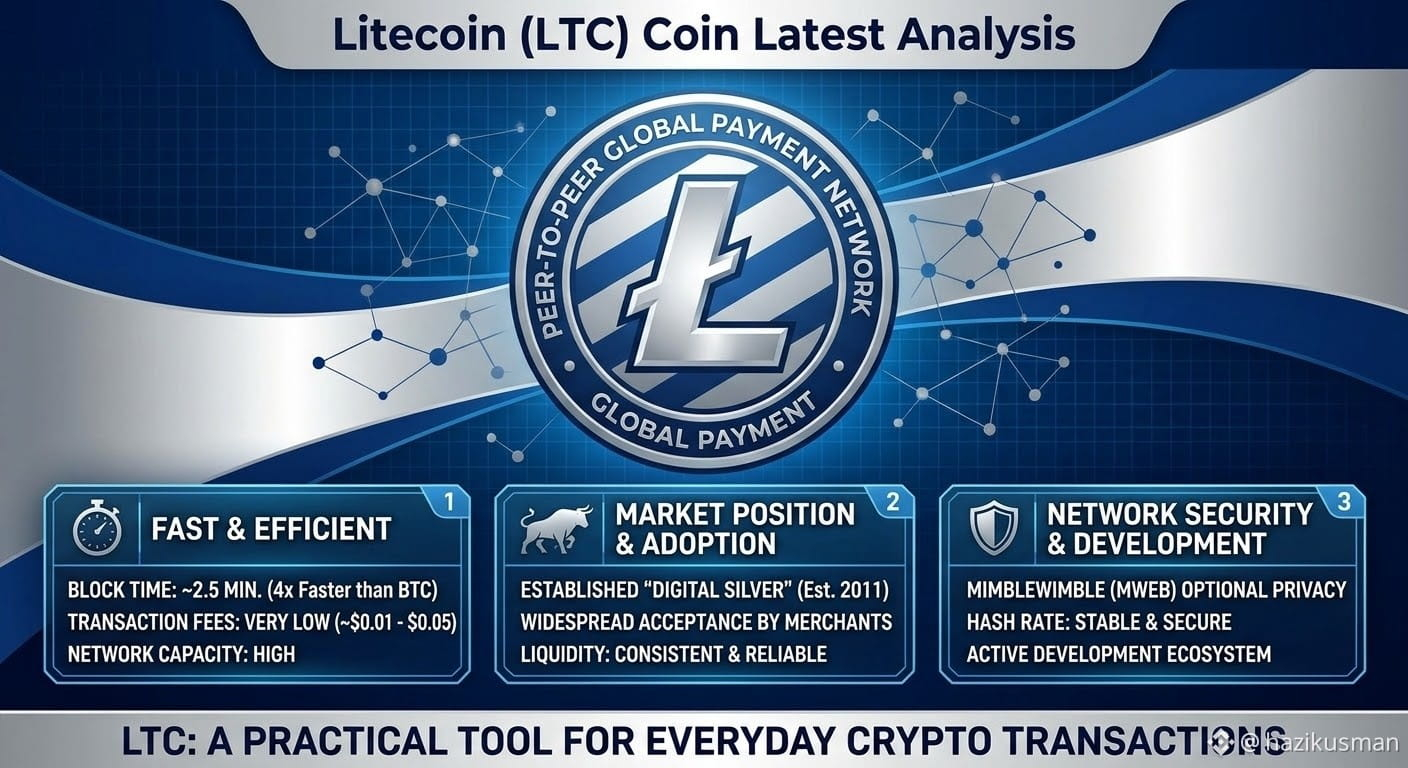
$LTC 中核的な強みは、その実用性にあります。ブロック生成時間は約2.5分(ビットコインの4倍の速さ)で、取引手数料も常にほぼゼロ(多くの場合、1セント未満)に保たれているため、LTCは日常的な実用や取引所間の送金に最適な選択肢です。
ネットワークの成熟度と安定性:2011年にローンチされたライトコインは、ダウンタイムが一度もない成熟した資産です。長年にわたるこの信頼性の実績により、機関投資家向けカストディアンの定番となり、幅広い決済処理業者への統合も進んでいます。最大供給量は8,400万枚で、インフレモデルの予測が容易です。
MWEBによる任意のプライバシー機能:MimbleWimble Extension Block(MWEB)の統合により、ライトコインには任意で利用できるプライバシー機能が備わり、ユーザーは取引額を非公開にできます。規制上の透明性と、ユーザーが選択できる機密性を独自に組み合わせることで、真の交換手段としての魅力が高まっています。
ネットワークの展望
LTCは投機的な熱狂が高まる局面で常に先頭に立つとは限りませんが、その実用性は疑いようがありません。「無駄がなく、力強い、取引に特化したマシン」であることを重視しているため、現実世界での商取引における暗号資産の普及が進むにつれて、ライトコインはその取引量を取り込むうえで独自の優位性を発揮します。多様化する暗号資産の世界において、今も基盤となる資産であり続けています。
$LTC 中核的な強みは、その実用性にあります。ブロック生成時間は約2.5分(ビットコインの4倍の速さ)で、取引手数料も常にほぼゼロ(多くの場合、1セント未満)に保たれているため、LTCは日常的な実用や取引所間の送金に最適な選択肢です。
ネットワークの成熟度と安定性:2011年にローンチされたライトコインは、ダウンタイムが一度もない成熟した資産です。長年にわたるこの信頼性の実績により、機関投資家向けカストディアンの定番となり、幅広い決済処理業者への統合も進んでいます。最大供給量は8,400万枚で、インフレモデルの予測が容易です。
MWEBによる任意のプライバシー機能:MimbleWimble Extension Block(MWEB)の統合により、ライトコインには任意で利用できるプライバシー機能が備わり、ユーザーは取引額を非公開にできます。規制上の透明性と、ユーザーが選択できる機密性を独自に組み合わせることで、真の交換手段としての魅力が高まっています。
ネットワークの展望
LTCは投機的な熱狂が高まる局面で常に先頭に立つとは限りませんが、その実用性は疑いようがありません。「無駄がなく、力強い、取引に特化したマシン」であることを重視しているため、現実世界での商取引における暗号資産の普及が進むにつれて、ライトコインはその取引量を取り込むうえで独自の優位性を発揮します。多様化する暗号資産の世界において、今も基盤となる資産であり続けています。
ネットワークの成熟度と安定性:2011年にローンチされたライトコインは、ダウンタイムが一度もない成熟した資産です。長年にわたるこの信頼性の実績により、機関投資家向けカストディアンの定番となり、幅広い決済処理業者への統合も進んでいます。最大供給量は8,400万枚で、インフレモデルの予測が容易です。
MWEBによる任意のプライバシー機能:MimbleWimble Extension Block(MWEB)の統合により、ライトコインには任意で利用できるプライバシー機能が備わり、ユーザーは取引額を非公開にできます。規制上の透明性と、ユーザーが選択できる機密性を独自に組み合わせることで、真の交換手段としての魅力が高まっています。
ネットワークの展望
LTCは投機的な熱狂が高まる局面で常に先頭に立つとは限りませんが、その実用性は疑いようがありません。「無駄がなく、力強い、取引に特化したマシン」であることを重視しているため、現実世界での商取引における暗号資産の普及が進むにつれて、ライトコインはその取引量を取り込むうえで独自の優位性を発揮します。多様化する暗号資産の世界において、今も基盤となる資産であり続けています。
56
·
--
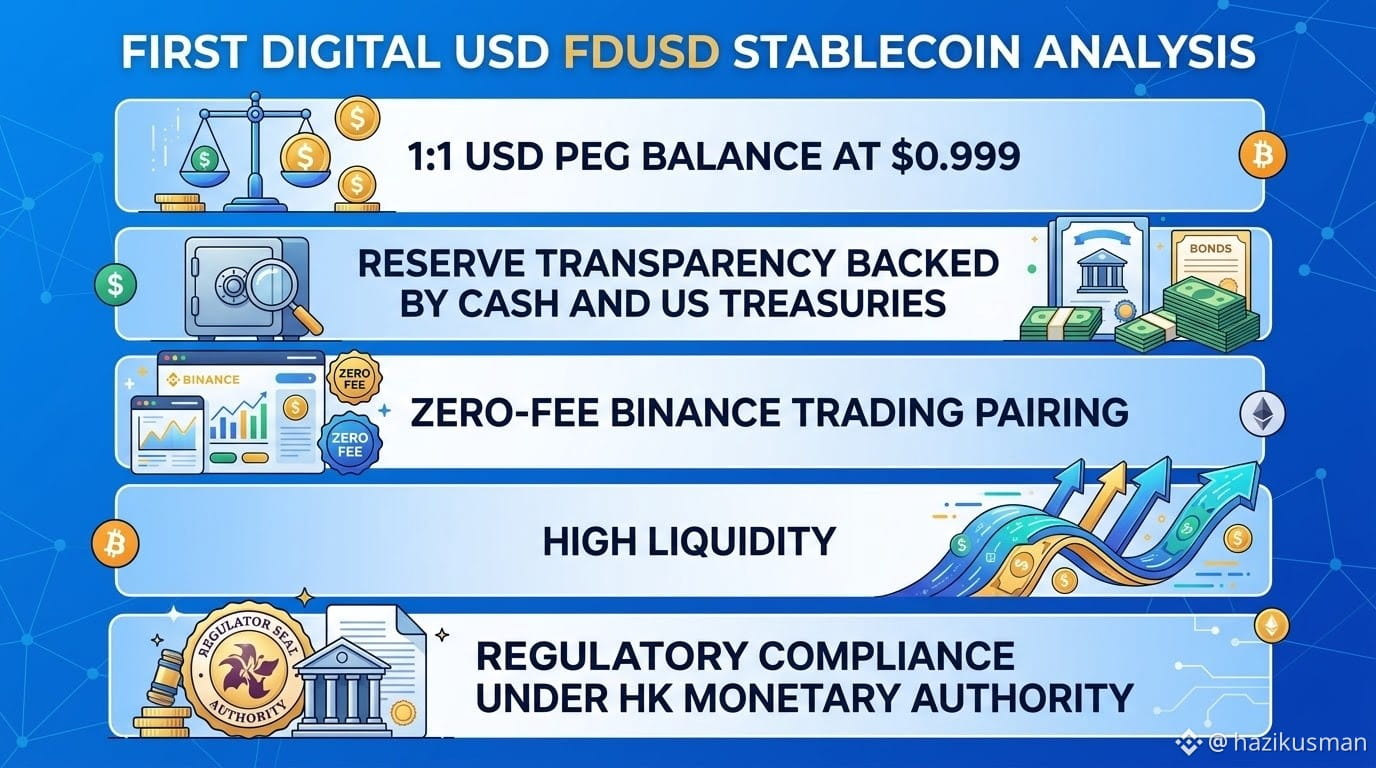
$FDUSD は$0.999~$1.000の狭い範囲で取引されており、価格変動が小さいことを示しています。
ペッグの安定性:短期的な変動はごくわずかで、裁定取引によって速やかに解消されるため、市場が大きく変動する局面でも安定性が保たれます。
2. 準備金と規制上の裏付け
準備金の品質:準備金は分別管理口座で保有され、流動性の高い現金同等物と短期米国債で構成されています。
監査と透明性:定期的に実施される独立した証明報告により、資産が完全に1対1で裏付けられていることが確認されています。
コンプライアンス体制:香港の金融規制のもとで運営されており、FDUSDは機関投資家と個人利用者への普及に向けた体系的な監督体制を維持しています。
3. 取引所での流動性と実用性
Binanceとの統合:Binanceなどの主要プラットフォームで基軸通貨の有力な選択肢となっているFDUSDは、手数料無料の取引ペアを対象としたプロモーションの恩恵を受けています。
DeFiと決済での利用:取引手数料の低さと送金速度の速さから、現物取引、Launchpoolイベント、国際決済で幅広く利用されています。
要点
FDUSDは、信頼性の高い交換手段および価値保存手段となるステーブルコインです。価格の方向性に関するリスクを最小限に抑えつつ、主要な取引ペアや利回りプログラムにおける重要な流動性の仲介役を主に担っています。
$FDUSD は$0.999~$1.000の狭い範囲で取引されており、価格変動が小さいことを示しています。
ペッグの安定性:短期的な変動はごくわずかで、裁定取引によって速やかに解消されるため、市場が大きく変動する局面でも安定性が保たれます。
2. 準備金と規制上の裏付け
準備金の品質:準備金は分別管理口座で保有され、流動性の高い現金同等物と短期米国債で構成されています。
監査と透明性:定期的に実施される独立した証明報告により、資産が完全に1対1で裏付けられていることが確認されています。
コンプライアンス体制:香港の金融規制のもとで運営されており、FDUSDは機関投資家と個人利用者への普及に向けた体系的な監督体制を維持しています。
3. 取引所での流動性と実用性
Binanceとの統合:Binanceなどの主要プラットフォームで基軸通貨の有力な選択肢となっているFDUSDは、手数料無料の取引ペアを対象としたプロモーションの恩恵を受けています。
DeFiと決済での利用:取引手数料の低さと送金速度の速さから、現物取引、Launchpoolイベント、国際決済で幅広く利用されています。
要点
FDUSDは、信頼性の高い交換手段および価値保存手段となるステーブルコインです。価格の方向性に関するリスクを最小限に抑えつつ、主要な取引ペアや利回りプログラムにおける重要な流動性の仲介役を主に担っています。
ペッグの安定性:短期的な変動はごくわずかで、裁定取引によって速やかに解消されるため、市場が大きく変動する局面でも安定性が保たれます。
2. 準備金と規制上の裏付け
準備金の品質:準備金は分別管理口座で保有され、流動性の高い現金同等物と短期米国債で構成されています。
監査と透明性:定期的に実施される独立した証明報告により、資産が完全に1対1で裏付けられていることが確認されています。
コンプライアンス体制:香港の金融規制のもとで運営されており、FDUSDは機関投資家と個人利用者への普及に向けた体系的な監督体制を維持しています。
3. 取引所での流動性と実用性
Binanceとの統合:Binanceなどの主要プラットフォームで基軸通貨の有力な選択肢となっているFDUSDは、手数料無料の取引ペアを対象としたプロモーションの恩恵を受けています。
DeFiと決済での利用:取引手数料の低さと送金速度の速さから、現物取引、Launchpoolイベント、国際決済で幅広く利用されています。
要点
FDUSDは、信頼性の高い交換手段および価値保存手段となるステーブルコインです。価格の方向性に関するリスクを最小限に抑えつつ、主要な取引ペアや利回りプログラムにおける重要な流動性の仲介役を主に担っています。
66
·
--
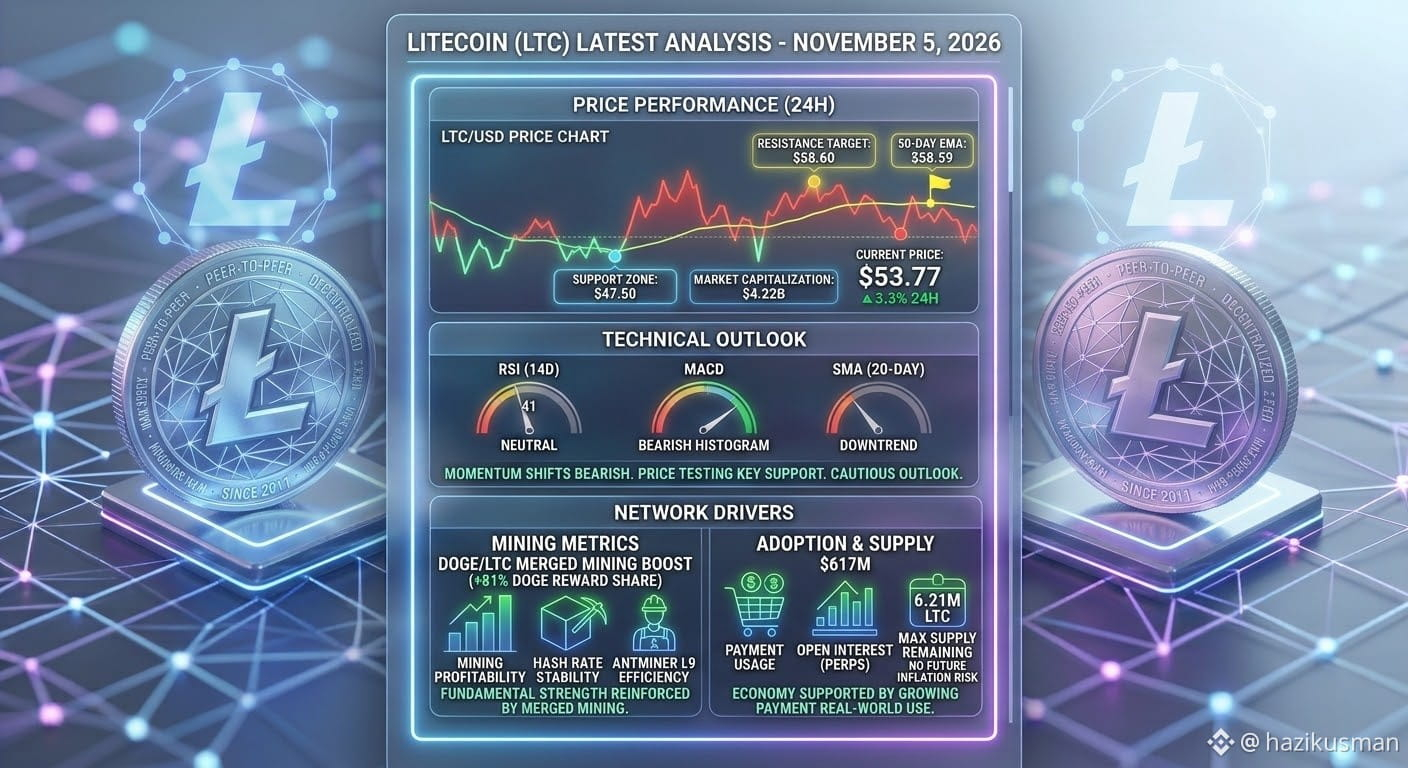
$LTC は53.77ドル付近で取引されており、数週間にわたるレンジ相場を試す短期的な小幅の売り圧力が続くなか、重要な需要ゾーン付近で推移しています。
主要なレジスタンス:目先の上値抵抗線は58.60ドルに位置し、58.59ドル付近の50日指数移動平均線が強力な上値抵抗として機能しています。強気相場への転換には、この水準を明確に上抜けることが必要です。
主要なサポート:目先の下値支持線は47.50ドルです。より低い心理的節目に向けた一段の調整を防ぐには、この水準を維持することが重要です。
ファンダメンタルズとネットワークの推進要因:ライトコインは、安定したハッシュレート効率や、Doge/LTCのマージドマイニング体制による堅調な活動に支えられ、引き続き強固なネットワーク基盤の恩恵を受けています。さらに、安定した決済手段としての実用性と、発行上限が厳格に定められていることも、短期的な市場のもみ合いが続くなかで、長期的なネットワークの健全性を支えています。
$LTC は53.77ドル付近で取引されており、数週間にわたるレンジ相場を試す短期的な小幅の売り圧力が続くなか、重要な需要ゾーン付近で推移しています。
主要なレジスタンス:目先の上値抵抗線は58.60ドルに位置し、58.59ドル付近の50日指数移動平均線が強力な上値抵抗として機能しています。強気相場への転換には、この水準を明確に上抜けることが必要です。
主要なサポート:目先の下値支持線は47.50ドルです。より低い心理的節目に向けた一段の調整を防ぐには、この水準を維持することが重要です。
ファンダメンタルズとネットワークの推進要因:ライトコインは、安定したハッシュレート効率や、Doge/LTCのマージドマイニング体制による堅調な活動に支えられ、引き続き強固なネットワーク基盤の恩恵を受けています。さらに、安定した決済手段としての実用性と、発行上限が厳格に定められていることも、短期的な市場のもみ合いが続くなかで、長期的なネットワークの健全性を支えています。
主要なレジスタンス:目先の上値抵抗線は58.60ドルに位置し、58.59ドル付近の50日指数移動平均線が強力な上値抵抗として機能しています。強気相場への転換には、この水準を明確に上抜けることが必要です。
主要なサポート:目先の下値支持線は47.50ドルです。より低い心理的節目に向けた一段の調整を防ぐには、この水準を維持することが重要です。
ファンダメンタルズとネットワークの推進要因:ライトコインは、安定したハッシュレート効率や、Doge/LTCのマージドマイニング体制による堅調な活動に支えられ、引き続き強固なネットワーク基盤の恩恵を受けています。さらに、安定した決済手段としての実用性と、発行上限が厳格に定められていることも、短期的な市場のもみ合いが続くなかで、長期的なネットワークの健全性を支えています。
4
·
--
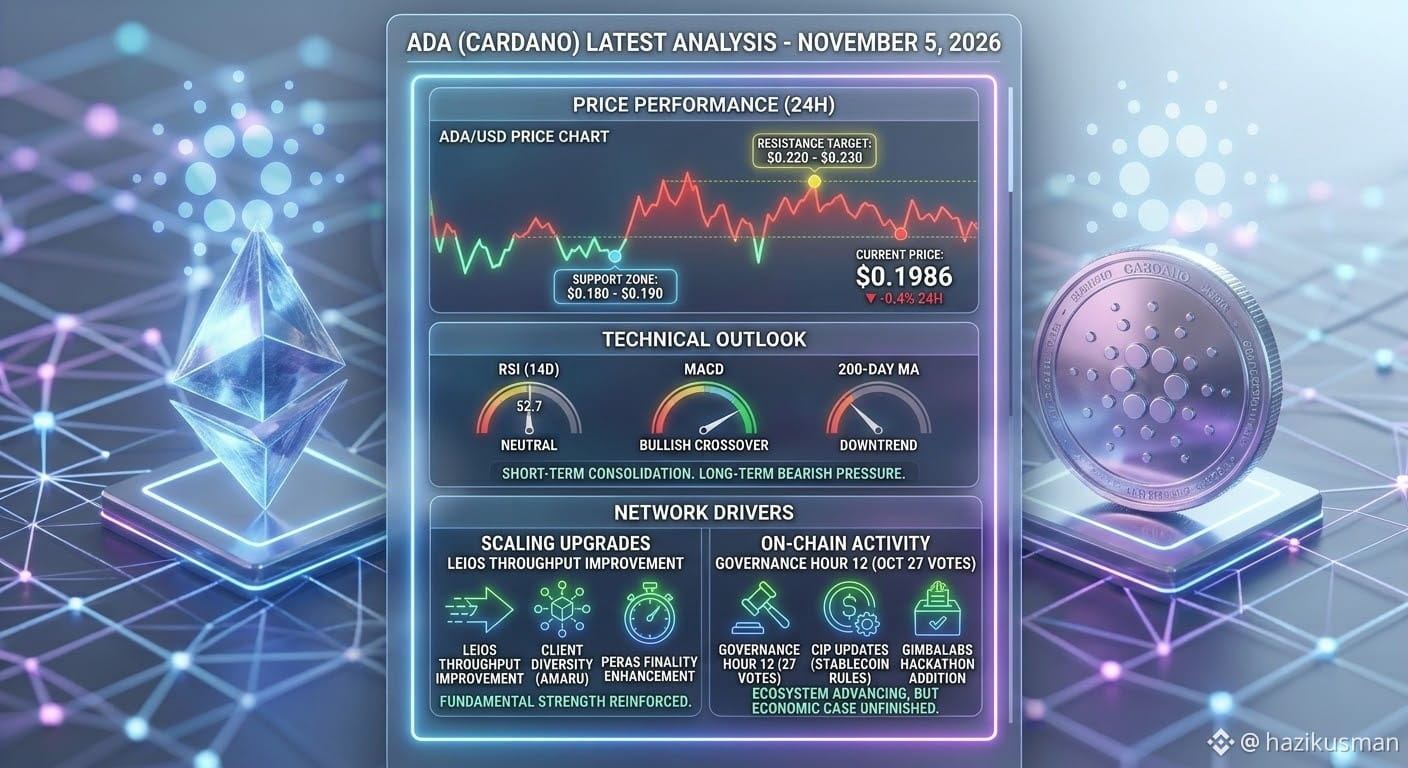
$ADA は現在約$0.1986で取引されており、市場全体の変動が続くなか、値固めの局面で一定の範囲内にとどまっています。
重要なレジスタンス:直近の上値抵抗帯は$0.220~$0.230です。この水準を上回って日足が引けることが、続いている中期的な下降トレンドを反転させ、さらに高い価格目標を目指すために必要です。
重要なサポート:下値では、$0.180~$0.190の範囲に主要なサポートがあります。年初来安値に向けたさらなる下落圧力を防ぐうえで、この水準を維持することが重要です。
テクニカル・ファンダメンタルズ要因:短期的なモメンタムは中立的で、小幅な強気クロスの兆しが見られる一方、ADAは長期トレンドの圧力を受けています。Leiosによるスループット拡大や進行中のガバナンス投票など、プロトコルのアップデートはネットワークのファンダメンタルズを引き続き強化していますが、エコシステムの経済的成長はなお進展の途上にあります。
$ADA は現在約$0.1986で取引されており、市場全体の変動が続くなか、値固めの局面で一定の範囲内にとどまっています。
重要なレジスタンス:直近の上値抵抗帯は$0.220~$0.230です。この水準を上回って日足が引けることが、続いている中期的な下降トレンドを反転させ、さらに高い価格目標を目指すために必要です。
重要なサポート:下値では、$0.180~$0.190の範囲に主要なサポートがあります。年初来安値に向けたさらなる下落圧力を防ぐうえで、この水準を維持することが重要です。
テクニカル・ファンダメンタルズ要因:短期的なモメンタムは中立的で、小幅な強気クロスの兆しが見られる一方、ADAは長期トレンドの圧力を受けています。Leiosによるスループット拡大や進行中のガバナンス投票など、プロトコルのアップデートはネットワークのファンダメンタルズを引き続き強化していますが、エコシステムの経済的成長はなお進展の途上にあります。
重要なレジスタンス:直近の上値抵抗帯は$0.220~$0.230です。この水準を上回って日足が引けることが、続いている中期的な下降トレンドを反転させ、さらに高い価格目標を目指すために必要です。
重要なサポート:下値では、$0.180~$0.190の範囲に主要なサポートがあります。年初来安値に向けたさらなる下落圧力を防ぐうえで、この水準を維持することが重要です。
テクニカル・ファンダメンタルズ要因:短期的なモメンタムは中立的で、小幅な強気クロスの兆しが見られる一方、ADAは長期トレンドの圧力を受けています。Leiosによるスループット拡大や進行中のガバナンス投票など、プロトコルのアップデートはネットワークのファンダメンタルズを引き続き強化していますが、エコシステムの経済的成長はなお進展の途上にあります。
35
ログインして、さらにコンテンツを読む
厳選トピックで世界の暗号資産トレーダーの仲間入り
⚡️ 暗号資産に関する最新かつ有益な情報が見つかります。
💬 世界最大の暗号資産取引所から信頼されています。
👍 認証を受けたクリエイターから、有益なインサイトを得られます。
メール / 電話番号