
Rahul beast
4 投稿

Rahul beast
報告
ユーザーをブロック
取引を発注
1.6か月
0 フォロー
0 フォロワー
0 いいね
投稿
ポートフォリオ
·
--
記事
🥇 金(XAUUSD)市場分析:強気派が上昇を促すも、レジスタンスが目前!$XAU $BTC
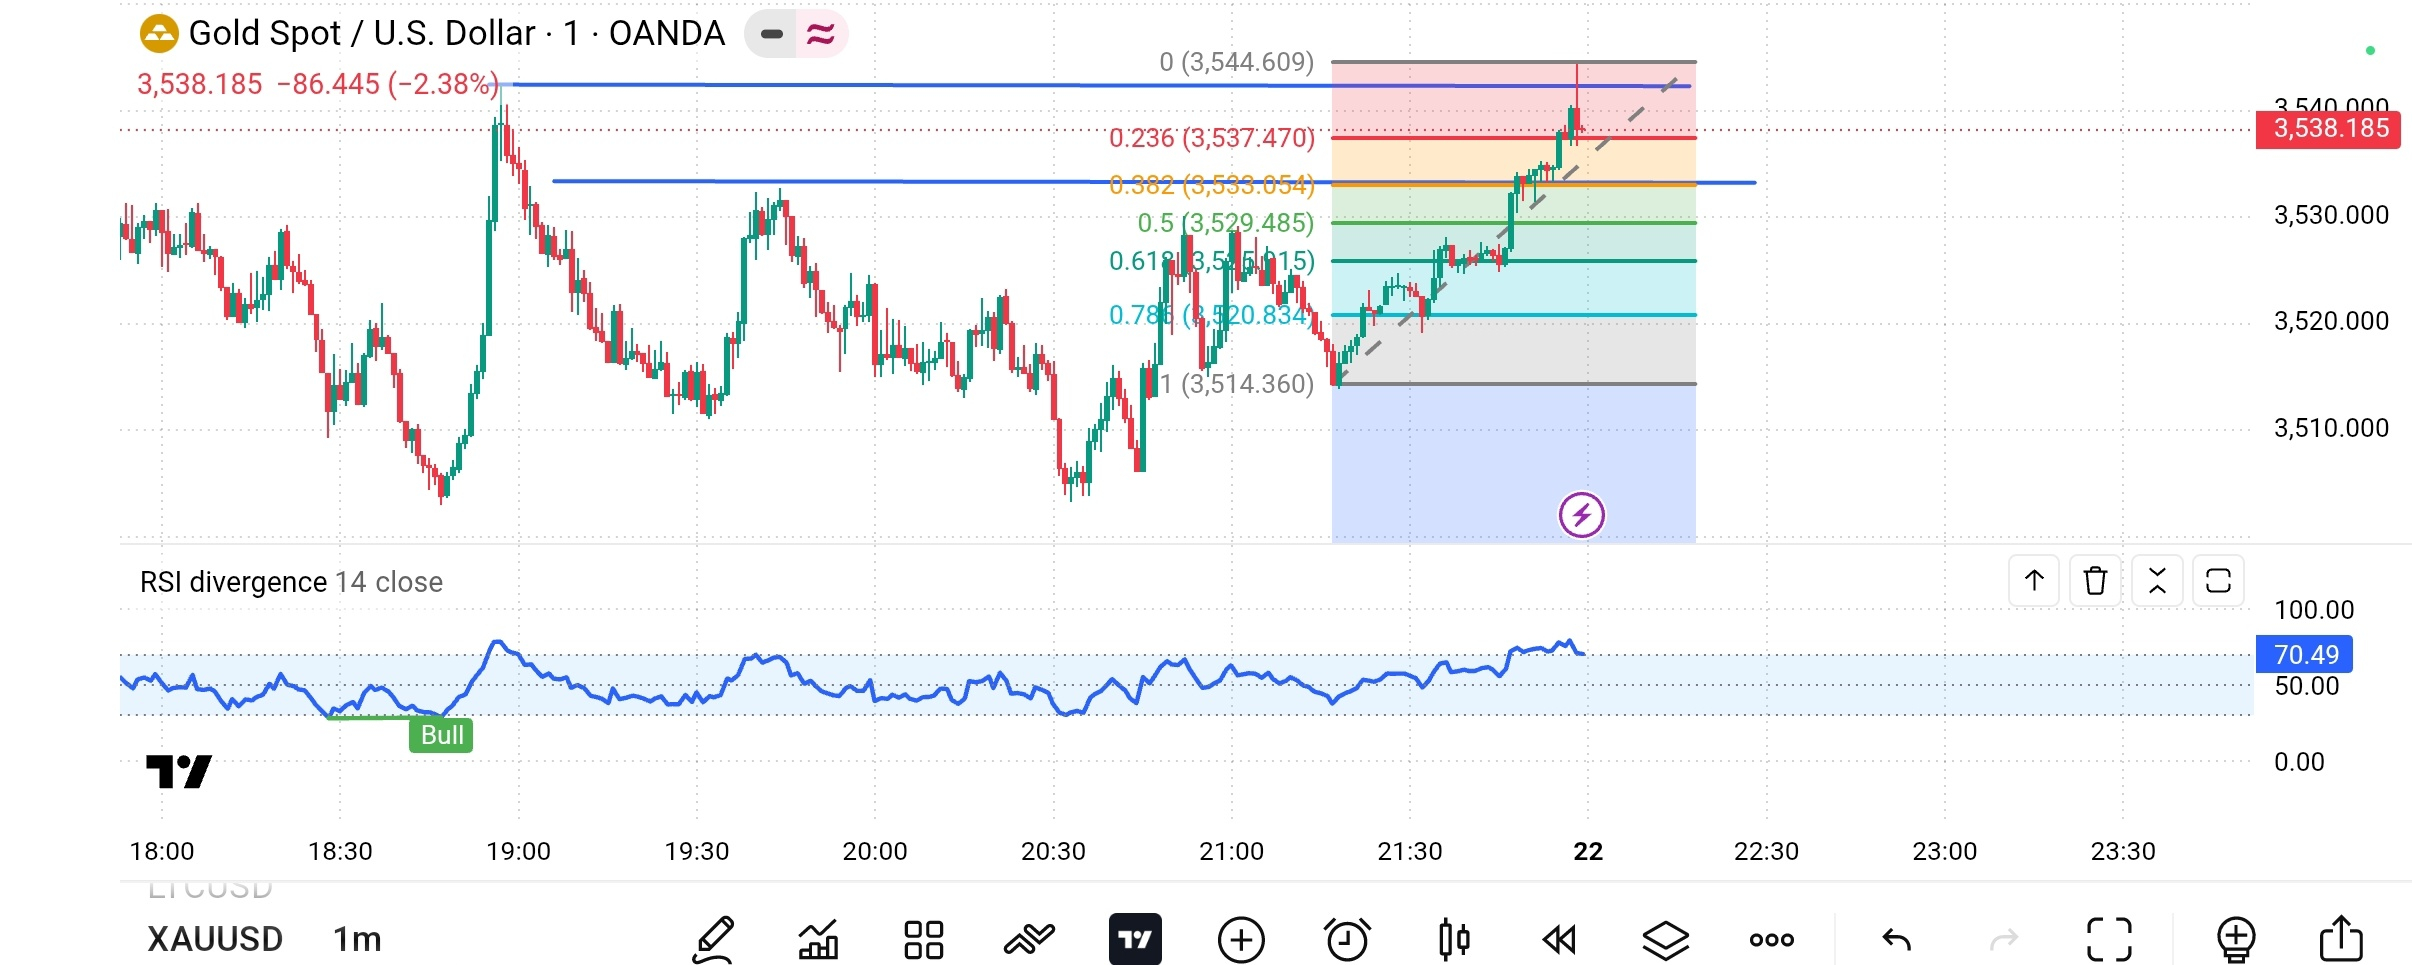
1分足チャートでは、金は強い上昇モメンタムを示しており、買い手が価格を3,540ドルのレジスタンスゾーンに向けて押し上げています。ただし、直近の値動きを踏まえると、市場が重要なテクニカル水準に近づくなか、トレーダーは慎重な姿勢を保つべきでしょう。
📊 テクニカル分析
チャートでは、3,514ドル付近から3,540~3,545ドルのレジスタンスゾーンに向けた短期的な上昇が見られます。フィボナッチ・リトレースメントの水準は、潜在的なサポートとレジスタンスを見極めるうえで有用な目安となります。
🥇 金(XAUUSD)市場分析:強気派が上昇を促すも、レジスタンスが目前!
$XAU $BTC
1分足チャートでは、金は強い上昇モメンタムを示しており、買い手が価格を3,540ドルのレジスタンスゾーンに向けて押し上げています。ただし、直近の値動きを踏まえると、市場が重要なテクニカル水準に近づくなか、トレーダーは慎重な姿勢を保つべきでしょう。
📊 テクニカル分析
チャートでは、3,514ドル付近から3,540~3,545ドルのレジスタンスゾーンに向けた短期的な上昇が見られます。フィボナッチ・リトレースメントの水準は、潜在的なサポートとレジスタンスを見極めるうえで有用な目安となります。
1分足チャートでは、金は強い上昇モメンタムを示しており、買い手が価格を3,540ドルのレジスタンスゾーンに向けて押し上げています。ただし、直近の値動きを踏まえると、市場が重要なテクニカル水準に近づくなか、トレーダーは慎重な姿勢を保つべきでしょう。
📊 テクニカル分析
チャートでは、3,514ドル付近から3,540~3,545ドルのレジスタンスゾーンに向けた短期的な上昇が見られます。フィボナッチ・リトレースメントの水準は、潜在的なサポートとレジスタンスを見極めるうえで有用な目安となります。
560
·
--
記事
📉 金市場分析:忍耐、戦略、リスク管理📉 金市場分析:忍耐、戦略、リスク管理$XAUT
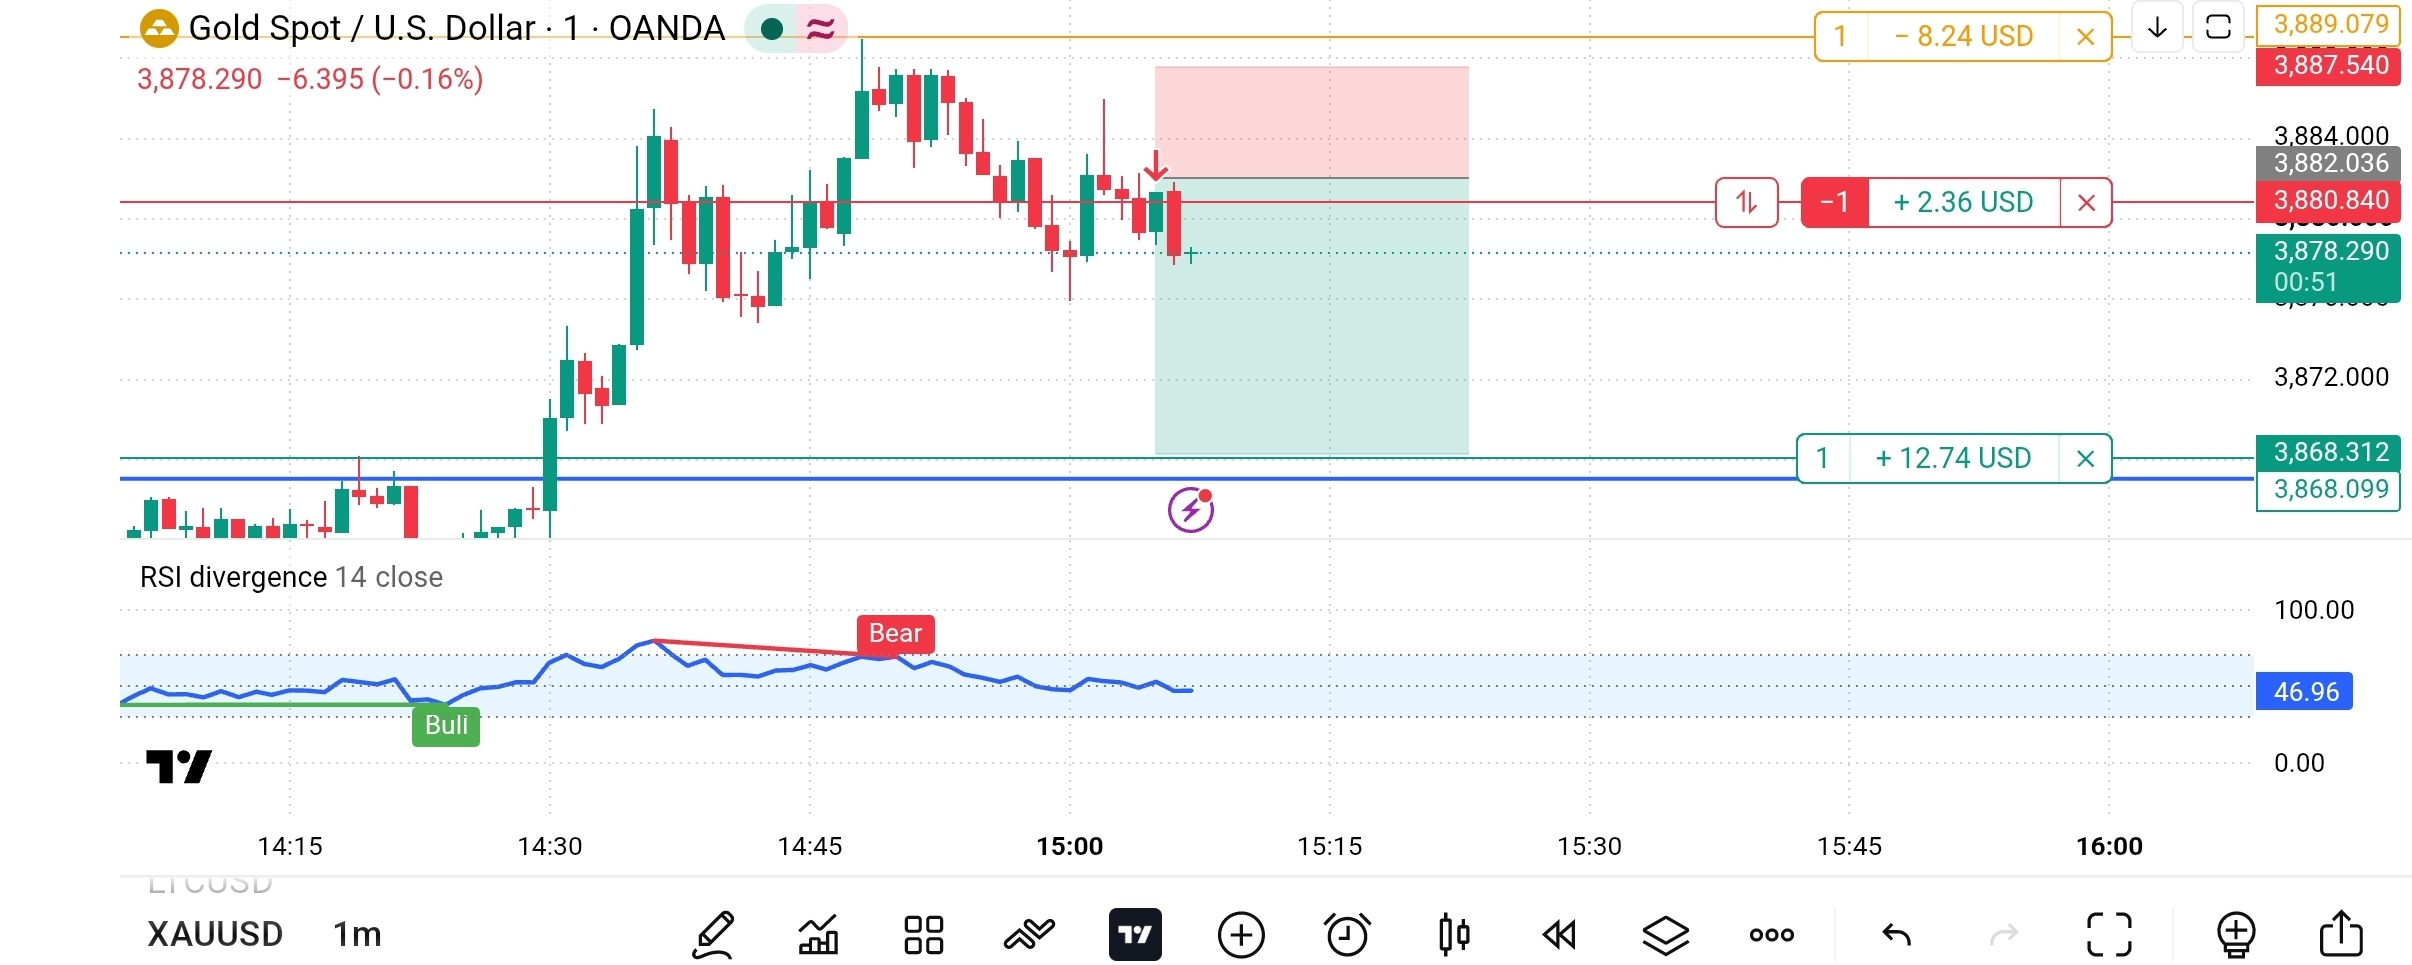
すべてのトレーダーが理想的なエントリーポイントを見つけたいと願っています。しかし、トレードの本当の秘訣は、あらゆる値動きを予測することではなく、リスクを管理し、規律を守ることです。❤️
この$XAU XAUUSDの1分足チャートを見ると、金価格は力強く上昇した後、短期的な弱さの兆候を見せ始めています。価格は直近の高値から反落しており、RSIは約46.96で、勢いが弱まっていることを示唆しています。
📊 チャートから何が読み取れる?
📉 金市場分析:忍耐、戦略、リスク管理
📉 金市場分析:忍耐、戦略、リスク管理$XAUT
すべてのトレーダーが理想的なエントリーポイントを見つけたいと願っています。しかし、トレードの本当の秘訣は、あらゆる値動きを予測することではなく、リスクを管理し、規律を守ることです。❤️
この$XAU XAUUSDの1分足チャートを見ると、金価格は力強く上昇した後、短期的な弱さの兆候を見せ始めています。価格は直近の高値から反落しており、RSIは約46.96で、勢いが弱まっていることを示唆しています。
📊 チャートから何が読み取れる?
すべてのトレーダーが理想的なエントリーポイントを見つけたいと願っています。しかし、トレードの本当の秘訣は、あらゆる値動きを予測することではなく、リスクを管理し、規律を守ることです。❤️
この$XAU XAUUSDの1分足チャートを見ると、金価格は力強く上昇した後、短期的な弱さの兆候を見せ始めています。価格は直近の高値から反落しており、RSIは約46.96で、勢いが弱まっていることを示唆しています。
📊 チャートから何が読み取れる?
276
·
--
翻訳参照
📈 BTC/USD Market Analysis | Buyers Are Making a Comeback! 🚀📈 BTC/USD Market Analysis | Buyers Are Making a Comeback! 🚀 $BTC
Bitcoin is showing a strong recovery after a sharp bearish move on the 1-minute chart.
🔍 What the Chart Shows:
- Current Price: Around $64,866
- Market Structure: Price dropped sharply before buyers stepped in with strong bullish candles.
- Buying Momentum: The recent upward movement suggests short-term buying pressure is increasing.
- Resistance Zone: $64,900–$64,950
- Support Zone: $64,700–$64,720
💡 My Trading Perspective:
Bitcoin is attempting to recover from the recent sell-off, but the next move will be important. If buyers maintain momentum and price breaks above the resistance zone, further upside may follow. However, rejection near resistance could lead to another pullback.
🎯 Key Levels to Watch:
✅ Resistance: $64,900–$64,950
✅ Support: $64,700–$64,720
⚠️ A confirmed breakout or breakdown is needed before considering the next move.
🧠 Remember: The 1-minute chart is highly volatile. Always manage risk, use a proper stop-loss, and avoid entering trades based on emotions.
🔥 Trade Smart. Stay Patient. Protect Your Capital.
#Bitcoin #BTCUSD #Binance #CryptoAnalysis #BitcoinTrading #TechnicalAnalysis #CryptoMarket
📈 BTC/USD Market Analysis | Buyers Are Making a Comeback! 🚀
📈 BTC/USD Market Analysis | Buyers Are Making a Comeback! 🚀 $BTC
Bitcoin is showing a strong recovery after a sharp bearish move on the 1-minute chart.
🔍 What the Chart Shows:
- Current Price: Around $64,866
- Market Structure: Price dropped sharply before buyers stepped in with strong bullish candles.
- Buying Momentum: The recent upward movement suggests short-term buying pressure is increasing.
- Resistance Zone: $64,900–$64,950
- Support Zone: $64,700–$64,720
💡 My Trading Perspective:
Bitcoin is attempting to recover from the recent sell-off, but the next move will be important. If buyers maintain momentum and price breaks above the resistance zone, further upside may follow. However, rejection near resistance could lead to another pullback.
🎯 Key Levels to Watch:
✅ Resistance: $64,900–$64,950
✅ Support: $64,700–$64,720
⚠️ A confirmed breakout or breakdown is needed before considering the next move.
🧠 Remember: The 1-minute chart is highly volatile. Always manage risk, use a proper stop-loss, and avoid entering trades based on emotions.
🔥 Trade Smart. Stay Patient. Protect Your Capital.
#Bitcoin #BTCUSD #Binance #CryptoAnalysis #BitcoinTrading #TechnicalAnalysis #CryptoMarket
Bitcoin is showing a strong recovery after a sharp bearish move on the 1-minute chart.
🔍 What the Chart Shows:
- Current Price: Around $64,866
- Market Structure: Price dropped sharply before buyers stepped in with strong bullish candles.
- Buying Momentum: The recent upward movement suggests short-term buying pressure is increasing.
- Resistance Zone: $64,900–$64,950
- Support Zone: $64,700–$64,720
💡 My Trading Perspective:
Bitcoin is attempting to recover from the recent sell-off, but the next move will be important. If buyers maintain momentum and price breaks above the resistance zone, further upside may follow. However, rejection near resistance could lead to another pullback.
🎯 Key Levels to Watch:
✅ Resistance: $64,900–$64,950
✅ Support: $64,700–$64,720
⚠️ A confirmed breakout or breakdown is needed before considering the next move.
🧠 Remember: The 1-minute chart is highly volatile. Always manage risk, use a proper stop-loss, and avoid entering trades based on emotions.
🔥 Trade Smart. Stay Patient. Protect Your Capital.
#Bitcoin #BTCUSD #Binance #CryptoAnalysis #BitcoinTrading #TechnicalAnalysis #CryptoMarket
92
ログインして、さらにコンテンツを読む
厳選トピックで世界の暗号資産トレーダーの仲間入り
⚡️ 暗号資産に関する最新かつ有益な情報が見つかります。
💬 世界最大の暗号資産取引所から信頼されています。
👍 認証を受けたクリエイターから、有益なインサイトを得られます。
メール / 電話番号