
sprit_097
8 投稿

sprit_097
報告
ユーザーをブロック
1 フォロー
1 フォロワー
0 いいね
投稿
·
--
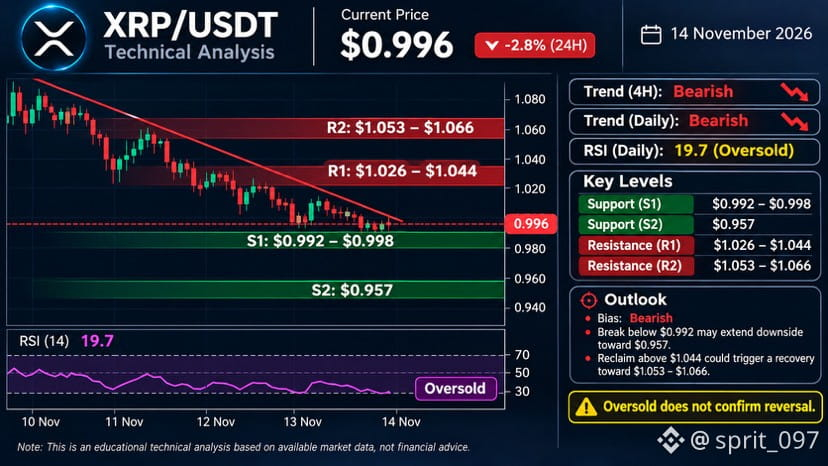
$XRP
テクニカル分析:
トレンド:弱気。
RSI:19.7 – 強い売られ過ぎ。
サポート1:$0.992–$0.998
サポート2:$0.957
レジスタンス1:$1.026–$1.044
レジスタンス2:$1.053–$1.066
取引シナリオ:
弱気:$0.992を下回ると、$0.957に向けてさらに下落する可能性があります。
強気:$1.044を回復すると、$1.053–$1.066に向けて反発する可能性があります。
見解:売り手が主導権を握っています。強気の反転が確認されるまでは、積極的なロングは避けましょう。
#XRPPredictions #xrp
{spot}(XRPUSDT)
$XRP
テクニカル分析:
トレンド:弱気。
RSI:19.7 – 強い売られ過ぎ。
サポート1:$0.992–$0.998
サポート2:$0.957
レジスタンス1:$1.026–$1.044
レジスタンス2:$1.053–$1.066
取引シナリオ:
弱気:$0.992を下回ると、$0.957に向けてさらに下落する可能性があります。
強気:$1.044を回復すると、$1.053–$1.066に向けて反発する可能性があります。
見解:売り手が主導権を握っています。強気の反転が確認されるまでは、積極的なロングは避けましょう。
#XRPPredictions #xrp
テクニカル分析:
トレンド:弱気。
RSI:19.7 – 強い売られ過ぎ。
サポート1:$0.992–$0.998
サポート2:$0.957
レジスタンス1:$1.026–$1.044
レジスタンス2:$1.053–$1.066
取引シナリオ:
弱気:$0.992を下回ると、$0.957に向けてさらに下落する可能性があります。
強気:$1.044を回復すると、$1.053–$1.066に向けて反発する可能性があります。
見解:売り手が主導権を握っています。強気の反転が確認されるまでは、積極的なロングは避けましょう。
#XRPPredictions #xrp
125
·
--
$BTC テクニカル分析
テクニカル見通し:
トレンド:弱気(高値と安値を切り下げ)。
RSI:約23 ― 売られ過ぎ。
サポート:$66,000~$66,700
レジスタンス:$68,700~$69,200
次のレジスタンス:$71,000~$71,300
取引シナリオ:
弱気:$66,000を下回ると、さらに下落する可能性があります。
強気:4時間足が力強く引けて$69,200を回復すれば、反発のきっかけとなる可能性があります。
私の見解:弱気寄りです。RSIが売られ過ぎだからという理由だけで、ロングを追いかけるのは避けましょう。確認を待ちましょう。
#TradFiForBeginners #BitcoinCoreDisclosesTorTrafficVulnerability
{spot}(BTCUSDT)
$BTC テクニカル分析
テクニカル見通し:
トレンド:弱気(高値と安値を切り下げ)。
RSI:約23 ― 売られ過ぎ。
サポート:$66,000~$66,700
レジスタンス:$68,700~$69,200
次のレジスタンス:$71,000~$71,300
取引シナリオ:
弱気:$66,000を下回ると、さらに下落する可能性があります。
強気:4時間足が力強く引けて$69,200を回復すれば、反発のきっかけとなる可能性があります。
私の見解:弱気寄りです。RSIが売られ過ぎだからという理由だけで、ロングを追いかけるのは避けましょう。確認を待ちましょう。
#TradFiForBeginners #BitcoinCoreDisclosesTorTrafficVulnerability
テクニカル見通し:
トレンド:弱気(高値と安値を切り下げ)。
RSI:約23 ― 売られ過ぎ。
サポート:$66,000~$66,700
レジスタンス:$68,700~$69,200
次のレジスタンス:$71,000~$71,300
取引シナリオ:
弱気:$66,000を下回ると、さらに下落する可能性があります。
強気:4時間足が力強く引けて$69,200を回復すれば、反発のきっかけとなる可能性があります。
私の見解:弱気寄りです。RSIが売られ過ぎだからという理由だけで、ロングを追いかけるのは避けましょう。確認を待ちましょう。
#TradFiForBeginners #BitcoinCoreDisclosesTorTrafficVulnerability
112
·
--
翻訳参照
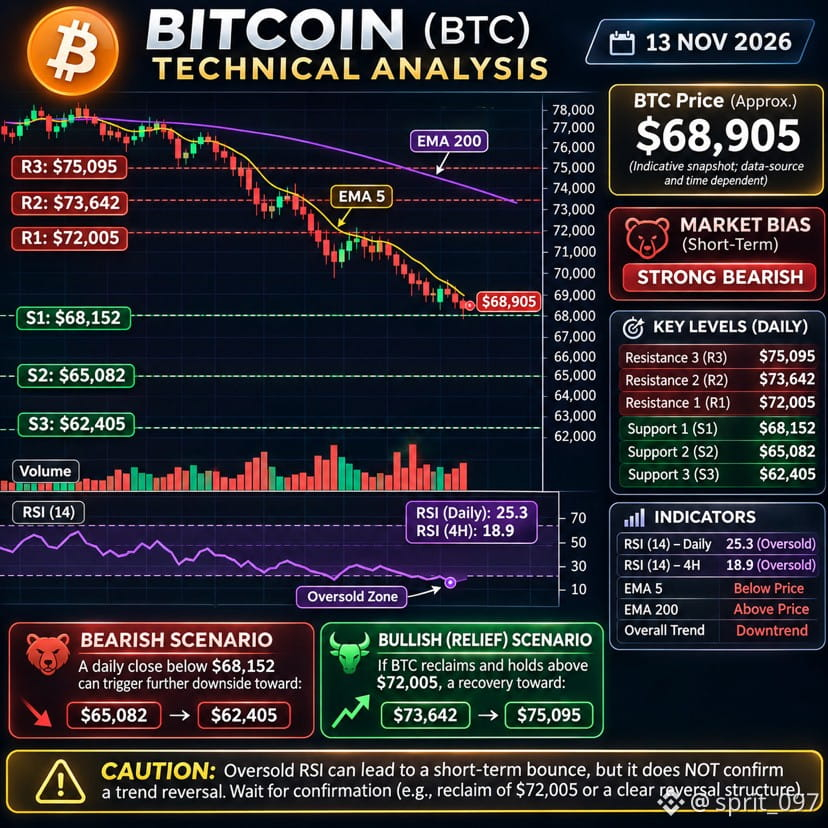
$BTC Bearish scenario: A daily close below $68,152 could expose $65,082 and $62,405.
Bullish recovery: Reclaiming $72,005 could open a recovery towards $73,642.
$BTC Bearish scenario: A daily close below $68,152 could expose $65,082 and $62,405.
Bullish recovery: Reclaiming $72,005 could open a recovery towards $73,642.
Bullish recovery: Reclaiming $72,005 could open a recovery towards $73,642.
73
·
--
翻訳参照
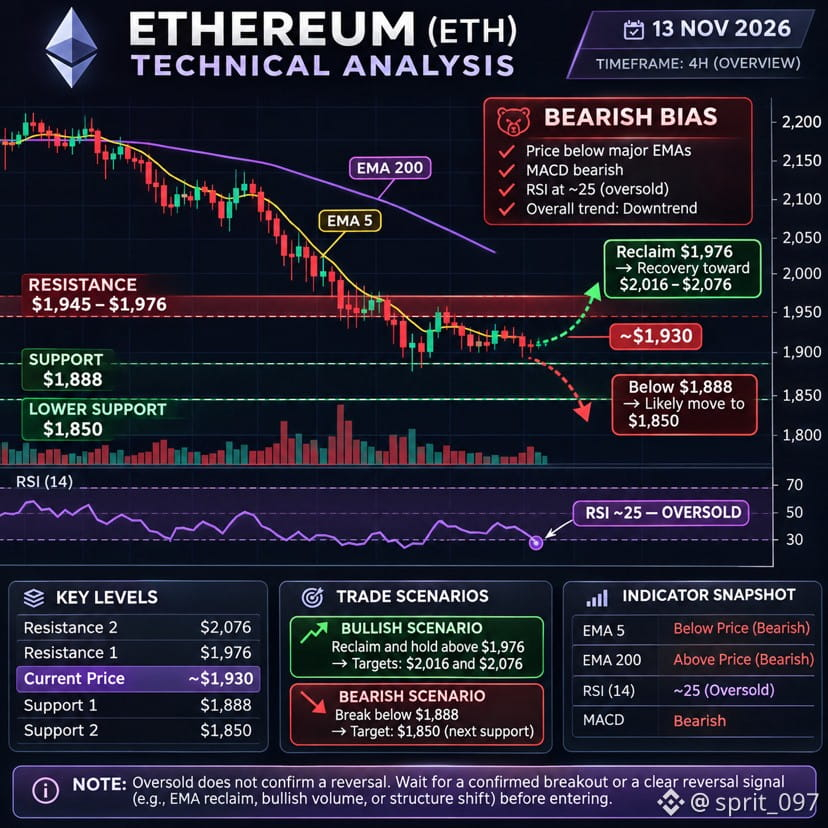
$ETH is trading below its major moving averages.
MACD is bearish.
RSI at 24.7 indicates oversold conditions.
A relief bounce is possible, but a confirmed reversal is not established.
$ETH is trading below its major moving averages.
MACD is bearish.
RSI at 24.7 indicates oversold conditions.
A relief bounce is possible, but a confirmed reversal is not established.
MACD is bearish.
RSI at 24.7 indicates oversold conditions.
A relief bounce is possible, but a confirmed reversal is not established.
73
·
--
翻訳参照
$BTC $ETH As of 13 November 2026, Bitcoin and Ethereum are showing bearish market conditions. Both are struggling to recover after the recent sell-off.
$BTC $ETH As of 13 November 2026, Bitcoin and Ethereum are showing bearish market conditions. Both are struggling to recover after the recent sell-off.
54
·
--
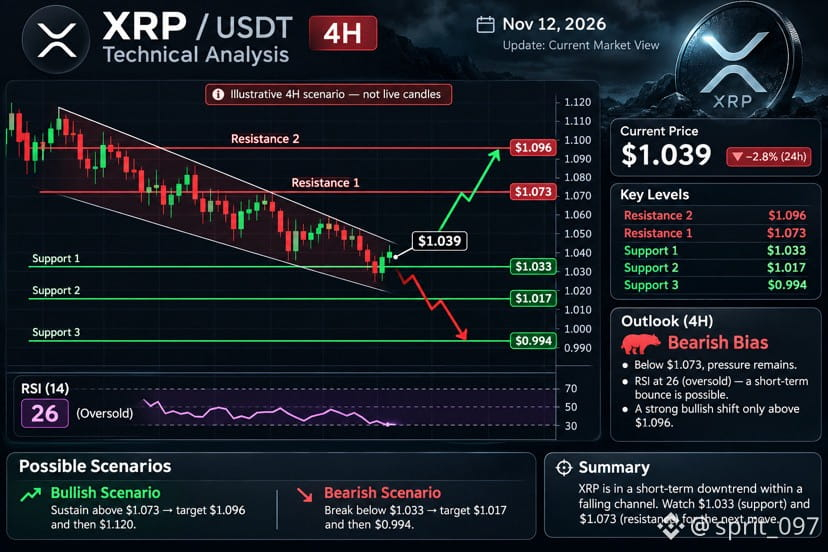
$XRP は高値を切り下げ、売り圧力が続いており、下降トレンドにあります。RSIは26付近で売られ過ぎを示しているため、一時的な反発の可能性があります
$XRP は高値を切り下げ、売り圧力が続いており、下降トレンドにあります。RSIは26付近で売られ過ぎを示しているため、一時的な反発の可能性があります
285
·
--
翻訳参照
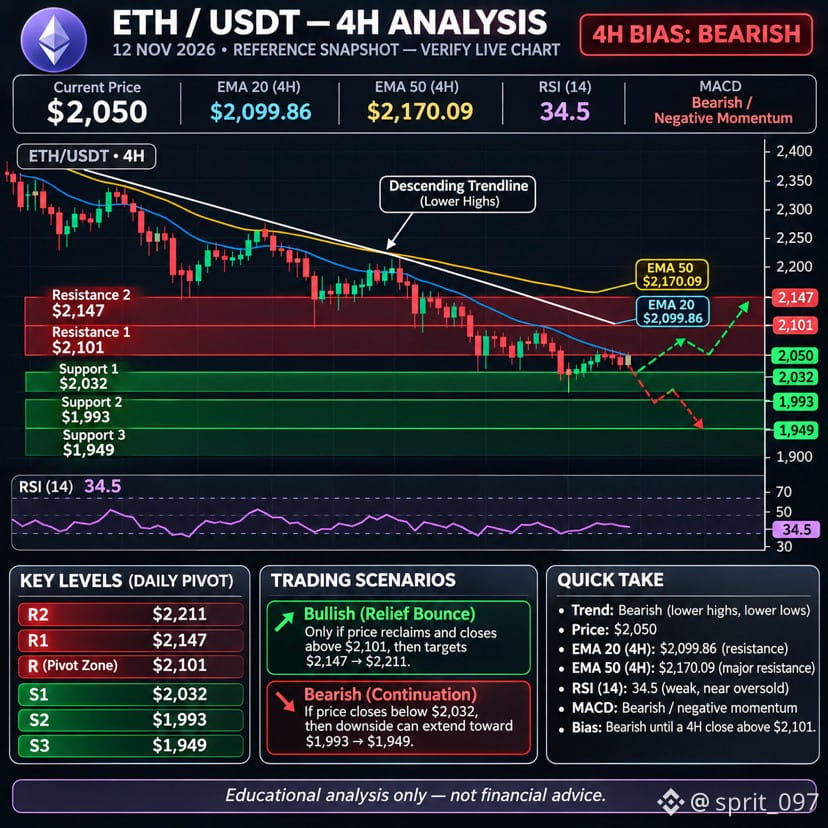
$ETH Current technical analysis
Key levels:
Resistance 1: $2,101
Resistance 2: $2,147
Support 1: $2,032
Support 2: $1,993
Support 3: $1,949
Technical indicators:
RSI: 34.5
EMA 20: $2,099.86
EMA 50: $2,170.09
MACD: Bearish
My bias: Bearish until ETH reclaims $2,101 on a confirmed 4H close. A break below $2,032 could open further downside
$ETH Current technical analysis
Key levels:
Resistance 1: $2,101
Resistance 2: $2,147
Support 1: $2,032
Support 2: $1,993
Support 3: $1,949
Technical indicators:
RSI: 34.5
EMA 20: $2,099.86
EMA 50: $2,170.09
MACD: Bearish
My bias: Bearish until ETH reclaims $2,101 on a confirmed 4H close. A break below $2,032 could open further downside
Key levels:
Resistance 1: $2,101
Resistance 2: $2,147
Support 1: $2,032
Support 2: $1,993
Support 3: $1,949
Technical indicators:
RSI: 34.5
EMA 20: $2,099.86
EMA 50: $2,170.09
MACD: Bearish
My bias: Bearish until ETH reclaims $2,101 on a confirmed 4H close. A break below $2,032 could open further downside
117
·
--
翻訳参照
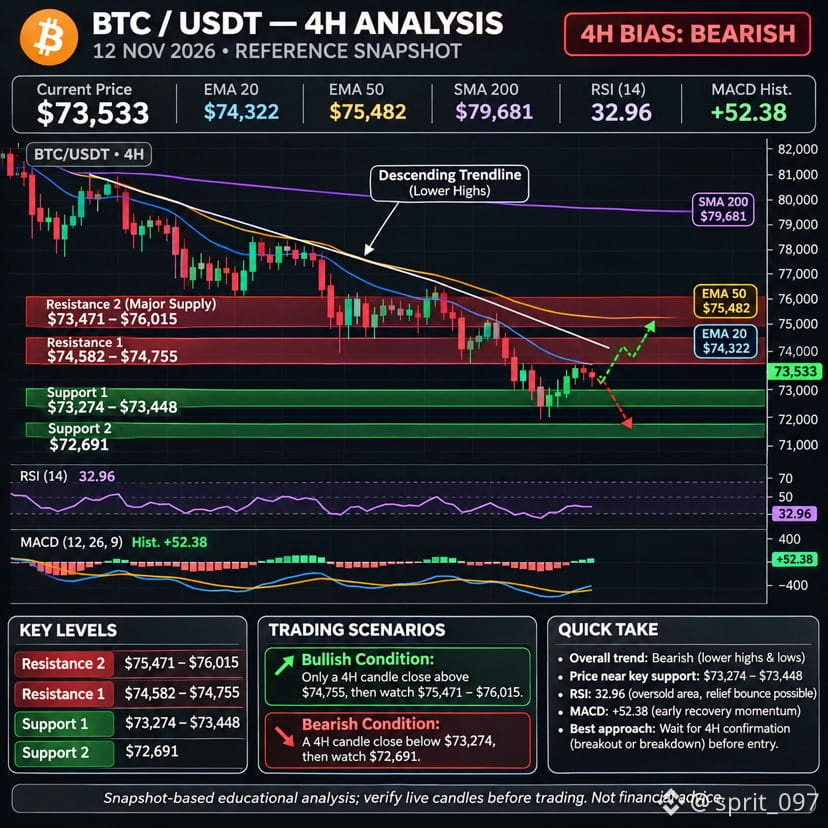
$BTC is still in a bearish trend. MACD has started showing positive momentum, which could indicate a temporary relief bounce, not necessarily a trend reversal. 
2. Important support and resistance
$BTC is still in a bearish trend. MACD has started showing positive momentum, which could indicate a temporary relief bounce, not necessarily a trend reversal. 
2. Important support and resistance
2. Important support and resistance
96
ログインして、さらにコンテンツを読む
厳選トピックで世界の暗号資産トレーダーの仲間入り
⚡️ 暗号資産に関する最新かつ有益な情報が見つかります。
💬 世界最大の暗号資産取引所から信頼されています。
👍 認証を受けたクリエイターから、有益なインサイトを得られます。
メール / 電話番号