
Jenell Kloska v2WD
6 投稿

Jenell Kloska v2WD
報告
ユーザーをブロック
取引を発注
2.5年
1 フォロー
0 フォロワー
3 いいね
投稿
ポートフォリオ
翻訳参照
🚀 TRUMP (Official Trump): Is a Market Comeback Possible?
The TRUMP/USDT market is showing signs of short-term movement, bringing renewed attention to this popular meme coin.
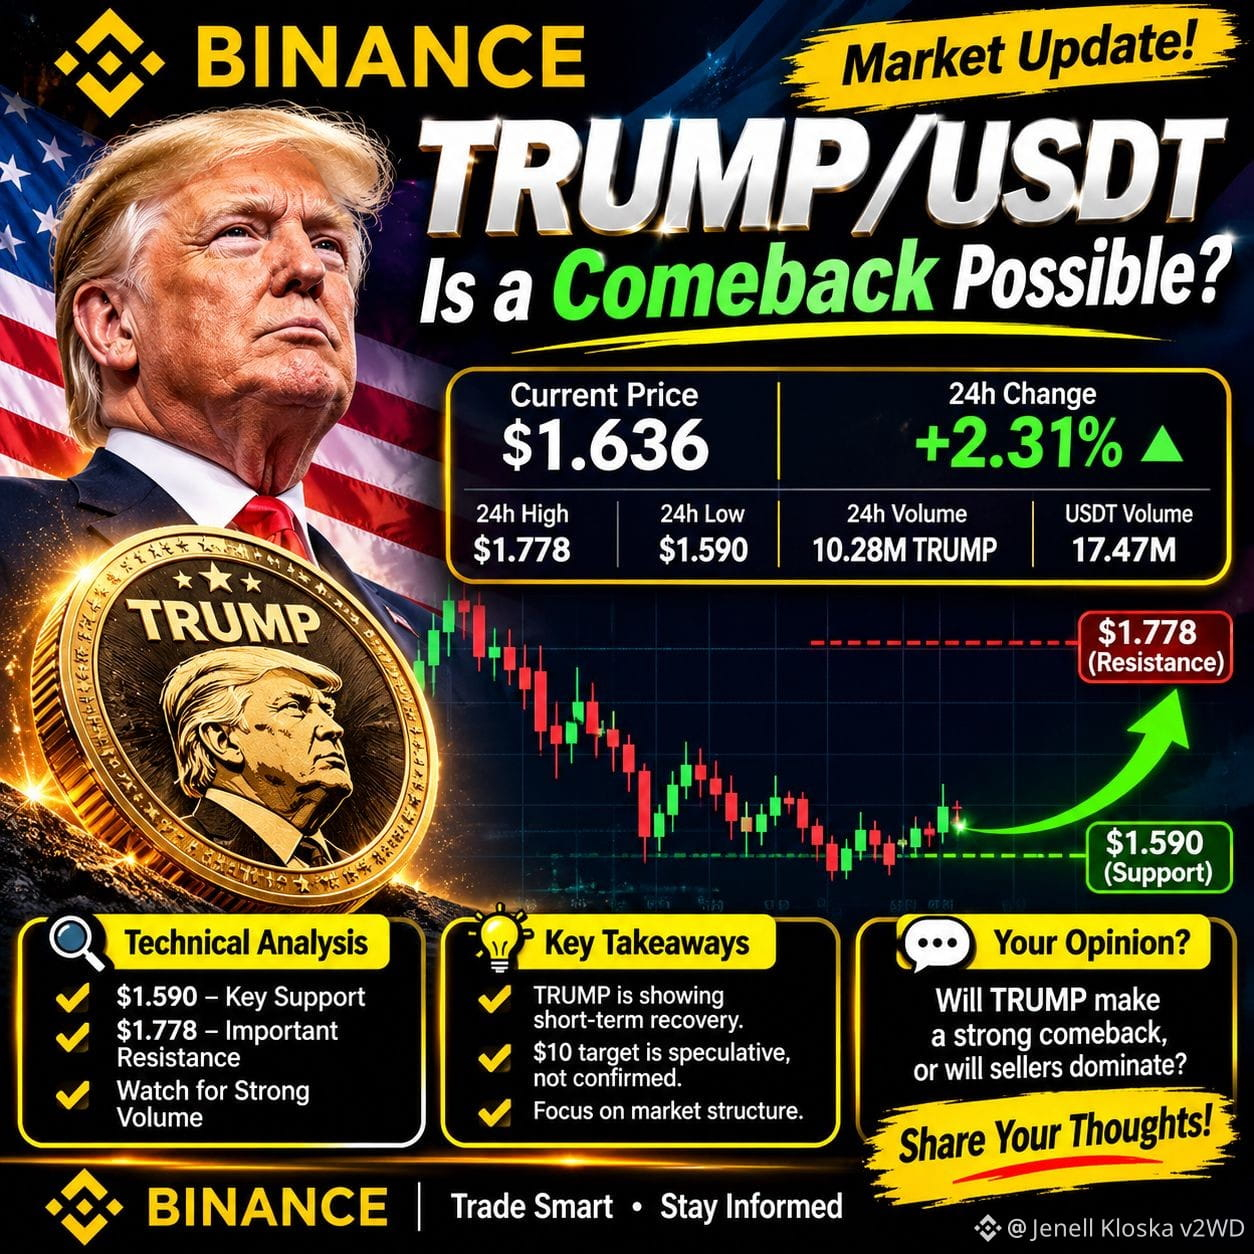
According to the supplied Binance screenshot, TRUMP is trading around $1.636, with a 24-hour gain of 2.31%.
📊 Market Overview
🟢 Current Price: $1.636
📈 24H Change: +2.31%
⬆️ 24H High: $1.778
⬇️ 24H Low: $1.590
💰 24H Trading Volume: 10.28M TRUMP
💵 USDT Volume: 17.47M
🔍 Technical Analysis
The weekly chart shows that TRUMP has experienced a significant decline from its previous highs.
Recent price action suggests some short-term stabilization.
The $1.590 area is worth monitoring as a potential support zone.
The $1.778 level is an important nearby resistance to watch.
A stronger recovery would need confirmation from price action and trading volume.
🚀 Could TRUMP Reach $10?
The $10 target shown in the shared chart is a speculative long-term idea, not a confirmed price prediction.
For now, traders should focus on market structure, volume, and important price levels rather than unrealistic expectations.
💬 Your Opinion Matters!
Do you believe Official Trump can make a strong comeback, or will sellers remain in control?
Share your analysis below! 👇
#TRUMP #trumpusdt #OfficialTrump #CryptoNews #Memecoins__ #BinanceSquare #CryptoAnalysis
Disclaimer: Original educational content based on the supplied screenshot. Market figures may change. This is not financial advice.
🚀 TRUMP (Official Trump): Is a Market Comeback Possible?
The TRUMP/USDT market is showing signs of short-term movement, bringing renewed attention to this popular meme coin.
According to the supplied Binance screenshot, TRUMP is trading around $1.636, with a 24-hour gain of 2.31%.
📊 Market Overview
🟢 Current Price: $1.636
📈 24H Change: +2.31%
⬆️ 24H High: $1.778
⬇️ 24H Low: $1.590
💰 24H Trading Volume: 10.28M TRUMP
💵 USDT Volume: 17.47M
🔍 Technical Analysis
The weekly chart shows that TRUMP has experienced a significant decline from its previous highs.
Recent price action suggests some short-term stabilization.
The $1.590 area is worth monitoring as a potential support zone.
The $1.778 level is an important nearby resistance to watch.
A stronger recovery would need confirmation from price action and trading volume.
🚀 Could TRUMP Reach $10?
The $10 target shown in the shared chart is a speculative long-term idea, not a confirmed price prediction.
For now, traders should focus on market structure, volume, and important price levels rather than unrealistic expectations.
💬 Your Opinion Matters!
Do you believe Official Trump can make a strong comeback, or will sellers remain in control?
Share your analysis below! 👇
#TRUMP #trumpusdt #OfficialTrump #CryptoNews #Memecoins__ #BinanceSquare #CryptoAnalysis
Disclaimer: Original educational content based on the supplied screenshot. Market figures may change. This is not financial advice.
The TRUMP/USDT market is showing signs of short-term movement, bringing renewed attention to this popular meme coin.
According to the supplied Binance screenshot, TRUMP is trading around $1.636, with a 24-hour gain of 2.31%.
📊 Market Overview
🟢 Current Price: $1.636
📈 24H Change: +2.31%
⬆️ 24H High: $1.778
⬇️ 24H Low: $1.590
💰 24H Trading Volume: 10.28M TRUMP
💵 USDT Volume: 17.47M
🔍 Technical Analysis
The weekly chart shows that TRUMP has experienced a significant decline from its previous highs.
Recent price action suggests some short-term stabilization.
The $1.590 area is worth monitoring as a potential support zone.
The $1.778 level is an important nearby resistance to watch.
A stronger recovery would need confirmation from price action and trading volume.
🚀 Could TRUMP Reach $10?
The $10 target shown in the shared chart is a speculative long-term idea, not a confirmed price prediction.
For now, traders should focus on market structure, volume, and important price levels rather than unrealistic expectations.
💬 Your Opinion Matters!
Do you believe Official Trump can make a strong comeback, or will sellers remain in control?
Share your analysis below! 👇
#TRUMP #trumpusdt #OfficialTrump #CryptoNews #Memecoins__ #BinanceSquare #CryptoAnalysis
Disclaimer: Original educational content based on the supplied screenshot. Market figures may change. This is not financial advice.
1
259
翻訳参照
🚀 3 Crypto Coins Showing Strong Momentum: LYN, IDOL & ESPORTS!
The crypto market is showing interesting activity as three altcoins stand out in the supplied Binance screenshot.
📊 Top 3 Coins in the Snapshot
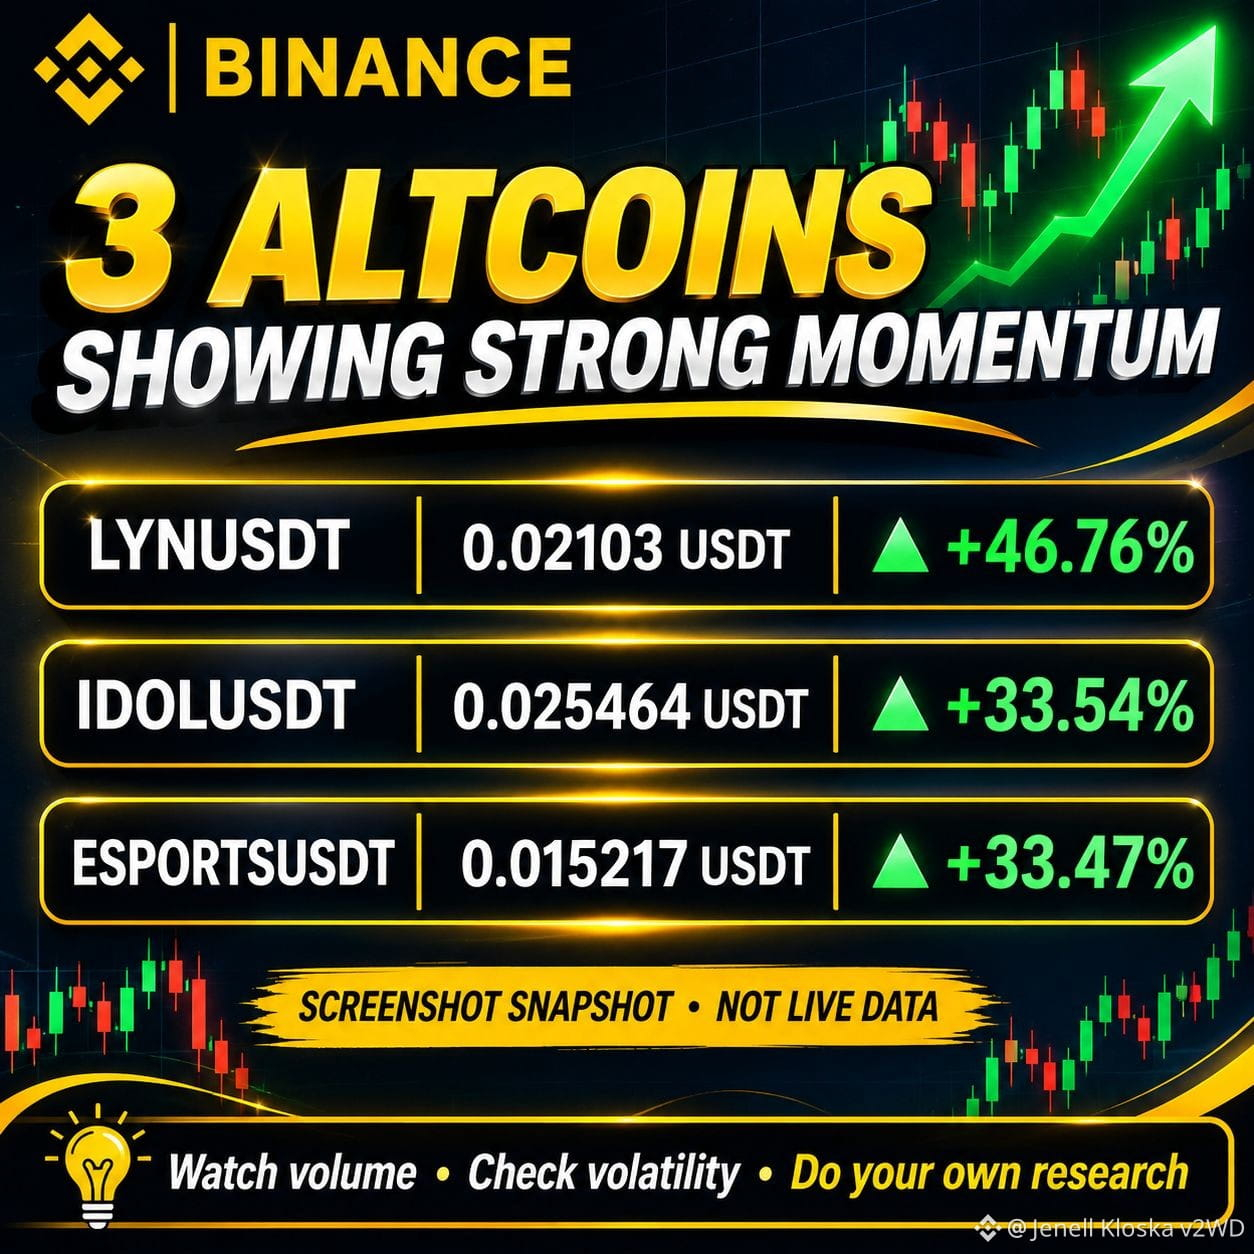
🟢 1. LYNUSDT
Price: 0.02103 USDT
Change: +46.76%
🟢 2. IDOLUSDT
Price: 0.025464 USDT
Change: +33.54%
🟢 3. ESPORTSUSDT
Price: 0.015217 USDT
Change: +33.47%
🔍 What Makes This Interesting?
All three coins are showing notable positive percentage changes in the screenshot.
However, strong short-term gains do not automatically mean a continuing uptrend.
Traders should monitor:
Trading volume
Price stability
Support and resistance
Sudden volatility and profit-taking
💡 Final Thoughts
These three coins are worth watching, but the next move remains uncertain. Always research a project before making any trading decision.
Which coin has caught your attention: LYN, IDOL, or ESPORTS?
👇 Share your thoughts!
#BinanceSquare #CryptoNews #LYN #LYN #ESPORTS #Altcoins #CryptoMarket
Disclaimer: Original educational market commentary based on the supplied screenshot. Figures are not verified live prices or investment advice.
🚀 3 Crypto Coins Showing Strong Momentum: LYN, IDOL & ESPORTS!
The crypto market is showing interesting activity as three altcoins stand out in the supplied Binance screenshot.
📊 Top 3 Coins in the Snapshot
🟢 1. LYNUSDT
Price: 0.02103 USDT
Change: +46.76%
🟢 2. IDOLUSDT
Price: 0.025464 USDT
Change: +33.54%
🟢 3. ESPORTSUSDT
Price: 0.015217 USDT
Change: +33.47%
🔍 What Makes This Interesting?
All three coins are showing notable positive percentage changes in the screenshot.
However, strong short-term gains do not automatically mean a continuing uptrend.
Traders should monitor:
Trading volume
Price stability
Support and resistance
Sudden volatility and profit-taking
💡 Final Thoughts
These three coins are worth watching, but the next move remains uncertain. Always research a project before making any trading decision.
Which coin has caught your attention: LYN, IDOL, or ESPORTS?
👇 Share your thoughts!
#BinanceSquare #CryptoNews #LYN #LYN #ESPORTS #Altcoins #CryptoMarket
Disclaimer: Original educational market commentary based on the supplied screenshot. Figures are not verified live prices or investment advice.
The crypto market is showing interesting activity as three altcoins stand out in the supplied Binance screenshot.
📊 Top 3 Coins in the Snapshot
🟢 1. LYNUSDT
Price: 0.02103 USDT
Change: +46.76%
🟢 2. IDOLUSDT
Price: 0.025464 USDT
Change: +33.54%
🟢 3. ESPORTSUSDT
Price: 0.015217 USDT
Change: +33.47%
🔍 What Makes This Interesting?
All three coins are showing notable positive percentage changes in the screenshot.
However, strong short-term gains do not automatically mean a continuing uptrend.
Traders should monitor:
Trading volume
Price stability
Support and resistance
Sudden volatility and profit-taking
💡 Final Thoughts
These three coins are worth watching, but the next move remains uncertain. Always research a project before making any trading decision.
Which coin has caught your attention: LYN, IDOL, or ESPORTS?
👇 Share your thoughts!
#BinanceSquare #CryptoNews #LYN #LYN #ESPORTS #Altcoins #CryptoMarket
Disclaimer: Original educational market commentary based on the supplied screenshot. Figures are not verified live prices or investment advice.
735
🚨 LUNC市場ウォッチ:復活の可能性は?
Terra Luna Classic(LUNC)は、トレーダーが最新の価格変動や重要なテクニカル水準を注視するなか、注目を集めています。
📊 注目すべき主要水準
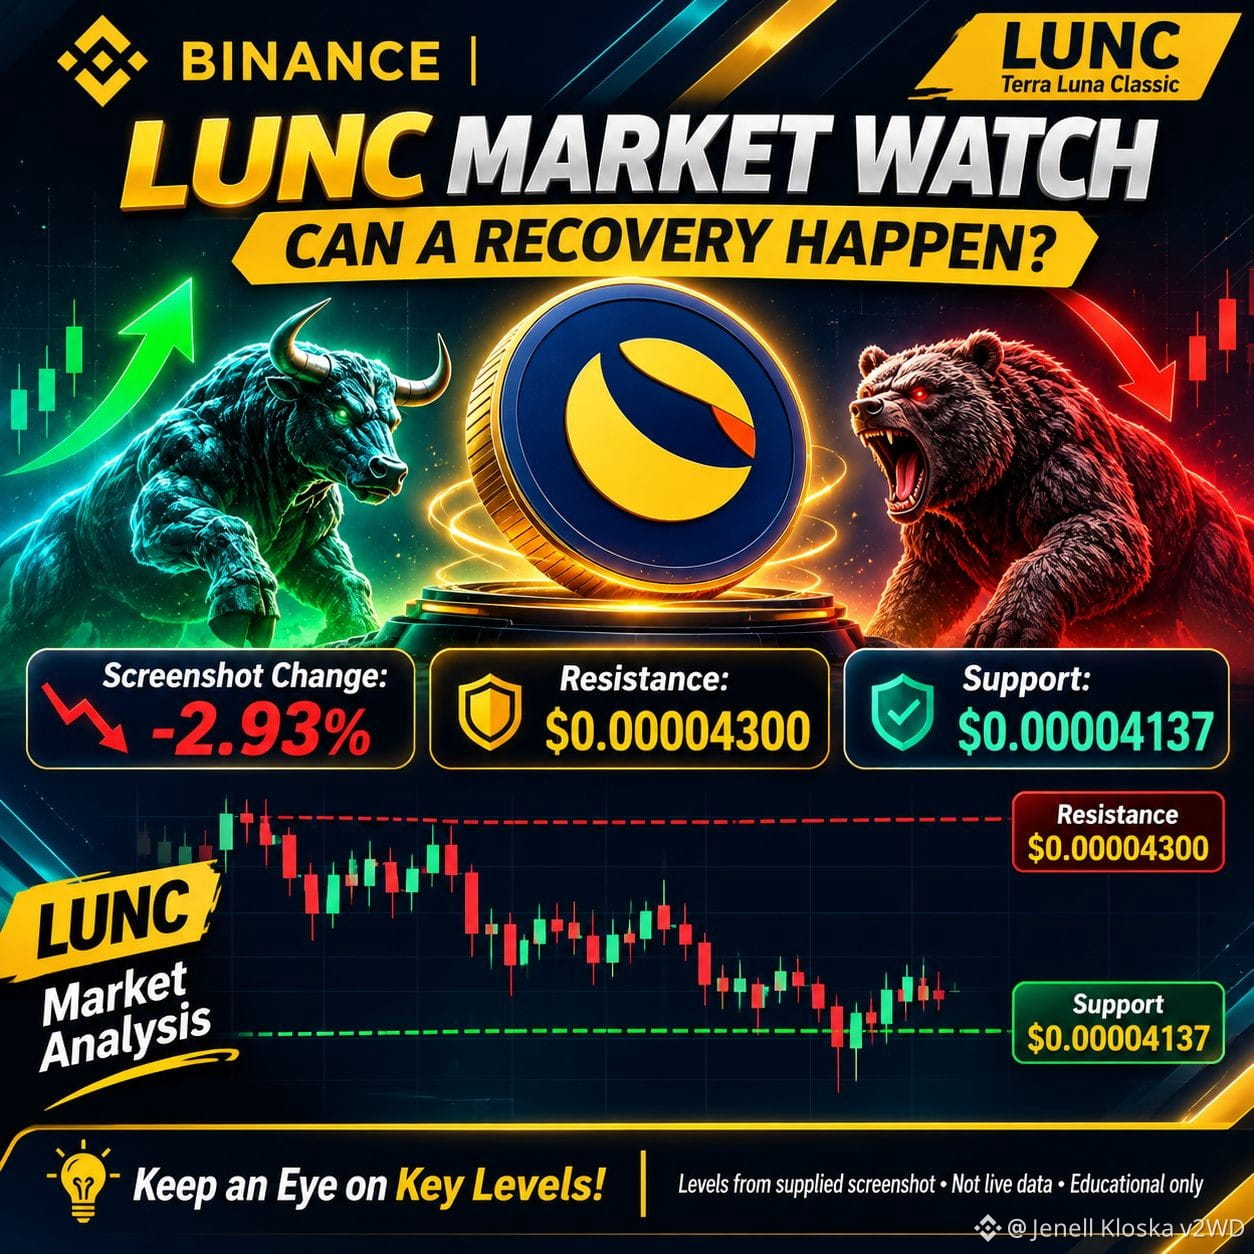
🔴 レジスタンス:$0.00004300
🟢 サポート:$0.00004137
📉 スクリーンショット時点の価格変動:-2.93%
🔍 次に何が起こる可能性がある?
1. 強気シナリオ:
LUNCが$0.00004300のレジスタンスを上抜けできれば、買い手の自信が高まり、回復に向かう可能性があります。
2. 弱気シナリオ:
$0.00004137のサポートを維持できなければ、さらなる下落圧力が強まる可能性があります。
3. 市場センチメント:
反転の可能性について結論を出す前に、トレーダーは出来高とモメンタムを注視するべきです。
💡 最後に
LUNCは引き続き注目に値するトークンですが、復活が確定したわけではありません。次の動きは、価格がこれらの重要な水準付近でどのように反応するかに左右されます。
回復の可能性を期待してLUNCを注視していますか?それとも、さらなる下落を予想していますか?
👇 あなたの考えを聞かせてください!
#LUNC #TerraClassic #CryptoNews #BinanceSquare #Altcoins #暗号資産分析
免責事項:提供されたスクリーンショットに基づく、教育目的のオリジナル解説です。リアルタイムの市場データではなく、金融アドバイスでもありません。
🚨 LUNC市場ウォッチ:復活の可能性は?
Terra Luna Classic(LUNC)は、トレーダーが最新の価格変動や重要なテクニカル水準を注視するなか、注目を集めています。
📊 注目すべき主要水準
🔴 レジスタンス:$0.00004300
🟢 サポート:$0.00004137
📉 スクリーンショット時点の価格変動:-2.93%
🔍 次に何が起こる可能性がある?
1. 強気シナリオ:
LUNCが$0.00004300のレジスタンスを上抜けできれば、買い手の自信が高まり、回復に向かう可能性があります。
2. 弱気シナリオ:
$0.00004137のサポートを維持できなければ、さらなる下落圧力が強まる可能性があります。
3. 市場センチメント:
反転の可能性について結論を出す前に、トレーダーは出来高とモメンタムを注視するべきです。
💡 最後に
LUNCは引き続き注目に値するトークンですが、復活が確定したわけではありません。次の動きは、価格がこれらの重要な水準付近でどのように反応するかに左右されます。
回復の可能性を期待してLUNCを注視していますか?それとも、さらなる下落を予想していますか?
👇 あなたの考えを聞かせてください!
#LUNC #TerraClassic #CryptoNews #BinanceSquare #Altcoins #暗号資産分析
免責事項:提供されたスクリーンショットに基づく、教育目的のオリジナル解説です。リアルタイムの市場データではなく、金融アドバイスでもありません。
Terra Luna Classic(LUNC)は、トレーダーが最新の価格変動や重要なテクニカル水準を注視するなか、注目を集めています。
📊 注目すべき主要水準
🔴 レジスタンス:$0.00004300
🟢 サポート:$0.00004137
📉 スクリーンショット時点の価格変動:-2.93%
🔍 次に何が起こる可能性がある?
1. 強気シナリオ:
LUNCが$0.00004300のレジスタンスを上抜けできれば、買い手の自信が高まり、回復に向かう可能性があります。
2. 弱気シナリオ:
$0.00004137のサポートを維持できなければ、さらなる下落圧力が強まる可能性があります。
3. 市場センチメント:
反転の可能性について結論を出す前に、トレーダーは出来高とモメンタムを注視するべきです。
💡 最後に
LUNCは引き続き注目に値するトークンですが、復活が確定したわけではありません。次の動きは、価格がこれらの重要な水準付近でどのように反応するかに左右されます。
回復の可能性を期待してLUNCを注視していますか?それとも、さらなる下落を予想していますか?
👇 あなたの考えを聞かせてください!
#LUNC #TerraClassic #CryptoNews #BinanceSquare #Altcoins #暗号資産分析
免責事項:提供されたスクリーンショットに基づく、教育目的のオリジナル解説です。リアルタイムの市場データではなく、金融アドバイスでもありません。
2
380
🚨 QUSDT最新情報:Quack AIに短期的な回復の兆し
Quack AI(QUSDT)は、価格が下落していた期間を経て注目を集めています。
提供されたBinanceチャートのスナップショットによると:
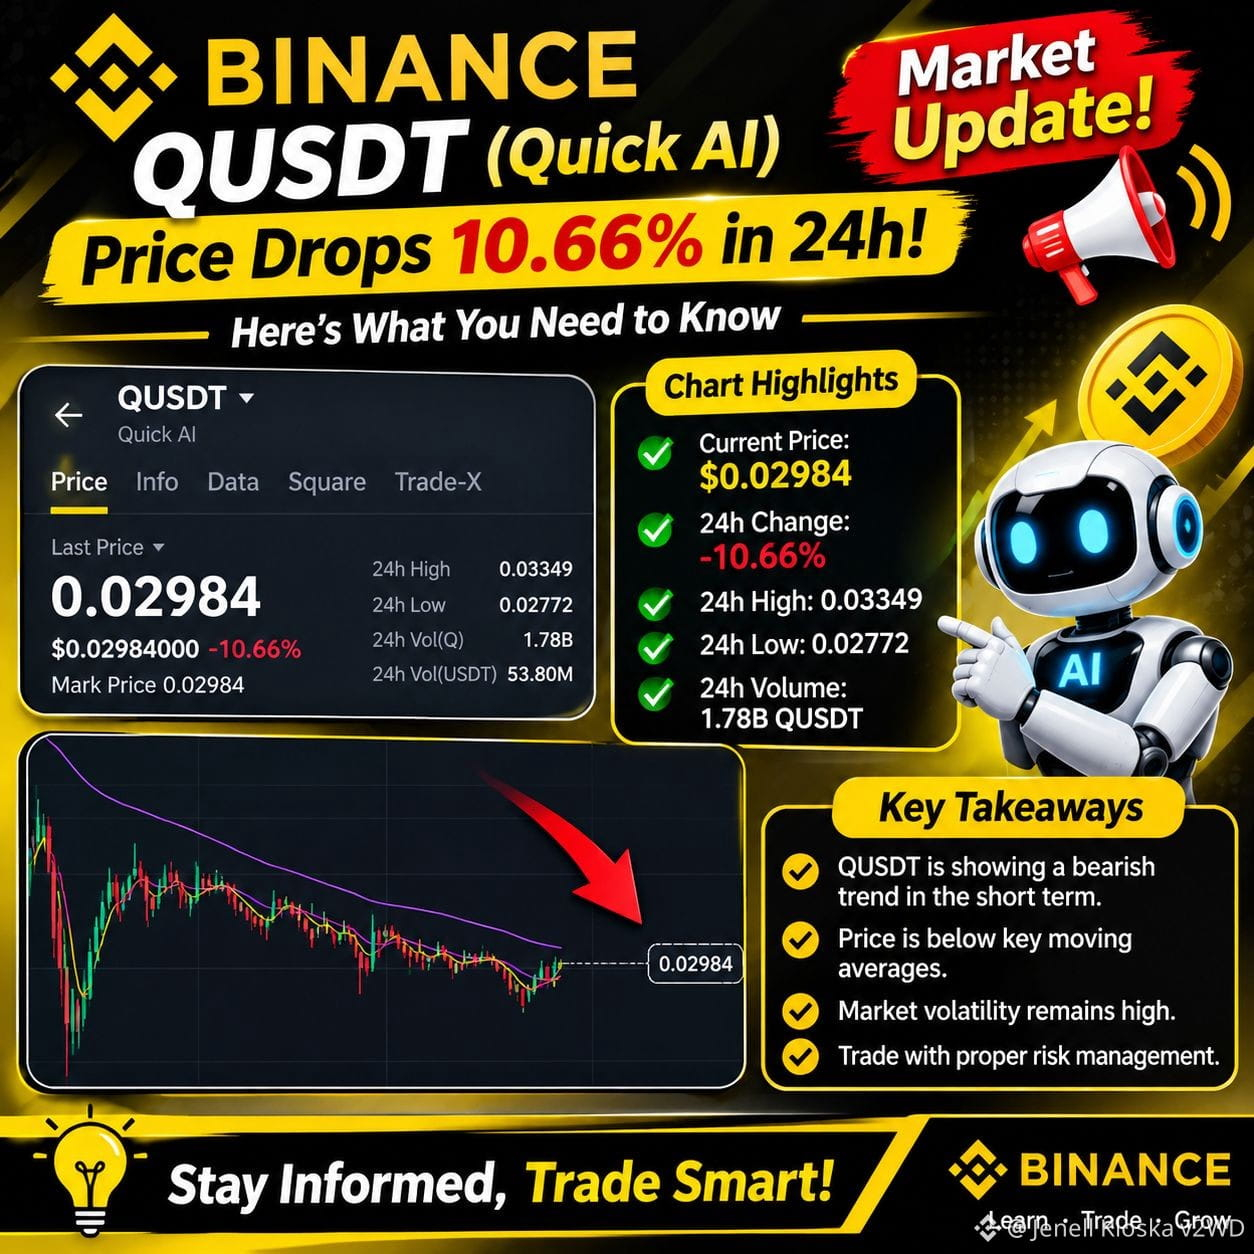
📍 現在価格:$0.02984
📉 24時間騰落率:-10.66%
📈 24時間高値:$0.03349
📉 24時間安値:$0.02772
📊 24時間取引量:1.78B Q
💵 USDT取引量:53.80M
🔍 テクニカル概要
EMA 7:0.029185
EMA 25:0.029119
EMA 99:0.030608
RSI(6):80.66
短期チャートでは、直近のローソク足付近で小幅な回復が見られます。ただし、価格はEMA 99を下回っているため、より広い短期トレンドについては引き続き注意が必要です。
👀 次に注目すべき点は?
トレーダーは、QUSDTが直近の回復基調を維持し、近くのレジスタンス水準を上抜けられるかどうかに注目するとよいでしょう。
ボラティリティが高いため、上昇・下落のどちらに動く可能性もあります。
最新情報を確認し、リスクを管理したうえで、必ずご自身でも調査してください。
#QUSDT #QuackAI #BinanceSquare #CryptoAnalysis #altcoins #CryptoNews
免責事項:提供されたスクリーンショットに基づく教育目的の市場解説であり、リアルタイムの市場データや金融アドバイスではありません。
🚨 QUSDT最新情報:Quack AIに短期的な回復の兆し
Quack AI(QUSDT)は、価格が下落していた期間を経て注目を集めています。
提供されたBinanceチャートのスナップショットによると:
📍 現在価格:$0.02984
📉 24時間騰落率:-10.66%
📈 24時間高値:$0.03349
📉 24時間安値:$0.02772
📊 24時間取引量:1.78B Q
💵 USDT取引量:53.80M
🔍 テクニカル概要
EMA 7:0.029185
EMA 25:0.029119
EMA 99:0.030608
RSI(6):80.66
短期チャートでは、直近のローソク足付近で小幅な回復が見られます。ただし、価格はEMA 99を下回っているため、より広い短期トレンドについては引き続き注意が必要です。
👀 次に注目すべき点は?
トレーダーは、QUSDTが直近の回復基調を維持し、近くのレジスタンス水準を上抜けられるかどうかに注目するとよいでしょう。
ボラティリティが高いため、上昇・下落のどちらに動く可能性もあります。
最新情報を確認し、リスクを管理したうえで、必ずご自身でも調査してください。
#QUSDT #QuackAI #BinanceSquare #CryptoAnalysis #altcoins #CryptoNews
免責事項:提供されたスクリーンショットに基づく教育目的の市場解説であり、リアルタイムの市場データや金融アドバイスではありません。
Quack AI(QUSDT)は、価格が下落していた期間を経て注目を集めています。
提供されたBinanceチャートのスナップショットによると:
📍 現在価格:$0.02984
📉 24時間騰落率:-10.66%
📈 24時間高値:$0.03349
📉 24時間安値:$0.02772
📊 24時間取引量:1.78B Q
💵 USDT取引量:53.80M
🔍 テクニカル概要
EMA 7:0.029185
EMA 25:0.029119
EMA 99:0.030608
RSI(6):80.66
短期チャートでは、直近のローソク足付近で小幅な回復が見られます。ただし、価格はEMA 99を下回っているため、より広い短期トレンドについては引き続き注意が必要です。
👀 次に注目すべき点は?
トレーダーは、QUSDTが直近の回復基調を維持し、近くのレジスタンス水準を上抜けられるかどうかに注目するとよいでしょう。
ボラティリティが高いため、上昇・下落のどちらに動く可能性もあります。
最新情報を確認し、リスクを管理したうえで、必ずご自身でも調査してください。
#QUSDT #QuackAI #BinanceSquare #CryptoAnalysis #altcoins #CryptoNews
免責事項:提供されたスクリーンショットに基づく教育目的の市場解説であり、リアルタイムの市場データや金融アドバイスではありません。
803
翻訳参照
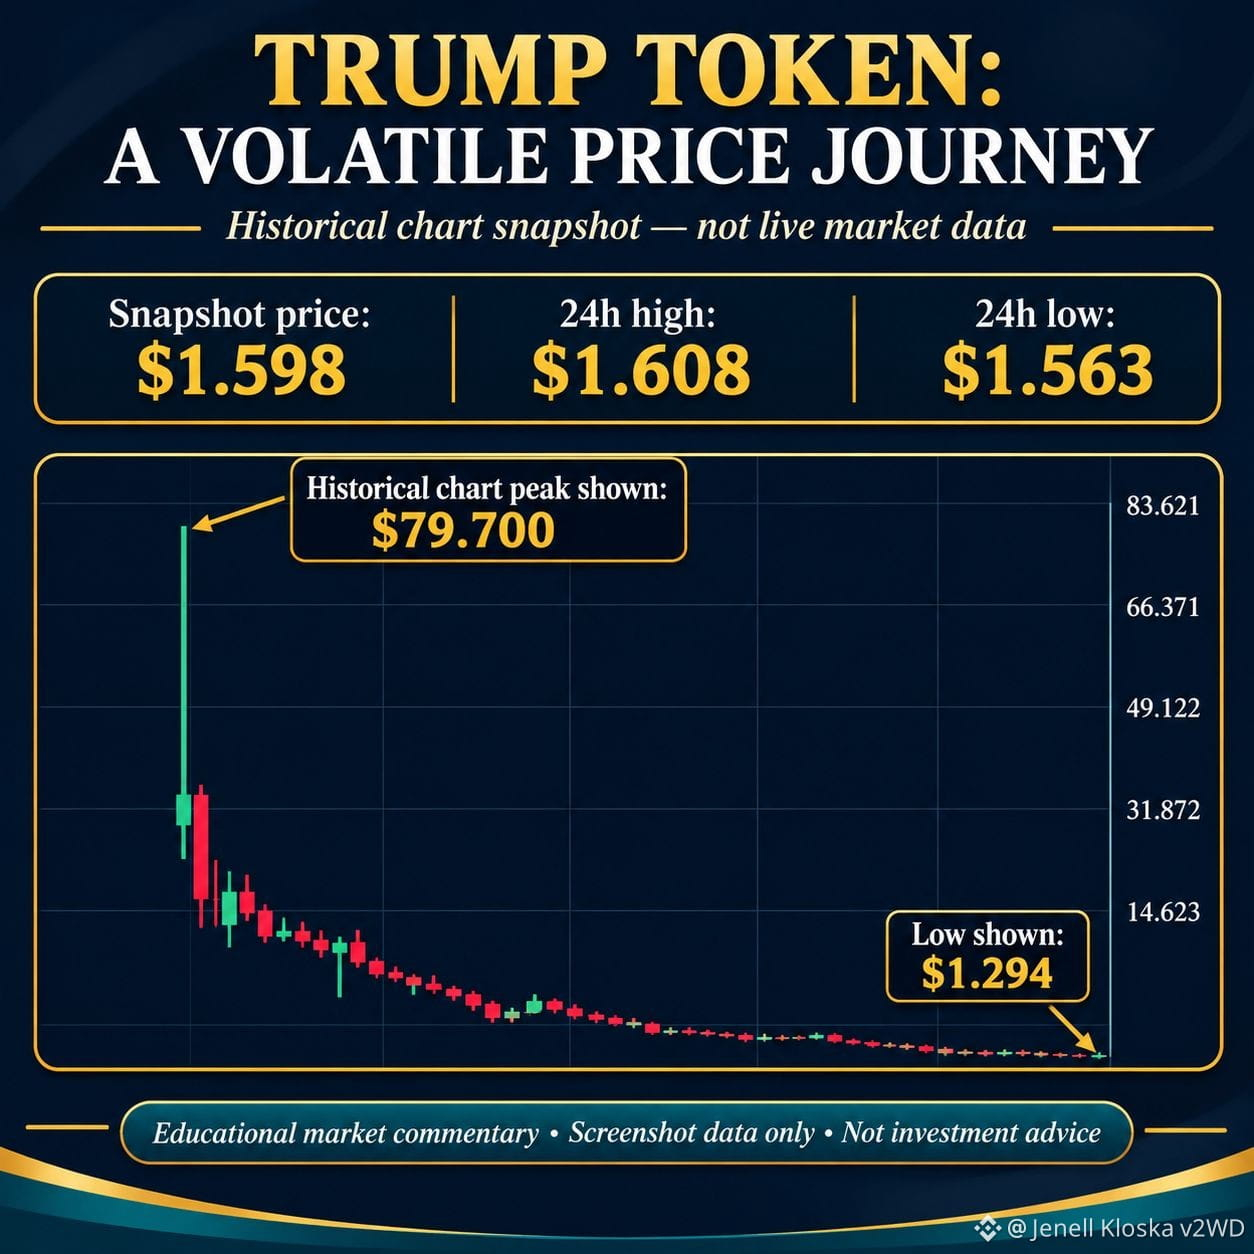
📊 TRUMP Token: A Volatile Price Journey
The TRUMP token chart highlights an interesting example of extreme cryptocurrency market volatility.
According to the supplied Binance screenshot:
📌 Snapshot Price: $1.598
📈 24H High: $1.608
📉 24H Low: $1.563
📊 24H TRUMP Volume: 14.18M
The historical chart shows a sharp initial price spike near $79.70, followed by a prolonged decline. The screenshot also shows a historical low near $1.294.
What Can We Learn?
Cryptocurrency prices can experience extreme volatility.
Historical price increases do not guarantee future gains.
Market volume and price trends should be studied carefully.
Risk awareness is important when learning about crypto markets.
Conclusion: The TRUMP chart is a reminder that cryptocurrency markets can change dramatically over time.
#BinanceSquare #TRUMP #CryptonewswithJack #CryptoMarket #MarketAnalysis2025 #Bitcoin❗ #CryptoEducationCZ
Disclaimer: This is educational commentary based on a supplied historical screenshot. Figures are not verified live prices and this is not financial advice.
📊 TRUMP Token: A Volatile Price Journey
The TRUMP token chart highlights an interesting example of extreme cryptocurrency market volatility.
According to the supplied Binance screenshot:
📌 Snapshot Price: $1.598
📈 24H High: $1.608
📉 24H Low: $1.563
📊 24H TRUMP Volume: 14.18M
The historical chart shows a sharp initial price spike near $79.70, followed by a prolonged decline. The screenshot also shows a historical low near $1.294.
What Can We Learn?
Cryptocurrency prices can experience extreme volatility.
Historical price increases do not guarantee future gains.
Market volume and price trends should be studied carefully.
Risk awareness is important when learning about crypto markets.
Conclusion: The TRUMP chart is a reminder that cryptocurrency markets can change dramatically over time.
#BinanceSquare #TRUMP #CryptonewswithJack #CryptoMarket #MarketAnalysis2025 #Bitcoin❗ #CryptoEducationCZ
Disclaimer: This is educational commentary based on a supplied historical screenshot. Figures are not verified live prices and this is not financial advice.
The TRUMP token chart highlights an interesting example of extreme cryptocurrency market volatility.
According to the supplied Binance screenshot:
📌 Snapshot Price: $1.598
📈 24H High: $1.608
📉 24H Low: $1.563
📊 24H TRUMP Volume: 14.18M
The historical chart shows a sharp initial price spike near $79.70, followed by a prolonged decline. The screenshot also shows a historical low near $1.294.
What Can We Learn?
Cryptocurrency prices can experience extreme volatility.
Historical price increases do not guarantee future gains.
Market volume and price trends should be studied carefully.
Risk awareness is important when learning about crypto markets.
Conclusion: The TRUMP chart is a reminder that cryptocurrency markets can change dramatically over time.
#BinanceSquare #TRUMP #CryptonewswithJack #CryptoMarket #MarketAnalysis2025 #Bitcoin❗ #CryptoEducationCZ
Disclaimer: This is educational commentary based on a supplied historical screenshot. Figures are not verified live prices and this is not financial advice.
285
ログインして、さらにコンテンツを読む
厳選トピックで世界の暗号資産トレーダーの仲間入り
⚡️ 暗号資産に関する最新かつ有益な情報が見つかります。
💬 世界最大の暗号資産取引所から信頼されています。
👍 認証を受けたクリエイターから、有益なインサイトを得られます。
メール / 電話番号