
Maida Sufyan
27 投稿

Maida Sufyan
報告
ユーザーをブロック
12 フォロー
9 フォロワー
13 いいね
投稿
·
--
$XRP
{spot}(XRPUSDT)
は約1.2562ドルで、過去24時間で+0.41%上昇しています。この間の取引価格は1.2423ドルから1.2646ドルの範囲でした。
短期トレンド:引き続き慎重です。XRPは過去7日間で-3.08%、過去30日間で-15.40%下落しています。
モメンタム:RSI(6)は36で中立ですが、過熱状態というよりは勢いの弱さに近い水準です。MACDはデッドクロスが続いており、SuperTrendも引き続き下降しているため、テクニカル面では弱含みの状況です。
注目すべき重要な価格帯:直近のレンジのサポートは約1.20ドルです。7日間の高値である約1.34ドルが、モメンタム改善に向けて最初に注目すべき水準です。現在の出来高は7日平均と比べて少なく、大口注文のフローは純流出を示しています。
私の投稿について教えてください。それと、良いアドバイスがあると言ってください😊
$XRP
は約1.2562ドルで、過去24時間で+0.41%上昇しています。この間の取引価格は1.2423ドルから1.2646ドルの範囲でした。
短期トレンド:引き続き慎重です。XRPは過去7日間で-3.08%、過去30日間で-15.40%下落しています。
モメンタム:RSI(6)は36で中立ですが、過熱状態というよりは勢いの弱さに近い水準です。MACDはデッドクロスが続いており、SuperTrendも引き続き下降しているため、テクニカル面では弱含みの状況です。
注目すべき重要な価格帯:直近のレンジのサポートは約1.20ドルです。7日間の高値である約1.34ドルが、モメンタム改善に向けて最初に注目すべき水準です。現在の出来高は7日平均と比べて少なく、大口注文のフローは純流出を示しています。
私の投稿について教えてください。それと、良いアドバイスがあると言ってください😊
は約1.2562ドルで、過去24時間で+0.41%上昇しています。この間の取引価格は1.2423ドルから1.2646ドルの範囲でした。
短期トレンド:引き続き慎重です。XRPは過去7日間で-3.08%、過去30日間で-15.40%下落しています。
モメンタム:RSI(6)は36で中立ですが、過熱状態というよりは勢いの弱さに近い水準です。MACDはデッドクロスが続いており、SuperTrendも引き続き下降しているため、テクニカル面では弱含みの状況です。
注目すべき重要な価格帯:直近のレンジのサポートは約1.20ドルです。7日間の高値である約1.34ドルが、モメンタム改善に向けて最初に注目すべき水準です。現在の出来高は7日平均と比べて少なく、大口注文のフローは純流出を示しています。
私の投稿について教えてください。それと、良いアドバイスがあると言ってください😊
206
·
--
翻訳参照
$ETH
{spot}(ETHUSDT)
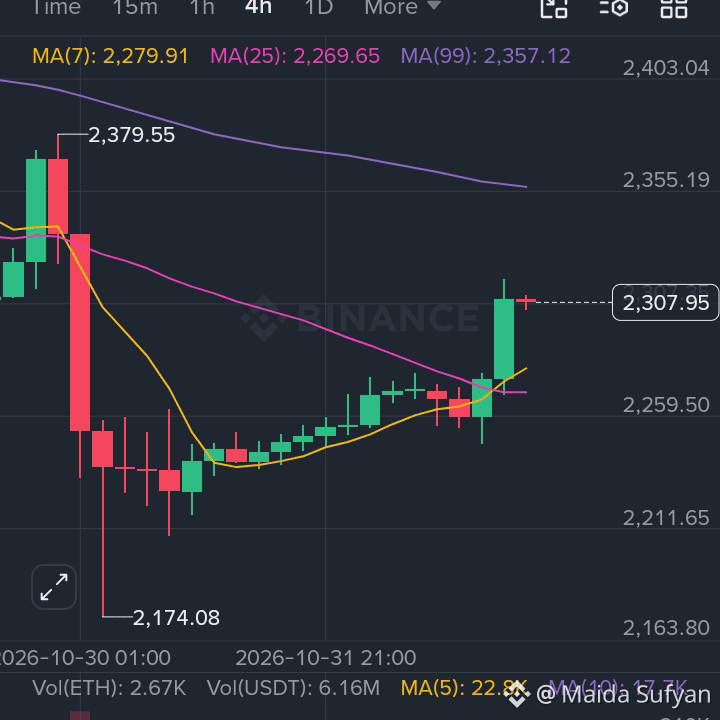
Current price: Around $2,295
Support: $2,251 / $2,206
Resistance: $2,327 / $2,373
RSI: 37.7 — weak momentum.
Trend: Short-term bearish, with a possible recovery if resistance breaks.
Market outlook:
A move above $2,327 could strengthen bullish momentum.
A break below $2,251 could increase selling pressure.
This is a market observation, not a guaranteed price prediction. Crypto prices are highly volatile.#BTCPayServerUrgesOperatorsToShutDownInstances #BinanceToResumePhaseOneOfWithdrawals #BTCPayServerUrgesOperatorsToShutDownInstances
$ETH
Current price: Around $2,295
Support: $2,251 / $2,206
Resistance: $2,327 / $2,373
RSI: 37.7 — weak momentum.
Trend: Short-term bearish, with a possible recovery if resistance breaks.
Market outlook:
A move above $2,327 could strengthen bullish momentum.
A break below $2,251 could increase selling pressure.
This is a market observation, not a guaranteed price prediction. Crypto prices are highly volatile.#BTCPayServerUrgesOperatorsToShutDownInstances #BinanceToResumePhaseOneOfWithdrawals #BTCPayServerUrgesOperatorsToShutDownInstances
Current price: Around $2,295
Support: $2,251 / $2,206
Resistance: $2,327 / $2,373
RSI: 37.7 — weak momentum.
Trend: Short-term bearish, with a possible recovery if resistance breaks.
Market outlook:
A move above $2,327 could strengthen bullish momentum.
A break below $2,251 could increase selling pressure.
This is a market observation, not a guaranteed price prediction. Crypto prices are highly volatile.#BTCPayServerUrgesOperatorsToShutDownInstances #BinanceToResumePhaseOneOfWithdrawals #BTCPayServerUrgesOperatorsToShutDownInstances
98
·
--
翻訳参照
$DOT is trading around $1.126 as of 2026-10-23, up about +0.8% over the past 24 hours. Its intraday range has been $1.103–$1.203, showing a modest rebound but also continued sensitivity around recent lows.
Fundamentally, Polkadot’s case still rests on its interoperable multi-chain architecture and ecosystem development. The key watchpoints are whether network activity, developer traction, and demand for DOT utility improve; without those, price momentum can remain fragile even if the broader crypto market strengthens.#SwedishCentralBankUrgesEKronaReview #BinancePick
{spot}(DOTUSDT)
$DOT is trading around $1.126 as of 2026-10-23, up about +0.8% over the past 24 hours. Its intraday range has been $1.103–$1.203, showing a modest rebound but also continued sensitivity around recent lows.
Fundamentally, Polkadot’s case still rests on its interoperable multi-chain architecture and ecosystem development. The key watchpoints are whether network activity, developer traction, and demand for DOT utility improve; without those, price momentum can remain fragile even if the broader crypto market strengthens.#SwedishCentralBankUrgesEKronaReview #BinancePick
Fundamentally, Polkadot’s case still rests on its interoperable multi-chain architecture and ecosystem development. The key watchpoints are whether network activity, developer traction, and demand for DOT utility improve; without those, price momentum can remain fragile even if the broader crypto market strengthens.#SwedishCentralBankUrgesEKronaReview #BinancePick
1
121
·
--
翻訳参照
$BTC
{spot}(BTCUSDT)
That shows short-term buying strength, but the nearby daily high is also an area where momentum may pause. Continuation would depend on BTC holding above the session open near $82.7K and whether volume remains supportive; a move back below that area would signal that the current push is losing traction.#EarningsSeason #OCCIssuesFirstFinalRuleUnderGENIUSAct
$BTC
That shows short-term buying strength, but the nearby daily high is also an area where momentum may pause. Continuation would depend on BTC holding above the session open near $82.7K and whether volume remains supportive; a move back below that area would signal that the current push is losing traction.#EarningsSeason #OCCIssuesFirstFinalRuleUnderGENIUSAct
That shows short-term buying strength, but the nearby daily high is also an area where momentum may pause. Continuation would depend on BTC holding above the session open near $82.7K and whether volume remains supportive; a move back below that area would signal that the current push is losing traction.#EarningsSeason #OCCIssuesFirstFinalRuleUnderGENIUSAct
80
·
--
翻訳参照
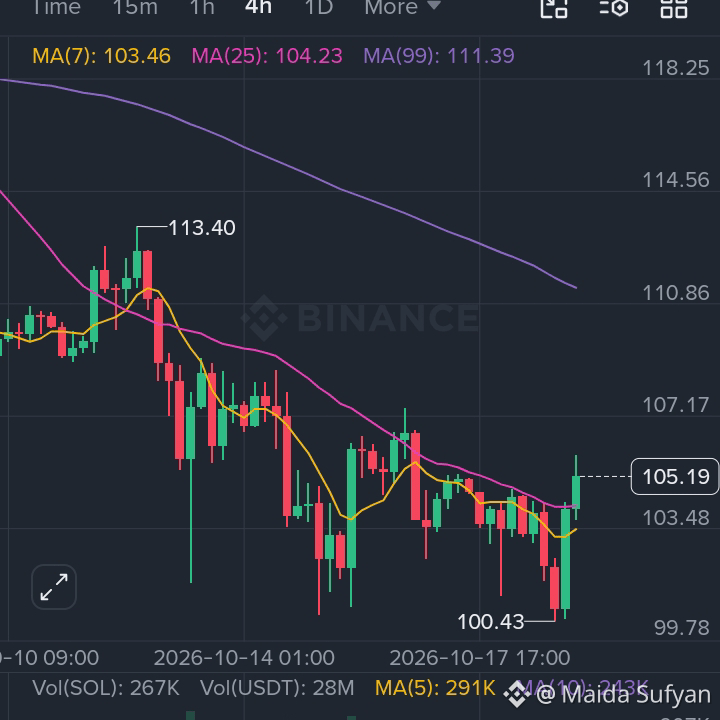
$SOL is around $105.22 as of 2026-10-19, up +0.5% over the past 24 hours. Its session range is $100.43–$105.90, so price is trading close to the day’s high.
The short-term picture is constructive only if SOL can keep holding near the upper end of that range with sustained volume. A move back below the day’s midpoint would indicate that buyers are losing momentum. Broader direction will also remain sensitive to BTC’s trend and overall risk appetite across major altcoins.#GrayscaleAndRepublicLaunchThreeCryptoFunds #ElSalvadorBitcoinHoldingsSurpass7800BTC #CelestiaRises16%To2026High
{spot}(SOLUSDT)
$SOL is around $105.22 as of 2026-10-19, up +0.5% over the past 24 hours. Its session range is $100.43–$105.90, so price is trading close to the day’s high.
The short-term picture is constructive only if SOL can keep holding near the upper end of that range with sustained volume. A move back below the day’s midpoint would indicate that buyers are losing momentum. Broader direction will also remain sensitive to BTC’s trend and overall risk appetite across major altcoins.#GrayscaleAndRepublicLaunchThreeCryptoFunds #ElSalvadorBitcoinHoldingsSurpass7800BTC #CelestiaRises16%To2026High
The short-term picture is constructive only if SOL can keep holding near the upper end of that range with sustained volume. A move back below the day’s midpoint would indicate that buyers are losing momentum. Broader direction will also remain sensitive to BTC’s trend and overall risk appetite across major altcoins.#GrayscaleAndRepublicLaunchThreeCryptoFunds #ElSalvadorBitcoinHoldingsSurpass7800BTC #CelestiaRises16%To2026High
90
·
--
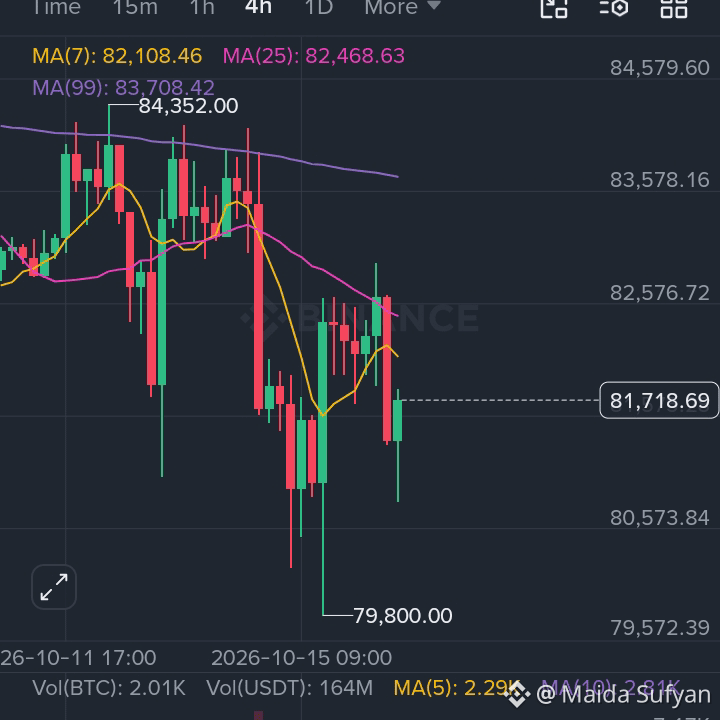
$BTC は2026-10-16時点で81,569.19ドルで取引されており、過去24時間で-1.16%下落しました。価格は80,809.25ドルから82,940.81ドルの間で推移し、日中は活発な値動きとなりました。
短期的な見通しはまちまちです。本日の安値を上回って推移すれば、買い手が押し目を支えていることを示唆します。一方、セッション高値を再び上回れば、勢いの回復を示すでしょう。安値を下回ると、下落圧力が強まる可能性があります。より広い方向性は、引き続き全体的なリスク選好、ETFや機関投資家の資金フロー、マクロ経済関連のニュースに大きく左右されるでしょう。😕#OctoberFedHikeOddsFallToAround17% #SolanaAlpenglowUpgradeToActivateOnOct21 #USSeptemberPPIRisesTo6.3%
$BTC は2026-10-16時点で81,569.19ドルで取引されており、過去24時間で-1.16%下落しました。価格は80,809.25ドルから82,940.81ドルの間で推移し、日中は活発な値動きとなりました。
短期的な見通しはまちまちです。本日の安値を上回って推移すれば、買い手が押し目を支えていることを示唆します。一方、セッション高値を再び上回れば、勢いの回復を示すでしょう。安値を下回ると、下落圧力が強まる可能性があります。より広い方向性は、引き続き全体的なリスク選好、ETFや機関投資家の資金フロー、マクロ経済関連のニュースに大きく左右されるでしょう。😕#OctoberFedHikeOddsFallToAround17% #SolanaAlpenglowUpgradeToActivateOnOct21 #USSeptemberPPIRisesTo6.3%
短期的な見通しはまちまちです。本日の安値を上回って推移すれば、買い手が押し目を支えていることを示唆します。一方、セッション高値を再び上回れば、勢いの回復を示すでしょう。安値を下回ると、下落圧力が強まる可能性があります。より広い方向性は、引き続き全体的なリスク選好、ETFや機関投資家の資金フロー、マクロ経済関連のニュースに大きく左右されるでしょう。😕#OctoberFedHikeOddsFallToAround17% #SolanaAlpenglowUpgradeToActivateOnOct21 #USSeptemberPPIRisesTo6.3%
119
·
--
翻訳参照
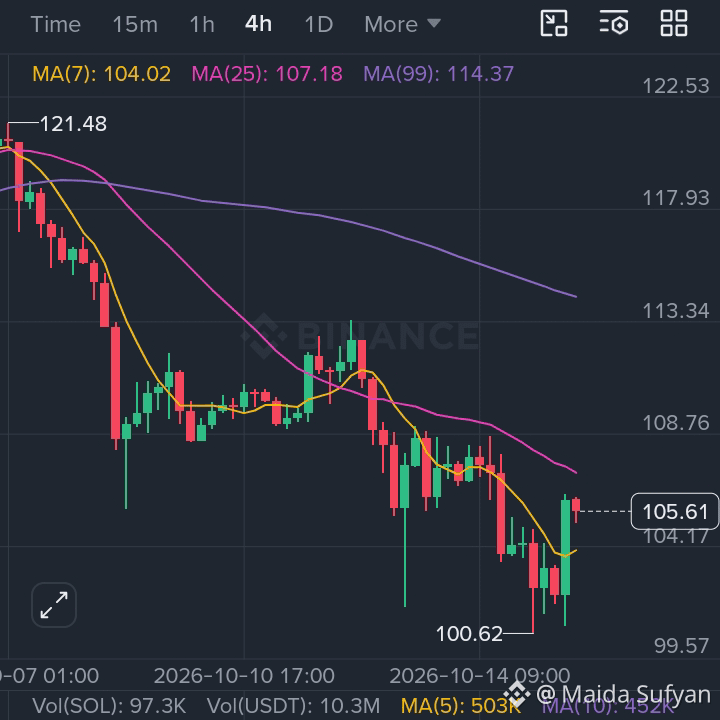
$SOL is trading at $105.65 as of 2026-10-15, up about +0.6% over the last 24 hours. Its session range has been $100.62–$106.30, so price is currently near the upper end of that range.
The short-term tone is constructive while SOL holds near the day’s high, but a clean move beyond the current range would need sustained volume. A drop back toward the lower end of today’s range would signal that buyers are losing momentu.
{future}(SOLUSDT)
.#BlackRockCryptoAssetsJump63% #CPIWatch #SouthKoreaPlansTighterCybersecurityRules
$SOL is trading at $105.65 as of 2026-10-15, up about +0.6% over the last 24 hours. Its session range has been $100.62–$106.30, so price is currently near the upper end of that range.
The short-term tone is constructive while SOL holds near the day’s high, but a clean move beyond the current range would need sustained volume. A drop back toward the lower end of today’s range would signal that buyers are losing momentu.
.#BlackRockCryptoAssetsJump63% #CPIWatch #SouthKoreaPlansTighterCybersecurityRules
The short-term tone is constructive while SOL holds near the day’s high, but a clean move beyond the current range would need sustained volume. A drop back toward the lower end of today’s range would signal that buyers are losing momentu.
.#BlackRockCryptoAssetsJump63% #CPIWatch #SouthKoreaPlansTighterCybersecurityRules
93
·
--
記事
翻訳参照
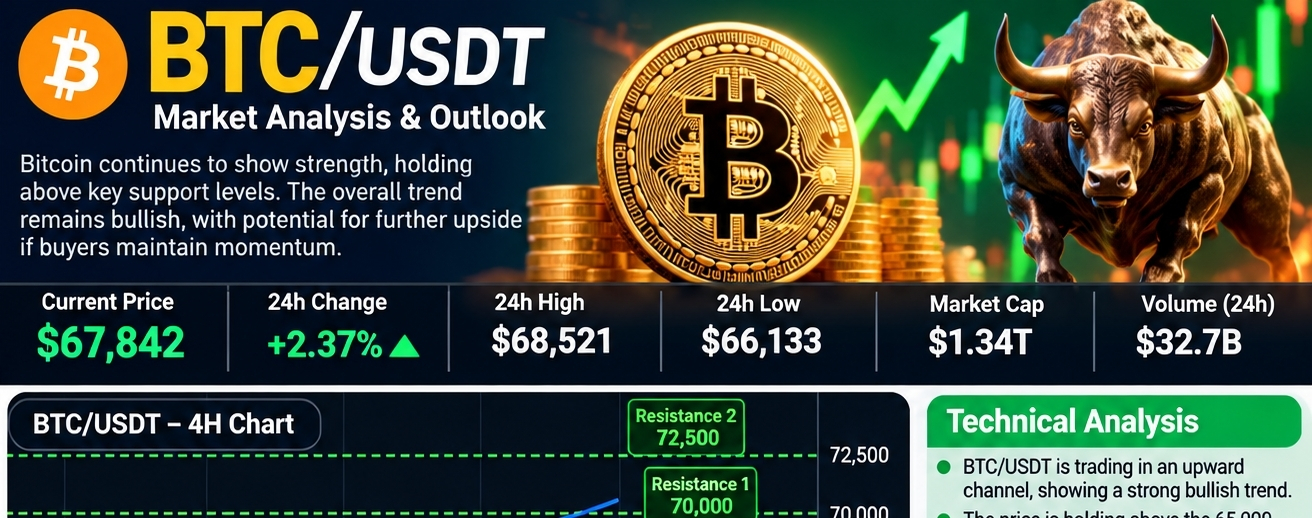
BTC/USDT📊$BTC Market Analysis: Bitcoin Price Outlook
🪙 Introduction
Bitcoin (BTC) is one of the most popular cryptocurrencies in the digital market. The BTC/USDT trading pair shows the price of Bitcoin in Tether (USDT). Traders monitor this pair to identify potential buying and selling opportunities.
📈 Market Analysis
Bitcoin's market direction depends on buying pressure, selling activity, trading volume, and overall market sentiment. If BTC/USDT breaks above a key resistance level with strong volume, the price may continue moving upward. However, if selling pressure increases, Bitcoin could experience a short-term correction.
🎯 Key Levels to Watch
- Resistance: Watch recent price highs for possible breakout opportunities.
- Support: Monitor recent price lows where buyers may enter the market.
- Volume: Higher trading volume can help confirm a price breakout.
- Trend: Monitor the 4-hour and daily charts to understand the market direction.
🔮 Market Outlook
BTC/USDT may continue its upward movement if buyers maintain strong momentum and the price breaks above resistance. On the other hand, losing an important support level could lead to further downside.
Traders should monitor market conditions carefully and avoid making decisions based on predictions alone.
✅ Conclusion
Bitcoin remains an important cryptocurrency to watch. Technical analysis, market sentiment, and risk management can help traders make more informed decisions. Always use stop-loss orders when appropriate and never risk more than you can afford to loss.
BTC/USDT
📊$BTC Market Analysis: Bitcoin Price Outlook
🪙 Introduction
Bitcoin (BTC) is one of the most popular cryptocurrencies in the digital market. The BTC/USDT trading pair shows the price of Bitcoin in Tether (USDT). Traders monitor this pair to identify potential buying and selling opportunities.
📈 Market Analysis
Bitcoin's market direction depends on buying pressure, selling activity, trading volume, and overall market sentiment. If BTC/USDT breaks above a key resistance level with strong volume, the price may continue moving upward. However, if selling pressure increases, Bitcoin could experience a short-term correction.
🎯 Key Levels to Watch
- Resistance: Watch recent price highs for possible breakout opportunities.
- Support: Monitor recent price lows where buyers may enter the market.
- Volume: Higher trading volume can help confirm a price breakout.
- Trend: Monitor the 4-hour and daily charts to understand the market direction.
🔮 Market Outlook
BTC/USDT may continue its upward movement if buyers maintain strong momentum and the price breaks above resistance. On the other hand, losing an important support level could lead to further downside.
Traders should monitor market conditions carefully and avoid making decisions based on predictions alone.
✅ Conclusion
Bitcoin remains an important cryptocurrency to watch. Technical analysis, market sentiment, and risk management can help traders make more informed decisions. Always use stop-loss orders when appropriate and never risk more than you can afford to loss.
🪙 Introduction
Bitcoin (BTC) is one of the most popular cryptocurrencies in the digital market. The BTC/USDT trading pair shows the price of Bitcoin in Tether (USDT). Traders monitor this pair to identify potential buying and selling opportunities.
📈 Market Analysis
Bitcoin's market direction depends on buying pressure, selling activity, trading volume, and overall market sentiment. If BTC/USDT breaks above a key resistance level with strong volume, the price may continue moving upward. However, if selling pressure increases, Bitcoin could experience a short-term correction.
🎯 Key Levels to Watch
- Resistance: Watch recent price highs for possible breakout opportunities.
- Support: Monitor recent price lows where buyers may enter the market.
- Volume: Higher trading volume can help confirm a price breakout.
- Trend: Monitor the 4-hour and daily charts to understand the market direction.
🔮 Market Outlook
BTC/USDT may continue its upward movement if buyers maintain strong momentum and the price breaks above resistance. On the other hand, losing an important support level could lead to further downside.
Traders should monitor market conditions carefully and avoid making decisions based on predictions alone.
✅ Conclusion
Bitcoin remains an important cryptocurrency to watch. Technical analysis, market sentiment, and risk management can help traders make more informed decisions. Always use stop-loss orders when appropriate and never risk more than you can afford to loss.
1
81
·
--
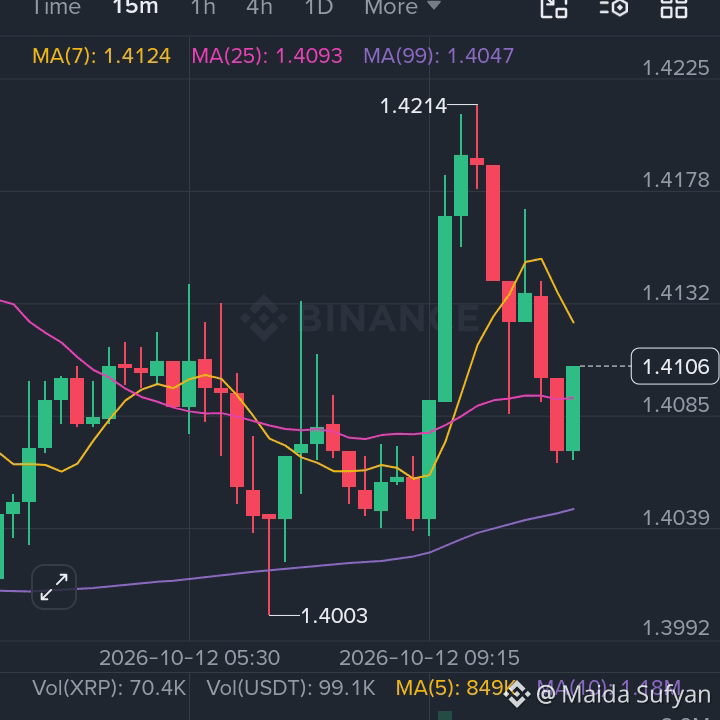
$XRP
短期的なトレンド:中立から弱気。
サポート:$1.34~$1.37。
レジスタンス:$1.43~$1.45。
強気シナリオ:$1.45を上抜ければ、モメンタムの改善を示す可能性があります。
弱気シナリオ:$1.34を下抜ければ、さらに弱含む可能性があります。$XRP
{spot}(XRPUSDT)
#XRPLedgerPatchesXRPCreationBug #STRKRisesAbout20%In24Hours
$XRP
短期的なトレンド:中立から弱気。
サポート:$1.34~$1.37。
レジスタンス:$1.43~$1.45。
強気シナリオ:$1.45を上抜ければ、モメンタムの改善を示す可能性があります。
弱気シナリオ:$1.34を下抜ければ、さらに弱含む可能性があります。$XRP
#XRPLedgerPatchesXRPCreationBug #STRKRisesAbout20%In24Hours
短期的なトレンド:中立から弱気。
サポート:$1.34~$1.37。
レジスタンス:$1.43~$1.45。
強気シナリオ:$1.45を上抜ければ、モメンタムの改善を示す可能性があります。
弱気シナリオ:$1.34を下抜ければ、さらに弱含む可能性があります。$XRP
#XRPLedgerPatchesXRPCreationBug #STRKRisesAbout20%In24Hours
88
·
--
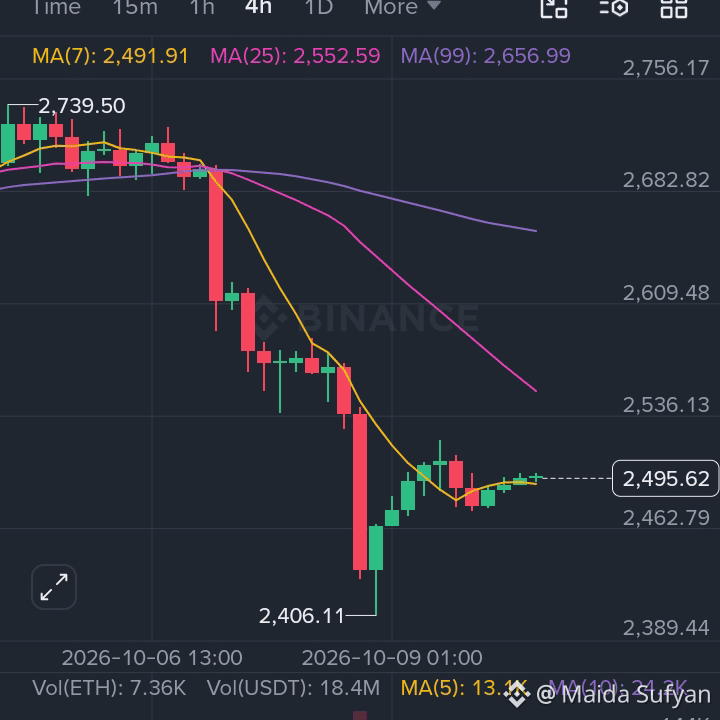
$ETH
トレンド:方向感はまちまちですが、日足チャートでは上昇の可能性があります。
サポート:$2,460、$2,410。
レジスタンス:$2,510、$2,570。
強気シナリオ:$2,510を上抜けると、$2,570を目指す展開となる可能性があります。
弱気シナリオ:$2,460を下回ると、さらに下落する可能性があります。
{spot}(ETHUSDT)
#XRPLedgerPatchesXRPCreationBug #STRKRisesAbout20%In24Hours #CFTCMovesToFoldEventContractsIntoSwapsRules
$ETH
トレンド:方向感はまちまちですが、日足チャートでは上昇の可能性があります。
サポート:$2,460、$2,410。
レジスタンス:$2,510、$2,570。
強気シナリオ:$2,510を上抜けると、$2,570を目指す展開となる可能性があります。
弱気シナリオ:$2,460を下回ると、さらに下落する可能性があります。
#XRPLedgerPatchesXRPCreationBug #STRKRisesAbout20%In24Hours #CFTCMovesToFoldEventContractsIntoSwapsRules
トレンド:方向感はまちまちですが、日足チャートでは上昇の可能性があります。
サポート:$2,460、$2,410。
レジスタンス:$2,510、$2,570。
強気シナリオ:$2,510を上抜けると、$2,570を目指す展開となる可能性があります。
弱気シナリオ:$2,460を下回ると、さらに下落する可能性があります。
#XRPLedgerPatchesXRPCreationBug #STRKRisesAbout20%In24Hours #CFTCMovesToFoldEventContractsIntoSwapsRules
101
·
--
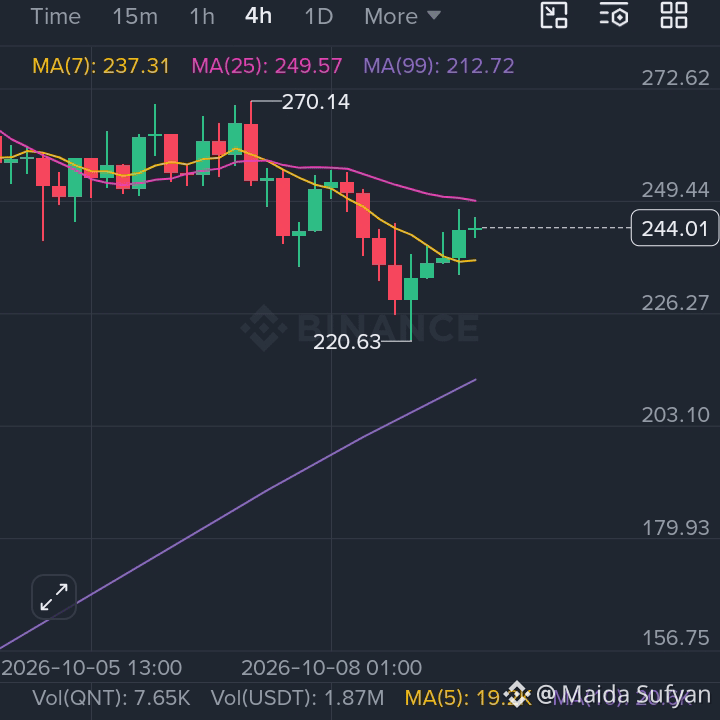
$QNT.US 🟢 サポート: $221
🔴 レジスタンス: $253
📈 強気シグナル: $253を上抜けると、上昇モメンタムを示す可能性があります。
📉 弱気シグナル: $221を下抜けると、さらなる弱含みを示す可能性があります。
⚠️ 市場トレンド: 短期的なシグナルが入り混じり、変動が激しい状況です。
{stock_us}(QNT.US)
$QNT.US 🟢 サポート: $221
🔴 レジスタンス: $253
📈 強気シグナル: $253を上抜けると、上昇モメンタムを示す可能性があります。
📉 弱気シグナル: $221を下抜けると、さらなる弱含みを示す可能性があります。
⚠️ 市場トレンド: 短期的なシグナルが入り混じり、変動が激しい状況です。
🔴 レジスタンス: $253
📈 強気シグナル: $253を上抜けると、上昇モメンタムを示す可能性があります。
📉 弱気シグナル: $221を下抜けると、さらなる弱含みを示す可能性があります。
⚠️ 市場トレンド: 短期的なシグナルが入り混じり、変動が激しい状況です。
747
·
--
ブリッシュ
翻訳参照
$GSB Current price: around $933 USDT on recent market data. �
CoinGecko
24H trend: slightly bullish (+1.1%), but the 7-day trend is still mildly negative. �
CoinGecko
Support: around $916–920
Resistance: around $940–960
Outlook: A clear break above $960 could improve bullish momentum; losing $916 would make the setup weaker.
{spot}(GSBUSDT)
#IMFGrantsWaiverForElSalvadorBitcoinBreach #BinanceLaunchesBinanceIntelligence #IMFSaysTokenizedMarketsSmall
$GSB Current price: around $933 USDT on recent market data. �
CoinGecko
24H trend: slightly bullish (+1.1%), but the 7-day trend is still mildly negative. �
CoinGecko
Support: around $916–920
Resistance: around $940–960
Outlook: A clear break above $960 could improve bullish momentum; losing $916 would make the setup weaker.
#IMFGrantsWaiverForElSalvadorBitcoinBreach #BinanceLaunchesBinanceIntelligence #IMFSaysTokenizedMarketsSmall
CoinGecko
24H trend: slightly bullish (+1.1%), but the 7-day trend is still mildly negative. �
CoinGecko
Support: around $916–920
Resistance: around $940–960
Outlook: A clear break above $960 could improve bullish momentum; losing $916 would make the setup weaker.
#IMFGrantsWaiverForElSalvadorBitcoinBreach #BinanceLaunchesBinanceIntelligence #IMFSaysTokenizedMarketsSmall
96
·
--
翻訳参照
$MOVR
💰 Current price: Around $1.95
📈 Trend: Short-term trend looks bullish/positive.
🟢 Resistance: $2.06, then $2.38–$2.88.
🔴 Support: $1.85–$1.90; below this, $1.69 could be the next support.
🚀 Bullish signal: A strong breakout above $2.06 could open the way for further upside.#IglooShutsDownAbstractBlockchain 🤪
$MOVR
💰 Current price: Around $1.95
📈 Trend: Short-term trend looks bullish/positive.
🟢 Resistance: $2.06, then $2.38–$2.88.
🔴 Support: $1.85–$1.90; below this, $1.69 could be the next support.
🚀 Bullish signal: A strong breakout above $2.06 could open the way for further upside.#IglooShutsDownAbstractBlockchain 🤪
💰 Current price: Around $1.95
📈 Trend: Short-term trend looks bullish/positive.
🟢 Resistance: $2.06, then $2.38–$2.88.
🔴 Support: $1.85–$1.90; below this, $1.69 could be the next support.
🚀 Bullish signal: A strong breakout above $2.06 could open the way for further upside.#IglooShutsDownAbstractBlockchain 🤪
386
·
--
翻訳参照
$MOVR
{spot}(MOVRUSDT)
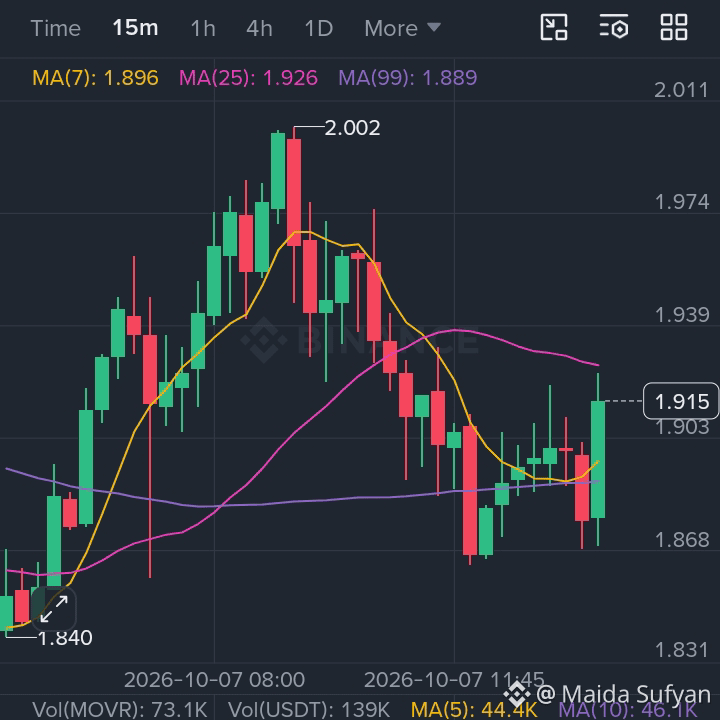
is trading at $1.911, up+2.52% over the past 24 hours as of 2026-10-07. Its 24h range is $1.807–$2.002, so price is currently in the upper half of that range, reflecting modest positive momentum.#BinanceLaunchesBinanceIntelligence #SECApproves3XBitcoinETF #IglooShutsDownAbstractBlockchain
$MOVR
is trading at $1.911, up+2.52% over the past 24 hours as of 2026-10-07. Its 24h range is $1.807–$2.002, so price is currently in the upper half of that range, reflecting modest positive momentum.#BinanceLaunchesBinanceIntelligence #SECApproves3XBitcoinETF #IglooShutsDownAbstractBlockchain
is trading at $1.911, up+2.52% over the past 24 hours as of 2026-10-07. Its 24h range is $1.807–$2.002, so price is currently in the upper half of that range, reflecting modest positive momentum.#BinanceLaunchesBinanceIntelligence #SECApproves3XBitcoinETF #IglooShutsDownAbstractBlockchain
361
·
--
翻訳参照
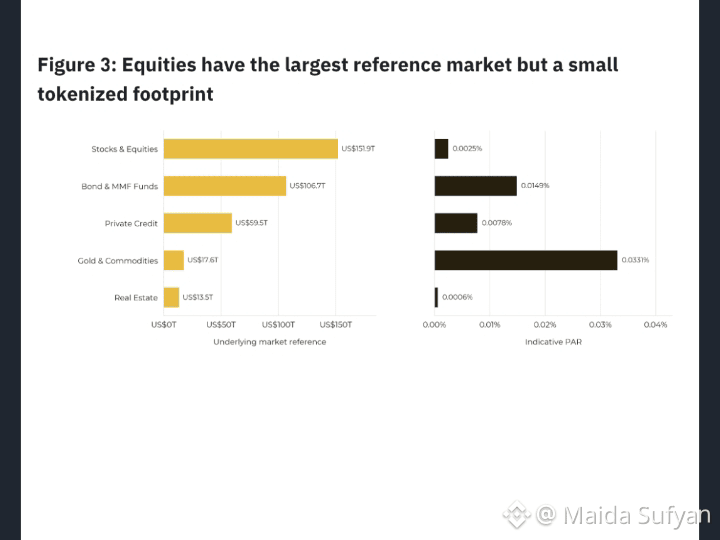
Tokenization could change how the world accesses equity markets - but this won't happen overnight.
Tokenized equities grew 390% in 2026, yet cover just 0.0029% of the US$151.9T listed equity market.
Binance Research's base case: approximately US$349B by 2030, up from US$4.43B today.
Tokenization could change how the world accesses equity markets - but this won't happen overnight.
Tokenized equities grew 390% in 2026, yet cover just 0.0029% of the US$151.9T listed equity market.
Binance Research's base case: approximately US$349B by 2030, up from US$4.43B today.
Tokenized equities grew 390% in 2026, yet cover just 0.0029% of the US$151.9T listed equity market.
Binance Research's base case: approximately US$349B by 2030, up from US$4.43B today.
65
·
--
翻訳参照
$IO
{spot}(IOUSDT)
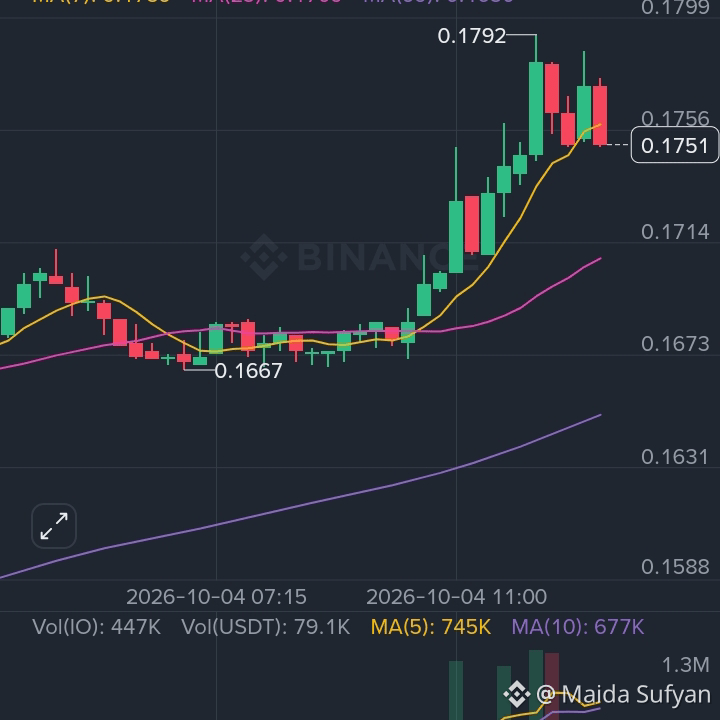
#NvidiaHitsRecordHighUp2.4% #CerebrasSinksNearly20%OnReportNvidiaToPowerOpenAI is trading at $0.1755 as of 2026-10-04, up +15.2% over the last 24 hours. It moved from a $0.1524 open to a $0.1792 high, so momentum is strong but the price is also close to the day’s high.
The key near-term question is whether IO can hold above its earlier breakout area around the day’s open; sustained volume would support continued interest, while a move back below that area would show the rally is losing strength. Its AI/infrastructure narrative can amplify volatility, so sharp reversals remain possible.#SECHaltsCryptoETFReviewsAmidFundingLapse
$IO
#NvidiaHitsRecordHighUp2.4% #CerebrasSinksNearly20%OnReportNvidiaToPowerOpenAI is trading at $0.1755 as of 2026-10-04, up +15.2% over the last 24 hours. It moved from a $0.1524 open to a $0.1792 high, so momentum is strong but the price is also close to the day’s high.
The key near-term question is whether IO can hold above its earlier breakout area around the day’s open; sustained volume would support continued interest, while a move back below that area would show the rally is losing strength. Its AI/infrastructure narrative can amplify volatility, so sharp reversals remain possible.#SECHaltsCryptoETFReviewsAmidFundingLapse
#NvidiaHitsRecordHighUp2.4% #CerebrasSinksNearly20%OnReportNvidiaToPowerOpenAI is trading at $0.1755 as of 2026-10-04, up +15.2% over the last 24 hours. It moved from a $0.1524 open to a $0.1792 high, so momentum is strong but the price is also close to the day’s high.
The key near-term question is whether IO can hold above its earlier breakout area around the day’s open; sustained volume would support continued interest, while a move back below that area would show the rally is losing strength. Its AI/infrastructure narrative can amplify volatility, so sharp reversals remain possible.#SECHaltsCryptoETFReviewsAmidFundingLapse
2
201
·
--
翻訳参照
$RAY #GreekPoliceBustCryptoScamRingArrest17
{spot}(RAYUSDT)
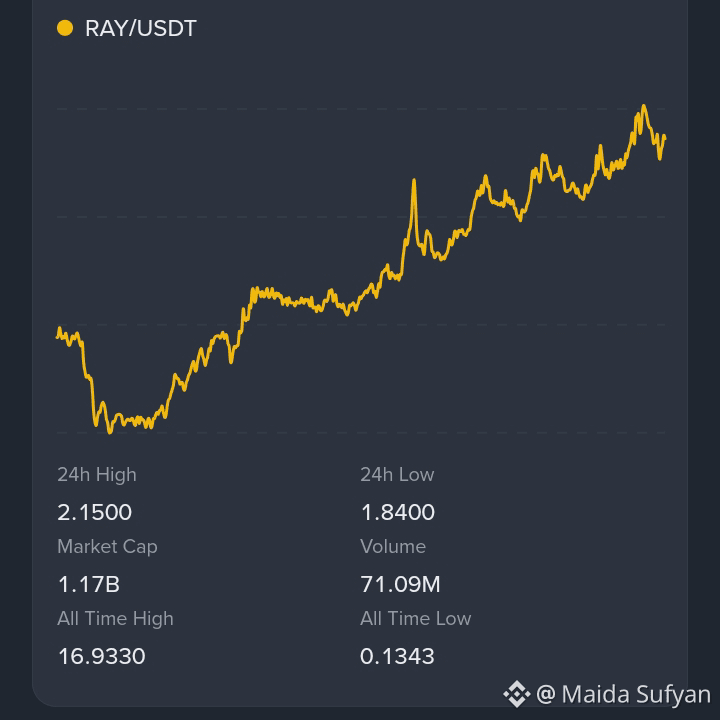
is trading at $2.1147, up +9.0% over the last 24 hours as of 2026-10-03. Its 24h range is $1.8400–$2.1500, placing price close to the session high—showing strong short-term momentum, though moves near daily highs can also bring sharper volatility.#CanaryFilesAmendedS1ForPEPEETF #USRussiaUkraineTalksReportedlyIncludeLukoilOilDeal 😉
$RAY #GreekPoliceBustCryptoScamRingArrest17
is trading at $2.1147, up +9.0% over the last 24 hours as of 2026-10-03. Its 24h range is $1.8400–$2.1500, placing price close to the session high—showing strong short-term momentum, though moves near daily highs can also bring sharper volatility.#CanaryFilesAmendedS1ForPEPEETF #USRussiaUkraineTalksReportedlyIncludeLukoilOilDeal 😉
is trading at $2.1147, up +9.0% over the last 24 hours as of 2026-10-03. Its 24h range is $1.8400–$2.1500, placing price close to the session high—showing strong short-term momentum, though moves near daily highs can also bring sharper volatility.#CanaryFilesAmendedS1ForPEPEETF #USRussiaUkraineTalksReportedlyIncludeLukoilOilDeal 😉
1
270
·
--
$GIGGLE
{spot}(GIGGLEUSDT)
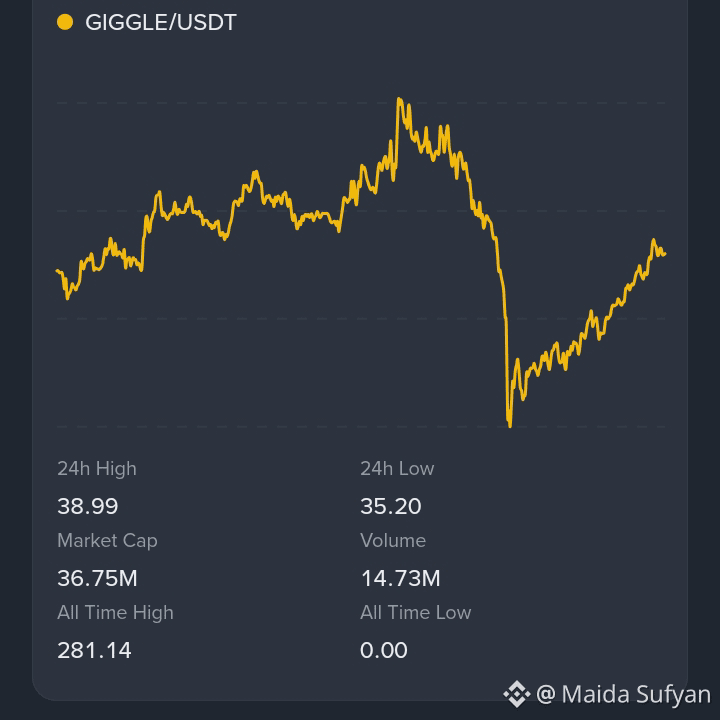
は現在約$37.28で取引されており、直近24時間のセッションでは+0.43%上昇しています。価格は$35.20から$38.99の範囲で推移しており、日中の値動きはおよそ10%とかなり大きく、ボラティリティ(変動性)が高いことを示しています。
現在の価格はそのレンジのほぼ中央付近です。セッション高値に向けて再び上昇するには持続的な需要が必要で、一方でセッション安値を下回る場合は売り手が主導権を握りつつあるサインになります。引用ベースの直近24時間の出来高は約$4.0Mで流動性はありますが、Seedタグが付いたミームアセットでは急激な値動きが起こる可能性もあります。#USSeptemberPayrollsAdd29KUnemploymentRises4.2% #BitcoinFundingRateTriplesTo10%
$GIGGLE
は現在約$37.28で取引されており、直近24時間のセッションでは+0.43%上昇しています。価格は$35.20から$38.99の範囲で推移しており、日中の値動きはおよそ10%とかなり大きく、ボラティリティ(変動性)が高いことを示しています。
現在の価格はそのレンジのほぼ中央付近です。セッション高値に向けて再び上昇するには持続的な需要が必要で、一方でセッション安値を下回る場合は売り手が主導権を握りつつあるサインになります。引用ベースの直近24時間の出来高は約$4.0Mで流動性はありますが、Seedタグが付いたミームアセットでは急激な値動きが起こる可能性もあります。#USSeptemberPayrollsAdd29KUnemploymentRises4.2% #BitcoinFundingRateTriplesTo10%
は現在約$37.28で取引されており、直近24時間のセッションでは+0.43%上昇しています。価格は$35.20から$38.99の範囲で推移しており、日中の値動きはおよそ10%とかなり大きく、ボラティリティ(変動性)が高いことを示しています。
現在の価格はそのレンジのほぼ中央付近です。セッション高値に向けて再び上昇するには持続的な需要が必要で、一方でセッション安値を下回る場合は売り手が主導権を握りつつあるサインになります。引用ベースの直近24時間の出来高は約$4.0Mで流動性はありますが、Seedタグが付いたミームアセットでは急激な値動きが起こる可能性もあります。#USSeptemberPayrollsAdd29KUnemploymentRises4.2% #BitcoinFundingRateTriplesTo10%
1
448
·
--
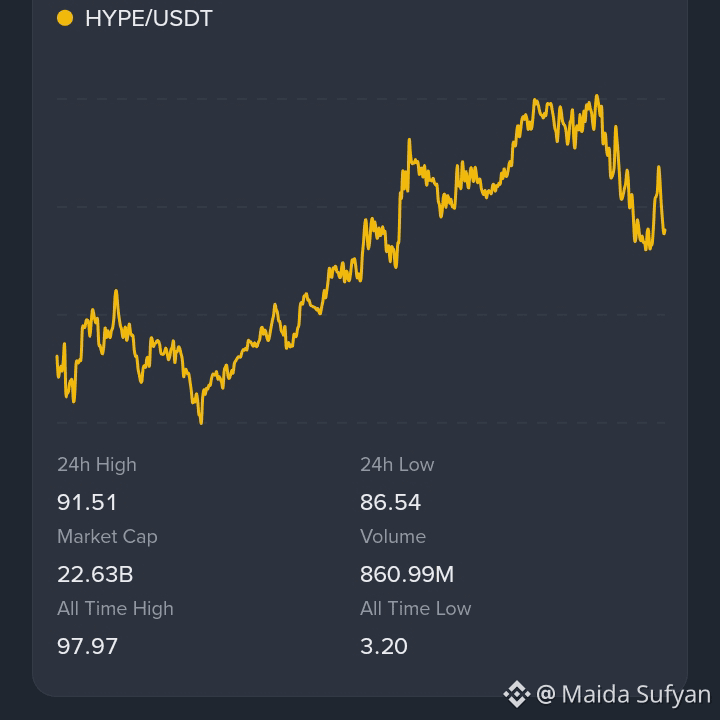
$HYPE #NFPWatch は2026-10-02時点で$89.37で取引されており、過去24時間で+1.9%上昇しています。セッションのレンジは$86.54〜$91.51です。これは今日のレンジの上半分付近で、買い手が序盤のボラティリティの一部を吸収していることを示唆しています。
建設的な見通しは、Hyperliquidの活発なデリバティブ(派生商品)エコシステムと、トークン買い戻し(リバイバック)の物語に結びついています。主なリスクは、HYPEが依然として高ベータの資産である点です。価格は、より広範な暗号資産市場のセンチメント、プラットフォームの取引高の変化、規制の動向、そしてバリュエーション(評価)の圧力に対して急激に反応し得ます。今日の高値を上回る持続的な動きは強いモメンタムを示し、一方でその日の安値を下回ることは売り手が主導権を取り戻していることを示します。#BitcoinFundingRateTriplesTo10% #ZcashFalls21%FromSeptemberPeak #USSeptemberPayrollsAdd29KUnemploymentRises4.2%
$HYPE #NFPWatch は2026-10-02時点で$89.37で取引されており、過去24時間で+1.9%上昇しています。セッションのレンジは$86.54〜$91.51です。これは今日のレンジの上半分付近で、買い手が序盤のボラティリティの一部を吸収していることを示唆しています。
建設的な見通しは、Hyperliquidの活発なデリバティブ(派生商品)エコシステムと、トークン買い戻し(リバイバック)の物語に結びついています。主なリスクは、HYPEが依然として高ベータの資産である点です。価格は、より広範な暗号資産市場のセンチメント、プラットフォームの取引高の変化、規制の動向、そしてバリュエーション(評価)の圧力に対して急激に反応し得ます。今日の高値を上回る持続的な動きは強いモメンタムを示し、一方でその日の安値を下回ることは売り手が主導権を取り戻していることを示します。#BitcoinFundingRateTriplesTo10% #ZcashFalls21%FromSeptemberPeak #USSeptemberPayrollsAdd29KUnemploymentRises4.2%
建設的な見通しは、Hyperliquidの活発なデリバティブ(派生商品)エコシステムと、トークン買い戻し(リバイバック)の物語に結びついています。主なリスクは、HYPEが依然として高ベータの資産である点です。価格は、より広範な暗号資産市場のセンチメント、プラットフォームの取引高の変化、規制の動向、そしてバリュエーション(評価)の圧力に対して急激に反応し得ます。今日の高値を上回る持続的な動きは強いモメンタムを示し、一方でその日の安値を下回ることは売り手が主導権を取り戻していることを示します。#BitcoinFundingRateTriplesTo10% #ZcashFalls21%FromSeptemberPeak #USSeptemberPayrollsAdd29KUnemploymentRises4.2%
2
253
·
--
翻訳参照
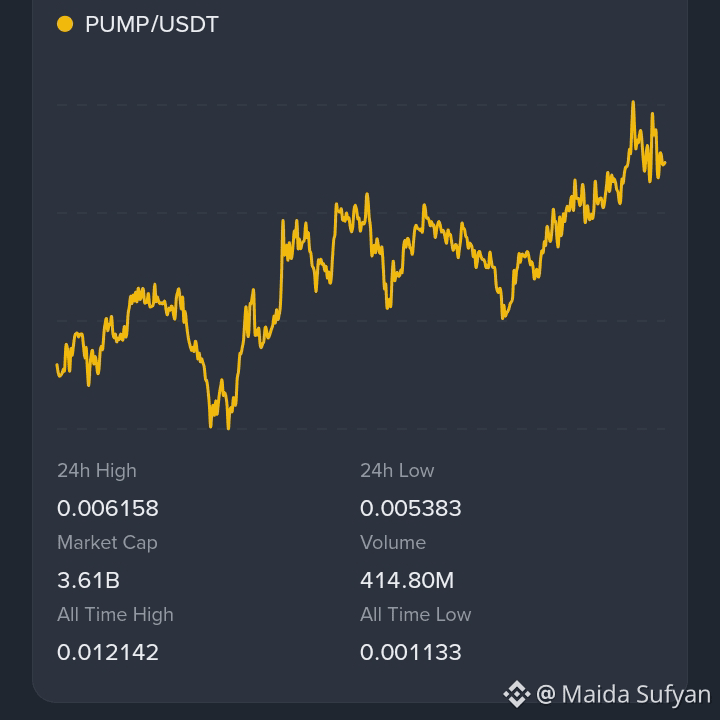
#$PUMP is at $0.005969 as of 2026-10-02p +8.15% over the past 24 hours. Its 24h range is $0.005383–$0.006158, so it is trading near the day’s high after a sharp rebound; volatility remains elevated.#EthereumFoundationLaunchesZkAPIOnMainnet #EvernorthPlansNasdaqListingOct8 #SECProposesCryptoCustodyFramework #AnthropicTargetsIPOAsSoonAsMidNovember
#$PUMP is at $0.005969 as of 2026-10-02p +8.15% over the past 24 hours. Its 24h range is $0.005383–$0.006158, so it is trading near the day’s high after a sharp rebound; volatility remains elevated.#EthereumFoundationLaunchesZkAPIOnMainnet #EvernorthPlansNasdaqListingOct8 #SECProposesCryptoCustodyFramework #AnthropicTargetsIPOAsSoonAsMidNovember
1
1
393
ログインして、さらにコンテンツを読む
厳選トピックで世界の暗号資産トレーダーの仲間入り
⚡️ 暗号資産に関する最新かつ有益な情報が見つかります。
💬 世界最大の暗号資産取引所から信頼されています。
👍 認証を受けたクリエイターから、有益なインサイトを得られます。
メール / 電話番号