
CryptoXCoin CoinXpert
14 投稿

CryptoXCoin CoinXpert
報告
ユーザーをブロック
1 フォロー
2 フォロワー
2 いいね
投稿
すべて
動画
記事
PAXG/USDTに上昇モメンタム 🚀 | 金価格のブレイクアウトが迫る? 📈📊 PAXG/USDT市場分析 – 金に上昇モメンタム!ブレイクアウトは近い?
日付:2026年11月14日
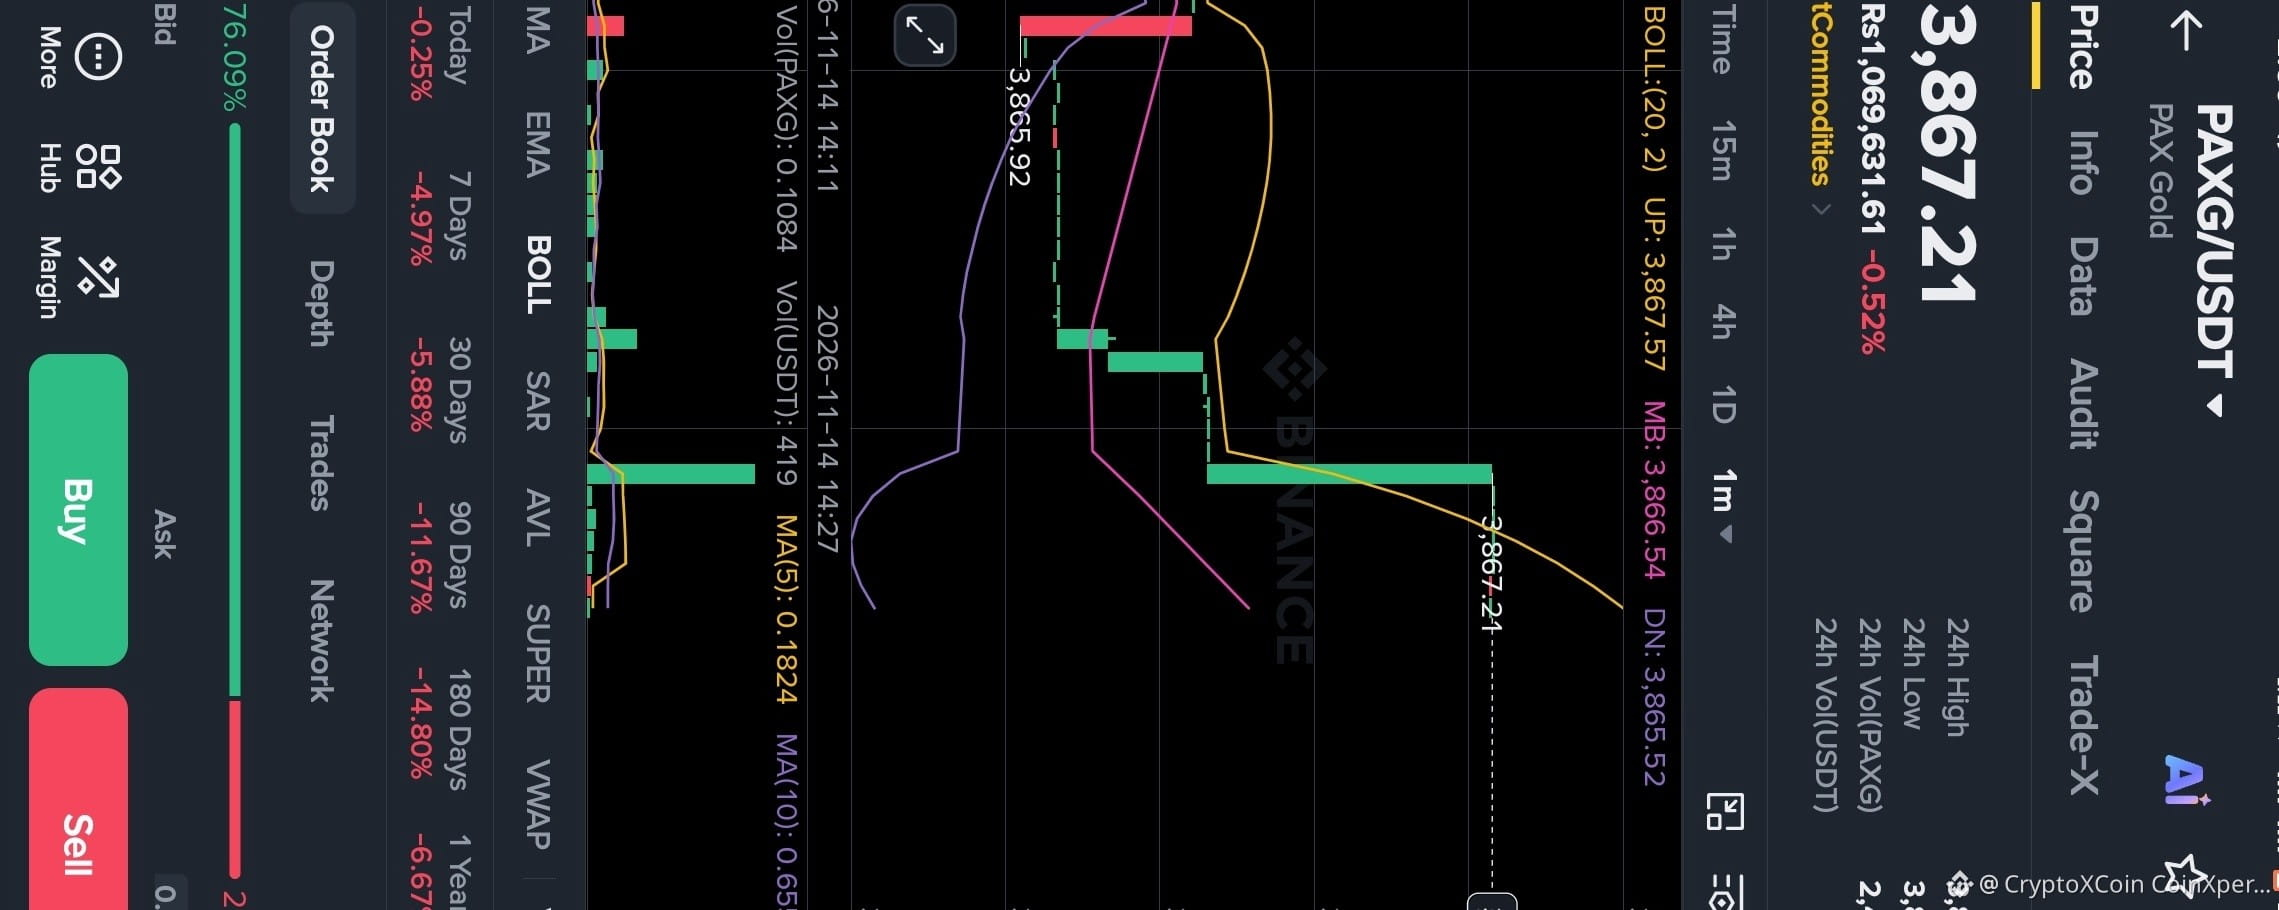
PAXG/USDT市場では、1分足で明確な上昇モメンタムが見られます。提供されたチャートによると、PAX Goldは現在3,867.21 USDTで取引されており、24時間の高値は3,896.15、安値は3,859.80です。
📈 テクニカル分析
チャートでは、約3,865.92から力強く回復した後、連続する陽線によって価格が3,867.21に向けて上昇しています。
ボリンジャーバンド分析:
PAXG/USDTに上昇モメンタム 🚀 | 金価格のブレイクアウトが迫る? 📈
📊 PAXG/USDT市場分析 – 金に上昇モメンタム!ブレイクアウトは近い?
日付:2026年11月14日
PAXG/USDT市場では、1分足で明確な上昇モメンタムが見られます。提供されたチャートによると、PAX Goldは現在3,867.21 USDTで取引されており、24時間の高値は3,896.15、安値は3,859.80です。
📈 テクニカル分析
チャートでは、約3,865.92から力強く回復した後、連続する陽線によって価格が3,867.21に向けて上昇しています。
ボリンジャーバンド分析:
日付:2026年11月14日
PAXG/USDT市場では、1分足で明確な上昇モメンタムが見られます。提供されたチャートによると、PAX Goldは現在3,867.21 USDTで取引されており、24時間の高値は3,896.15、安値は3,859.80です。
📈 テクニカル分析
チャートでは、約3,865.92から力強く回復した後、連続する陽線によって価格が3,867.21に向けて上昇しています。
ボリンジャーバンド分析:
158
記事
翻訳参照
PEPE/USDT Price Analysis – Bearish Trend Continues, Can Buyers Make a Comeback?PEPE/USDT Market Analysis 🐸
$PEPE
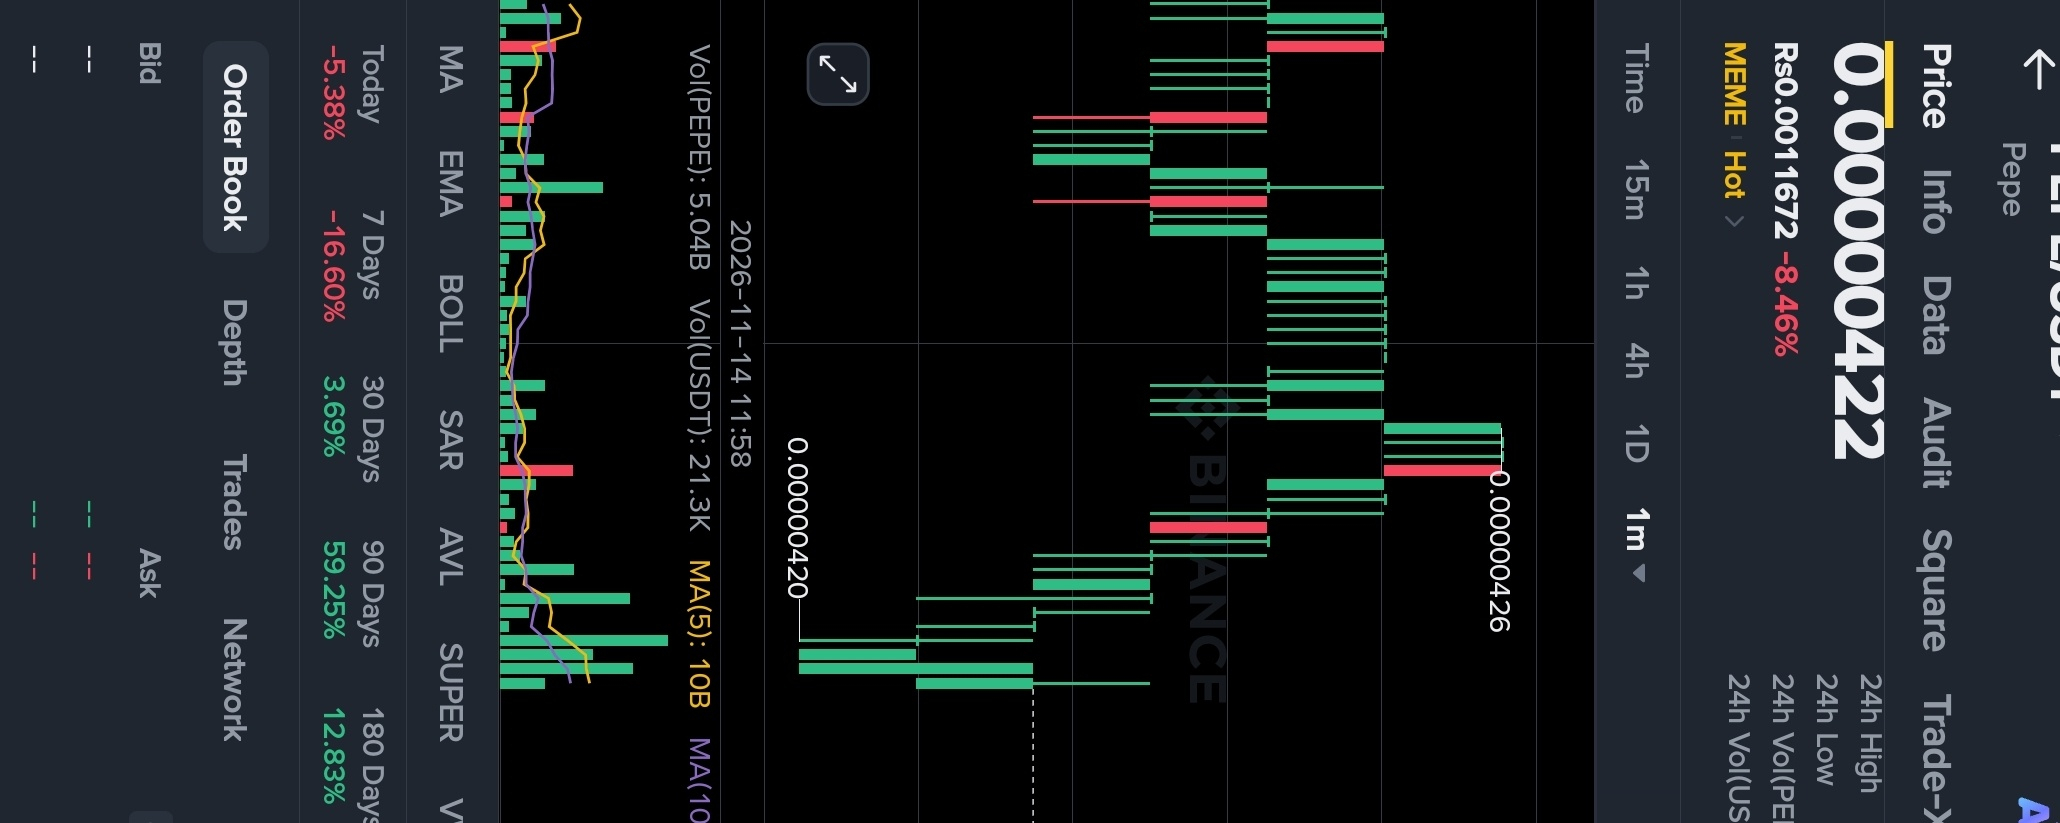
Current Price: 0.00000422 USDT
24H Change: -8.46%
Market Overview
PEPE/USDT is currently showing bearish momentum on the 1-minute chart. Sellers have pushed the price down from the recent high of 0.00000426 toward the support zone around 0.00000420.
A small recovery is visible, with buyers attempting to push the price back toward 0.00000422. However, buying pressure still needs confirmation.
Trend Direction 📉
Short-Term Trend: BEARISH
The market structure currently favors sellers. Unless PEPE breaks above nearby resistance with strong volume, downside pressure may continue.
Important Price Levels
- Support: 0.00000420 – 0.00000419
- Resistance: 0.00000424 – 0.00000426
- Current Price: 0.00000422
What to Expect Next?
If the price breaks below 0.00000420, further downside movement could develop. On the other hand, a strong move above 0.00000424 may indicate a short-term recovery toward 0.00000426.
Final Analysis
PEPE is currently in a short-term bearish phase, while buyers are trying to defend the support zone. Traders should watch volume and key price levels before making any decision.
Market Bias: BEARISH 📉donw trand
This analysis is based on the provided chart and is for educational purposes only, not financial advice.$PEPE
{alpha}(nullnull)
PEPE/USDT Price Analysis – Bearish Trend Continues, Can Buyers Make a Comeback?
PEPE/USDT Market Analysis 🐸
$PEPE
Current Price: 0.00000422 USDT
24H Change: -8.46%
Market Overview
PEPE/USDT is currently showing bearish momentum on the 1-minute chart. Sellers have pushed the price down from the recent high of 0.00000426 toward the support zone around 0.00000420.
A small recovery is visible, with buyers attempting to push the price back toward 0.00000422. However, buying pressure still needs confirmation.
Trend Direction 📉
Short-Term Trend: BEARISH
The market structure currently favors sellers. Unless PEPE breaks above nearby resistance with strong volume, downside pressure may continue.
Important Price Levels
- Support: 0.00000420 – 0.00000419
- Resistance: 0.00000424 – 0.00000426
- Current Price: 0.00000422
What to Expect Next?
If the price breaks below 0.00000420, further downside movement could develop. On the other hand, a strong move above 0.00000424 may indicate a short-term recovery toward 0.00000426.
Final Analysis
PEPE is currently in a short-term bearish phase, while buyers are trying to defend the support zone. Traders should watch volume and key price levels before making any decision.
Market Bias: BEARISH 📉donw trand
This analysis is based on the provided chart and is for educational purposes only, not financial advice.$PEPE
$PEPE
Current Price: 0.00000422 USDT
24H Change: -8.46%
Market Overview
PEPE/USDT is currently showing bearish momentum on the 1-minute chart. Sellers have pushed the price down from the recent high of 0.00000426 toward the support zone around 0.00000420.
A small recovery is visible, with buyers attempting to push the price back toward 0.00000422. However, buying pressure still needs confirmation.
Trend Direction 📉
Short-Term Trend: BEARISH
The market structure currently favors sellers. Unless PEPE breaks above nearby resistance with strong volume, downside pressure may continue.
Important Price Levels
- Support: 0.00000420 – 0.00000419
- Resistance: 0.00000424 – 0.00000426
- Current Price: 0.00000422
What to Expect Next?
If the price breaks below 0.00000420, further downside movement could develop. On the other hand, a strong move above 0.00000424 may indicate a short-term recovery toward 0.00000426.
Final Analysis
PEPE is currently in a short-term bearish phase, while buyers are trying to defend the support zone. Traders should watch volume and key price levels before making any decision.
Market Bias: BEARISH 📉donw trand
This analysis is based on the provided chart and is for educational purposes only, not financial advice.$PEPE
86
記事
翻訳参照
AKEUSDT Market Analysis: Massive Rally Followed by a Sharp Correction!
AKEUSDT has attracted signifAKEUSDT Market Analysis: Massive Rally Followed by a Sharp Correction!
$AKE
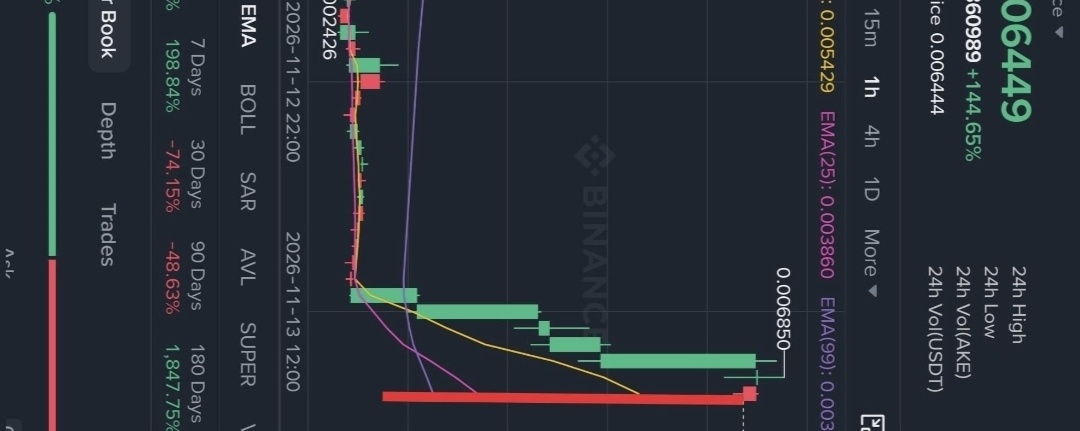
AKEUSDT has attracted significant market attention after an impressive bullish move. According to the chart, the token surged from approximately $0.002426 to $0.006850, recording a massive price increase.
📊 Key Market Highlights
- Current Price: $0.006449
- 24H High: $0.006850
- 24H Low: $0.002492
- 24H Performance: +142.17%
- 7-Day Performance: +198.84%
- 24H Trading Volume: 80.31B AKE
📈 Technical Analysis
The 1-hour chart shows a powerful bullish breakout, with price moving above the EMA(7), EMA(25), and EMA(99).
However, a sharp red candle appeared after the rally, indicating strong selling pressure and possible profit-taking.
🔑 Important Price Levels
- Resistance: $0.006850
- Immediate Support: $0.005429
- Next Support: $0.003860
- Major Support: $0.003426
🔮 What Could Happen Next?
If AKEUSDT holds above its important support levels and buying volume returns, another bullish attempt could develop.
However, continued selling pressure may lead to further correction. Traders should wait for price stabilization and confirmation before making decisions.
🎯 Final Outlook
AKEUSDT is showing high volatility after a massive rally. The next move will depend on whether buyers can defend key support zones or sellers take control.$AKE
Watch the $0.006850 resistance and $0.005429 support closely.
Educational marke$akt analysis only. Not financial advice.$AKE
{future}(AKEUSDT)
Chak this chart 📉 📈 📊✅
AKEUSDT Market Analysis: Massive Rally Followed by a Sharp Correction! AKEUSDT has attracted signif
AKEUSDT Market Analysis: Massive Rally Followed by a Sharp Correction!
$AKE
AKEUSDT has attracted significant market attention after an impressive bullish move. According to the chart, the token surged from approximately $0.002426 to $0.006850, recording a massive price increase.
📊 Key Market Highlights
- Current Price: $0.006449
- 24H High: $0.006850
- 24H Low: $0.002492
- 24H Performance: +142.17%
- 7-Day Performance: +198.84%
- 24H Trading Volume: 80.31B AKE
📈 Technical Analysis
The 1-hour chart shows a powerful bullish breakout, with price moving above the EMA(7), EMA(25), and EMA(99).
However, a sharp red candle appeared after the rally, indicating strong selling pressure and possible profit-taking.
🔑 Important Price Levels
- Resistance: $0.006850
- Immediate Support: $0.005429
- Next Support: $0.003860
- Major Support: $0.003426
🔮 What Could Happen Next?
If AKEUSDT holds above its important support levels and buying volume returns, another bullish attempt could develop.
However, continued selling pressure may lead to further correction. Traders should wait for price stabilization and confirmation before making decisions.
🎯 Final Outlook
AKEUSDT is showing high volatility after a massive rally. The next move will depend on whether buyers can defend key support zones or sellers take control.$AKE
Watch the $0.006850 resistance and $0.005429 support closely.
Educational marke$akt analysis only. Not financial advice.$AKE
Chak this chart 📉 📈 📊✅
$AKE
AKEUSDT has attracted significant market attention after an impressive bullish move. According to the chart, the token surged from approximately $0.002426 to $0.006850, recording a massive price increase.
📊 Key Market Highlights
- Current Price: $0.006449
- 24H High: $0.006850
- 24H Low: $0.002492
- 24H Performance: +142.17%
- 7-Day Performance: +198.84%
- 24H Trading Volume: 80.31B AKE
📈 Technical Analysis
The 1-hour chart shows a powerful bullish breakout, with price moving above the EMA(7), EMA(25), and EMA(99).
However, a sharp red candle appeared after the rally, indicating strong selling pressure and possible profit-taking.
🔑 Important Price Levels
- Resistance: $0.006850
- Immediate Support: $0.005429
- Next Support: $0.003860
- Major Support: $0.003426
🔮 What Could Happen Next?
If AKEUSDT holds above its important support levels and buying volume returns, another bullish attempt could develop.
However, continued selling pressure may lead to further correction. Traders should wait for price stabilization and confirmation before making decisions.
🎯 Final Outlook
AKEUSDT is showing high volatility after a massive rally. The next move will depend on whether buyers can defend key support zones or sellers take control.$AKE
Watch the $0.006850 resistance and $0.005429 support closely.
Educational marke$akt analysis only. Not financial advice.$AKE
Chak this chart 📉 📈 📊✅
526
記事
翻訳参照
Bitcoin (BTC) Weekly Chart Analysis: Elliott Wave Structure Signals a Potential Bullish ContinuationBitcoin (BTC) Weekly Chart Analysis: Bulls Eye the Next Major Resistance!
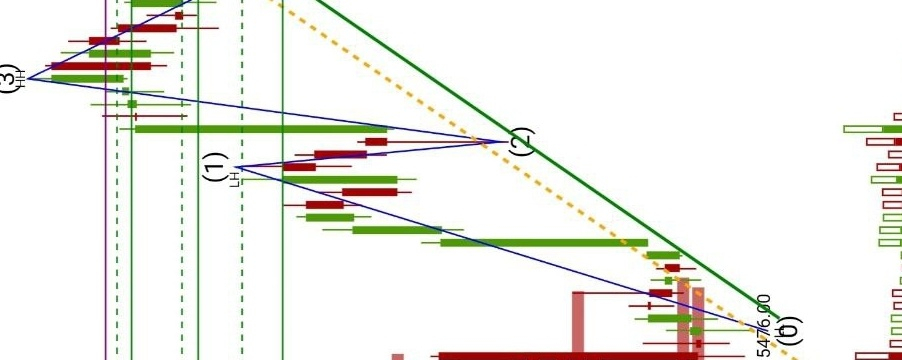
Bitcoin's weekly chart is showing an interesting bullish Elliott Wave structure. The price action has completed several important wave movements, with Wave (3) reaching a high near $31,804 before entering a correction.
📊 Technical Analysis
The chart highlights a possible five-wave bullish structure:$BTC
- Wave (0): The initial base formed near $15,476.
- Wave (1): Bitcoin started a strong upward move.
- Wave (2): A corrective pullback followed.
- Wave (3): A powerful bullish rally pushed the price toward $31,804.
- Wave (4): The market experienced another correction before attempting to recover.
🔑 Important Support Levels
- $28,584 – Immediate price area
- $26,336 – Important support
- $25,235 – Secondary support
- $24,285 – Major trend support
🎯 Resistance Levels
The $30,000 zone is an important resistance area, while $31,804 is the previous major high. A sustained breakout above these levels could strengthen the bullish outlook.
📈 Market Outlook$BTC
Bitcoin's broader weekly structure appears bullish as long as the rising trendline and important support zones remain intact. However, a breakdown below major support could weaken the current bullish setup.
Conclusion: Bitcoin is approaching an important decision zone. Traders should watch the support trendline, volume, and resistance breakout for confirmation before considering the next market direction.
This is technical chart analysis for educational purposes, not financial advice.$ETH
Bitcoin (BTC) Weekly Chart Analysis: Elliott Wave Structure Signals a Potential Bullish Continuation
Bitcoin (BTC) Weekly Chart Analysis: Bulls Eye the Next Major Resistance!
Bitcoin's weekly chart is showing an interesting bullish Elliott Wave structure. The price action has completed several important wave movements, with Wave (3) reaching a high near $31,804 before entering a correction.
📊 Technical Analysis
The chart highlights a possible five-wave bullish structure:$BTC
- Wave (0): The initial base formed near $15,476.
- Wave (1): Bitcoin started a strong upward move.
- Wave (2): A corrective pullback followed.
- Wave (3): A powerful bullish rally pushed the price toward $31,804.
- Wave (4): The market experienced another correction before attempting to recover.
🔑 Important Support Levels
- $28,584 – Immediate price area
- $26,336 – Important support
- $25,235 – Secondary support
- $24,285 – Major trend support
🎯 Resistance Levels
The $30,000 zone is an important resistance area, while $31,804 is the previous major high. A sustained breakout above these levels could strengthen the bullish outlook.
📈 Market Outlook$BTC
Bitcoin's broader weekly structure appears bullish as long as the rising trendline and important support zones remain intact. However, a breakdown below major support could weaken the current bullish setup.
Conclusion: Bitcoin is approaching an important decision zone. Traders should watch the support trendline, volume, and resistance breakout for confirmation before considering the next market direction.
This is technical chart analysis for educational purposes, not financial advice.$ETH
Bitcoin's weekly chart is showing an interesting bullish Elliott Wave structure. The price action has completed several important wave movements, with Wave (3) reaching a high near $31,804 before entering a correction.
📊 Technical Analysis
The chart highlights a possible five-wave bullish structure:$BTC
- Wave (0): The initial base formed near $15,476.
- Wave (1): Bitcoin started a strong upward move.
- Wave (2): A corrective pullback followed.
- Wave (3): A powerful bullish rally pushed the price toward $31,804.
- Wave (4): The market experienced another correction before attempting to recover.
🔑 Important Support Levels
- $28,584 – Immediate price area
- $26,336 – Important support
- $25,235 – Secondary support
- $24,285 – Major trend support
🎯 Resistance Levels
The $30,000 zone is an important resistance area, while $31,804 is the previous major high. A sustained breakout above these levels could strengthen the bullish outlook.
📈 Market Outlook$BTC
Bitcoin's broader weekly structure appears bullish as long as the rising trendline and important support zones remain intact. However, a breakdown below major support could weaken the current bullish setup.
Conclusion: Bitcoin is approaching an important decision zone. Traders should watch the support trendline, volume, and resistance breakout for confirmation before considering the next market direction.
This is technical chart analysis for educational purposes, not financial advice.$ETH
90
記事
翻訳参照
ETH Breakdown – Sellers Are Still in Control! 📉🔴 ETH/USDT – Bearish Momentum Continues 📉
Ethereum is showing strong bearish momentum on the 1-minute chart.
Technical Analysis:$ETH
- Current Price: $1,925.20
- Previous High: $1,953.62
- Recent Low: $1,915.43
- Resistance Zone: $1,930–$1,938
- Support Zone: $1,915–$1,920
Market Struct$:
$ETH has formed lower highs and lower lows, indicating continued selling pressure. After reaching $1,915.43, price attempted a small recovery, but bearish pressure remains important.
Key Levels to Watch:
- Above $1,930: Possible short-term recovery.
- Below $1,915: Possible further downside.
- Rejection near resistance: Bearish continuation may follow.
Final Outlook: 🔴 BEARISH
Sellers currently have the advantage, but wait for candle confirmation before making any trading decision.
This is technical analysis, not a guaranteed price prediction.$ETH
{spot}(ETHUSDT)
ETH Breakdown – Sellers Are Still in Control! 📉
🔴 ETH/USDT – Bearish Momentum Continues 📉
Ethereum is showing strong bearish momentum on the 1-minute chart.
Technical Analysis:$ETH
- Current Price: $1,925.20
- Previous High: $1,953.62
- Recent Low: $1,915.43
- Resistance Zone: $1,930–$1,938
- Support Zone: $1,915–$1,920
Market Struct$:
$ETH has formed lower highs and lower lows, indicating continued selling pressure. After reaching $1,915.43, price attempted a small recovery, but bearish pressure remains important.
Key Levels to Watch:
- Above $1,930: Possible short-term recovery.
- Below $1,915: Possible further downside.
- Rejection near resistance: Bearish continuation may follow.
Final Outlook: 🔴 BEARISH
Sellers currently have the advantage, but wait for candle confirmation before making any trading decision.
This is technical analysis, not a guaranteed price prediction.$ETH
Ethereum is showing strong bearish momentum on the 1-minute chart.
Technical Analysis:$ETH
- Current Price: $1,925.20
- Previous High: $1,953.62
- Recent Low: $1,915.43
- Resistance Zone: $1,930–$1,938
- Support Zone: $1,915–$1,920
Market Struct$:
$ETH has formed lower highs and lower lows, indicating continued selling pressure. After reaching $1,915.43, price attempted a small recovery, but bearish pressure remains important.
Key Levels to Watch:
- Above $1,930: Possible short-term recovery.
- Below $1,915: Possible further downside.
- Rejection near resistance: Bearish continuation may follow.
Final Outlook: 🔴 BEARISH
Sellers currently have the advantage, but wait for candle confirmation before making any trading decision.
This is technical analysis, not a guaranteed price prediction.$ETH
14
翻訳参照
# 🚨 BITCOIN: THE BEAR TRAP MAY BE HERE!
Bitcoin is showing an interesting move, and the next few levels could be very important.
I previously highlighted the possibility of a drop below $75K, with $71K as the next key support level. Now, all eyes are on what Bitcoin does next.
**My current market outlook:**
📉 $71K → $67K — Potential Bear Trap
📈 $67K → $100K → $114K — Possible bullish recovery targets
The market can change quickly, so don't rush into trades. Watch the key levels, manage your risk, and wait for confirmation before making any decisions.
Stay alert for the next Bitcoin update!
**$BTC** 🚀$BTC
# 🚨 BITCOIN: THE BEAR TRAP MAY BE HERE!
Bitcoin is showing an interesting move, and the next few levels could be very important.
I previously highlighted the possibility of a drop below $75K, with $71K as the next key support level. Now, all eyes are on what Bitcoin does next.
**My current market outlook:**
📉 $71K → $67K — Potential Bear Trap
📈 $67K → $100K → $114K — Possible bullish recovery targets
The market can change quickly, so don't rush into trades. Watch the key levels, manage your risk, and wait for confirmation before making any decisions.
Stay alert for the next Bitcoin update!
**$BTC ** 🚀$BTC
Bitcoin is showing an interesting move, and the next few levels could be very important.
I previously highlighted the possibility of a drop below $75K, with $71K as the next key support level. Now, all eyes are on what Bitcoin does next.
**My current market outlook:**
📉 $71K → $67K — Potential Bear Trap
📈 $67K → $100K → $114K — Possible bullish recovery targets
The market can change quickly, so don't rush into trades. Watch the key levels, manage your risk, and wait for confirmation before making any decisions.
Stay alert for the next Bitcoin update!
**$BTC ** 🚀$BTC

22
翻訳参照
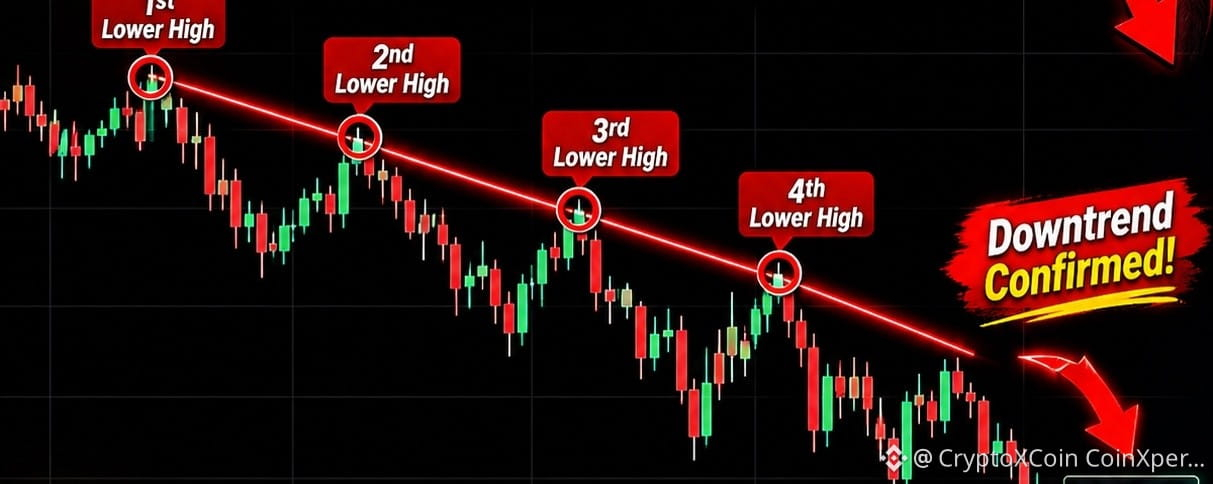
🔥 Three Touches Trendline – The Last Kiss Before the Downtrend 📉
Three Touches. One Trendline. One Final Kiss.in $BTC
Price tested the upper resistance trendline three times, showing strong selling pressure at the same level.
Each touch created a rejection, while the candlesticks showed that buyers were losing momentum.
The final kiss (retest) at the trendline became an important moment. After rejection, $BTC
Key Technical Points:
- 3 Touches at Trendline Resistance
- Candlestick Rejection
- Final Trendline Kiss (Retest)
- Sellers Taking Control
- Bearish Trend Continuation 📉
🔥 Three Touches Trendline – The Last Kiss Before the Downtrend 📉
Three Touches. One Trendline. One Final Kiss.in $BTC
Price tested the upper resistance trendline three times, showing strong selling pressure at the same level.
Each touch created a rejection, while the candlesticks showed that buyers were losing momentum.
The final kiss (retest) at the trendline became an important moment. After rejection, $BTC
Key Technical Points:
- 3 Touches at Trendline Resistance
- Candlestick Rejection
- Final Trendline Kiss (Retest)
- Sellers Taking Control
- Bearish Trend Continuation 📉
Three Touches. One Trendline. One Final Kiss.in $BTC
Price tested the upper resistance trendline three times, showing strong selling pressure at the same level.
Each touch created a rejection, while the candlesticks showed that buyers were losing momentum.
The final kiss (retest) at the trendline became an important moment. After rejection, $BTC
Key Technical Points:
- 3 Touches at Trendline Resistance
- Candlestick Rejection
- Final Trendline Kiss (Retest)
- Sellers Taking Control
- Bearish Trend Continuation 📉
38
·
--
ブリッシュ
翻訳参照
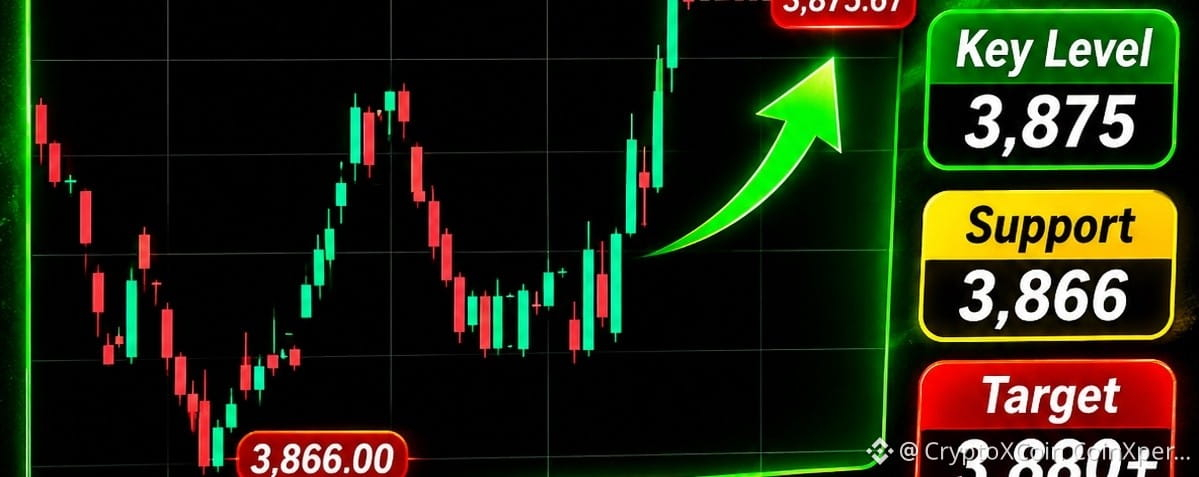
XAUT/USDT 🚀 | GOLD IS SHOWING STRENGTH!
Gold is making an interesting move right now. XAUT is trading around $3,875.67 after recovering from the $3,866 support area.
Buyers have pushed the price higher toward $3,877, but a small pullback is now visible.
Important Levels to Watch:
- Current Price: $3,875.67
- Resistance: $3,877.16
- Support: $3,872.81
- Major Support: $3,866.00
My Market View:
If buyers manage to break above $3,877 and hold that level, we could see another upward move.
However, if momentum slows down, price may revisit nearby support zones.
For now, I'm watching the next candle closely. No rushing into trades without confirmation.
Stay focused. Follow the trend, not the noise! 📊#BitcoinCoreDisclosesTorTrafficVulnerability
XAUT/USDT 🚀 | GOLD IS SHOWING STRENGTH!
Gold is making an interesting move right now. XAUT is trading around $3,875.67 after recovering from the $3,866 support area.
Buyers have pushed the price higher toward $3,877, but a small pullback is now visible.
Important Levels to Watch:
- Current Price: $3,875.67
- Resistance: $3,877.16
- Support: $3,872.81
- Major Support: $3,866.00
My Market View:
If buyers manage to break above $3,877 and hold that level, we could see another upward move.
However, if momentum slows down, price may revisit nearby support zones.
For now, I'm watching the next candle closely. No rushing into trades without confirmation.
Stay focused. Follow the trend, not the noise! 📊#BitcoinCoreDisclosesTorTrafficVulnerability
Gold is making an interesting move right now. XAUT is trading around $3,875.67 after recovering from the $3,866 support area.
Buyers have pushed the price higher toward $3,877, but a small pullback is now visible.
Important Levels to Watch:
- Current Price: $3,875.67
- Resistance: $3,877.16
- Support: $3,872.81
- Major Support: $3,866.00
My Market View:
If buyers manage to break above $3,877 and hold that level, we could see another upward move.
However, if momentum slows down, price may revisit nearby support zones.
For now, I'm watching the next candle closely. No rushing into trades without confirmation.
Stay focused. Follow the trend, not the noise! 📊#BitcoinCoreDisclosesTorTrafficVulnerability
5
記事
XAUT/USDT 🚀 ゴールド強気のブレイクアウト | 次の動きは3,880ドル超え?
キャプション:ゴールドは上XAUT/USDT 🚀 | ゴールドに強さが見られる!$GOLD.US
ゴールドは現在、興味深い値動きを見せています。XAUTは3,866ドルのサポートエリアから反発し、現在は3,875.67ドル付近で取引されています。
買い手が価格を3,877ドルに向けて押し上げましたが、現在は小幅な押し戻しが見られます。
注目すべき重要な価格水準:
- 現在価格:3,875.67ドル
- レジスタンス:3,877.16ドル
- サポート:3,872.81ドル
- 主要サポート:3,866.00ドル
相場の見通し:
買い手が3,877ドルを上抜け、その水準を維持できれば、さらなる上昇が見込めるでしょう。
ただし、勢いが弱まれば、価格は近くのサポートゾーンを再び試す可能性があります。$GOLD.US
XAUT/USDT 🚀 ゴールド強気のブレイクアウト | 次の動きは3,880ドル超え? キャプション:ゴールドは上
XAUT/USDT 🚀 | ゴールドに強さが見られる!$GOLD.US
ゴールドは現在、興味深い値動きを見せています。XAUTは3,866ドルのサポートエリアから反発し、現在は3,875.67ドル付近で取引されています。
買い手が価格を3,877ドルに向けて押し上げましたが、現在は小幅な押し戻しが見られます。
注目すべき重要な価格水準:
- 現在価格:3,875.67ドル
- レジスタンス:3,877.16ドル
- サポート:3,872.81ドル
- 主要サポート:3,866.00ドル
相場の見通し:
買い手が3,877ドルを上抜け、その水準を維持できれば、さらなる上昇が見込めるでしょう。
ただし、勢いが弱まれば、価格は近くのサポートゾーンを再び試す可能性があります。$GOLD.US
ゴールドは現在、興味深い値動きを見せています。XAUTは3,866ドルのサポートエリアから反発し、現在は3,875.67ドル付近で取引されています。
買い手が価格を3,877ドルに向けて押し上げましたが、現在は小幅な押し戻しが見られます。
注目すべき重要な価格水準:
- 現在価格:3,875.67ドル
- レジスタンス:3,877.16ドル
- サポート:3,872.81ドル
- 主要サポート:3,866.00ドル
相場の見通し:
買い手が3,877ドルを上抜け、その水準を維持できれば、さらなる上昇が見込めるでしょう。
ただし、勢いが弱まれば、価格は近くのサポートゾーンを再び試す可能性があります。$GOLD.US
1
251
記事
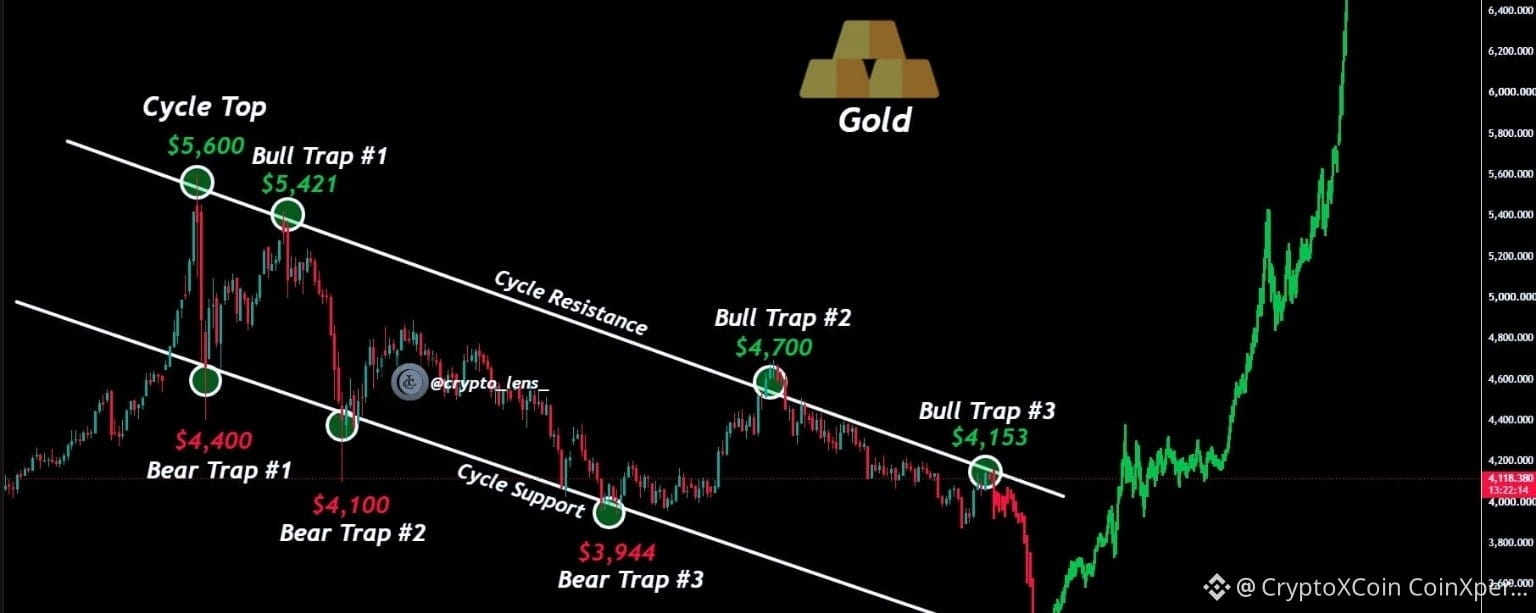
金価格に警戒 ⚠️ | 大きな値動きが近づいている可能性
キャプション:群衆に流されず、動向を見極めましょう**金相場アップデート ⚠️ | 注目すべき重要な水準**
金価格は現在、非常に重要な価格帯にあります。相場は強気に見えるかもしれませんが、反転の可能性も依然としてあります。
以前にも似たような相場展開がありました。確認せずに慌てて買いに走らないようにしましょう。賢明なトレーダーは冷静さを保ち、資金を守ります。
**相場見通しは引き続き変わりません:**
🎯 $4,116 → $3,800 → $3,600 → $3,400 → 新たな強気サイクル
これらの水準に注目し、今後数週間で市場がどう反応するかを見守りましょう。
金価格に警戒 ⚠️ | 大きな値動きが近づいている可能性 キャプション:群衆に流されず、動向を見極めましょう
**金相場アップデート ⚠️ | 注目すべき重要な水準**
金価格は現在、非常に重要な価格帯にあります。相場は強気に見えるかもしれませんが、反転の可能性も依然としてあります。
以前にも似たような相場展開がありました。確認せずに慌てて買いに走らないようにしましょう。賢明なトレーダーは冷静さを保ち、資金を守ります。
**相場見通しは引き続き変わりません:**
🎯 $4,116 → $3,800 → $3,600 → $3,400 → 新たな強気サイクル
これらの水準に注目し、今後数週間で市場がどう反応するかを見守りましょう。
金価格は現在、非常に重要な価格帯にあります。相場は強気に見えるかもしれませんが、反転の可能性も依然としてあります。
以前にも似たような相場展開がありました。確認せずに慌てて買いに走らないようにしましょう。賢明なトレーダーは冷静さを保ち、資金を守ります。
**相場見通しは引き続き変わりません:**
🎯 $4,116 → $3,800 → $3,600 → $3,400 → 新たな強気サイクル
これらの水準に注目し、今後数週間で市場がどう反応するかを見守りましょう。
1.1k

記事
翻訳参照
BITCOIN:$$BTC
# 🚨 BITCOIN: THE BEAR TRAP MAY BE HERE!
Bitcoin is showing an interesting move, and the next few levels could be very important.
I previously highlighted the possibility of a drop below $71K, with $68K as the next key support level. Now, all eyes are on what Bitcoin does next.
**My current market outlook:**$ETH
📉 $71K → $67K — Potential Bear Trap
📈 $67K → $100K → $114K — Possible bullish recovery targets
The market can change quickly, so don't rush into trades. Watch the key levels, manage your risk, and wait for confirmation before making any decisions.
Stay alert for the next Bitcoin upda
te!
**$BTC ** 🚀$
BITCOIN:$
$BTC
# 🚨 BITCOIN: THE BEAR TRAP MAY BE HERE!
Bitcoin is showing an interesting move, and the next few levels could be very important.
I previously highlighted the possibility of a drop below $71K, with $68K as the next key support level. Now, all eyes are on what Bitcoin does next.
**My current market outlook:**$ETH
📉 $71K → $67K — Potential Bear Trap
📈 $67K → $100K → $114K — Possible bullish recovery targets
The market can change quickly, so don't rush into trades. Watch the key levels, manage your risk, and wait for confirmation before making any decisions.
Stay alert for the next Bitcoin upda
te!
**$BTC ** 🚀$
# 🚨 BITCOIN: THE BEAR TRAP MAY BE HERE!
Bitcoin is showing an interesting move, and the next few levels could be very important.
I previously highlighted the possibility of a drop below $71K, with $68K as the next key support level. Now, all eyes are on what Bitcoin does next.
**My current market outlook:**$ETH
📉 $71K → $67K — Potential Bear Trap
📈 $67K → $100K → $114K — Possible bullish recovery targets
The market can change quickly, so don't rush into trades. Watch the key levels, manage your risk, and wait for confirmation before making any decisions.
Stay alert for the next Bitcoin upda
te!
**$BTC ** 🚀$
219
ログインして、さらにコンテンツを読む
厳選トピックで世界の暗号資産トレーダーの仲間入り
⚡️ 暗号資産に関する最新かつ有益な情報が見つかります。
💬 世界最大の暗号資産取引所から信頼されています。
👍 認証を受けたクリエイターから、有益なインサイトを得られます。
メール / 電話番号