
User-15630e79
13 投稿

User-15630e79
報告
ユーザーをブロック
取引を発注
1日
1 フォロー
0 フォロワー
0 いいね
投稿
ポートフォリオ
翻訳参照
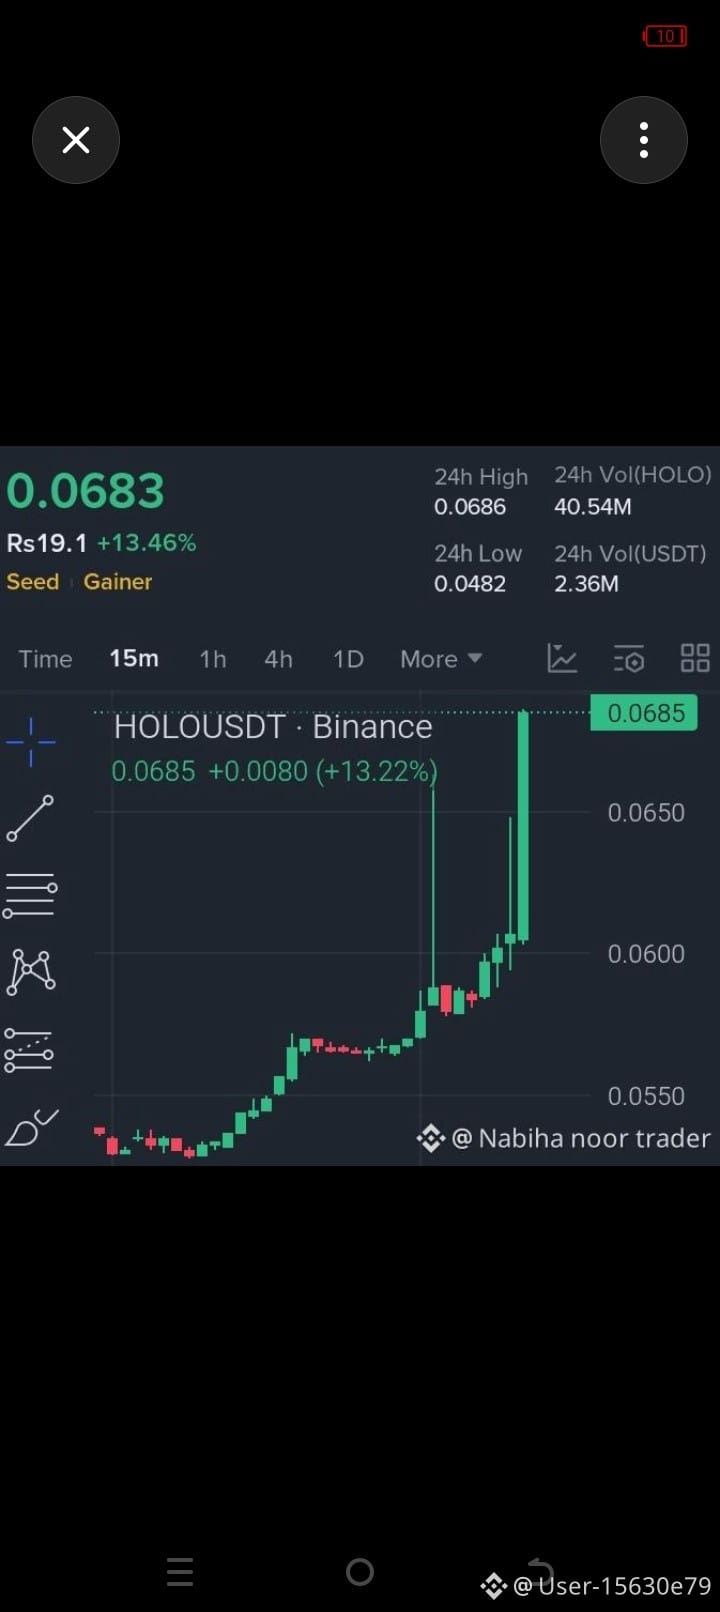
$HOT 🚀 Today's Top Binance Gainer: HOT (Holo)
آج 9 نومبر 2026 کے Binance مارکیٹ ڈیٹا میں HOT (Holo) نمایاں Top Gainers میں پہلے نمبر پر دکھائی دے رہا ہے۔
📊 HOT Coin Analysis – 10 Lines
Coin Name: HOT (Holo).
Trading Pair: HOT/USDT.
24H Change: Binance ranking کے ایک snapshot میں تقریباً +29.80% اضافہ۔
Current Price: تقریباً $0.000410 (قیمت مسلسل تبدیل ہوتی ہے)۔
24H High: تقریباً $0.0004912۔
24H Low: تقریباً $0.0003488۔
Market Trend: گزشتہ 24 گھنٹوں میں قیمت میں نمایاں اضافہ ہوا ہے۔
Selling Pressure: بلند قیمت سے نیچے آنے پر کچھ خریدار منافع لے رہے ہیں۔
Risk: قیمت دوبارہ اوپر بھی جا سکتی ہے اور نیچے بھی گر سکتی ہے۔
My Analysis: فوری Buy کرنے کے بجائے Support اور Resistance کا انتظار کرنا بہتر ہے۔
�
Binance +1
📈 اہم لیولز
Resistance: $0.0004912
Support: $0.0003488
میری رائے: HOT میں تیزی ضرور نظر آئی ہے، لیکن Binance کے تازہ تجزیے میں کمزور ہوتے Momentum اور Profit Taking کے اشارے بھی موجود ہیں۔ اس لیے ابھی مزید اضافے کی ضمانت نہیں ہے۔
#Binance #HotTrends T #Holo #CryptoAnalysis #TopGainers #Bitcoin #SpotTrading #CryptoMarket #TradingSignals
$HOT 🚀 Today's Top Binance Gainer: HOT (Holo)
آج 9 نومبر 2026 کے Binance مارکیٹ ڈیٹا میں HOT (Holo) نمایاں Top Gainers میں پہلے نمبر پر دکھائی دے رہا ہے۔
📊 HOT Coin Analysis – 10 Lines
Coin Name: HOT (Holo).
Trading Pair: HOT/USDT.
24H Change: Binance ranking کے ایک snapshot میں تقریباً +29.80% اضافہ۔
Current Price: تقریباً $0.000410 (قیمت مسلسل تبدیل ہوتی ہے)۔
24H High: تقریباً $0.0004912۔
24H Low: تقریباً $0.0003488۔
Market Trend: گزشتہ 24 گھنٹوں میں قیمت میں نمایاں اضافہ ہوا ہے۔
Selling Pressure: بلند قیمت سے نیچے آنے پر کچھ خریدار منافع لے رہے ہیں۔
Risk: قیمت دوبارہ اوپر بھی جا سکتی ہے اور نیچے بھی گر سکتی ہے۔
My Analysis: فوری Buy کرنے کے بجائے Support اور Resistance کا انتظار کرنا بہتر ہے۔
�
Binance +1
📈 اہم لیولز
Resistance: $0.0004912
Support: $0.0003488
میری رائے: HOT میں تیزی ضرور نظر آئی ہے، لیکن Binance کے تازہ تجزیے میں کمزور ہوتے Momentum اور Profit Taking کے اشارے بھی موجود ہیں۔ اس لیے ابھی مزید اضافے کی ضمانت نہیں ہے۔
#Binance #HotTrends T #Holo #CryptoAnalysis #TopGainers #Bitcoin #SpotTrading #CryptoMarket #TradingSignals
آج 9 نومبر 2026 کے Binance مارکیٹ ڈیٹا میں HOT (Holo) نمایاں Top Gainers میں پہلے نمبر پر دکھائی دے رہا ہے۔
📊 HOT Coin Analysis – 10 Lines
Coin Name: HOT (Holo).
Trading Pair: HOT/USDT.
24H Change: Binance ranking کے ایک snapshot میں تقریباً +29.80% اضافہ۔
Current Price: تقریباً $0.000410 (قیمت مسلسل تبدیل ہوتی ہے)۔
24H High: تقریباً $0.0004912۔
24H Low: تقریباً $0.0003488۔
Market Trend: گزشتہ 24 گھنٹوں میں قیمت میں نمایاں اضافہ ہوا ہے۔
Selling Pressure: بلند قیمت سے نیچے آنے پر کچھ خریدار منافع لے رہے ہیں۔
Risk: قیمت دوبارہ اوپر بھی جا سکتی ہے اور نیچے بھی گر سکتی ہے۔
My Analysis: فوری Buy کرنے کے بجائے Support اور Resistance کا انتظار کرنا بہتر ہے۔
�
Binance +1
📈 اہم لیولز
Resistance: $0.0004912
Support: $0.0003488
میری رائے: HOT میں تیزی ضرور نظر آئی ہے، لیکن Binance کے تازہ تجزیے میں کمزور ہوتے Momentum اور Profit Taking کے اشارے بھی موجود ہیں۔ اس لیے ابھی مزید اضافے کی ضمانت نہیں ہے۔
#Binance #HotTrends T #Holo #CryptoAnalysis #TopGainers #Bitcoin #SpotTrading #CryptoMarket #TradingSignals
翻訳参照
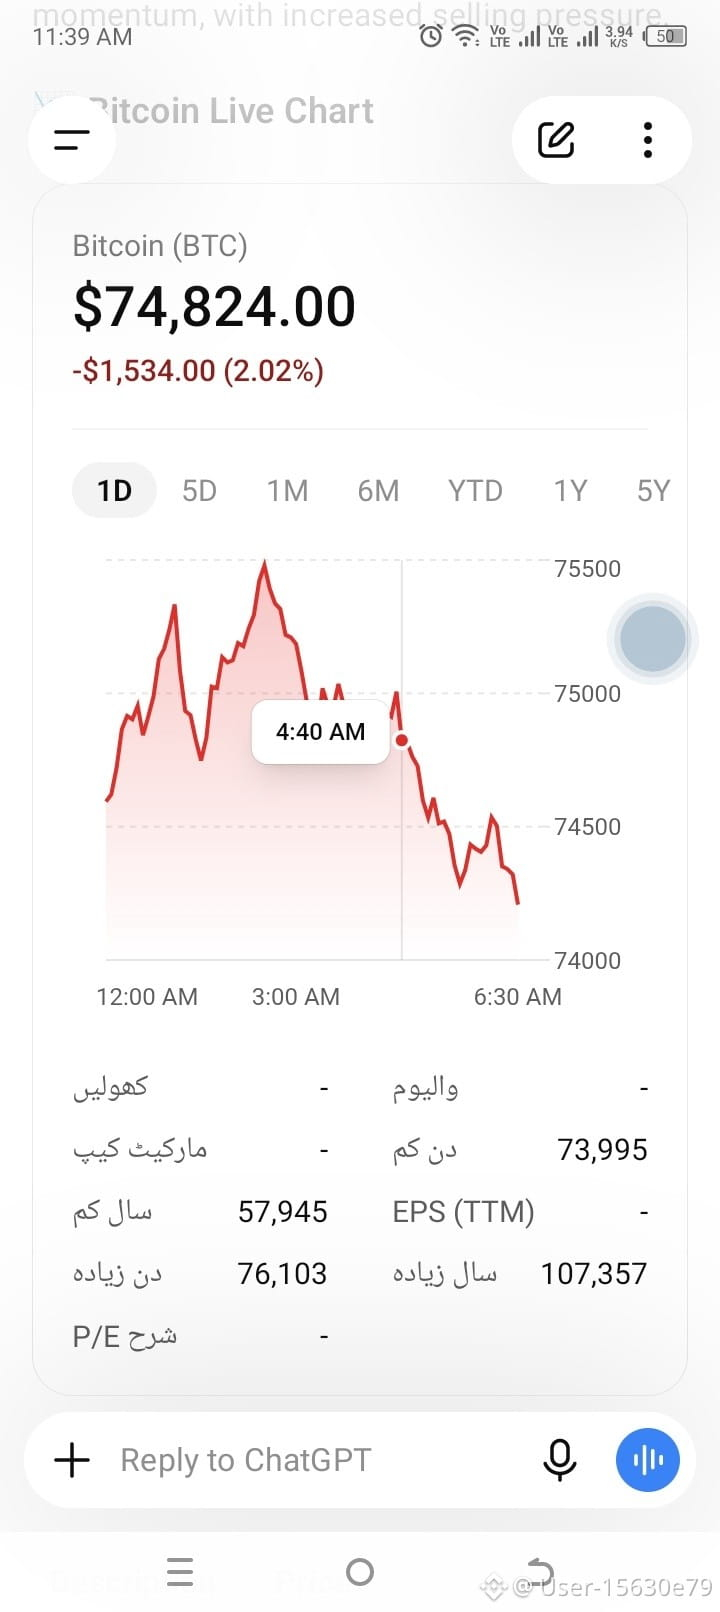
📊 $BTC #BinanceReopensWithdrawalsForMoreAssets (BTC) Latest Market Analysis – November 9, 2026
Current Market Trend: BEARISH (Downward) 🔴
Bitcoin is currently showing downward momentum, with increased selling pressure.
📉 Bitcoin Live Chart
Important Price Levels
Description
Price
Current Price
$74,223
Support 1
$73,500
Support 2
$72,000
Resistance 1
$76,000
Resistance 2
$78,000
🔴 10 Lines of Bitcoin Analysis
Bitcoin is currently showing bearish momentum.
Selling pressure is increasing.
Buyers are trying to defend the support level.
The market is highly volatile.
Resistance is near $76,000.
Support is near $73,500.
A breakout above resistance may push the price higher.
A breakdown below support may cause further losses.
Traders should wait for market confirmation.
Always use Stop Loss to manage risk.
📌 Market Prediction
🔴 Downward: Bearish pressure is currently stronger.
🟢 Upward: A strong breakout above $76,000 could signal recovery.
#Bitcoin #BTC #Binance #CryptoTrading #MarketAnalysis #Bullish #BearishOutlook #TradingSignals #CryptoMarket
📊 $BTC #BinanceReopensWithdrawalsForMoreAssets (BTC) Latest Market Analysis – November 9, 2026
Current Market Trend: BEARISH (Downward) 🔴
Bitcoin is currently showing downward momentum, with increased selling pressure.
📉 Bitcoin Live Chart
Important Price Levels
Description
Price
Current Price
$74,223
Support 1
$73,500
Support 2
$72,000
Resistance 1
$76,000
Resistance 2
$78,000
🔴 10 Lines of Bitcoin Analysis
Bitcoin is currently showing bearish momentum.
Selling pressure is increasing.
Buyers are trying to defend the support level.
The market is highly volatile.
Resistance is near $76,000.
Support is near $73,500.
A breakout above resistance may push the price higher.
A breakdown below support may cause further losses.
Traders should wait for market confirmation.
Always use Stop Loss to manage risk.
📌 Market Prediction
🔴 Downward: Bearish pressure is currently stronger.
🟢 Upward: A strong breakout above $76,000 could signal recovery.
#Bitcoin #BTC #Binance #CryptoTrading #MarketAnalysis #Bullish #BearishOutlook #TradingSignals #CryptoMarket
Current Market Trend: BEARISH (Downward) 🔴
Bitcoin is currently showing downward momentum, with increased selling pressure.
📉 Bitcoin Live Chart
Important Price Levels
Description
Price
Current Price
$74,223
Support 1
$73,500
Support 2
$72,000
Resistance 1
$76,000
Resistance 2
$78,000
🔴 10 Lines of Bitcoin Analysis
Bitcoin is currently showing bearish momentum.
Selling pressure is increasing.
Buyers are trying to defend the support level.
The market is highly volatile.
Resistance is near $76,000.
Support is near $73,500.
A breakout above resistance may push the price higher.
A breakdown below support may cause further losses.
Traders should wait for market confirmation.
Always use Stop Loss to manage risk.
📌 Market Prediction
🔴 Downward: Bearish pressure is currently stronger.
🟢 Upward: A strong breakout above $76,000 could signal recovery.
#Bitcoin #BTC #Binance #CryptoTrading #MarketAnalysis #Bullish #BearishOutlook #TradingSignals #CryptoMarket
32
翻訳参照
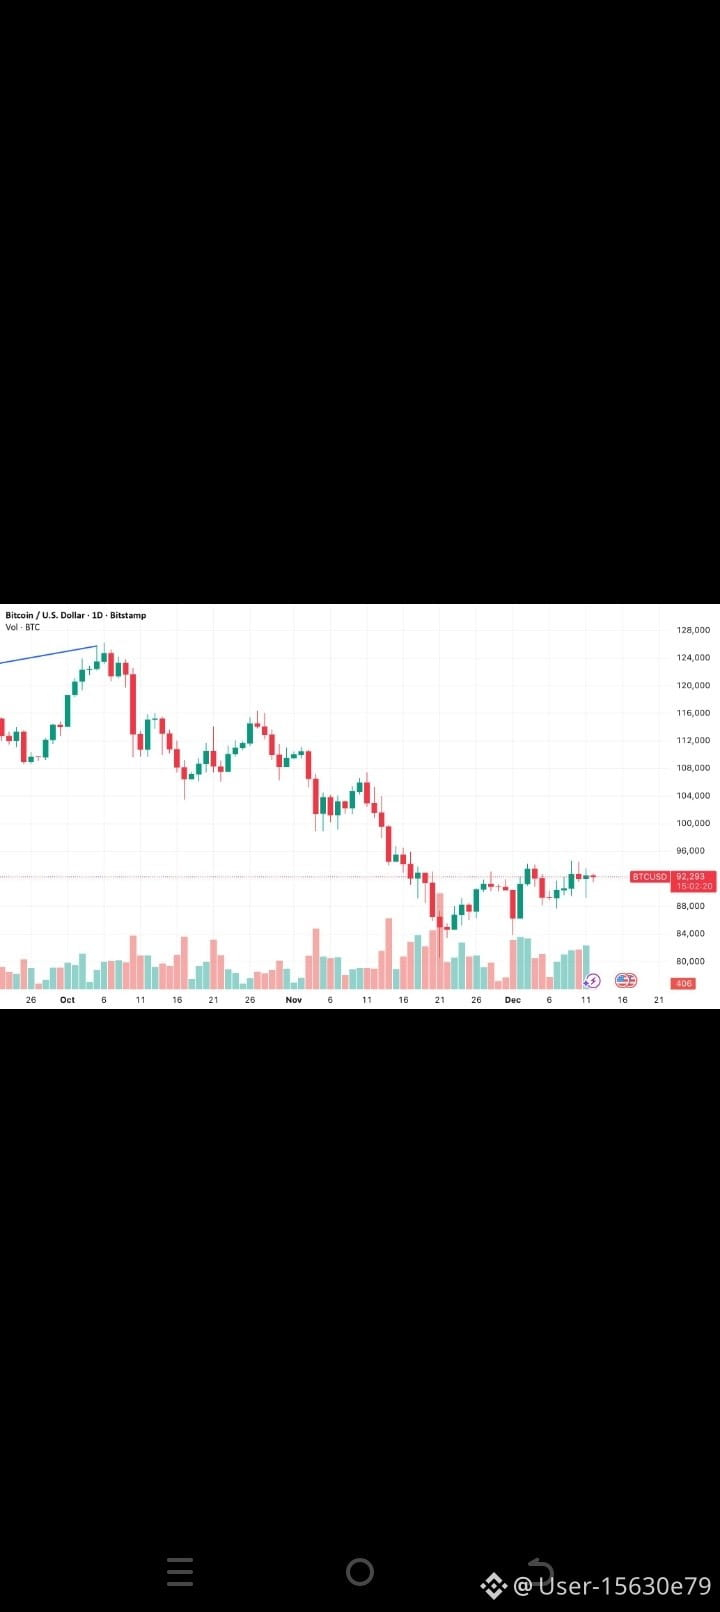
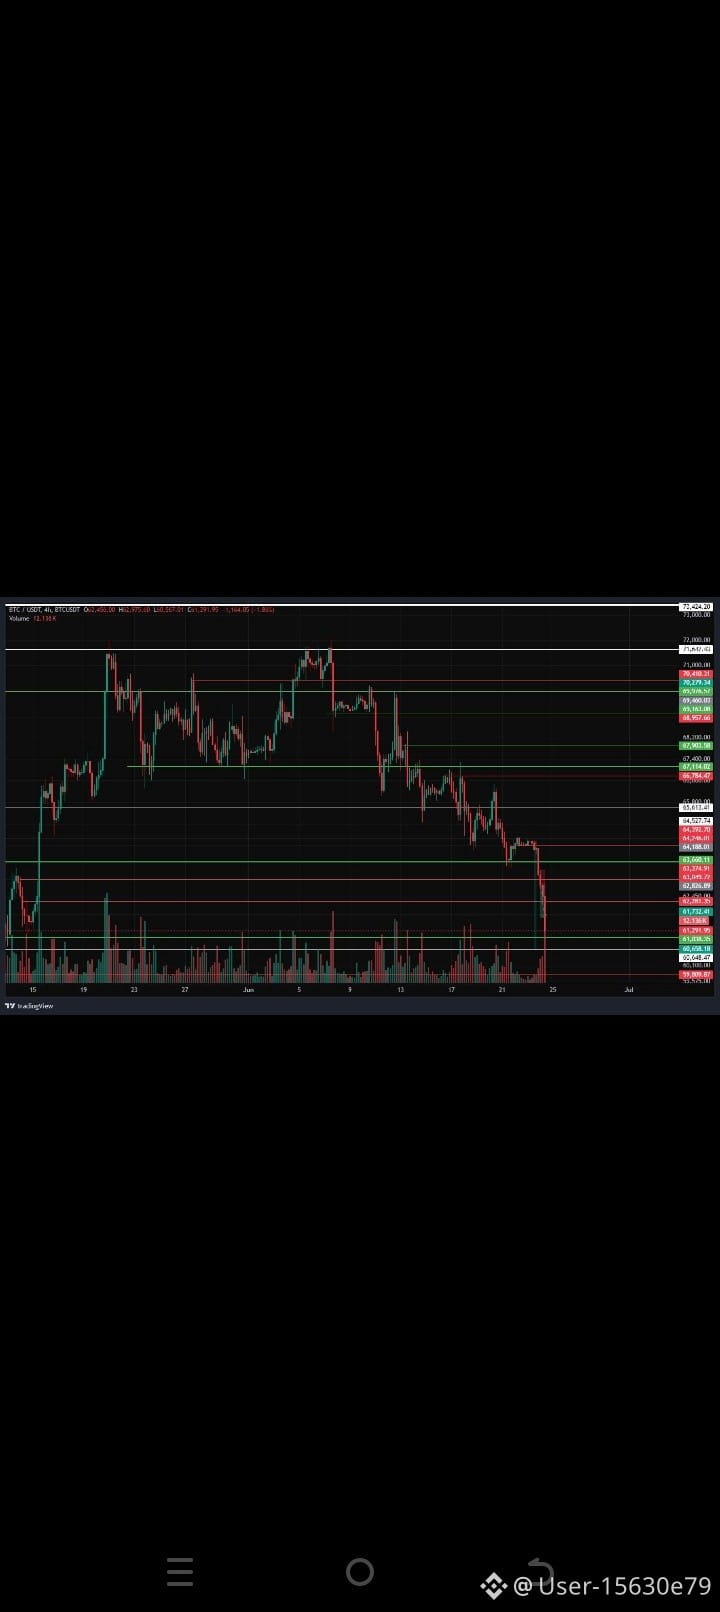
$BTC $📊 Bitcoin (BTC) Latest Market Analysis – 9 November 2026
Current Market Direction: 🔴 Bearish (Downward Pressure)
According to the latest market news, Bitcoin is facing selling pressure. At the moment, the chances of a further decline appear higher in the short term, but a recovery is also possible.
📰 Latest Bitcoin News
Bitcoin dropped below $74,000 during recent trading.
On November 9, Reuters reported BTC touching $73,708.
Investors are worried about stricter US cryptocurrency regulations.
Recent Binance security concerns have affected market confidence.
Selling pressure is currently stronger.
Bitcoin is facing resistance around $76,331.
Support is around $73,885.
If Bitcoin breaks below support, further losses are possible.
If buyers push Bitcoin above $76,331, recovery may begin.
Traders are watching the market closely. �
Investing.com Australia +1
📈 BUY vs SELL Analysis
Trading Signal
Direction
SELL 🔴
Stronger short-term pressure
BUY 🟢
Possible recovery$
Market Trend
Bearish
Overall Outlook
Cautious
Important Bitcoin Levels
🔴 Resistance: $76,331
🟢 Support: $73,885
🔻 Next Support: $71,777
My Analysis: Short-term direction is leaning DOWN 📉. A confirmed break below $73,885 could increase selling pressure. A move above $76,331 could strengthen buyers.
⚠️ These are market scenarios, not guaranteed predictions. Do not enter a trade without checking the live Binan#ce chart and using Stop Loss.
🔥 Hashtags
#Bitcoin #BTC #Binance #BitcoinAnalysis #CryptoNews #BTCUSDT #CryptoTrading #MarketAnalysis #Bullish #Bearish #BuySignal #SellSignal #BitcoinPrediction #CryptoMarket #TradingSignals
$BTC $📊 Bitcoin (BTC) Latest Market Analysis – 9 November 2026
Current Market Direction: 🔴 Bearish (Downward Pressure)
According to the latest market news, Bitcoin is facing selling pressure. At the moment, the chances of a further decline appear higher in the short term, but a recovery is also possible.
📰 Latest Bitcoin News
Bitcoin dropped below $74,000 during recent trading.
On November 9, Reuters reported BTC touching $73,708.
Investors are worried about stricter US cryptocurrency regulations.
Recent Binance security concerns have affected market confidence.
Selling pressure is currently stronger.
Bitcoin is facing resistance around $76,331.
Support is around $73,885.
If Bitcoin breaks below support, further losses are possible.
If buyers push Bitcoin above $76,331, recovery may begin.
Traders are watching the market closely. �
Investing.com Australia +1
📈 BUY vs SELL Analysis
Trading Signal
Direction
SELL 🔴
Stronger short-term pressure
BUY 🟢
Possible recovery$
Market Trend
Bearish
Overall Outlook
Cautious
Important Bitcoin Levels
🔴 Resistance: $76,331
🟢 Support: $73,885
🔻 Next Support: $71,777
My Analysis: Short-term direction is leaning DOWN 📉. A confirmed break below $73,885 could increase selling pressure. A move above $76,331 could strengthen buyers.
⚠️ These are market scenarios, not guaranteed predictions. Do not enter a trade without checking the live Binan#ce chart and using Stop Loss.
🔥 Hashtags
#Bitcoin #BTC #Binance #BitcoinAnalysis #CryptoNews #BTCUSDT #CryptoTrading #MarketAnalysis #Bullish #Bearish #BuySignal #SellSignal #BitcoinPrediction #CryptoMarket #TradingSignals
Current Market Direction: 🔴 Bearish (Downward Pressure)
According to the latest market news, Bitcoin is facing selling pressure. At the moment, the chances of a further decline appear higher in the short term, but a recovery is also possible.
📰 Latest Bitcoin News
Bitcoin dropped below $74,000 during recent trading.
On November 9, Reuters reported BTC touching $73,708.
Investors are worried about stricter US cryptocurrency regulations.
Recent Binance security concerns have affected market confidence.
Selling pressure is currently stronger.
Bitcoin is facing resistance around $76,331.
Support is around $73,885.
If Bitcoin breaks below support, further losses are possible.
If buyers push Bitcoin above $76,331, recovery may begin.
Traders are watching the market closely. �
Investing.com Australia +1
📈 BUY vs SELL Analysis
Trading Signal
Direction
SELL 🔴
Stronger short-term pressure
BUY 🟢
Possible recovery$
Market Trend
Bearish
Overall Outlook
Cautious
Important Bitcoin Levels
🔴 Resistance: $76,331
🟢 Support: $73,885
🔻 Next Support: $71,777
My Analysis: Short-term direction is leaning DOWN 📉. A confirmed break below $73,885 could increase selling pressure. A move above $76,331 could strengthen buyers.
⚠️ These are market scenarios, not guaranteed predictions. Do not enter a trade without checking the live Binan#ce chart and using Stop Loss.
🔥 Hashtags
#Bitcoin #BTC #Binance #BitcoinAnalysis #CryptoNews #BTCUSDT #CryptoTrading #MarketAnalysis #Bullish #Bearish #BuySignal #SellSignal #BitcoinPrediction #CryptoMarket #TradingSignals
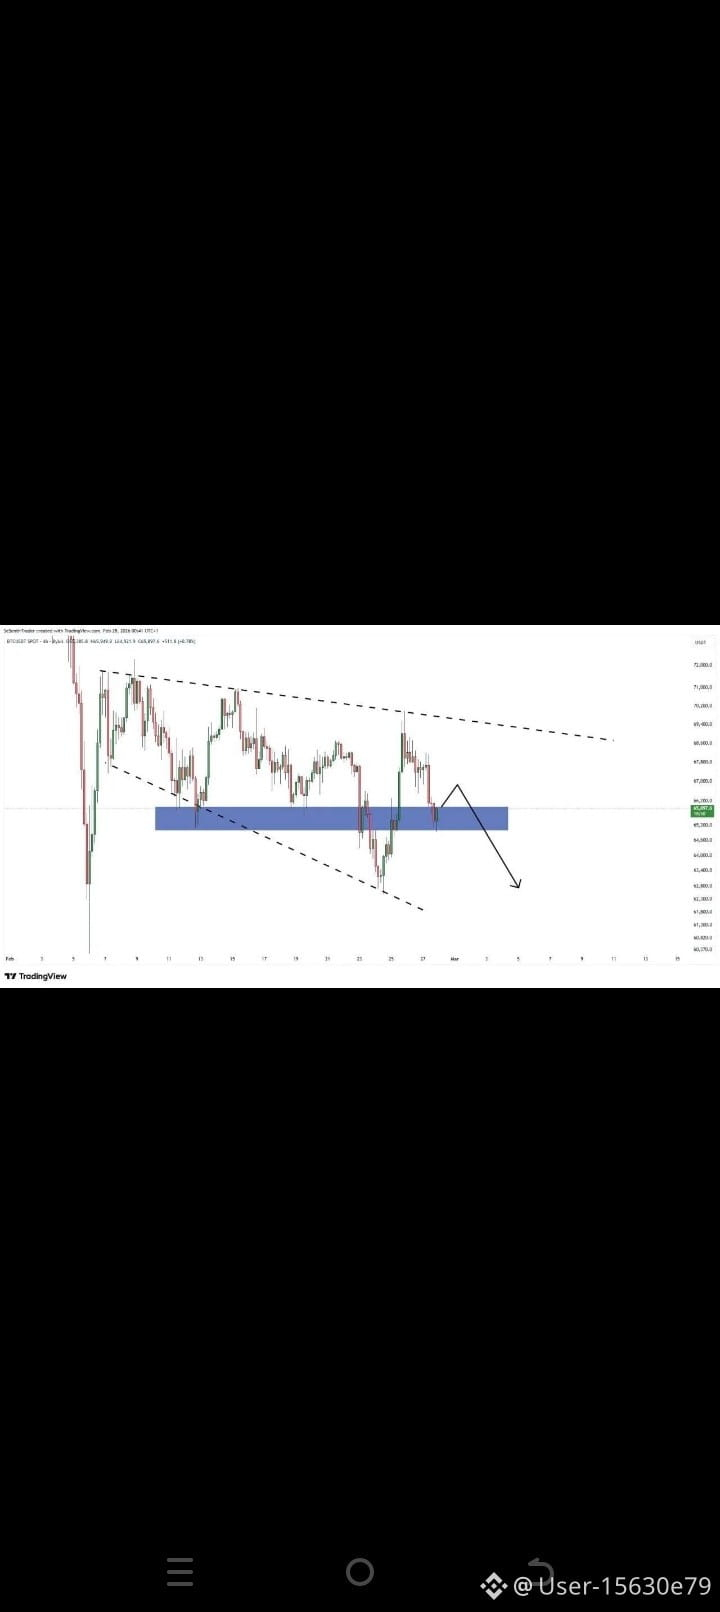
33
$BTC 🔥 バイナンス取引で注目の強力なローソク足パターン7選
強気の包み足 🟢 – 価格上昇の可能性を示します(買い)。
弱気の包み足 🔴 – 価格下落の可能性を示します(売り)。
ハンマー 🟢 – 強気への反転の可能性を示します。
流れ星 🔴 – 弱気への反転の可能性を示します。
明けの明星 🟢 – 上昇トレンドの可能性を示します。
宵の明星 🔴 – 下落トレンドの可能性を示します。
丸坊主 🟢🔴 – 強い買い圧力または売り圧力を示します。
📊 取引のヒント
常に市場のトレンドを確認しましょう。
取引量でシグナルを確認しましょう。
ローソク足が確定するまで待ちましょう。
ストップロスを設定してリスクを管理しましょう。
ローソク足1本だけを根拠に取引しないでください。 #暗号資産分析 #取引のヒント #買いシグナル #売りシグナル #テクニカル分析 #暗号資産市場 #BTCUSDT #現物取引 #TradingEducation #CryptoInvestingTips #BitcoinFiveWeeklyLosses
$BTC 🔥 バイナンス取引で注目の強力なローソク足パターン7選
強気の包み足 🟢 – 価格上昇の可能性を示します(買い)。
弱気の包み足 🔴 – 価格下落の可能性を示します(売り)。
ハンマー 🟢 – 強気への反転の可能性を示します。
流れ星 🔴 – 弱気への反転の可能性を示します。
明けの明星 🟢 – 上昇トレンドの可能性を示します。
宵の明星 🔴 – 下落トレンドの可能性を示します。
丸坊主 🟢🔴 – 強い買い圧力または売り圧力を示します。
📊 取引のヒント
常に市場のトレンドを確認しましょう。
取引量でシグナルを確認しましょう。
ローソク足が確定するまで待ちましょう。
ストップロスを設定してリスクを管理しましょう。
ローソク足1本だけを根拠に取引しないでください。 #暗号資産分析 #取引のヒント #買いシグナル #売りシグナル #テクニカル分析 #暗号資産市場 #BTCUSDT #現物取引 #TradingEducation #CryptoInvestingTips #BitcoinFiveWeeklyLosses
強気の包み足 🟢 – 価格上昇の可能性を示します(買い)。
弱気の包み足 🔴 – 価格下落の可能性を示します(売り)。
ハンマー 🟢 – 強気への反転の可能性を示します。
流れ星 🔴 – 弱気への反転の可能性を示します。
明けの明星 🟢 – 上昇トレンドの可能性を示します。
宵の明星 🔴 – 下落トレンドの可能性を示します。
丸坊主 🟢🔴 – 強い買い圧力または売り圧力を示します。
📊 取引のヒント
常に市場のトレンドを確認しましょう。
取引量でシグナルを確認しましょう。
ローソク足が確定するまで待ちましょう。
ストップロスを設定してリスクを管理しましょう。
ローソク足1本だけを根拠に取引しないでください。 #暗号資産分析 #取引のヒント #買いシグナル #売りシグナル #テクニカル分析 #暗号資産市場 #BTCUSDT #現物取引 #TradingEducation #CryptoInvestingTips #BitcoinFiveWeeklyLosses
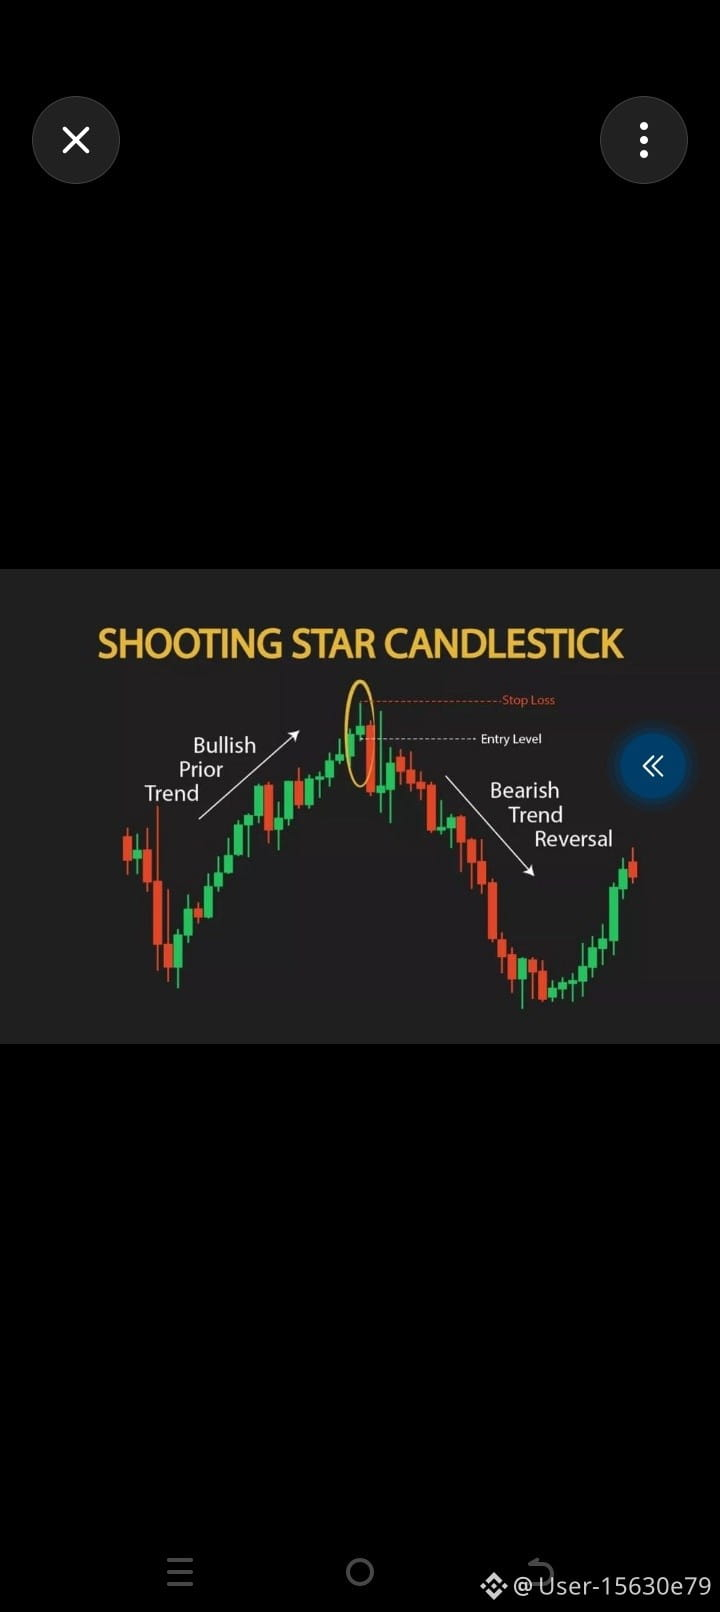
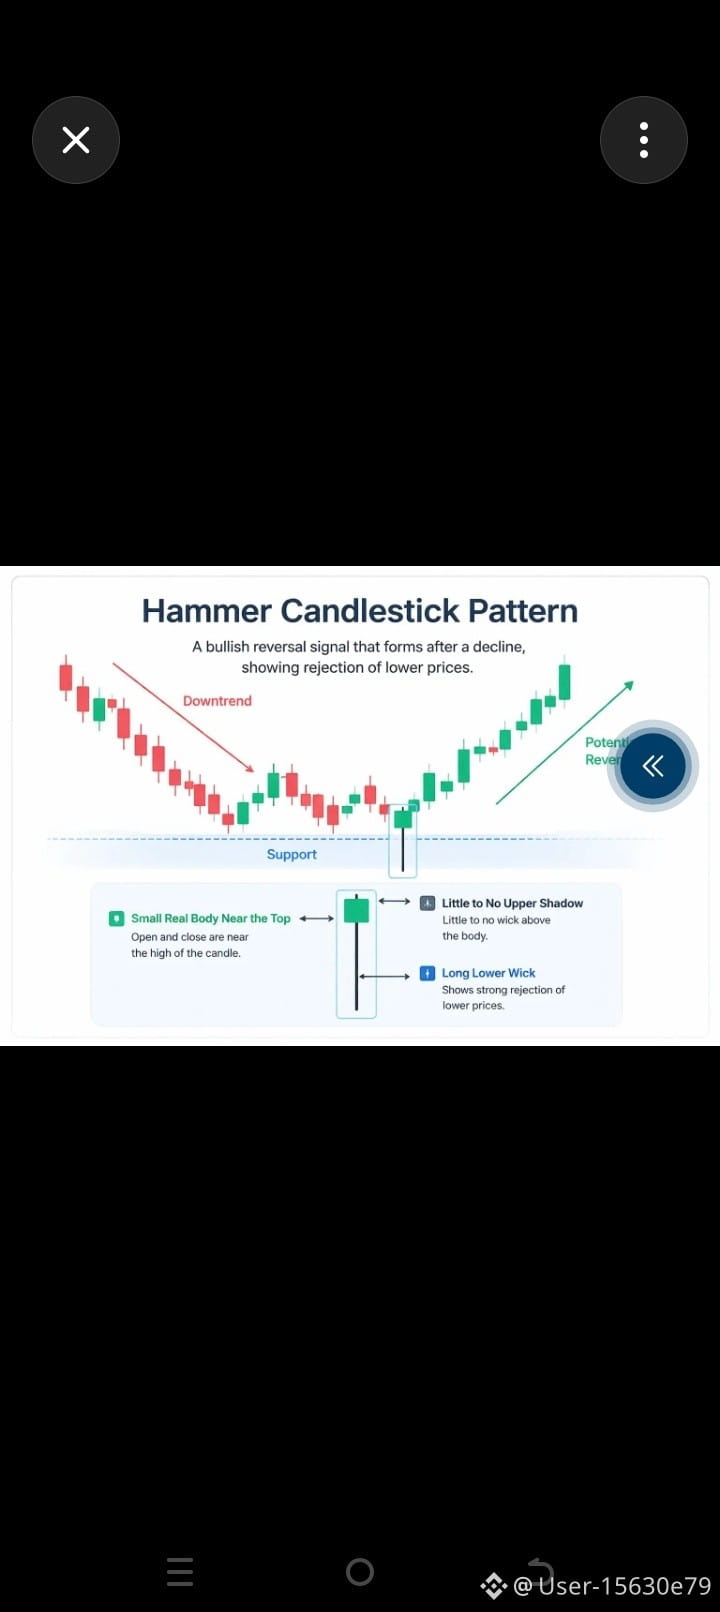
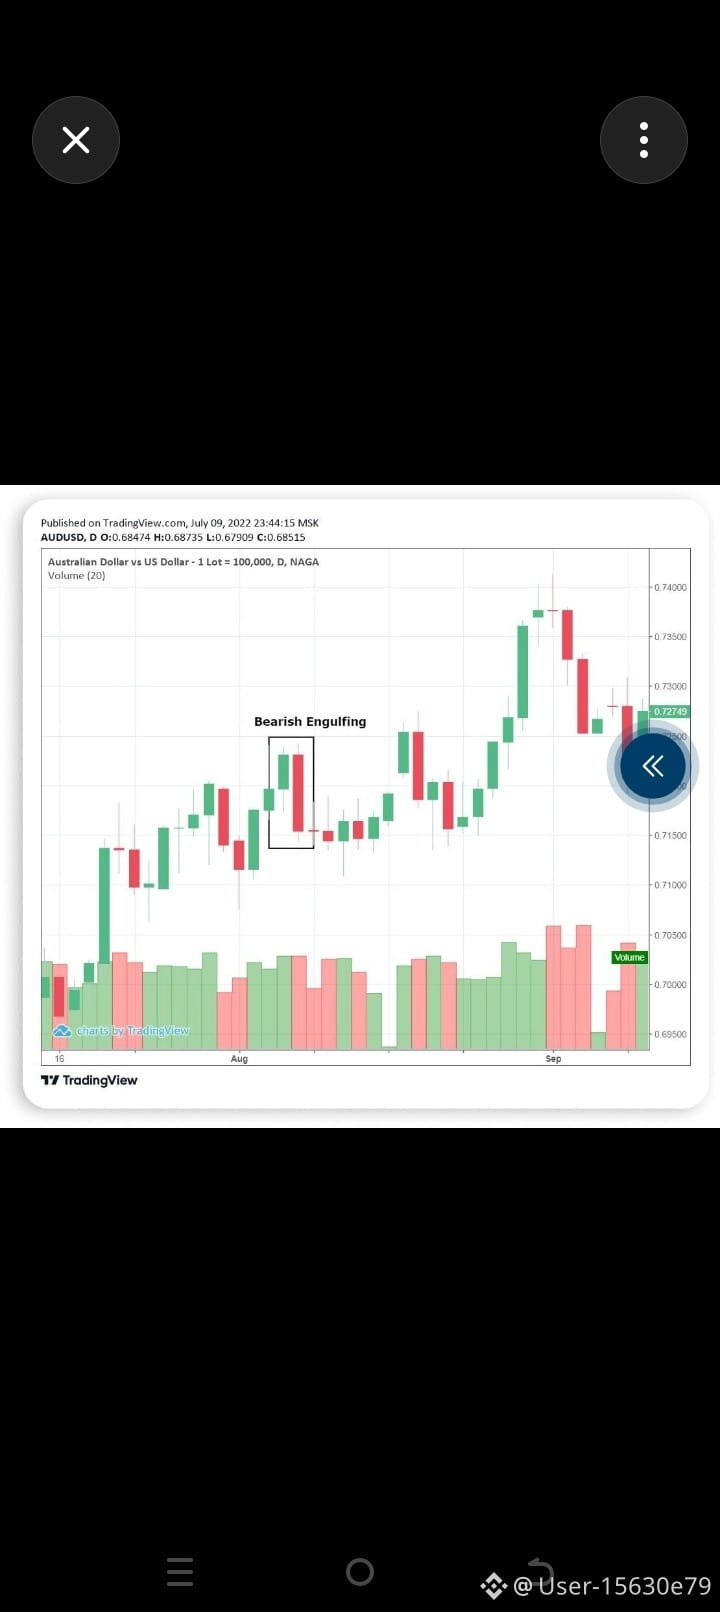
83
翻訳参照
📈$BTC Bitcoin (BTC) Market Analysis – 9 November 2026
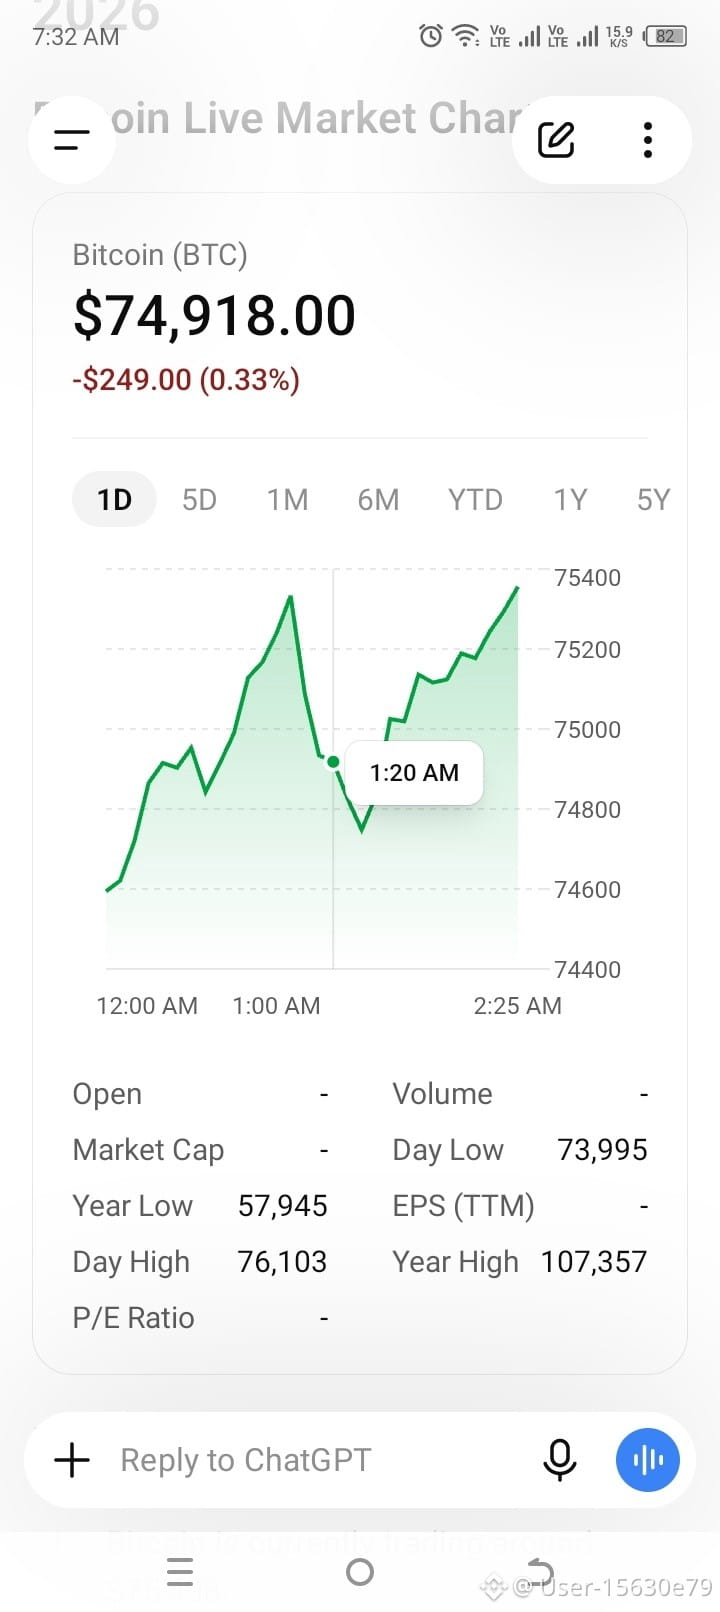
Bitcoin Live Market Chart
📊 10 Lines of Bitcoin Market Analysis
Bitcoin is currently trading around $75,408.
The market is showing a small upward recovery.
Buyers are trying to push the price higher.
The market recently experienced strong selling pressure.
Bitcoin is approaching an important resistance level.
The $76,100 level is an important area to watch.
If buyers gain strength, Bitcoin may move higher.
If sellers take control, the price may fall again.
Traders should wait for candle confirmation before buying.
Always use Stop Loss to protect your investment.
🟢 Market Direction
Short-term: Slight recovery, but the overall trend remains weak.
Important: A small upward movement does not confirm a full bullish trend. Recent market reports show significant selling pressure. �
reuters.com +1
# Hashtags
#Bitcoin #BTC #Binance #BitcoinAnalysis #CryptoMarket #BullishTrend #Trading #BuySignal #BTCUSDT #CryptoTrading
📈$BTC Bitcoin (BTC) Market Analysis – 9 November 2026
Bitcoin Live Market Chart
📊 10 Lines of Bitcoin Market Analysis
Bitcoin is currently trading around $75,408.
The market is showing a small upward recovery.
Buyers are trying to push the price higher.
The market recently experienced strong selling pressure.
Bitcoin is approaching an important resistance level.
The $76,100 level is an important area to watch.
If buyers gain strength, Bitcoin may move higher.
If sellers take control, the price may fall again.
Traders should wait for candle confirmation before buying.
Always use Stop Loss to protect your investment.
🟢 Market Direction
Short-term: Slight recovery, but the overall trend remains weak.
Important: A small upward movement does not confirm a full bullish trend. Recent market reports show significant selling pressure. �
reuters.com +1
# Hashtags
#Bitcoin #BTC #Binance #BitcoinAnalysis #CryptoMarket #BullishTrend #Trading #BuySignal #BTCUSDT #CryptoTrading
Bitcoin Live Market Chart
📊 10 Lines of Bitcoin Market Analysis
Bitcoin is currently trading around $75,408.
The market is showing a small upward recovery.
Buyers are trying to push the price higher.
The market recently experienced strong selling pressure.
Bitcoin is approaching an important resistance level.
The $76,100 level is an important area to watch.
If buyers gain strength, Bitcoin may move higher.
If sellers take control, the price may fall again.
Traders should wait for candle confirmation before buying.
Always use Stop Loss to protect your investment.
🟢 Market Direction
Short-term: Slight recovery, but the overall trend remains weak.
Important: A small upward movement does not confirm a full bullish trend. Recent market reports show significant selling pressure. �
reuters.com +1
# Hashtags
#Bitcoin #BTC #Binance #BitcoinAnalysis #CryptoMarket #BullishTrend #Trading #BuySignal #BTCUSDT #CryptoTrading
52
翻訳参照
📊 $BTC Bitcoin Market Analysis – November 9, 2026
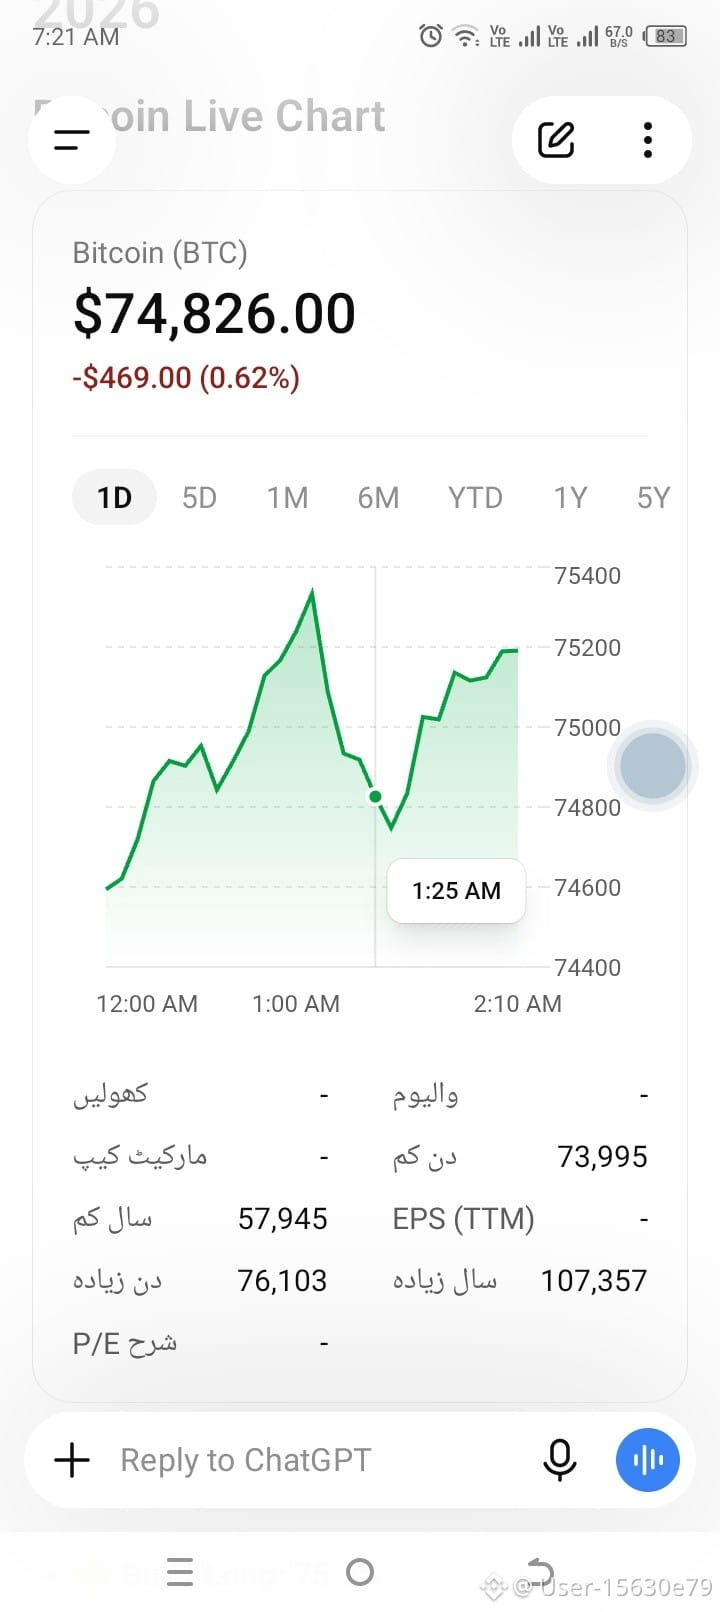
Bitcoin Live Chart
🟢 Buy vs 🔴 Sell Percentage
🟢 Buy / Long: 75.2%
🔴 Sell / Short: 24.8%
Note: These are illustrative figures, not verified live Binance trading statistics.
📉 Today's Market Analysis
Bitcoin is showing a slight downward movement.
Selling pressure is present in the market.
More traders appear to be holding Long positions.
The short-term market trend looks weak.
Wait for candle confirmation before entering a trade.
Watch the support and resistance levels.
Avoid emotional trading.
Always use a Stop Loss.
📌 Trading Advice
Wait for a clear Buy or Sell signal before entering the market. Do not risk your money based on percentages alone.
# Hashtags
#Bitcoin #BTC #Binance #CryptoTrading #BitcoinAnalysis #BuySignal #SellSignal #CryptoMarket #TradingTips #BTCUSDT
📊 $BTC Bitcoin Market Analysis – November 9, 2026
Bitcoin Live Chart
🟢 Buy vs 🔴 Sell Percentage
🟢 Buy / Long: 75.2%
🔴 Sell / Short: 24.8%
Note: These are illustrative figures, not verified live Binance trading statistics.
📉 Today's Market Analysis
Bitcoin is showing a slight downward movement.
Selling pressure is present in the market.
More traders appear to be holding Long positions.
The short-term market trend looks weak.
Wait for candle confirmation before entering a trade.
Watch the support and resistance levels.
Avoid emotional trading.
Always use a Stop Loss.
📌 Trading Advice
Wait for a clear Buy or Sell signal before entering the market. Do not risk your money based on percentages alone.
# Hashtags
#Bitcoin #BTC #Binance #CryptoTrading #BitcoinAnalysis #BuySignal #SellSignal #CryptoMarket #TradingTips #BTCUSDT
Bitcoin Live Chart
🟢 Buy vs 🔴 Sell Percentage
🟢 Buy / Long: 75.2%
🔴 Sell / Short: 24.8%
Note: These are illustrative figures, not verified live Binance trading statistics.
📉 Today's Market Analysis
Bitcoin is showing a slight downward movement.
Selling pressure is present in the market.
More traders appear to be holding Long positions.
The short-term market trend looks weak.
Wait for candle confirmation before entering a trade.
Watch the support and resistance levels.
Avoid emotional trading.
Always use a Stop Loss.
📌 Trading Advice
Wait for a clear Buy or Sell signal before entering the market. Do not risk your money based on percentages alone.
# Hashtags
#Bitcoin #BTC #Binance #CryptoTrading #BitcoinAnalysis #BuySignal #SellSignal #CryptoMarket #TradingTips #BTCUSDT
76
翻訳参照
#BitcoinTrading #SpotTrading #StopLoss #LearnTrading $BTC 📊 Bitcoin Trading Candles – 10 Important Lines
Writing
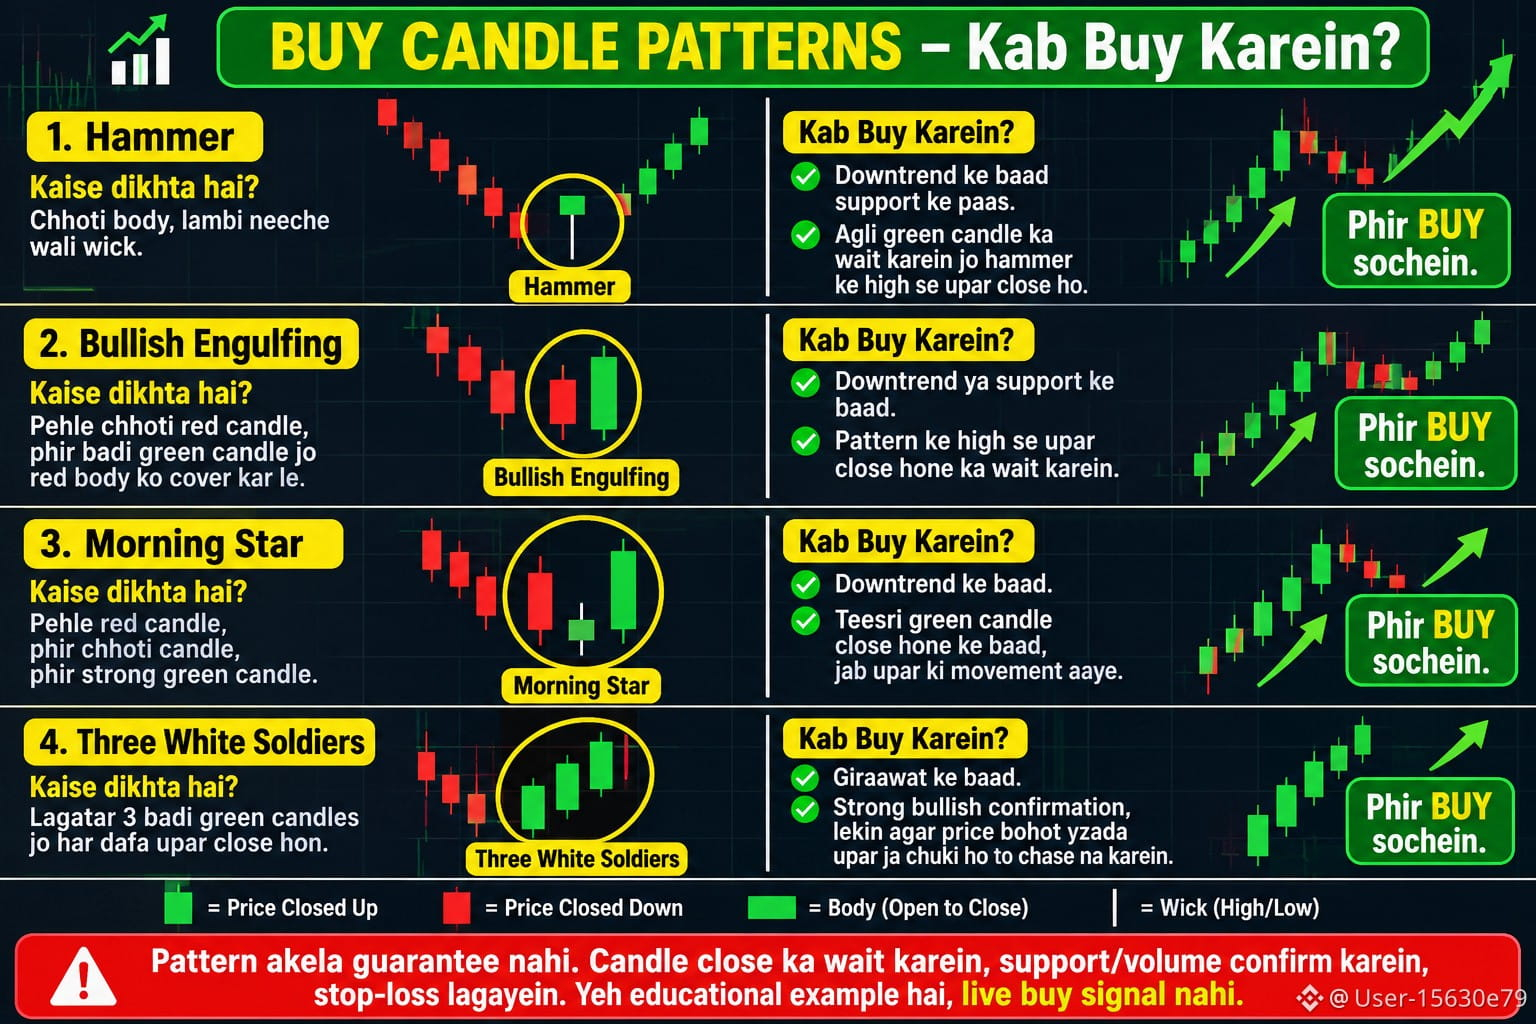
Hammer Candle: Yeh aksar price girne ke baad banti hai aur market mein buying ka signal de sakti hai.
Bullish Engulfing: Green candle pichhli red candle ko cover kar leti hai. Yeh bullish signal hai.
Morning Star: Yeh 3 candles ka pattern hai jo market mein reversal dikha sakta hai.
Three White Soldiers: Lagatar 3 green candles market mein strong buying pressure dikhati hain.
Green Candle: Iska matlab hai ke price open hone ke muqable mein upar close hui.
Red Candle: Iska matlab hai ke price open hone ke muqable mein neeche close hui.
Buy Entry: Bullish candle ka high break hone aur candle close hone ke baad# confirmation dekhein.
Support Level: Jahan price girne ke baad ruk sakti hai, use support kehte hain.
Stop Loss: Trading mein apne nuqsan ko limit karne ke liye stop loss lagate hain.
Important Rule: Sirf candle dekh kar BUY na karein; trend, volume aur confirmation bhi check karein.
Yaad rakhein: Koi bhi candle 100% profit ki guarantee nahi deti.
#BitcoinTrading #SpotTrading #StopLoss #LearnTrading $BTC 📊 Bitcoin Trading Candles – 10 Important Lines
Writing
Hammer Candle: Yeh aksar price girne ke baad banti hai aur market mein buying ka signal de sakti hai.
Bullish Engulfing: Green candle pichhli red candle ko cover kar leti hai. Yeh bullish signal hai.
Morning Star: Yeh 3 candles ka pattern hai jo market mein reversal dikha sakta hai.
Three White Soldiers: Lagatar 3 green candles market mein strong buying pressure dikhati hain.
Green Candle: Iska matlab hai ke price open hone ke muqable mein upar close hui.
Red Candle: Iska matlab hai ke price open hone ke muqable mein neeche close hui.
Buy Entry: Bullish candle ka high break hone aur candle close hone ke baad# confirmation dekhein.
Support Level: Jahan price girne ke baad ruk sakti hai, use support kehte hain.
Stop Loss: Trading mein apne nuqsan ko limit karne ke liye stop loss lagate hain.
Important Rule: Sirf candle dekh kar BUY na karein; trend, volume aur confirmation bhi check karein.
Yaad rakhein: Koi bhi candle 100% profit ki guarantee nahi deti.
Writing
Hammer Candle: Yeh aksar price girne ke baad banti hai aur market mein buying ka signal de sakti hai.
Bullish Engulfing: Green candle pichhli red candle ko cover kar leti hai. Yeh bullish signal hai.
Morning Star: Yeh 3 candles ka pattern hai jo market mein reversal dikha sakta hai.
Three White Soldiers: Lagatar 3 green candles market mein strong buying pressure dikhati hain.
Green Candle: Iska matlab hai ke price open hone ke muqable mein upar close hui.
Red Candle: Iska matlab hai ke price open hone ke muqable mein neeche close hui.
Buy Entry: Bullish candle ka high break hone aur candle close hone ke baad# confirmation dekhein.
Support Level: Jahan price girne ke baad ruk sakti hai, use support kehte hain.
Stop Loss: Trading mein apne nuqsan ko limit karne ke liye stop loss lagate hain.
Important Rule: Sirf candle dekh kar BUY na karein; trend, volume aur confirmation bhi check karein.
Yaad rakhein: Koi bhi candle 100% profit ki guarantee nahi deti.
2
翻訳参照
#Bitcoin #BTC #BTCUSDT #Binance #Crypto #CryptoTrading #BitcoinAnalysis #BitcoinPrice #BitcoinNews #BTCUpdate🚀 $BTC Live BTC/USDT price (8 November 2026):
Price: Around $75,700–$75,950
24h trend: Slightly bearish.
Support: $75,500
Resistance: $76,250
Open the real live charts:
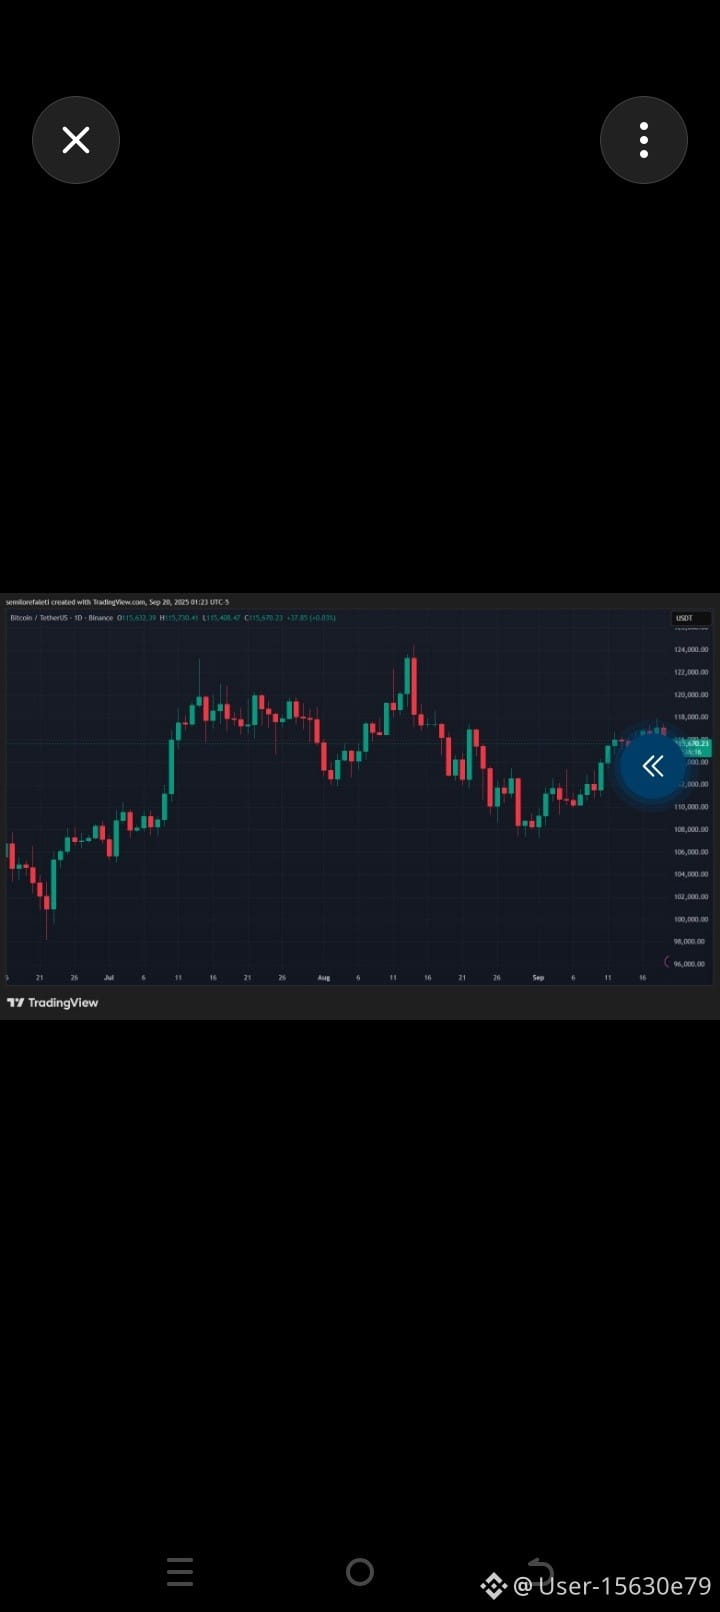
Binance Live Bitcoin Chart�
#Bitcoin #BTC #BTCUSDT #Binance #Crypto #CryptoTrading #BitcoinAnalysis #BitcoinPrice #BitcoinNews #BTCUpdate🚀 $BTC Live BTC/USDT price (8 November 2026):
Price: Around $75,700–$75,950
24h trend: Slightly bearish.
Support: $75,500
Resistance: $76,250
Open the real live charts:
Binance Live Bitcoin Chart�
Price: Around $75,700–$75,950
24h trend: Slightly bearish.
Support: $75,500
Resistance: $76,250
Open the real live charts:
Binance Live Bitcoin Chart�
9
翻訳参照
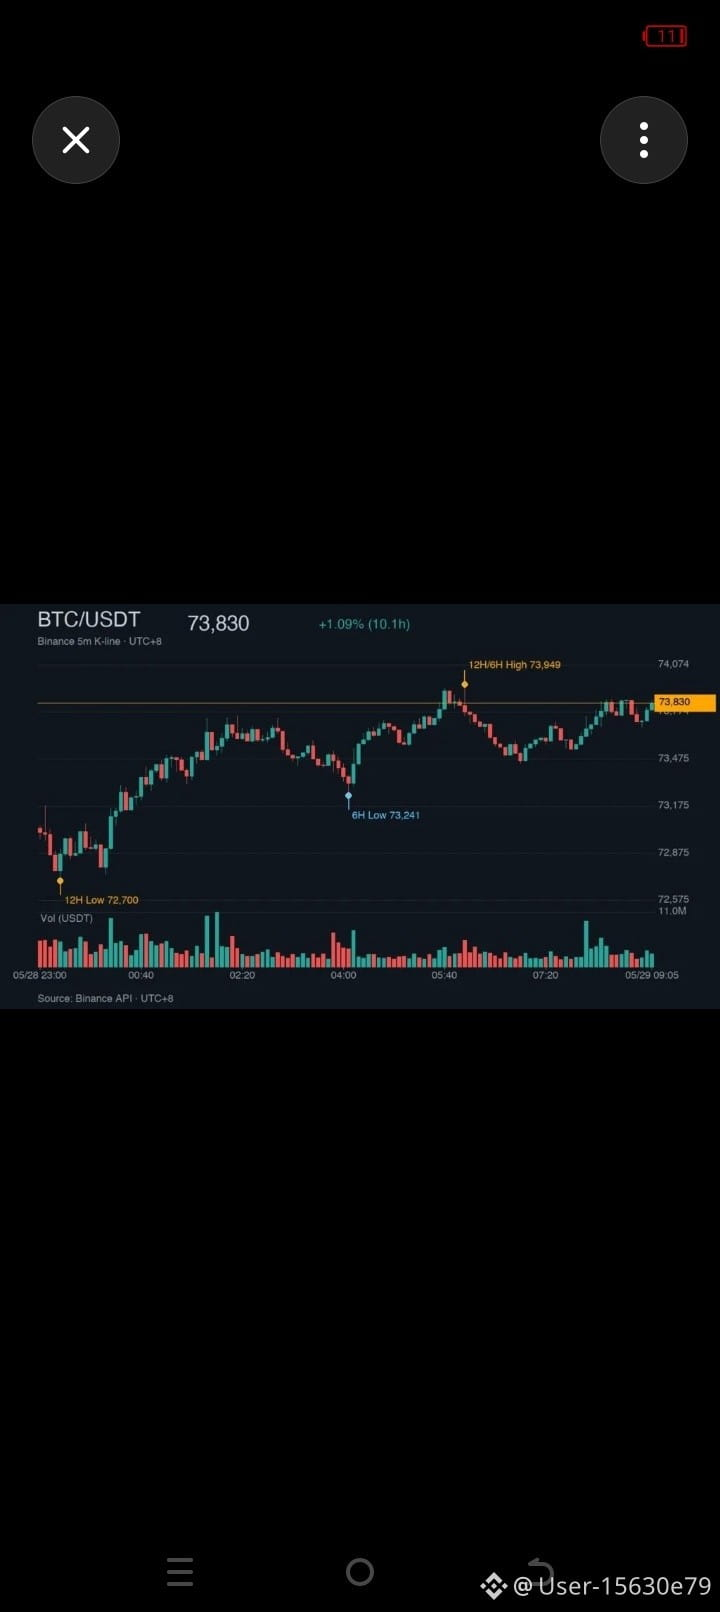
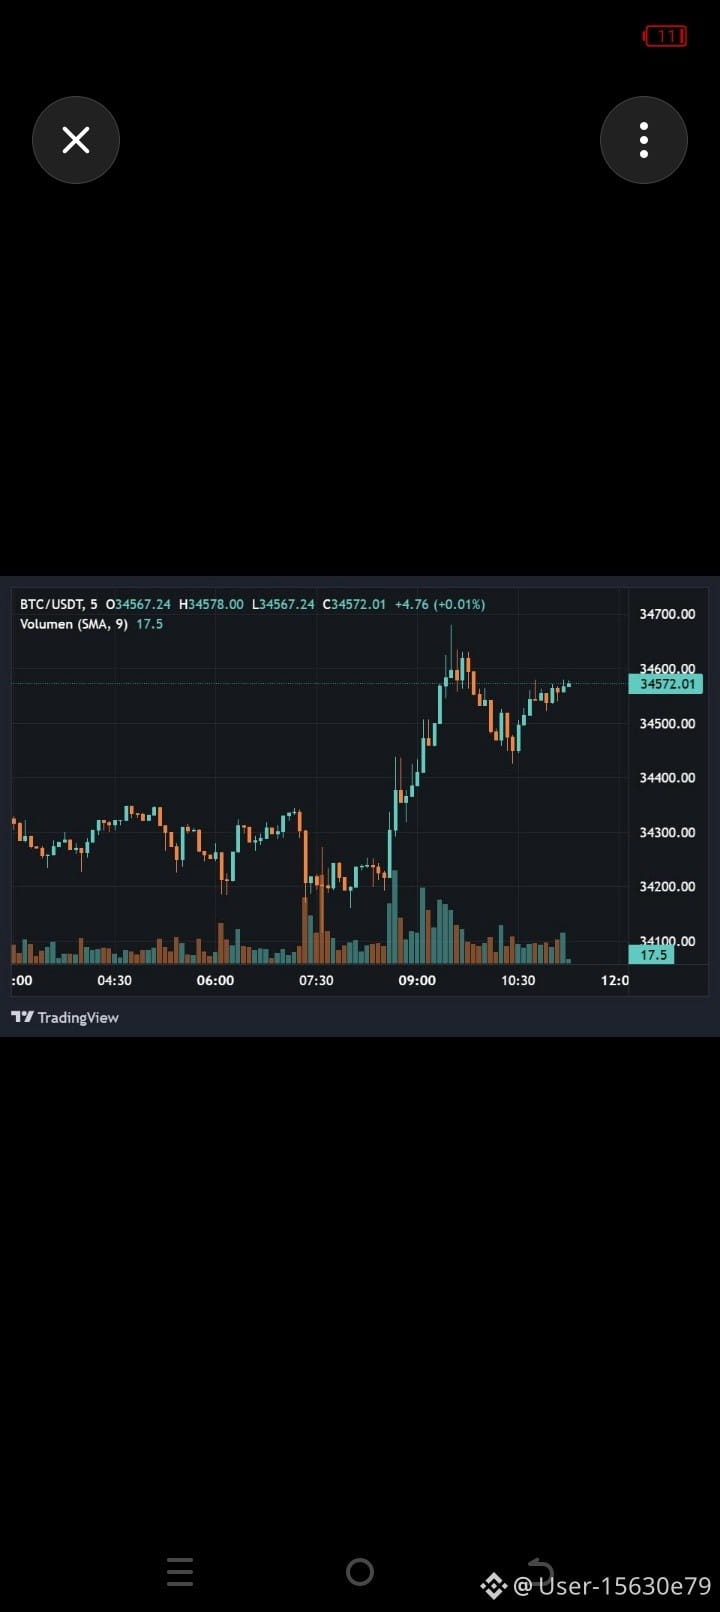
#Bullish #Bearish #BuyBitcoin #SellBitcoin #CryptoNews #DigitalCurrencyRevolution $BTC Current price $ 75'712 : approximately.
Market Overview:
📉 Trend: Short-term bearish.
🟢 Support: $75,000
🔴 Resistance: $76,300
🚀 Bullish Target: $78,000
⚠️ Bearish Target: $74,000
📈 Analysis: Bitcoin is currently facing selling pressure. If BTC breaks above $76,300, it may move toward $78,000. If it falls below $75,000, further downside is possible. �
#Bullish #Bearish #BuyBitcoin #SellBitcoin #CryptoNews #DigitalCurrencyRevolution $BTC Current price $ 75'712 : approximately.
Market Overview:
📉 Trend: Short-term bearish.
🟢 Support: $75,000
🔴 Resistance: $76,300
🚀 Bullish Target: $78,000
⚠️ Bearish Target: $74,000
📈 Analysis: Bitcoin is currently facing selling pressure. If BTC breaks above $76,300, it may move toward $78,000. If it falls below $75,000, further downside is possible. �
Market Overview:
📉 Trend: Short-term bearish.
🟢 Support: $75,000
🔴 Resistance: $76,300
🚀 Bullish Target: $78,000
⚠️ Bearish Target: $74,000
📈 Analysis: Bitcoin is currently facing selling pressure. If BTC breaks above $76,300, it may move toward $78,000. If it falls below $75,000, further downside is possible. �

30
翻訳参照
$MSFTB $BTC Bitcoin Market Analysis (November 2026)
Recent Price Action & Sentiment: Bitcoin has experienced renewed short-term volatility following the U.S. midterm elections, which resulted in a shift in congressional control. This political transition, alongside broader macroeconomic factors like labor data and shifting risk appetite, has weighed heavily on crypto sentiment.
Institutional Flow Shifts: Bitcoin exchange-traded funds (ETFs) recently faced significant outflows—erasing earlier gains for parts of the year—as macro uncertainties prompted institutional repositioning.
Market Outlook: While immediate pressure has introduced a cautious tone to the market, indicators suggest investors are closely monitoring policy shifts, liquidity trends, and broader equity performance to gauge Bitcoin’s next major directional wave.
#Bitcoin #BTC #CryptoAnalysis #TechnicalAnalysis #BullMarket
$MSFTB $BTC Bitcoin Market Analysis (November 2026)
Recent Price Action & Sentiment: Bitcoin has experienced renewed short-term volatility following the U.S. midterm elections, which resulted in a shift in congressional control. This political transition, alongside broader macroeconomic factors like labor data and shifting risk appetite, has weighed heavily on crypto sentiment.
Institutional Flow Shifts: Bitcoin exchange-traded funds (ETFs) recently faced significant outflows—erasing earlier gains for parts of the year—as macro uncertainties prompted institutional repositioning.
Market Outlook: While immediate pressure has introduced a cautious tone to the market, indicators suggest investors are closely monitoring policy shifts, liquidity trends, and broader equity performance to gauge Bitcoin’s next major directional wave.
#Bitcoin #BTC #CryptoAnalysis #TechnicalAnalysis #BullMarket
Recent Price Action & Sentiment: Bitcoin has experienced renewed short-term volatility following the U.S. midterm elections, which resulted in a shift in congressional control. This political transition, alongside broader macroeconomic factors like labor data and shifting risk appetite, has weighed heavily on crypto sentiment.
Institutional Flow Shifts: Bitcoin exchange-traded funds (ETFs) recently faced significant outflows—erasing earlier gains for parts of the year—as macro uncertainties prompted institutional repositioning.
Market Outlook: While immediate pressure has introduced a cautious tone to the market, indicators suggest investors are closely monitoring policy shifts, liquidity trends, and broader equity performance to gauge Bitcoin’s next major directional wave.
#Bitcoin #BTC #CryptoAnalysis #TechnicalAnalysis #BullMarket
52
翻訳参照
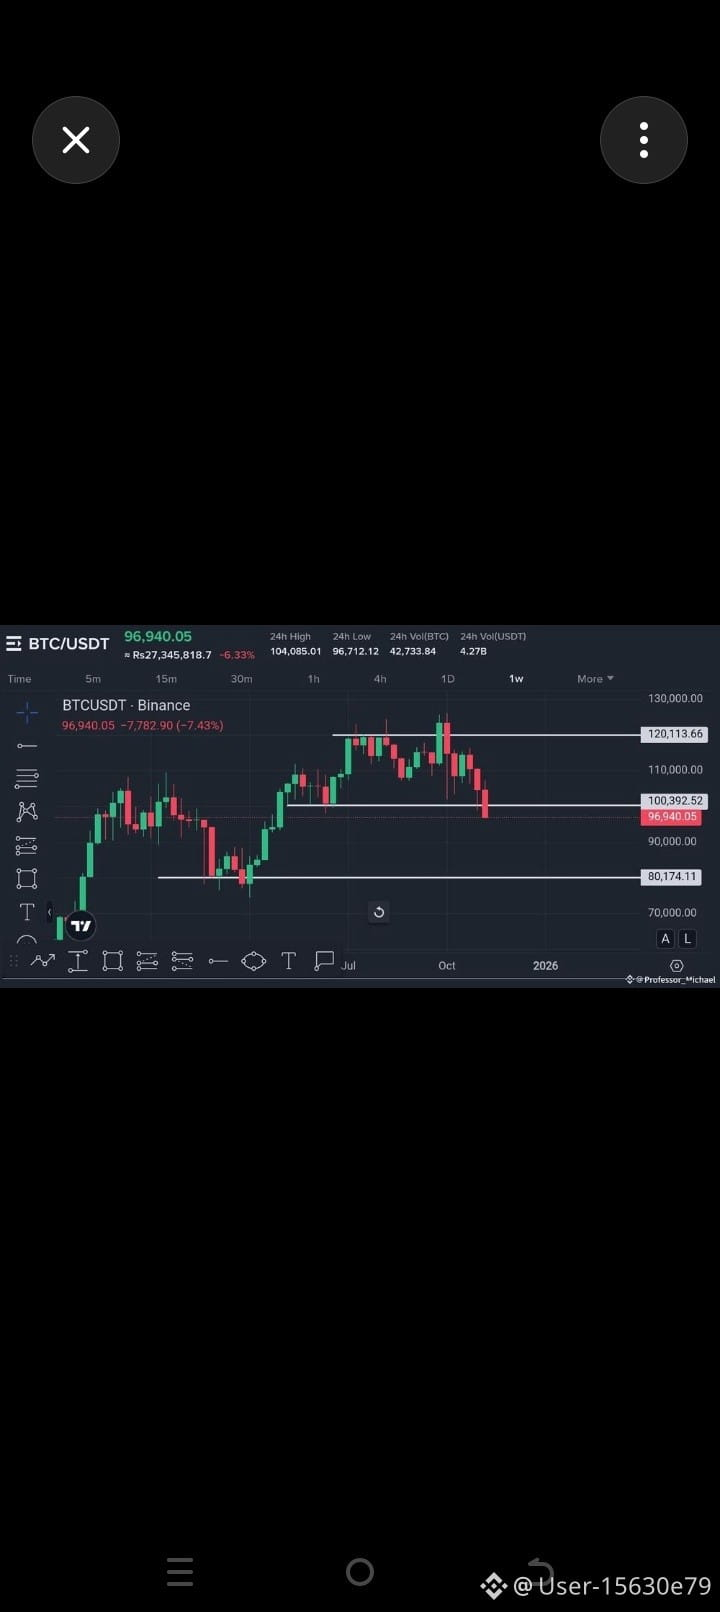
##Binance #BinanceTrading #BinancePakistan #Bitcoin #BTC$BTC Current Price: Approximately $75,700 USD.
Market Analysis:
📉 Trend: Short-term bearish.
🟢 Support: $75,000
🔴 Resistance: $76,300
📊 Bullish Target: $78,000
📉 Bearish Target: $74,000
My Opinion: Bitcoin is showing weakness. If BTC breaks above $76,300, recovery may continue. If it falls below $75,000, further decline is possible. �
Binance +1
##Binance #BinanceTrading #BinancePakistan #Bitcoin #BTC$BTC Current Price: Approximately $75,700 USD.
Market Analysis:
📉 Trend: Short-term bearish.
🟢 Support: $75,000
🔴 Resistance: $76,300
📊 Bullish Target: $78,000
📉 Bearish Target: $74,000
My Opinion: Bitcoin is showing weakness. If BTC breaks above $76,300, recovery may continue. If it falls below $75,000, further decline is possible. �
Binance +1
Market Analysis:
📉 Trend: Short-term bearish.
🟢 Support: $75,000
🔴 Resistance: $76,300
📊 Bullish Target: $78,000
📉 Bearish Target: $74,000
My Opinion: Bitcoin is showing weakness. If BTC breaks above $76,300, recovery may continue. If it falls below $75,000, further decline is possible. �
Binance +1
59
翻訳参照
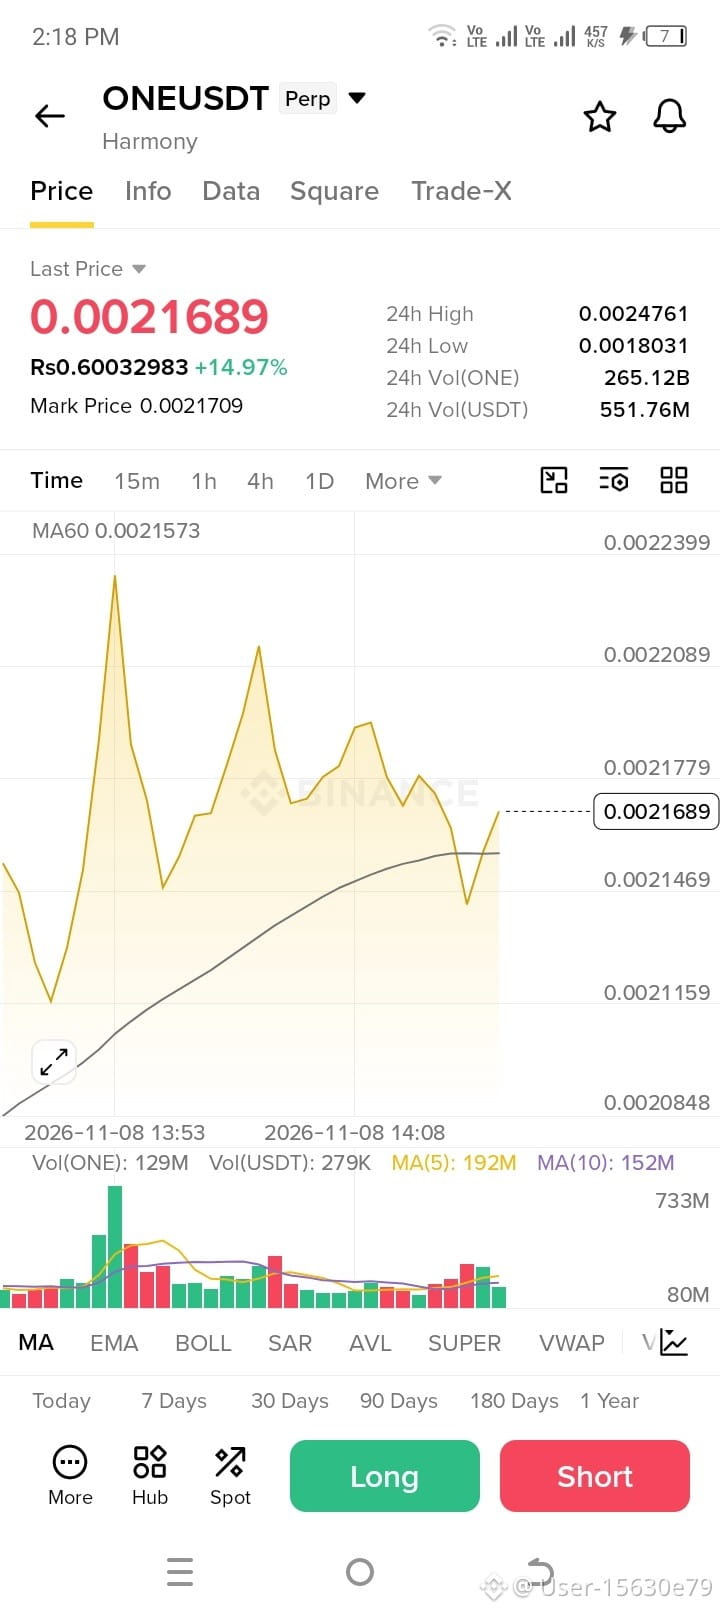
#BTCUSDT #BinancePakistan #CryptoUrdu #LearnTrading$NVDAB ONE hits $0.10, I might just become a millionaire! 🫣💰
From $0.0010 to $0.0017 in one pump, up +58% already...
Am I dreaming too big, or can ONE surprise us this bull run?
Who else is holding for $0.10? 👀
ONEUSDT
Perp
0.0021644
+15.28
#BTCUSDT #BinancePakistan #CryptoUrdu #LearnTrading$NVDAB ONE hits $0.10, I might just become a millionaire! 🫣💰
From $0.0010 to $0.0017 in one pump, up +58% already...
Am I dreaming too big, or can ONE surprise us this bull run?
Who else is holding for $0.10? 👀
ONEUSDT
Perp
0.0021644
+15.28
From $0.0010 to $0.0017 in one pump, up +58% already...
Am I dreaming too big, or can ONE surprise us this bull run?
Who else is holding for $0.10? 👀
ONEUSDT
Perp
0.0021644
+15.28
326
翻訳参照
What is a Rug Pull?
You see a token pumping 100x. You ape in. Next morning the price drops to 0. That's a rug pull.
🚩 5 red flags:
- Anonymous team
- No audit
- Unlocked liquidity
- Unrealistic promises
- Token supply held by a few wallets
DYOR isn't a meme, it's survival.
What is a Rug Pull?
You see a token pumping 100x. You ape in. Next morning the price drops to 0. That's a rug pull.
🚩 5 red flags:
- Anonymous team
- No audit
- Unlocked liquidity
- Unrealistic promises
- Token supply held by a few wallets
DYOR isn't a meme, it's survival.
You see a token pumping 100x. You ape in. Next morning the price drops to 0. That's a rug pull.
🚩 5 red flags:
- Anonymous team
- No audit
- Unlocked liquidity
- Unrealistic promises
- Token supply held by a few wallets
DYOR isn't a meme, it's survival.
102
ログインして、さらにコンテンツを読む
厳選トピックで世界の暗号資産トレーダーの仲間入り
⚡️ 暗号資産に関する最新かつ有益な情報が見つかります。
💬 世界最大の暗号資産取引所から信頼されています。
👍 認証を受けたクリエイターから、有益なインサイトを得られます。
メール / 電話番号