
Hasnain mugheera
179 投稿

Hasnain mugheera
報告
ユーザーをブロック
取引を発注
14日
44 フォロー
517 フォロワー
111 いいね
投稿
ポートフォリオ
すべて
引用
ライブ
PINNED
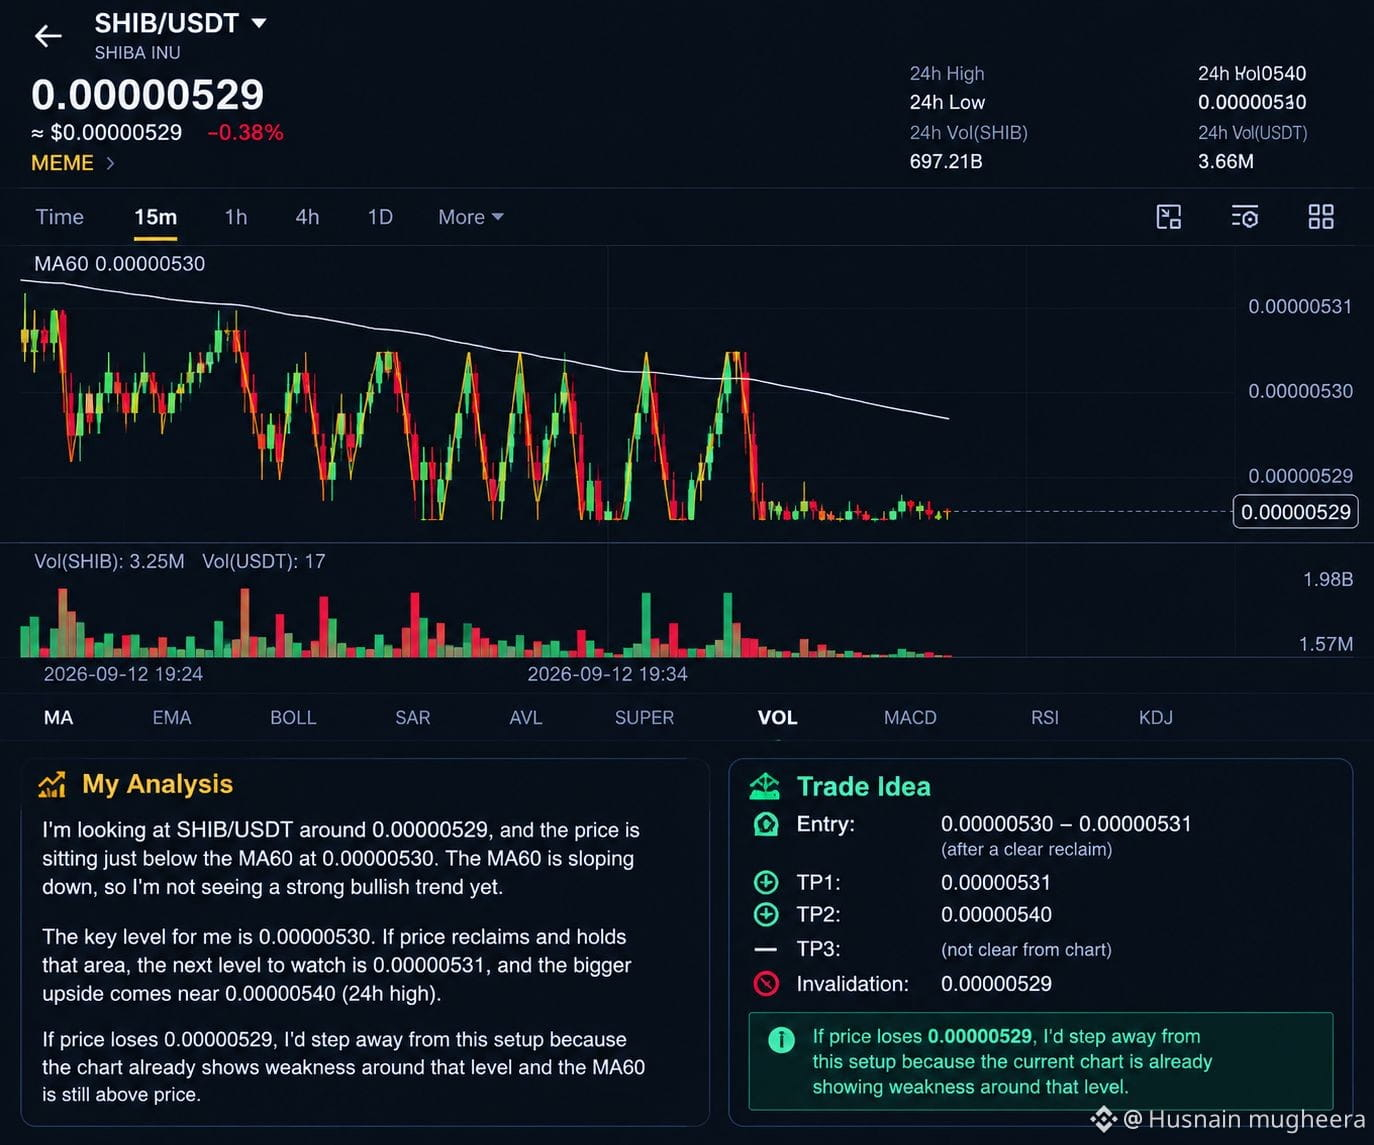
私は現在$SHIB /USDTを見ていて、だいたい0.00000529あたりです。チャートは今かなりタイトになっています。価格は表示されているMA60(0.00000530)のすぐ下に位置しており、MA60自体は下向きに傾いているため、現時点では強い強気セットアップとしてはまだ扱いません。
私にとって最初に重要なのは0.00000530です。ロングを考える前に、価格がそのエリアを取り戻して定着するのを見たいです。そうなれば、表示されている0.00000531が最初の近いレベルで、さらに24時間高値の0.00000540は、より大きな上昇の目安になります。
📍 エントリー: 明確にリテイク(取り戻し)できた後の0.00000530–0.00000531
🎯 TP1: 0.00000531
🎯 TP2: 0.00000540
🛑 無効: 0.00000529
もし価格が0.00000529を割り込むなら、私はこのセットアップから一歩引きます。現在のチャートはすでにそのあたりで弱さを示していて、MA60も価格より上に残っているからです。
これは焦ってエントリーするのではなく、様子見します。まず最初に、0.00000530のリテイクが起きるのを見たいです。そうでなければ、私にとっては確認材料が足りません。
{spot}(SHIBUSDT)
私は現在$SHIB /USDTを見ていて、だいたい0.00000529あたりです。チャートは今かなりタイトになっています。価格は表示されているMA60(0.00000530)のすぐ下に位置しており、MA60自体は下向きに傾いているため、現時点では強い強気セットアップとしてはまだ扱いません。
私にとって最初に重要なのは0.00000530です。ロングを考える前に、価格がそのエリアを取り戻して定着するのを見たいです。そうなれば、表示されている0.00000531が最初の近いレベルで、さらに24時間高値の0.00000540は、より大きな上昇の目安になります。
📍 エントリー: 明確にリテイク(取り戻し)できた後の0.00000530–0.00000531
🎯 TP1: 0.00000531
🎯 TP2: 0.00000540
🛑 無効: 0.00000529
もし価格が0.00000529を割り込むなら、私はこのセットアップから一歩引きます。現在のチャートはすでにそのあたりで弱さを示していて、MA60も価格より上に残っているからです。
これは焦ってエントリーするのではなく、様子見します。まず最初に、0.00000530のリテイクが起きるのを見たいです。そうでなければ、私にとっては確認材料が足りません。
私にとって最初に重要なのは0.00000530です。ロングを考える前に、価格がそのエリアを取り戻して定着するのを見たいです。そうなれば、表示されている0.00000531が最初の近いレベルで、さらに24時間高値の0.00000540は、より大きな上昇の目安になります。
📍 エントリー: 明確にリテイク(取り戻し)できた後の0.00000530–0.00000531
🎯 TP1: 0.00000531
🎯 TP2: 0.00000540
🛑 無効: 0.00000529
もし価格が0.00000529を割り込むなら、私はこのセットアップから一歩引きます。現在のチャートはすでにそのあたりで弱さを示していて、MA60も価格より上に残っているからです。
これは焦ってエントリーするのではなく、様子見します。まず最初に、0.00000530のリテイクが起きるのを見たいです。そうでなければ、私にとっては確認材料が足りません。

168
7
287
翻訳参照
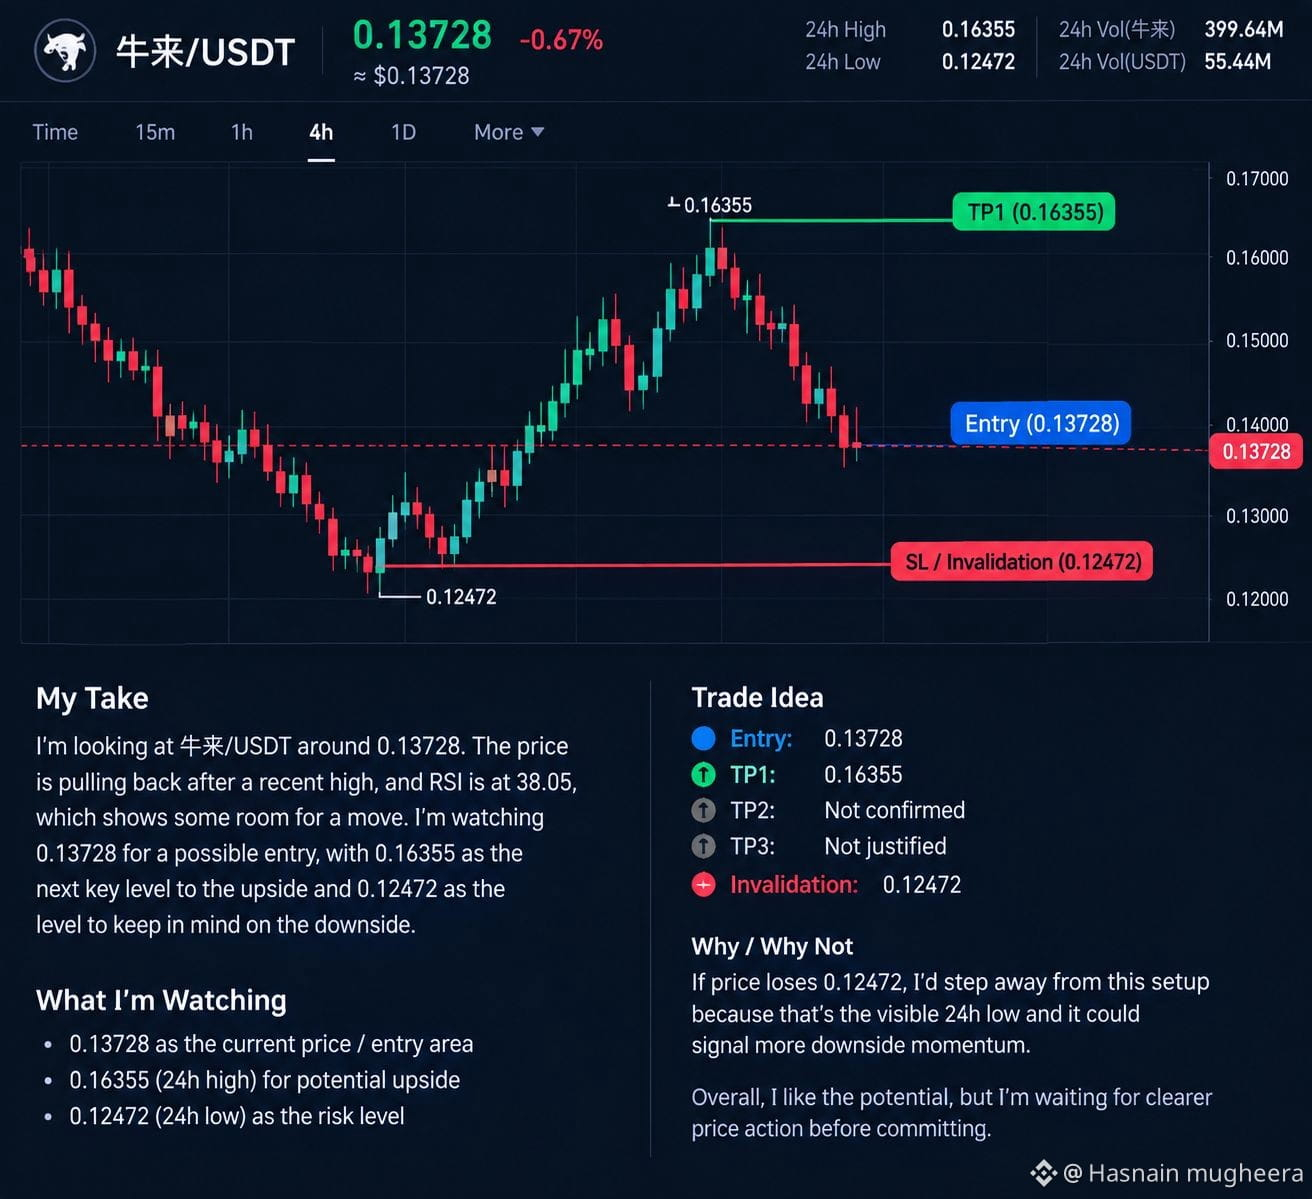
I’m looking at $牛来 /USDT around 0.13728, but the actual price chart isn’t loaded in the screenshot, so I can’t honestly confirm any candle structure, breakout, rejection, or consolidation. For me, that makes this a wait-and-see setup rather than a clean signal.
The visible numbers show a 24h high of 0.16355 and 24h low of 0.12472. RSI is displayed at 38.05, while the current price is down 0.67%. These are useful reference points, but they aren’t enough to create precise trade levels without inventing information.
📍 Entry: 0.13728 only as the current visible price; no confirmed entry zone
🎯 TP1: 0.16355 — visible 24h high
🎯 TP2: Not confirmed from the chart
🎯 TP3: Not justified
🛑 Invalidation: 0.12472 — visible 24h low, but not a confirmed setup invalidation
If price loses 0.12472, I’d step away from this idea because that is the visible 24h low, but I would not treat it as a technical invalidation without the actual candles.
I’m waiting for the chart to load before taking this setup seriously; I’d rather miss a move than manufacture levels that aren’t visible.
I’m looking at $牛来 /USDT around 0.13728, but the actual price chart isn’t loaded in the screenshot, so I can’t honestly confirm any candle structure, breakout, rejection, or consolidation. For me, that makes this a wait-and-see setup rather than a clean signal.
The visible numbers show a 24h high of 0.16355 and 24h low of 0.12472. RSI is displayed at 38.05, while the current price is down 0.67%. These are useful reference points, but they aren’t enough to create precise trade levels without inventing information.
📍 Entry: 0.13728 only as the current visible price; no confirmed entry zone
🎯 TP1: 0.16355 — visible 24h high
🎯 TP2: Not confirmed from the chart
🎯 TP3: Not justified
🛑 Invalidation: 0.12472 — visible 24h low, but not a confirmed setup invalidation
If price loses 0.12472, I’d step away from this idea because that is the visible 24h low, but I would not treat it as a technical invalidation without the actual candles.
I’m waiting for the chart to load before taking this setup seriously; I’d rather miss a move than manufacture levels that aren’t visible.
The visible numbers show a 24h high of 0.16355 and 24h low of 0.12472. RSI is displayed at 38.05, while the current price is down 0.67%. These are useful reference points, but they aren’t enough to create precise trade levels without inventing information.
📍 Entry: 0.13728 only as the current visible price; no confirmed entry zone
🎯 TP1: 0.16355 — visible 24h high
🎯 TP2: Not confirmed from the chart
🎯 TP3: Not justified
🛑 Invalidation: 0.12472 — visible 24h low, but not a confirmed setup invalidation
If price loses 0.12472, I’d step away from this idea because that is the visible 24h low, but I would not treat it as a technical invalidation without the actual candles.
I’m waiting for the chart to load before taking this setup seriously; I’d rather miss a move than manufacture levels that aren’t visible.
227
翻訳参照
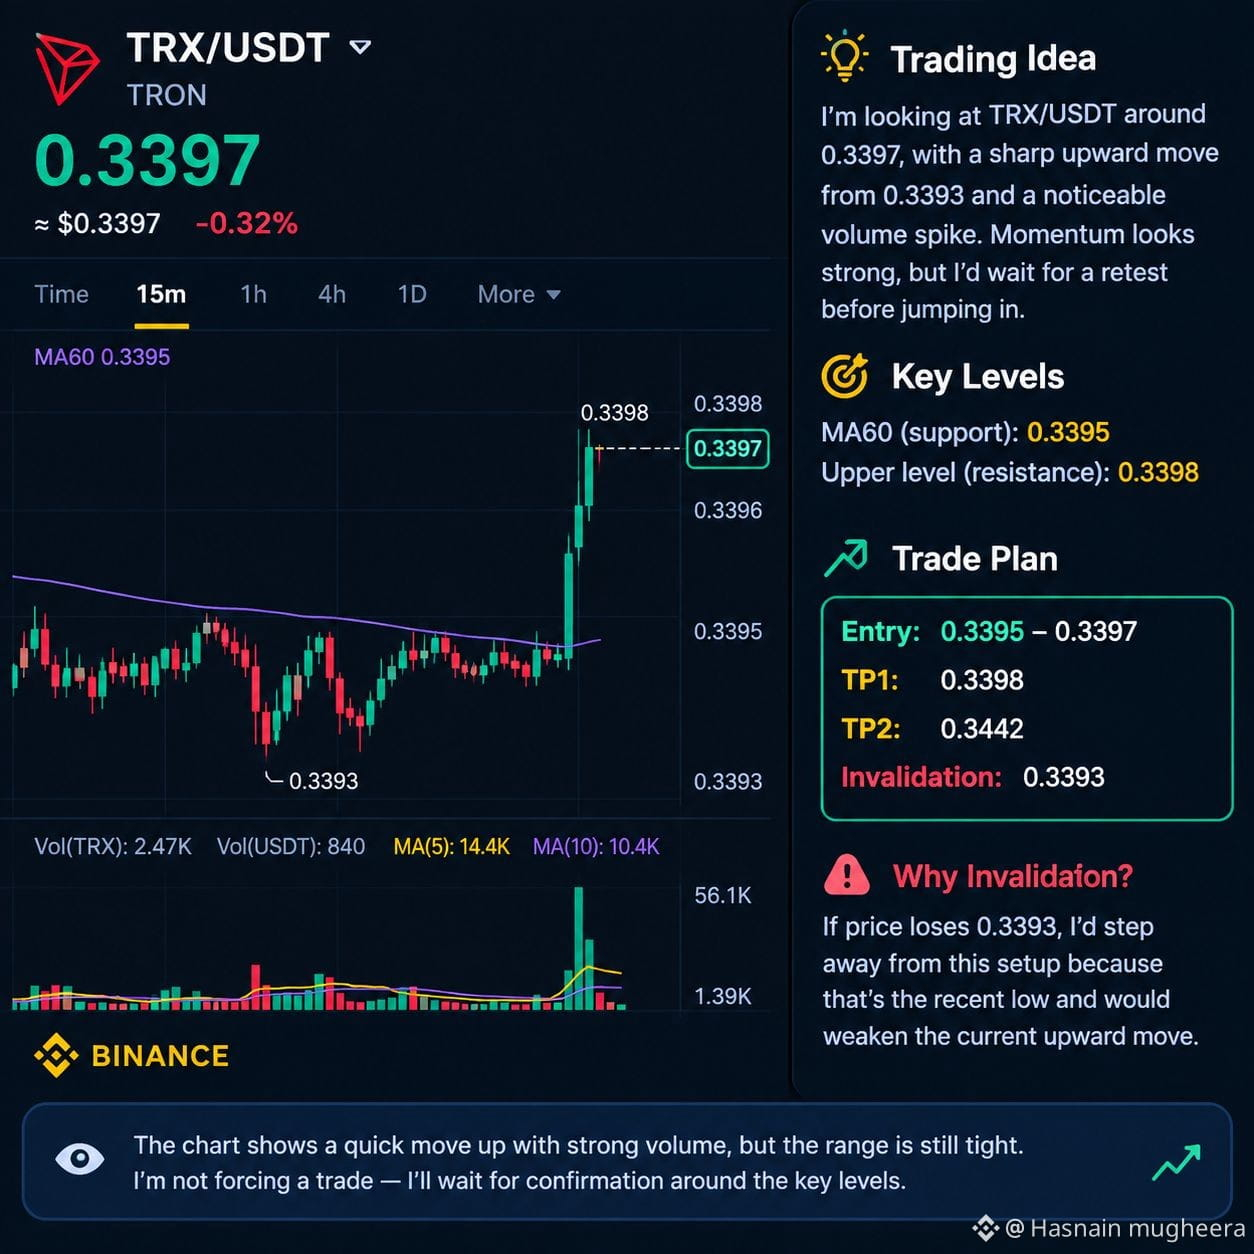
I’m looking at $TRX /USDT around 0.3397, with price making a sharp upward move from the visible 0.3393 area. The move also came with a noticeable volume spike, so momentum has clearly picked up, but I’d avoid chasing blindly.
For me, 0.3395–0.3397 is the area to watch. The visible MA60 is 0.3395, while 0.3398 is the immediate upper level on this chart. I’d like to see price hold above the MA60 and retest the upper area before considering the setup attractive.
📍 Entry: 0.3395–0.3397
🎯 TP1: 0.3398
🎯 TP2: 0.3442
🛑 Invalidation: 0.3393
If price loses 0.3393, I’d step away from this setup because that is the visible recent low and would weaken the current upward move.
The main issue is that the chart gives limited room around the current price, so I wouldn’t force a trade. I’m waiting for confirmation rather than assuming this spike will continue.
{future}(TRXUSDT)
I’m looking at $TRX /USDT around 0.3397, with price making a sharp upward move from the visible 0.3393 area. The move also came with a noticeable volume spike, so momentum has clearly picked up, but I’d avoid chasing blindly.
For me, 0.3395–0.3397 is the area to watch. The visible MA60 is 0.3395, while 0.3398 is the immediate upper level on this chart. I’d like to see price hold above the MA60 and retest the upper area before considering the setup attractive.
📍 Entry: 0.3395–0.3397
🎯 TP1: 0.3398
🎯 TP2: 0.3442
🛑 Invalidation: 0.3393
If price loses 0.3393, I’d step away from this setup because that is the visible recent low and would weaken the current upward move.
The main issue is that the chart gives limited room around the current price, so I wouldn’t force a trade. I’m waiting for confirmation rather than assuming this spike will continue.
For me, 0.3395–0.3397 is the area to watch. The visible MA60 is 0.3395, while 0.3398 is the immediate upper level on this chart. I’d like to see price hold above the MA60 and retest the upper area before considering the setup attractive.
📍 Entry: 0.3395–0.3397
🎯 TP1: 0.3398
🎯 TP2: 0.3442
🛑 Invalidation: 0.3393
If price loses 0.3393, I’d step away from this setup because that is the visible recent low and would weaken the current upward move.
The main issue is that the chart gives limited room around the current price, so I wouldn’t force a trade. I’m waiting for confirmation rather than assuming this spike will continue.
44
翻訳参照
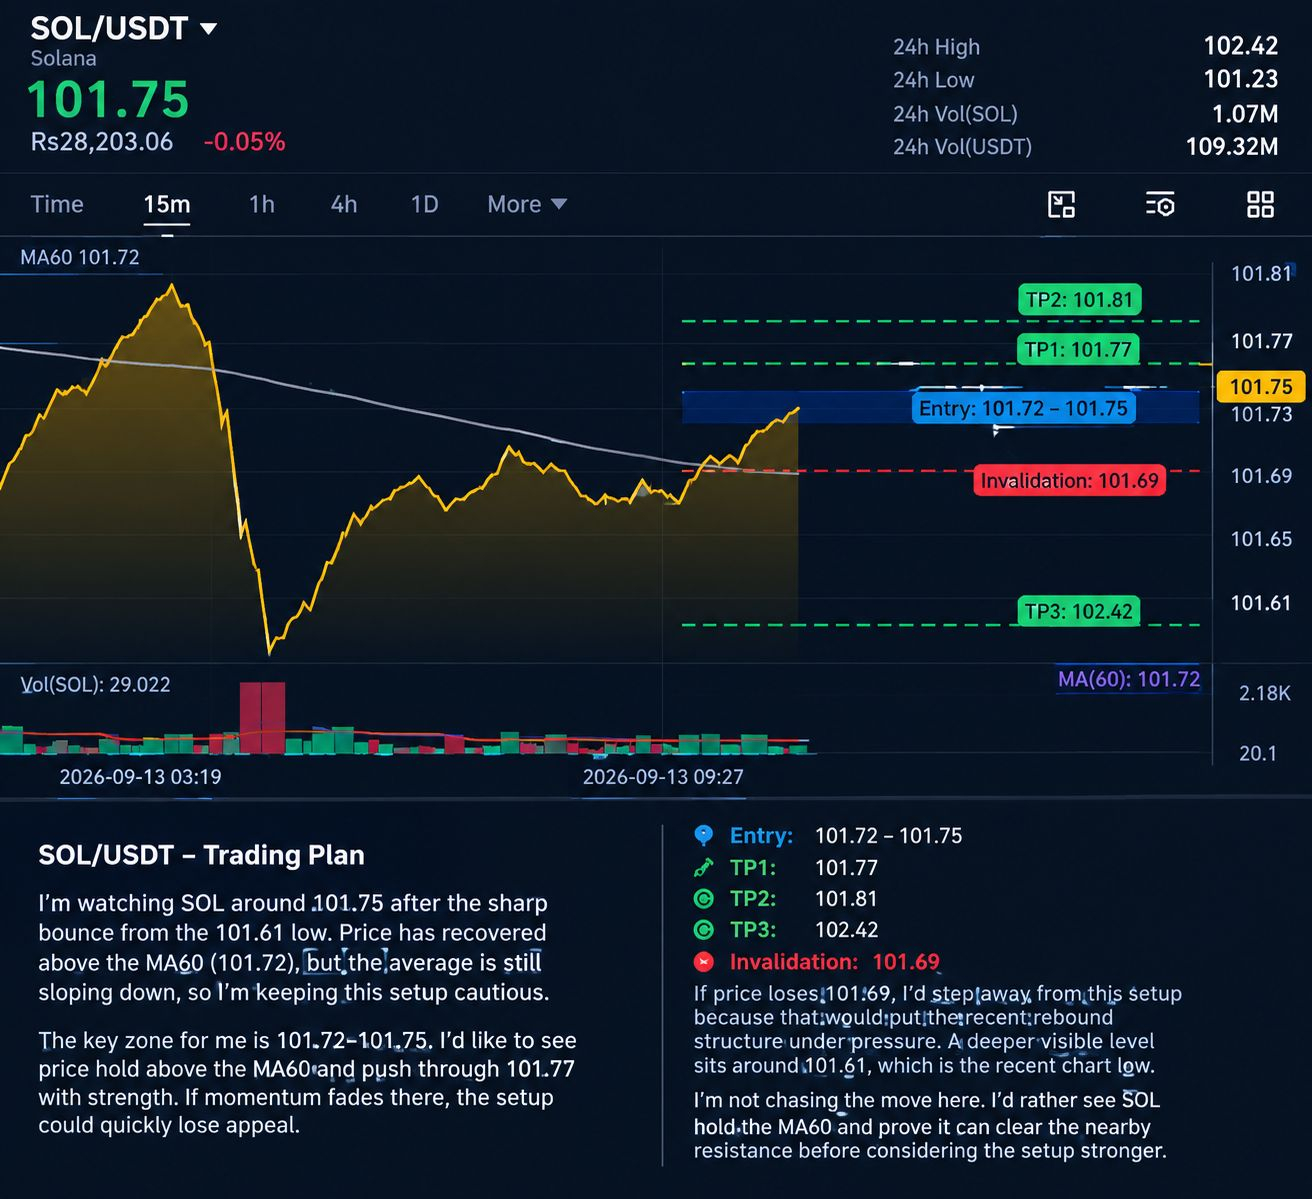
I’m watching $SOL /USDT around 101.75 after the sharp bounce from the visible 101.61 low. Price has recovered above the MA60 at 101.72, but that average is still sloping downward, so I’m keeping this setup cautious.
For me, the key area is 101.72–101.75. I’d like to see price hold above the MA60 and push through the nearby 101.77 area with continued strength. If momentum fades there, the setup could quickly lose appeal.
📍 Entry: 101.72–101.75
🎯 TP1: 101.77
🎯 TP2: 101.81
🎯 TP3: 102.42
🛑 Invalidation: 101.69
If price loses 101.69, I’d step away from this setup because that would put the recent rebound structure under pressure. A deeper visible level sits around 101.61, which is the recent chart low.
I’m not chasing the move here. I’d rather see SOL hold the MA60 and prove it can clear the nearby resistance before considering the setup stronger.
{future}(SOLUSDT)
I’m watching $SOL /USDT around 101.75 after the sharp bounce from the visible 101.61 low. Price has recovered above the MA60 at 101.72, but that average is still sloping downward, so I’m keeping this setup cautious.
For me, the key area is 101.72–101.75. I’d like to see price hold above the MA60 and push through the nearby 101.77 area with continued strength. If momentum fades there, the setup could quickly lose appeal.
📍 Entry: 101.72–101.75
🎯 TP1: 101.77
🎯 TP2: 101.81
🎯 TP3: 102.42
🛑 Invalidation: 101.69
If price loses 101.69, I’d step away from this setup because that would put the recent rebound structure under pressure. A deeper visible level sits around 101.61, which is the recent chart low.
I’m not chasing the move here. I’d rather see SOL hold the MA60 and prove it can clear the nearby resistance before considering the setup stronger.
For me, the key area is 101.72–101.75. I’d like to see price hold above the MA60 and push through the nearby 101.77 area with continued strength. If momentum fades there, the setup could quickly lose appeal.
📍 Entry: 101.72–101.75
🎯 TP1: 101.77
🎯 TP2: 101.81
🎯 TP3: 102.42
🛑 Invalidation: 101.69
If price loses 101.69, I’d step away from this setup because that would put the recent rebound structure under pressure. A deeper visible level sits around 101.61, which is the recent chart low.
I’m not chasing the move here. I’d rather see SOL hold the MA60 and prove it can clear the nearby resistance before considering the setup stronger.
58
翻訳参照
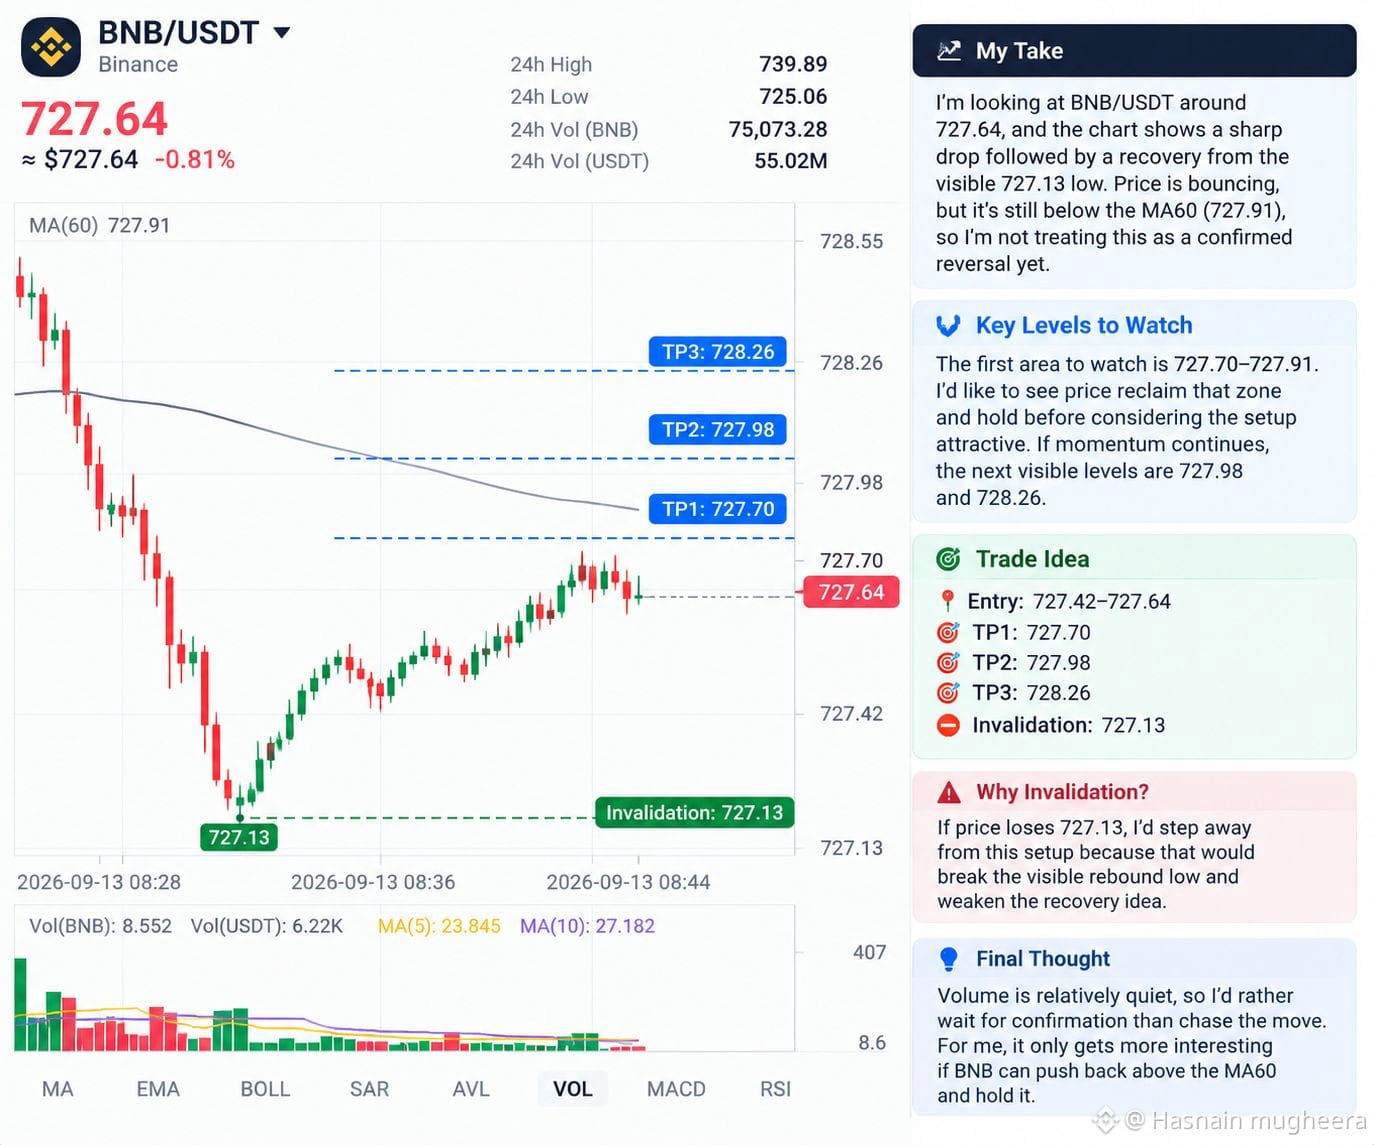
I’m looking at $BNB /USDT around 727.64, and the chart shows a sharp drop followed by a recovery from the visible 727.13 low. Price is bouncing, but it’s still sitting below the MA60 at 727.91, so I’m not treating this as a confirmed reversal yet.
For me, the first area to watch is 727.70–727.91. I’d like to see price reclaim that zone and hold it before considering the setup attractive. If momentum continues, the next visible levels are around 727.98 and 728.26.
📍 Entry: 727.42–727.64
🎯 TP1: 727.70
🎯 TP2: 727.98
🎯 TP3: 728.26
🛑 Invalidation: 727.13
If price loses 727.13, I’d step away from this setup because that would break the visible rebound low and weaken the recovery idea.
Volume on the chart is relatively quiet toward the latest candles, so I’d rather wait for confirmation than chase the move. For me, the setup only becomes more interesting if BNB can push back above the MA60 and hold it.
{future}(BNBUSDT)
I’m looking at $BNB /USDT around 727.64, and the chart shows a sharp drop followed by a recovery from the visible 727.13 low. Price is bouncing, but it’s still sitting below the MA60 at 727.91, so I’m not treating this as a confirmed reversal yet.
For me, the first area to watch is 727.70–727.91. I’d like to see price reclaim that zone and hold it before considering the setup attractive. If momentum continues, the next visible levels are around 727.98 and 728.26.
📍 Entry: 727.42–727.64
🎯 TP1: 727.70
🎯 TP2: 727.98
🎯 TP3: 728.26
🛑 Invalidation: 727.13
If price loses 727.13, I’d step away from this setup because that would break the visible rebound low and weaken the recovery idea.
Volume on the chart is relatively quiet toward the latest candles, so I’d rather wait for confirmation than chase the move. For me, the setup only becomes more interesting if BNB can push back above the MA60 and hold it.
For me, the first area to watch is 727.70–727.91. I’d like to see price reclaim that zone and hold it before considering the setup attractive. If momentum continues, the next visible levels are around 727.98 and 728.26.
📍 Entry: 727.42–727.64
🎯 TP1: 727.70
🎯 TP2: 727.98
🎯 TP3: 728.26
🛑 Invalidation: 727.13
If price loses 727.13, I’d step away from this setup because that would break the visible rebound low and weaken the recovery idea.
Volume on the chart is relatively quiet toward the latest candles, so I’d rather wait for confirmation than chase the move. For me, the setup only becomes more interesting if BNB can push back above the MA60 and hold it.
77
翻訳参照
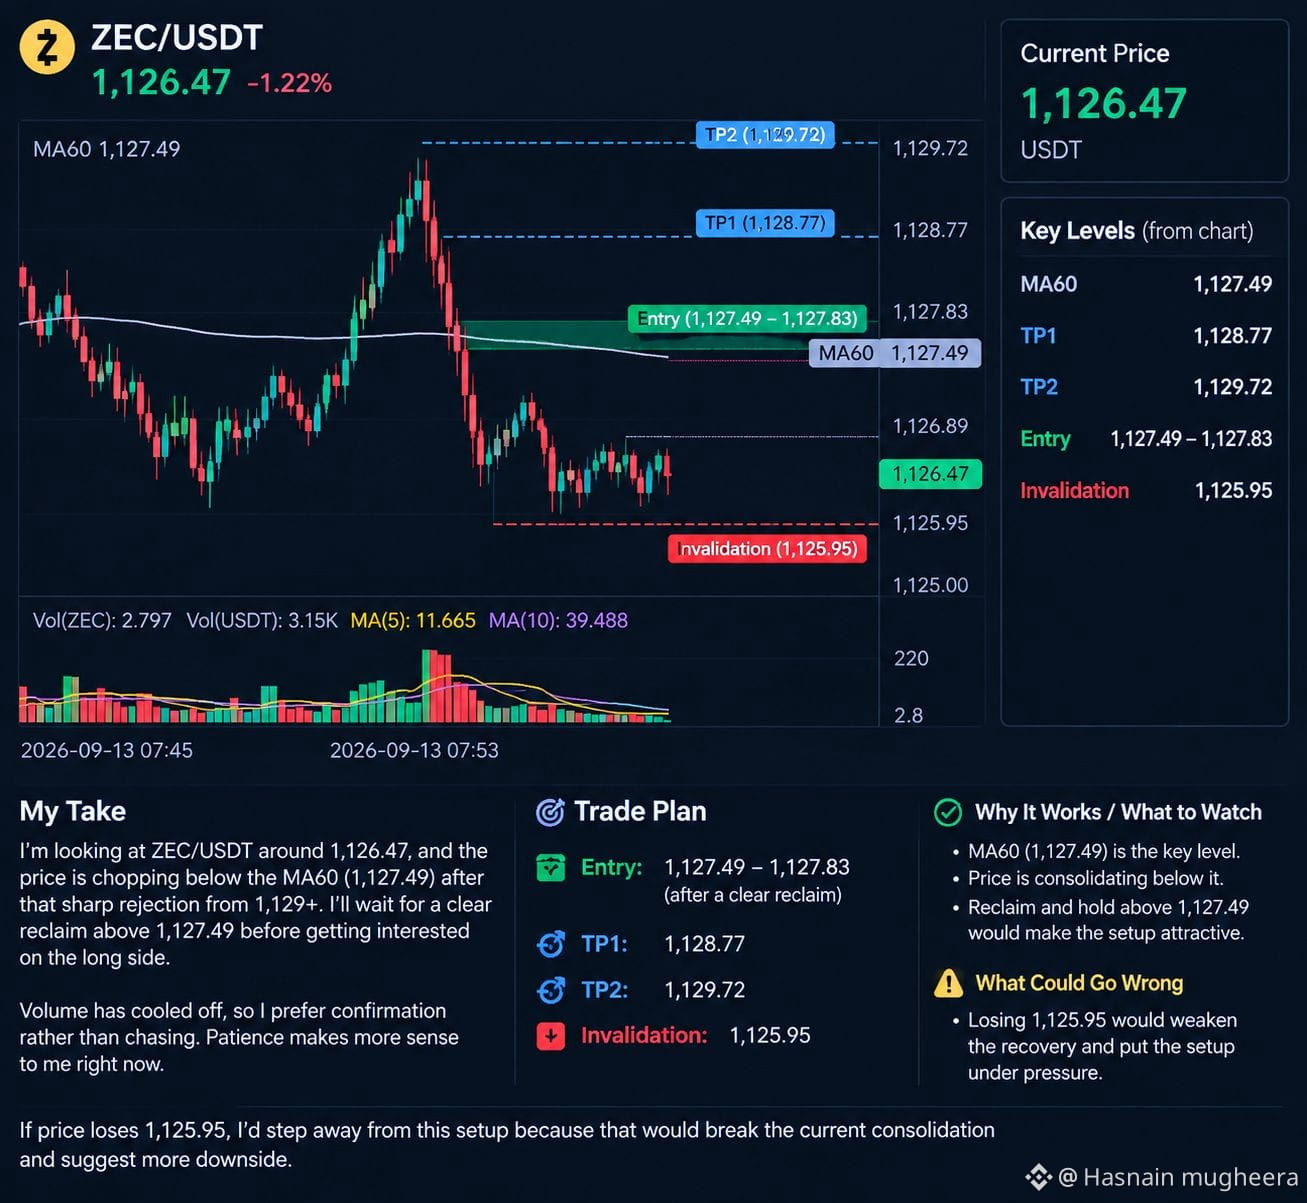
I’m looking at $ZEC /USDT around 1,126.47, and the chart looks indecisive after that sharp rejection from the 1,129+ area. Price is now chopping below the visible MA60 at 1,127.49, so I’m not rushing the entry.
For me, 1,127.49 is the key level. I’d like to see price reclaim and hold above it before considering the long setup. The nearby 1,126.89 level is the first step, while the higher visible levels give room if momentum returns.
📍 Entry: 1,127.49–1,127.83, after a clear reclaim
🎯 TP1: 1,128.77
🎯 TP2: 1,129.72
🛑 Invalidation: 1,125.95
If price loses 1,125.95, I’d step away from this setup because that would weaken the current consolidation and put the recent recovery attempt under pressure.
The volume shown has cooled considerably after the earlier spike, so I’d prefer confirmation rather than chasing. Right now, patience makes more sense to me; the reclaim above the MA60 is what I’m waiting to see before getting interested.
{future}(ZECUSDT)
I’m looking at $ZEC /USDT around 1,126.47, and the chart looks indecisive after that sharp rejection from the 1,129+ area. Price is now chopping below the visible MA60 at 1,127.49, so I’m not rushing the entry.
For me, 1,127.49 is the key level. I’d like to see price reclaim and hold above it before considering the long setup. The nearby 1,126.89 level is the first step, while the higher visible levels give room if momentum returns.
📍 Entry: 1,127.49–1,127.83, after a clear reclaim
🎯 TP1: 1,128.77
🎯 TP2: 1,129.72
🛑 Invalidation: 1,125.95
If price loses 1,125.95, I’d step away from this setup because that would weaken the current consolidation and put the recent recovery attempt under pressure.
The volume shown has cooled considerably after the earlier spike, so I’d prefer confirmation rather than chasing. Right now, patience makes more sense to me; the reclaim above the MA60 is what I’m waiting to see before getting interested.
For me, 1,127.49 is the key level. I’d like to see price reclaim and hold above it before considering the long setup. The nearby 1,126.89 level is the first step, while the higher visible levels give room if momentum returns.
📍 Entry: 1,127.49–1,127.83, after a clear reclaim
🎯 TP1: 1,128.77
🎯 TP2: 1,129.72
🛑 Invalidation: 1,125.95
If price loses 1,125.95, I’d step away from this setup because that would weaken the current consolidation and put the recent recovery attempt under pressure.
The volume shown has cooled considerably after the earlier spike, so I’d prefer confirmation rather than chasing. Right now, patience makes more sense to me; the reclaim above the MA60 is what I’m waiting to see before getting interested.
295
翻訳参照
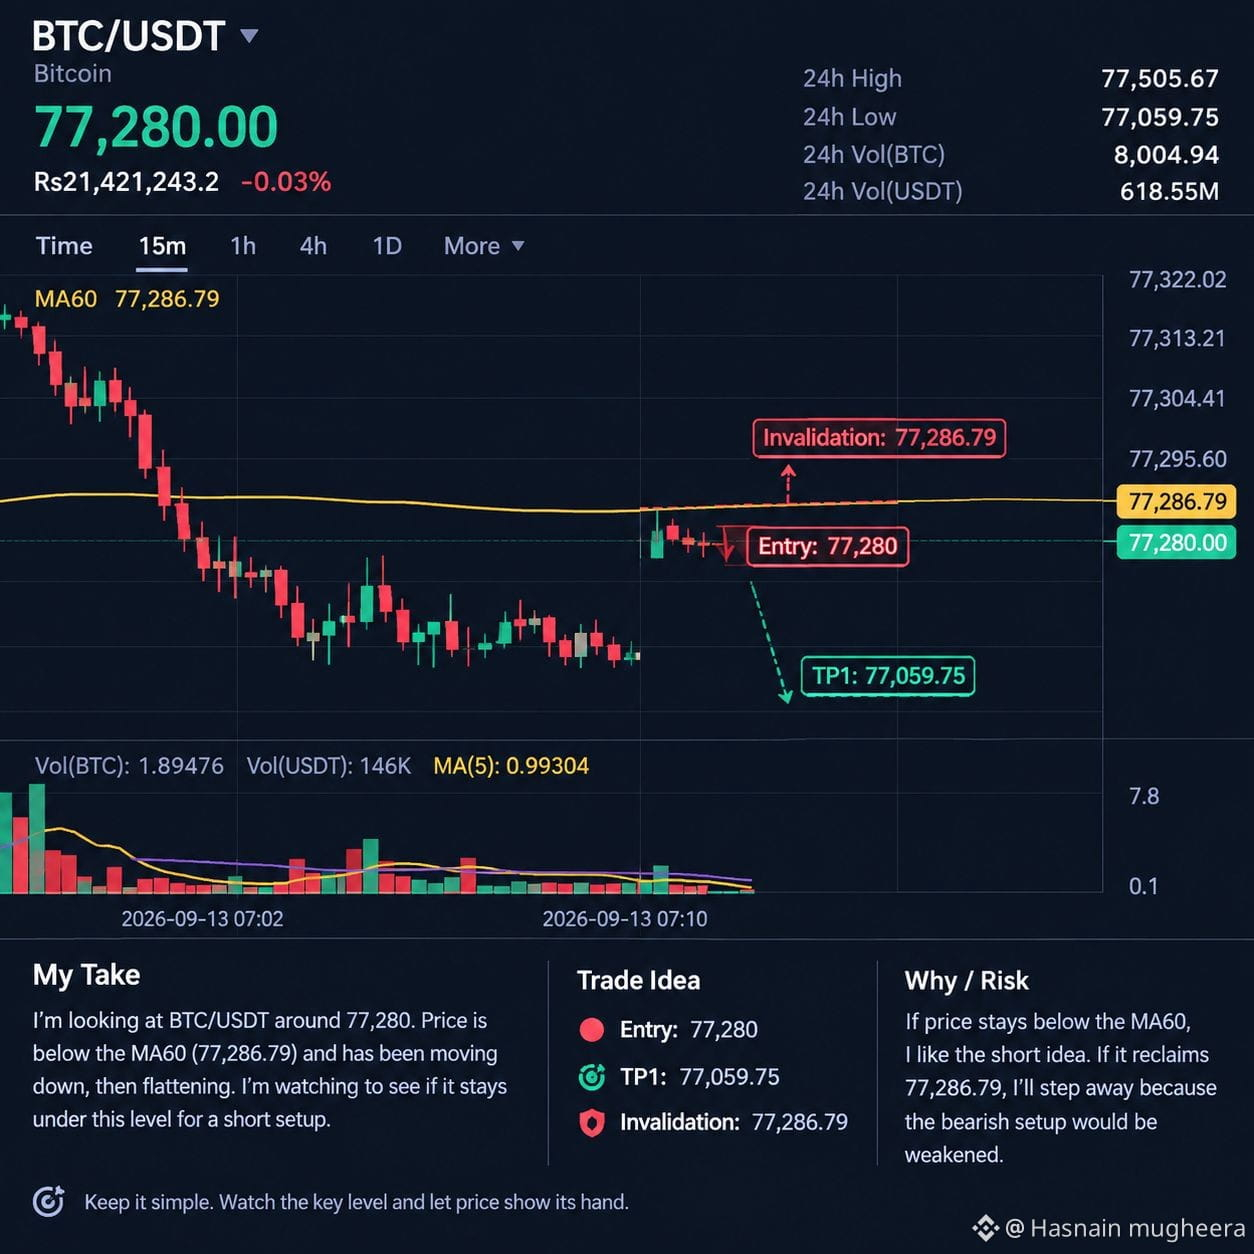
I'm looking at $BTC /USDT sitting around 77,280, with price clearly below the visible MA60 at 77,286.79. The recent move on this chart is downward, followed by a flat pause around 77,280, so I’m not seeing strong confirmation for a reversal yet.
For me, the key level is 77,286.79. If price stays below that moving average, I’d be more interested in a continuation setup rather than chasing a bounce. I’d like to see price remain under this level before considering the idea attractive.
📍 Entry: 77,280 area
🎯 TP1: 77,059.75
🛑 Invalidation: 77,286.79
The main issue is that the screenshot doesn’t give enough clearly readable lower price levels to justify multiple targets, so I’m keeping this setup simple rather than inventing them.
If price reclaims 77,286.79, I’d step away from this short idea because the immediate bearish setup would be weakened. The visible volume is also relatively modest, so I’d want confirmation instead of assuming the move will continue.
For now, I’m watching whether BTC can stay below the MA60 and continue pressing lower.
{future}(BTCUSDT)
I'm looking at $BTC /USDT sitting around 77,280, with price clearly below the visible MA60 at 77,286.79. The recent move on this chart is downward, followed by a flat pause around 77,280, so I’m not seeing strong confirmation for a reversal yet.
For me, the key level is 77,286.79. If price stays below that moving average, I’d be more interested in a continuation setup rather than chasing a bounce. I’d like to see price remain under this level before considering the idea attractive.
📍 Entry: 77,280 area
🎯 TP1: 77,059.75
🛑 Invalidation: 77,286.79
The main issue is that the screenshot doesn’t give enough clearly readable lower price levels to justify multiple targets, so I’m keeping this setup simple rather than inventing them.
If price reclaims 77,286.79, I’d step away from this short idea because the immediate bearish setup would be weakened. The visible volume is also relatively modest, so I’d want confirmation instead of assuming the move will continue.
For now, I’m watching whether BTC can stay below the MA60 and continue pressing lower.
For me, the key level is 77,286.79. If price stays below that moving average, I’d be more interested in a continuation setup rather than chasing a bounce. I’d like to see price remain under this level before considering the idea attractive.
📍 Entry: 77,280 area
🎯 TP1: 77,059.75
🛑 Invalidation: 77,286.79
The main issue is that the screenshot doesn’t give enough clearly readable lower price levels to justify multiple targets, so I’m keeping this setup simple rather than inventing them.
If price reclaims 77,286.79, I’d step away from this short idea because the immediate bearish setup would be weakened. The visible volume is also relatively modest, so I’d want confirmation instead of assuming the move will continue.
For now, I’m watching whether BTC can stay below the MA60 and continue pressing lower.
130
翻訳参照
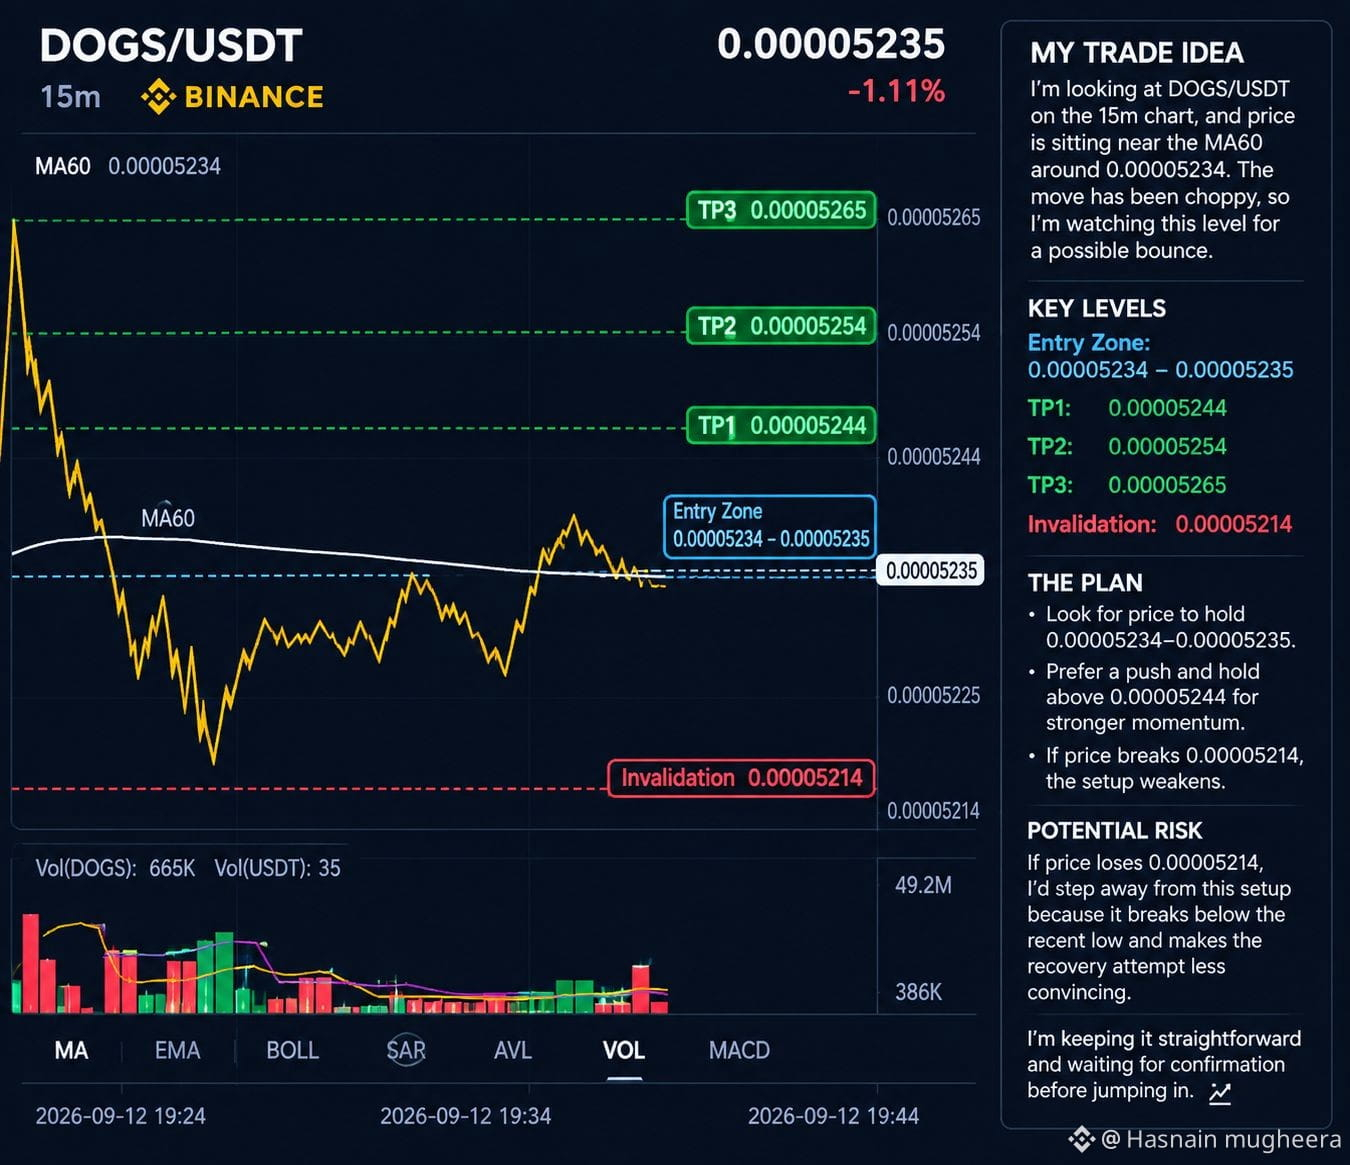
I’m looking at $DOGS /USDT on the 15m chart, and price is sitting almost exactly on the MA60 around 0.00005234, with current price near 0.00005235. The recent move has been choppy, so I’m treating this as a cautious setup rather than a confirmed breakout.
For me, the key area is 0.00005234–0.00005235. Holding this zone would keep the recent recovery structure interesting. I’d like to see price push and hold above 0.00005244 before considering stronger upside momentum.
The visible downside area I’m watching is around 0.00005214, where the recent chart low sits. If price loses that area, the setup would weaken considerably.
📍 Entry: 0.00005234–0.00005235
🎯 TP1: 0.00005244
🎯 TP2: 0.00005254
🎯 TP3: 0.00005265
🛑 Invalidation: 0.00005214
If price loses 0.00005214, I’d step away from this setup because that would break below the visible recent low and make the recovery attempt less convincing.
I’m keeping this one controlled. The chart is still relatively sideways, so I’d rather wait for confirmation than chase a move.
{future}(DOGSUSDT)
I’m looking at $DOGS /USDT on the 15m chart, and price is sitting almost exactly on the MA60 around 0.00005234, with current price near 0.00005235. The recent move has been choppy, so I’m treating this as a cautious setup rather than a confirmed breakout.
For me, the key area is 0.00005234–0.00005235. Holding this zone would keep the recent recovery structure interesting. I’d like to see price push and hold above 0.00005244 before considering stronger upside momentum.
The visible downside area I’m watching is around 0.00005214, where the recent chart low sits. If price loses that area, the setup would weaken considerably.
📍 Entry: 0.00005234–0.00005235
🎯 TP1: 0.00005244
🎯 TP2: 0.00005254
🎯 TP3: 0.00005265
🛑 Invalidation: 0.00005214
If price loses 0.00005214, I’d step away from this setup because that would break below the visible recent low and make the recovery attempt less convincing.
I’m keeping this one controlled. The chart is still relatively sideways, so I’d rather wait for confirmation than chase a move.
For me, the key area is 0.00005234–0.00005235. Holding this zone would keep the recent recovery structure interesting. I’d like to see price push and hold above 0.00005244 before considering stronger upside momentum.
The visible downside area I’m watching is around 0.00005214, where the recent chart low sits. If price loses that area, the setup would weaken considerably.
📍 Entry: 0.00005234–0.00005235
🎯 TP1: 0.00005244
🎯 TP2: 0.00005254
🎯 TP3: 0.00005265
🛑 Invalidation: 0.00005214
If price loses 0.00005214, I’d step away from this setup because that would break below the visible recent low and make the recovery attempt less convincing.
I’m keeping this one controlled. The chart is still relatively sideways, so I’d rather wait for confirmation than chase a move.
188
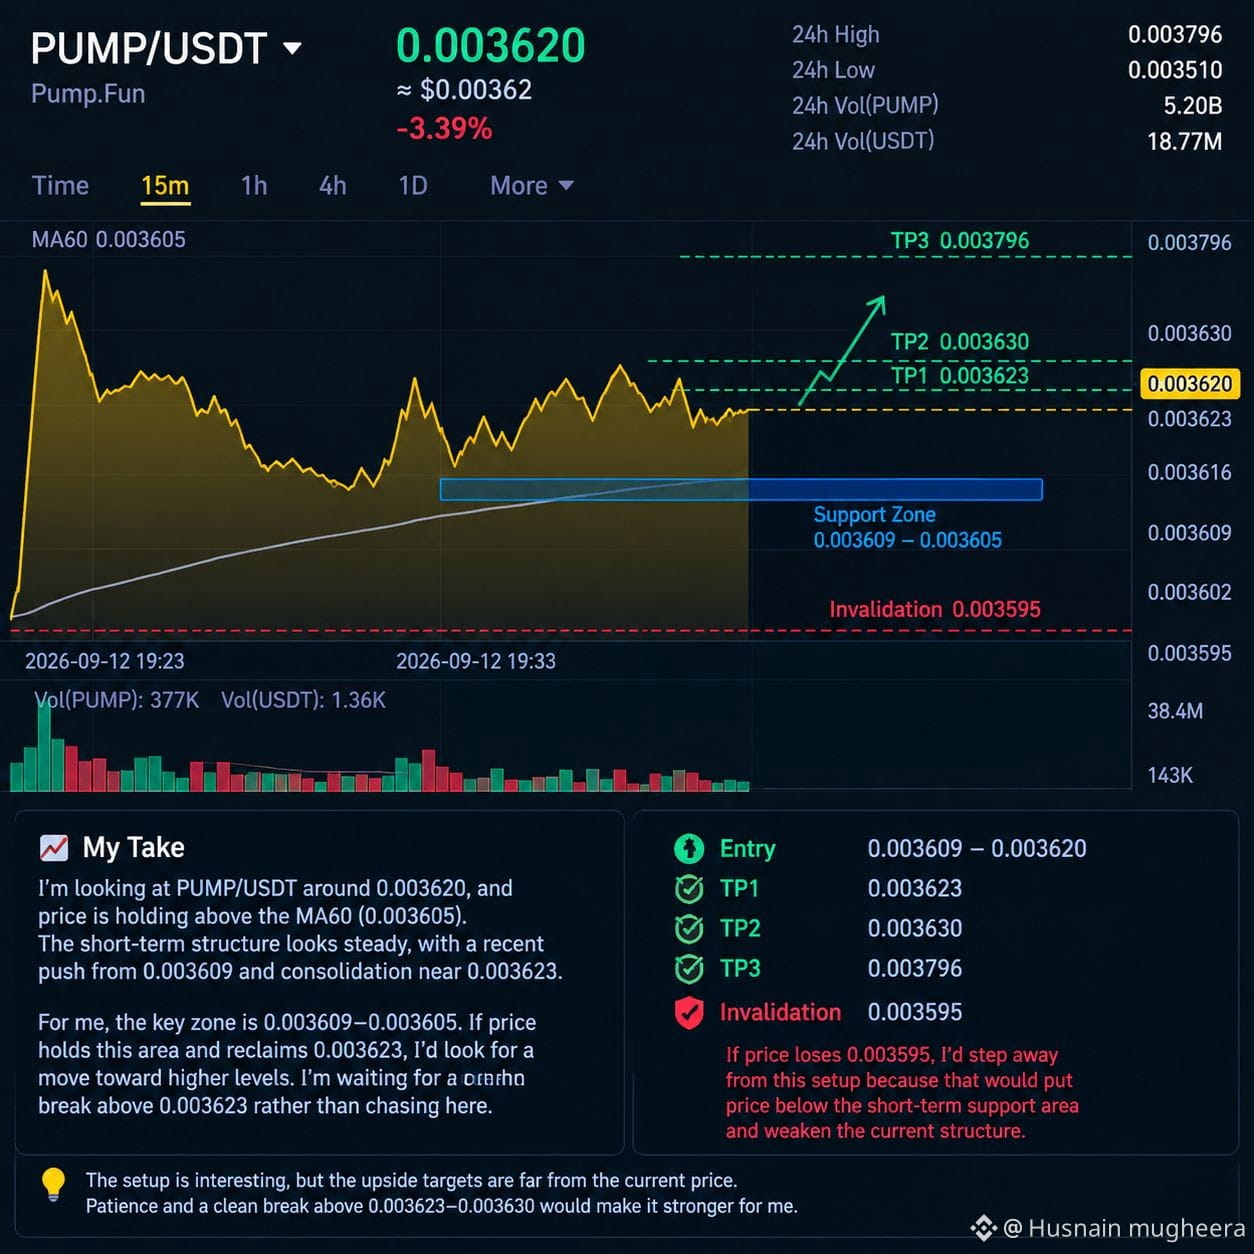
$PUMP /USDTを約0.003620で見ていますが、短期の構造は0.003605のMA60の上で維持されています。価格は0.003609のあたりから押し上げられ、直近の0.003623のレジスタンス付近でいまは値固めしています。
私にとって重要なエリアは0.003609〜0.003605です。価格がそこで維持され、0.003623を回復するなら、見えているより高い水準へ向かう継続により関心が出ます。私は現在の価格を追いかけるのではなく、レジスタンスを明確に上抜ける動きを待っています。
📍 エントリー: 0.003609〜0.003620
🎯 TP1: 0.003623
🎯 TP2: 0.003630
🎯 TP3: 0.003796
🛑 無効化: 0.003595
価格が0.003595を割り込むなら、このセットアップから一歩引きます。そうなると、価格が目に見える短期のサポートエリアの下に入り、現在の構造が弱まることになるからです。
このセットアップは興味深いですが、上値目標は現在価格からますます遠いので、まず買い手が実際に0.003623〜0.003630を回復するのを確認したいです。ここでは焦ってエントリーするよりも、待つことが理にかなっています。
{future}(PUMPUSDT)
$PUMP /USDTを約0.003620で見ていますが、短期の構造は0.003605のMA60の上で維持されています。価格は0.003609のあたりから押し上げられ、直近の0.003623のレジスタンス付近でいまは値固めしています。
私にとって重要なエリアは0.003609〜0.003605です。価格がそこで維持され、0.003623を回復するなら、見えているより高い水準へ向かう継続により関心が出ます。私は現在の価格を追いかけるのではなく、レジスタンスを明確に上抜ける動きを待っています。
📍 エントリー: 0.003609〜0.003620
🎯 TP1: 0.003623
🎯 TP2: 0.003630
🎯 TP3: 0.003796
🛑 無効化: 0.003595
価格が0.003595を割り込むなら、このセットアップから一歩引きます。そうなると、価格が目に見える短期のサポートエリアの下に入り、現在の構造が弱まることになるからです。
このセットアップは興味深いですが、上値目標は現在価格からますます遠いので、まず買い手が実際に0.003623〜0.003630を回復するのを確認したいです。ここでは焦ってエントリーするよりも、待つことが理にかなっています。
私にとって重要なエリアは0.003609〜0.003605です。価格がそこで維持され、0.003623を回復するなら、見えているより高い水準へ向かう継続により関心が出ます。私は現在の価格を追いかけるのではなく、レジスタンスを明確に上抜ける動きを待っています。
📍 エントリー: 0.003609〜0.003620
🎯 TP1: 0.003623
🎯 TP2: 0.003630
🎯 TP3: 0.003796
🛑 無効化: 0.003595
価格が0.003595を割り込むなら、このセットアップから一歩引きます。そうなると、価格が目に見える短期のサポートエリアの下に入り、現在の構造が弱まることになるからです。
このセットアップは興味深いですが、上値目標は現在価格からますます遠いので、まず買い手が実際に0.003623〜0.003630を回復するのを確認したいです。ここでは焦ってエントリーするよりも、待つことが理にかなっています。
163
翻訳参照
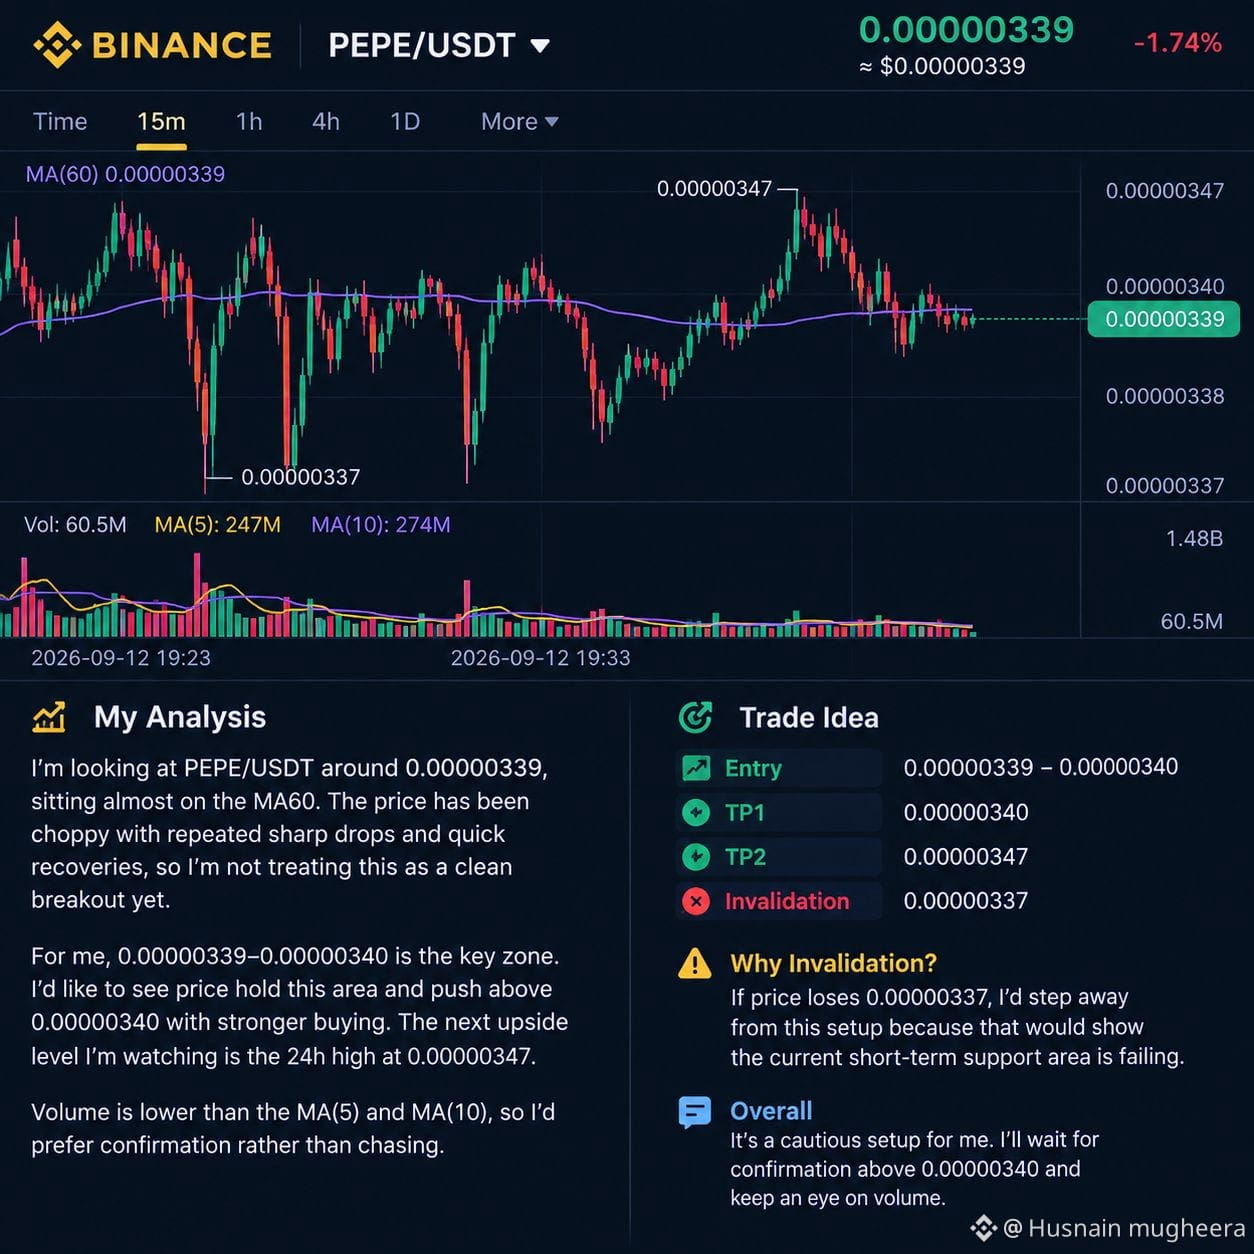
I’m looking at $PEPE /USDT around 0.00000339, sitting almost directly on the visible MA60 at the same level. The 15m chart looks extremely choppy, with repeated sharp drops and quick recoveries, so I’m not treating this as a clean breakout yet.
For me, 0.00000339–0.00000340 is the key area. I’d like to see price hold this zone and push through 0.00000340 with stronger buying before considering the setup attractive. The visible 24h high at 0.00000347 is the next important upside level.
📍 Entry: 0.00000339–0.00000340
🎯 TP1: 0.00000340
🎯 TP2: 0.00000347
🛑 Invalidation: 0.00000337
If price loses 0.00000337, I’d step away from this setup because that would show the current short-term support area is failing.
The volume panel shows current PEPE volume around 60.5M, below the displayed MA(5) and MA(10), so I’d prefer confirmation rather than chasing. Overall, I’m watching closely, but this remains a cautious setup until price proves it can hold above the current zone.$PEPE
{alpha}()
I’m looking at $PEPE /USDT around 0.00000339, sitting almost directly on the visible MA60 at the same level. The 15m chart looks extremely choppy, with repeated sharp drops and quick recoveries, so I’m not treating this as a clean breakout yet.
For me, 0.00000339–0.00000340 is the key area. I’d like to see price hold this zone and push through 0.00000340 with stronger buying before considering the setup attractive. The visible 24h high at 0.00000347 is the next important upside level.
📍 Entry: 0.00000339–0.00000340
🎯 TP1: 0.00000340
🎯 TP2: 0.00000347
🛑 Invalidation: 0.00000337
If price loses 0.00000337, I’d step away from this setup because that would show the current short-term support area is failing.
The volume panel shows current PEPE volume around 60.5M, below the displayed MA(5) and MA(10), so I’d prefer confirmation rather than chasing. Overall, I’m watching closely, but this remains a cautious setup until price proves it can hold above the current zone.$PEPE
For me, 0.00000339–0.00000340 is the key area. I’d like to see price hold this zone and push through 0.00000340 with stronger buying before considering the setup attractive. The visible 24h high at 0.00000347 is the next important upside level.
📍 Entry: 0.00000339–0.00000340
🎯 TP1: 0.00000340
🎯 TP2: 0.00000347
🛑 Invalidation: 0.00000337
If price loses 0.00000337, I’d step away from this setup because that would show the current short-term support area is failing.
The volume panel shows current PEPE volume around 60.5M, below the displayed MA(5) and MA(10), so I’d prefer confirmation rather than chasing. Overall, I’m watching closely, but this remains a cautious setup until price proves it can hold above the current zone.$PEPE
121
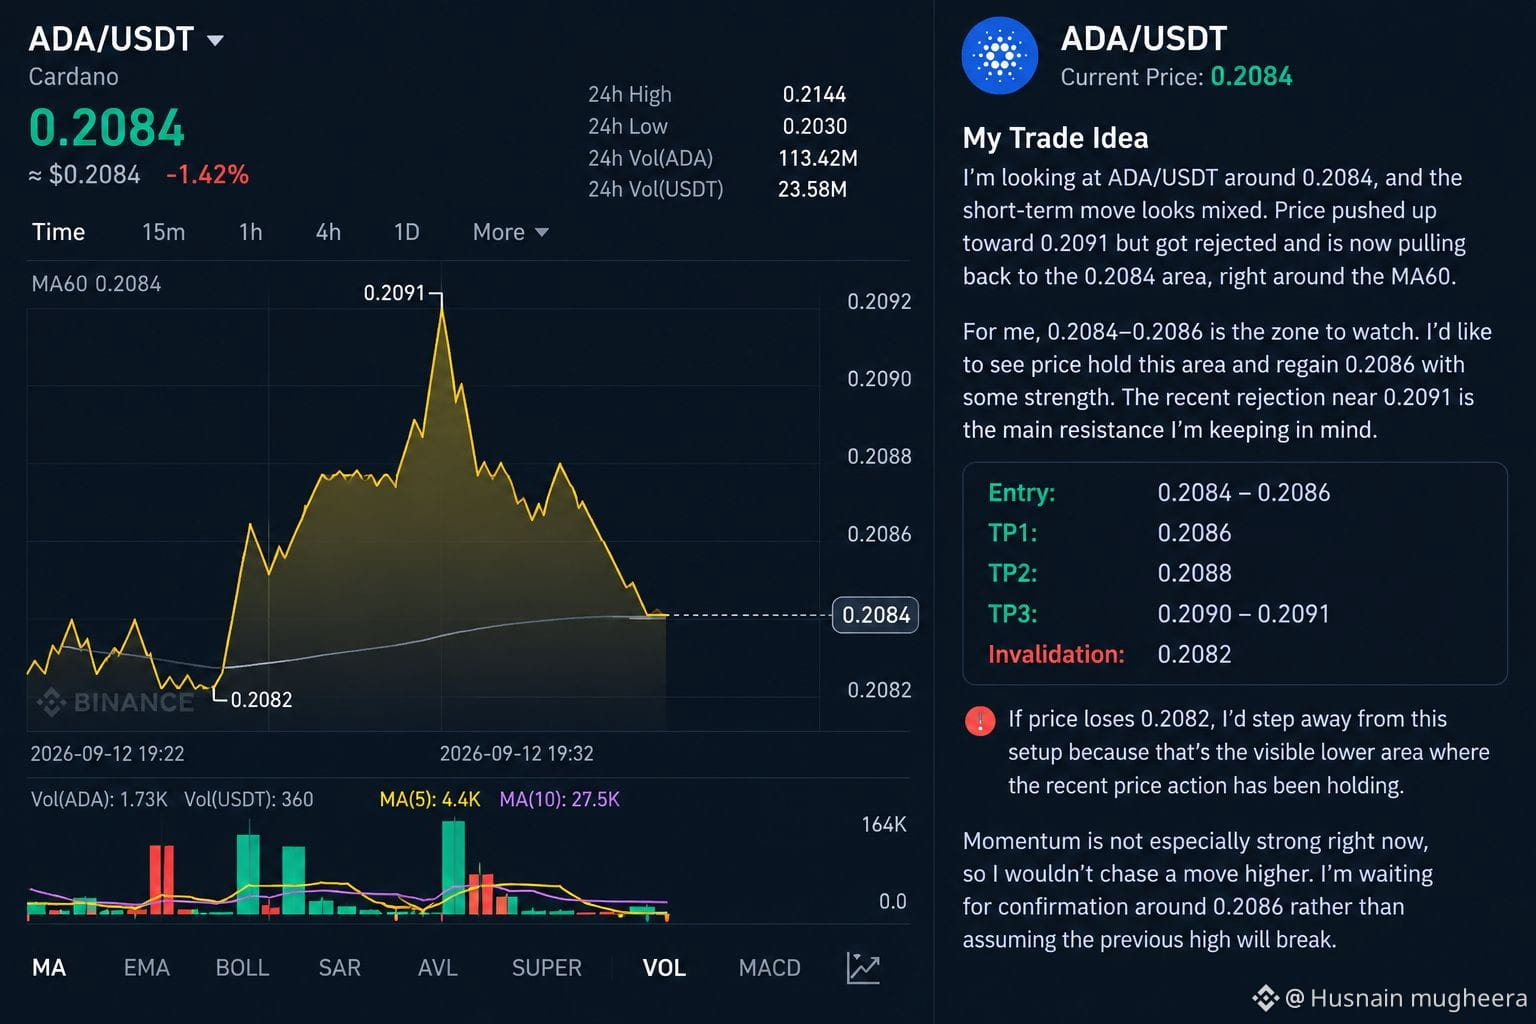
私は現在、$ADA /USDTを約0.2084あたりで見ています。短期の値動きはかなり方向感が混在しているように見えます。価格は0.2091付近まで上昇したものの跳ね返され、その後0.2084あたりまで押し戻されてきており、表示されているMA60のすぐ近くです。
私としては、0.2084〜0.2086が注目しているレンジです。このゾーンを維持し、少し強さを伴って0.2086を取り戻すのを見てからでないと、仕掛けとして魅力的だとは考えません。直近の0.2091近辺での拒否(リジェクト)が、私が意識している主要なレジスタンスです。
📍 エントリー: 0.2084〜0.2086
🎯 TP1: 0.2086
🎯 TP2: 0.2088
🎯 TP3: 0.2090〜0.2091
🛑 無効化: 0.2082
もし価格が0.2082を割り込むようなら、このセットアップからは一旦離れます。そこは、直近の値動きが支えてきたのが確認できる下側の目に見えるエリアだからです。
現時点のモメンタムは特に強くないので、上方向への動きを追いかけはしません。以前の高値がブレイクすると決めつけるのではなく、0.2086あたりでの確認を待ちます。
{future}(ADAUSDT)
私は現在、$ADA /USDTを約0.2084あたりで見ています。短期の値動きはかなり方向感が混在しているように見えます。価格は0.2091付近まで上昇したものの跳ね返され、その後0.2084あたりまで押し戻されてきており、表示されているMA60のすぐ近くです。
私としては、0.2084〜0.2086が注目しているレンジです。このゾーンを維持し、少し強さを伴って0.2086を取り戻すのを見てからでないと、仕掛けとして魅力的だとは考えません。直近の0.2091近辺での拒否(リジェクト)が、私が意識している主要なレジスタンスです。
📍 エントリー: 0.2084〜0.2086
🎯 TP1: 0.2086
🎯 TP2: 0.2088
🎯 TP3: 0.2090〜0.2091
🛑 無効化: 0.2082
もし価格が0.2082を割り込むようなら、このセットアップからは一旦離れます。そこは、直近の値動きが支えてきたのが確認できる下側の目に見えるエリアだからです。
現時点のモメンタムは特に強くないので、上方向への動きを追いかけはしません。以前の高値がブレイクすると決めつけるのではなく、0.2086あたりでの確認を待ちます。
私としては、0.2084〜0.2086が注目しているレンジです。このゾーンを維持し、少し強さを伴って0.2086を取り戻すのを見てからでないと、仕掛けとして魅力的だとは考えません。直近の0.2091近辺での拒否(リジェクト)が、私が意識している主要なレジスタンスです。
📍 エントリー: 0.2084〜0.2086
🎯 TP1: 0.2086
🎯 TP2: 0.2088
🎯 TP3: 0.2090〜0.2091
🛑 無効化: 0.2082
もし価格が0.2082を割り込むようなら、このセットアップからは一旦離れます。そこは、直近の値動きが支えてきたのが確認できる下側の目に見えるエリアだからです。
現時点のモメンタムは特に強くないので、上方向への動きを追いかけはしません。以前の高値がブレイクすると決めつけるのではなく、0.2086あたりでの確認を待ちます。
66
翻訳参照
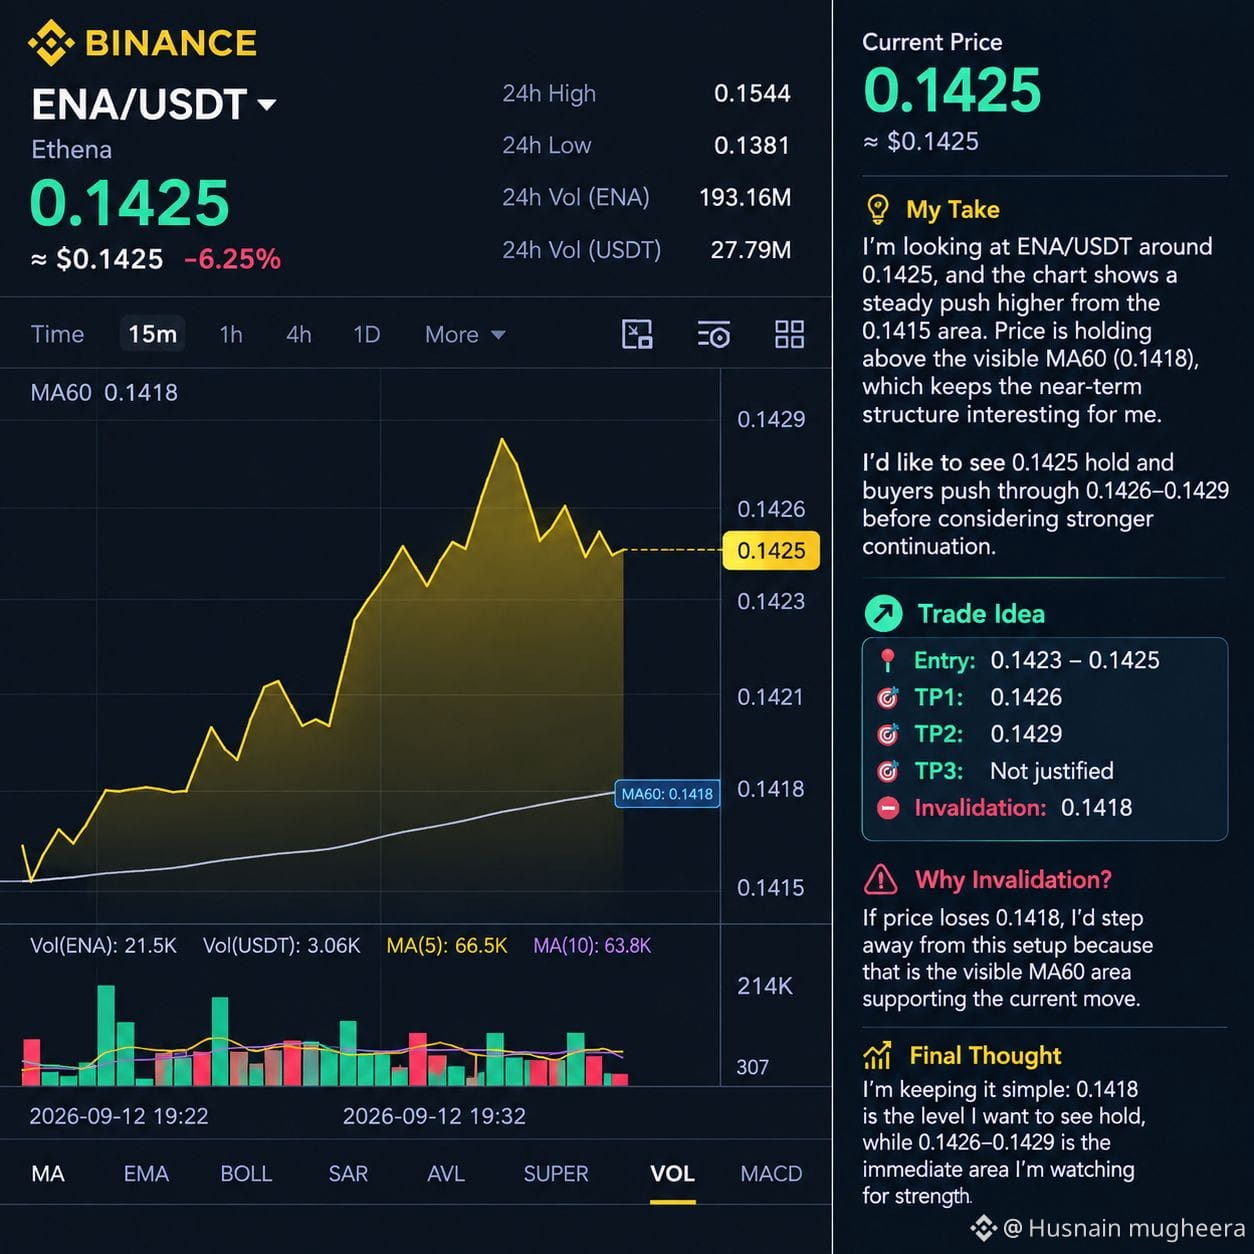
I’m looking at $ENA /USDT around 0.1425, and the short-term chart is showing a steady push higher from the 0.1415 area. Price is also holding above the visible MA60 at 0.1418, which keeps the near-term structure interesting for me.
Right now, price is consolidating around 0.1425 after reaching roughly 0.1429 on the chart. I’d like to see 0.1425 hold and buyers push through the recent 0.1426–0.1429 area before considering stronger continuation.
For me, the setup makes more sense while price remains above 0.1418. If momentum fades and price slips back below that level, the idea becomes much weaker.
📍 Entry: 0.1423–0.1425
🎯 TP1: 0.1426
🎯 TP2: 0.1429
🎯 TP3: Not justified from the visible chart
🛑 Invalidation: 0.1418
If price loses 0.1418, I’d step away from this setup because that is the visible MA60 area supporting the current move.
I’m keeping this one simple: 0.1418 is the level I want to see hold, while 0.1426–0.1429 is the immediate area I’m watching for strength.
{future}(ENAUSDT)
I’m looking at $ENA /USDT around 0.1425, and the short-term chart is showing a steady push higher from the 0.1415 area. Price is also holding above the visible MA60 at 0.1418, which keeps the near-term structure interesting for me.
Right now, price is consolidating around 0.1425 after reaching roughly 0.1429 on the chart. I’d like to see 0.1425 hold and buyers push through the recent 0.1426–0.1429 area before considering stronger continuation.
For me, the setup makes more sense while price remains above 0.1418. If momentum fades and price slips back below that level, the idea becomes much weaker.
📍 Entry: 0.1423–0.1425
🎯 TP1: 0.1426
🎯 TP2: 0.1429
🎯 TP3: Not justified from the visible chart
🛑 Invalidation: 0.1418
If price loses 0.1418, I’d step away from this setup because that is the visible MA60 area supporting the current move.
I’m keeping this one simple: 0.1418 is the level I want to see hold, while 0.1426–0.1429 is the immediate area I’m watching for strength.
Right now, price is consolidating around 0.1425 after reaching roughly 0.1429 on the chart. I’d like to see 0.1425 hold and buyers push through the recent 0.1426–0.1429 area before considering stronger continuation.
For me, the setup makes more sense while price remains above 0.1418. If momentum fades and price slips back below that level, the idea becomes much weaker.
📍 Entry: 0.1423–0.1425
🎯 TP1: 0.1426
🎯 TP2: 0.1429
🎯 TP3: Not justified from the visible chart
🛑 Invalidation: 0.1418
If price loses 0.1418, I’d step away from this setup because that is the visible MA60 area supporting the current move.
I’m keeping this one simple: 0.1418 is the level I want to see hold, while 0.1426–0.1429 is the immediate area I’m watching for strength.
130
翻訳参照
Good
Good

Shahzad mugheera
·
--
⚡ $ZEC は小さくバウンドしているようですが、チャートはまだ抵抗と格闘しています。
価格が 1,143.86–1,145.27 のあたりから押し上げられ、1,148.09 付近まで到達したあと、私は ZEC/USDT が 1,147.40 前後で推移しているのを見ています。動きは建設的に見えましたが、いったん押し戻されており、現在は 1,147.40 付近で安定しようとしているところです。
私にとって重要な最初のレベルは 1,148.09 です。そこを明確に上抜ける動きが出れば、短期の構造がより面白くなります。さらに上では、1,149.97 に見えている MA60 も重要なハードルです。
下方向では、私が見ている最も近い目に見える水準が 1,146.68 で、売りの圧力が強まるなら 1,145.27 がもう一つの目安になります。
📊 出来高は見えていますが、直近のローソク足では比較的軽めに見えるため、まだその動きを追いかけてはいません。
より真剣にセットアップを考える前に、価格が 1,148.09 を取り戻して、その水準を維持するのを見たいです。できれば、参加(出来高など)がより強くなる形で。
もし価格が 1,146.68 を失い、さらに下に続くなら、強気の見立ては弱まり、私は冷静に待ちます。
私の見解:面白い反発ですが、抵抗の上での確認(コンファーム)がまだ必要です。👀
価格が 1,143.86–1,145.27 のあたりから押し上げられ、1,148.09 付近まで到達したあと、私は ZEC/USDT が 1,147.40 前後で推移しているのを見ています。動きは建設的に見えましたが、いったん押し戻されており、現在は 1,147.40 付近で安定しようとしているところです。
私にとって重要な最初のレベルは 1,148.09 です。そこを明確に上抜ける動きが出れば、短期の構造がより面白くなります。さらに上では、1,149.97 に見えている MA60 も重要なハードルです。
下方向では、私が見ている最も近い目に見える水準が 1,146.68 で、売りの圧力が強まるなら 1,145.27 がもう一つの目安になります。
📊 出来高は見えていますが、直近のローソク足では比較的軽めに見えるため、まだその動きを追いかけてはいません。
より真剣にセットアップを考える前に、価格が 1,148.09 を取り戻して、その水準を維持するのを見たいです。できれば、参加(出来高など)がより強くなる形で。
もし価格が 1,146.68 を失い、さらに下に続くなら、強気の見立ては弱まり、私は冷静に待ちます。
私の見解:面白い反発ですが、抵抗の上での確認(コンファーム)がまだ必要です。👀

79
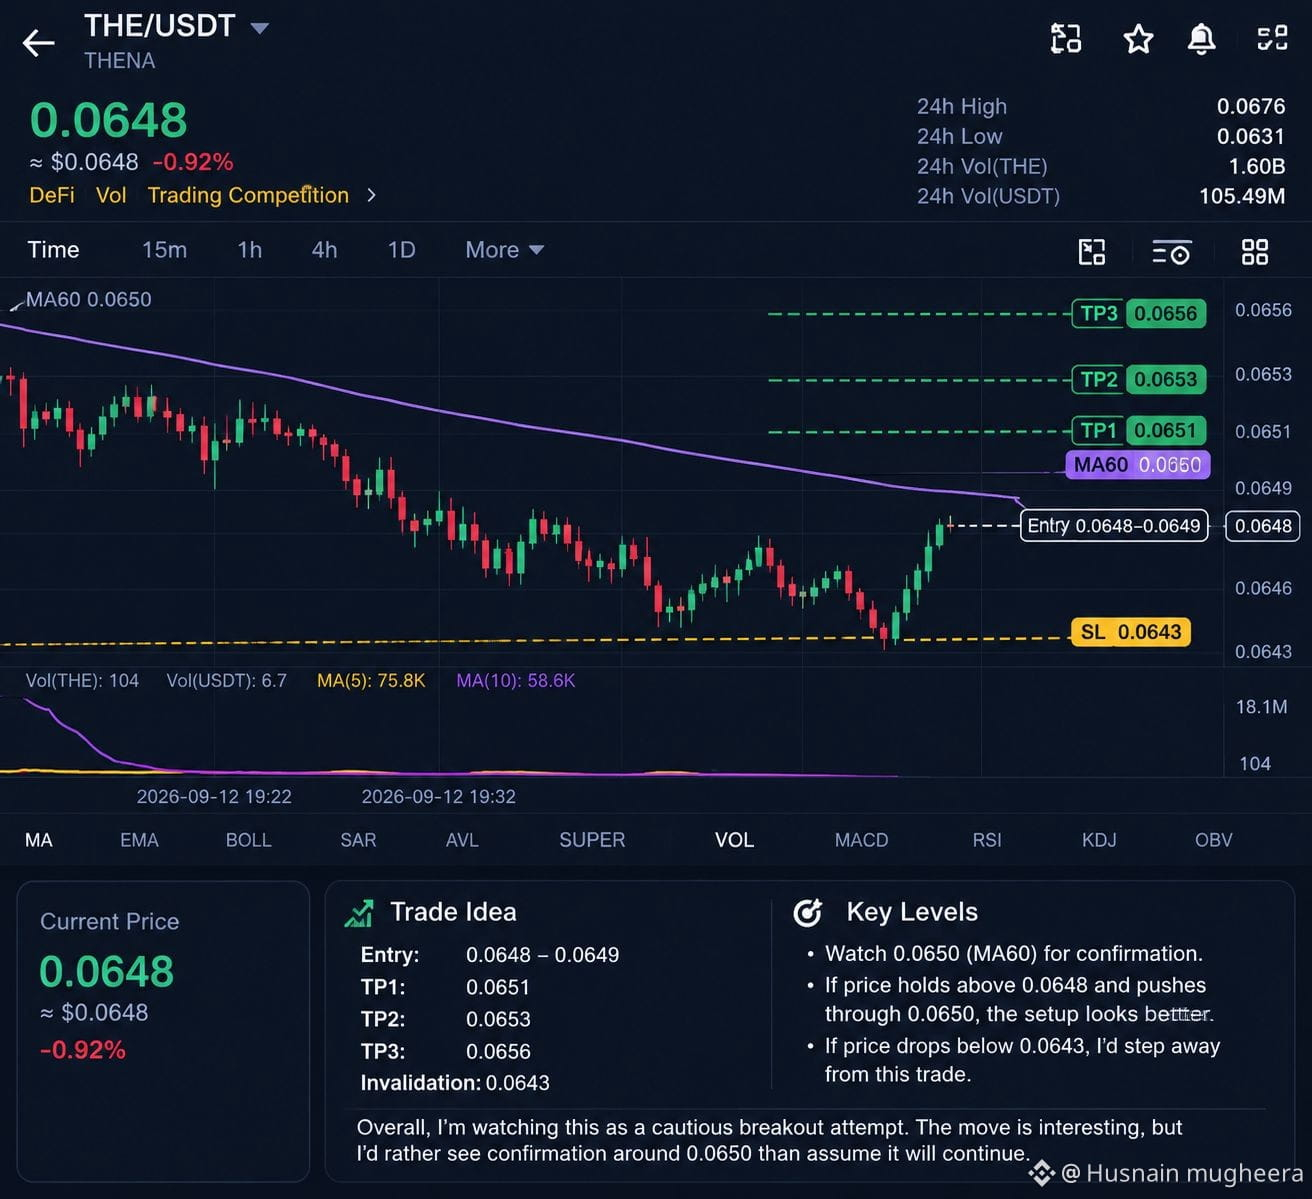
$THE /USDT を 0.0648 前後で見ています。価格が 0.0643 付近からちょうど急激に上に押し上げられたところです。私にとって面白いのは、価格がまだ 0.0650 の下で、下向きの MA60 にかかっている点なので、動きについて追いかけるのではなく、確認がほしいということです。
価格は主に 0.0643〜0.0646 の範囲で動いていましたが、その後突然 0.0649 付近まで跳ねました。今注目している重要な水準は 0.0650 です。ここに目に見える MA60 が位置しているからです。
📍 エントリー: 0.0648–0.0649
🎯 TP1: 0.0651
🎯 TP2: 0.0653
🎯 TP3: 0.0656
🛑 無効化: 0.0643
0.0648 を上回って推移し、0.0650 の MA60 エリアを抜けるのを見てから、このセットアップが魅力的だと判断したいです。そのエリアを下回って勢いが失われるなら、取引の説得力は下がります。
もし 0.0643 を割り込んだら、このセットアップから離れます。そこははっきり確認できる直近の安値であり、サポートエリアでもあるからです。
全体として、私はこの動きを慎重なブレイクアウトの試みとして監視しています。動き自体は興味深いのですが、スパイクが続くと決め打ちするより、0.0650 近辺での確認を見たいです。
{future}(THEUSDT)
$THE /USDT を 0.0648 前後で見ています。価格が 0.0643 付近からちょうど急激に上に押し上げられたところです。私にとって面白いのは、価格がまだ 0.0650 の下で、下向きの MA60 にかかっている点なので、動きについて追いかけるのではなく、確認がほしいということです。
価格は主に 0.0643〜0.0646 の範囲で動いていましたが、その後突然 0.0649 付近まで跳ねました。今注目している重要な水準は 0.0650 です。ここに目に見える MA60 が位置しているからです。
📍 エントリー: 0.0648–0.0649
🎯 TP1: 0.0651
🎯 TP2: 0.0653
🎯 TP3: 0.0656
🛑 無効化: 0.0643
0.0648 を上回って推移し、0.0650 の MA60 エリアを抜けるのを見てから、このセットアップが魅力的だと判断したいです。そのエリアを下回って勢いが失われるなら、取引の説得力は下がります。
もし 0.0643 を割り込んだら、このセットアップから離れます。そこははっきり確認できる直近の安値であり、サポートエリアでもあるからです。
全体として、私はこの動きを慎重なブレイクアウトの試みとして監視しています。動き自体は興味深いのですが、スパイクが続くと決め打ちするより、0.0650 近辺での確認を見たいです。
価格は主に 0.0643〜0.0646 の範囲で動いていましたが、その後突然 0.0649 付近まで跳ねました。今注目している重要な水準は 0.0650 です。ここに目に見える MA60 が位置しているからです。
📍 エントリー: 0.0648–0.0649
🎯 TP1: 0.0651
🎯 TP2: 0.0653
🎯 TP3: 0.0656
🛑 無効化: 0.0643
0.0648 を上回って推移し、0.0650 の MA60 エリアを抜けるのを見てから、このセットアップが魅力的だと判断したいです。そのエリアを下回って勢いが失われるなら、取引の説得力は下がります。
もし 0.0643 を割り込んだら、このセットアップから離れます。そこははっきり確認できる直近の安値であり、サポートエリアでもあるからです。
全体として、私はこの動きを慎重なブレイクアウトの試みとして監視しています。動き自体は興味深いのですが、スパイクが続くと決め打ちするより、0.0650 近辺での確認を見たいです。
65
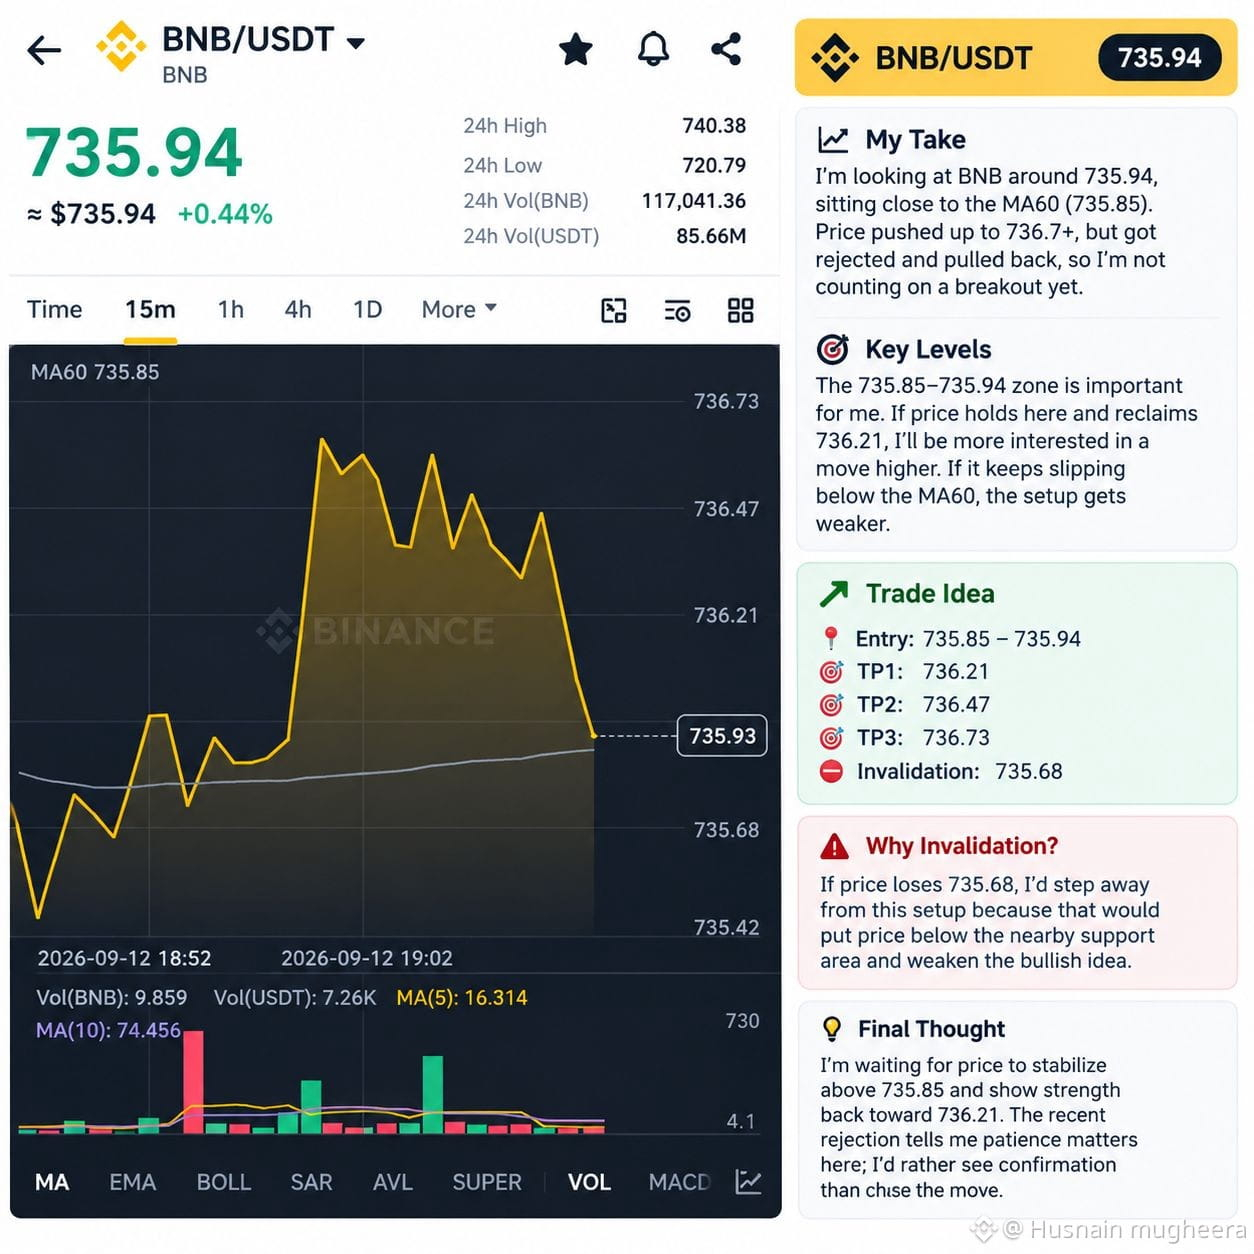
私は$BNB /USDTを見ていて、約735.94のあたりにあります。表示されているMA60(735.85)にほぼ真上に乗っています。価格は736.7+付近まで押し上げられたものの、その後は拒否(反落)されて急落したため、現時点ではまだクリーンなブレイクとしては見ていません。
私にとって重要なレンジは735.85〜735.94です。ここで価格が維持され、736.21を取り戻し始めることができれば、直近の見えている高値に向けた継続により関心が持てます。価格が移動平均を下回り続けるなら、このセットアップは魅力が下がります。
📍 エントリー:735.85〜735.94
🎯 TP1:736.21
🎯 TP2:736.47
🎯 TP3:736.73
🛑 無効ライン:735.68
もし価格が735.68を割り込むなら、このセットアップから一旦離れます。そうなると価格が近くの表示されたサポートエリアの下に来て、強気の見立てが弱まるからです。
私は主に、価格が735.85のMA60の上で安定し、736.21へ向けて強さを見せるのを待っています。今回の拒否(リジェクト)から、ここでは忍耐が重要だと感じています。動きを追いかけるよりも、確認を見たいです。$BNB
{future}(BNBUSDT)
私は$BNB /USDTを見ていて、約735.94のあたりにあります。表示されているMA60(735.85)にほぼ真上に乗っています。価格は736.7+付近まで押し上げられたものの、その後は拒否(反落)されて急落したため、現時点ではまだクリーンなブレイクとしては見ていません。
私にとって重要なレンジは735.85〜735.94です。ここで価格が維持され、736.21を取り戻し始めることができれば、直近の見えている高値に向けた継続により関心が持てます。価格が移動平均を下回り続けるなら、このセットアップは魅力が下がります。
📍 エントリー:735.85〜735.94
🎯 TP1:736.21
🎯 TP2:736.47
🎯 TP3:736.73
🛑 無効ライン:735.68
もし価格が735.68を割り込むなら、このセットアップから一旦離れます。そうなると価格が近くの表示されたサポートエリアの下に来て、強気の見立てが弱まるからです。
私は主に、価格が735.85のMA60の上で安定し、736.21へ向けて強さを見せるのを待っています。今回の拒否(リジェクト)から、ここでは忍耐が重要だと感じています。動きを追いかけるよりも、確認を見たいです。$BNB
私にとって重要なレンジは735.85〜735.94です。ここで価格が維持され、736.21を取り戻し始めることができれば、直近の見えている高値に向けた継続により関心が持てます。価格が移動平均を下回り続けるなら、このセットアップは魅力が下がります。
📍 エントリー:735.85〜735.94
🎯 TP1:736.21
🎯 TP2:736.47
🎯 TP3:736.73
🛑 無効ライン:735.68
もし価格が735.68を割り込むなら、このセットアップから一旦離れます。そうなると価格が近くの表示されたサポートエリアの下に来て、強気の見立てが弱まるからです。
私は主に、価格が735.85のMA60の上で安定し、736.21へ向けて強さを見せるのを待っています。今回の拒否(リジェクト)から、ここでは忍耐が重要だと感じています。動きを追いかけるよりも、確認を見たいです。$BNB
64
翻訳参照
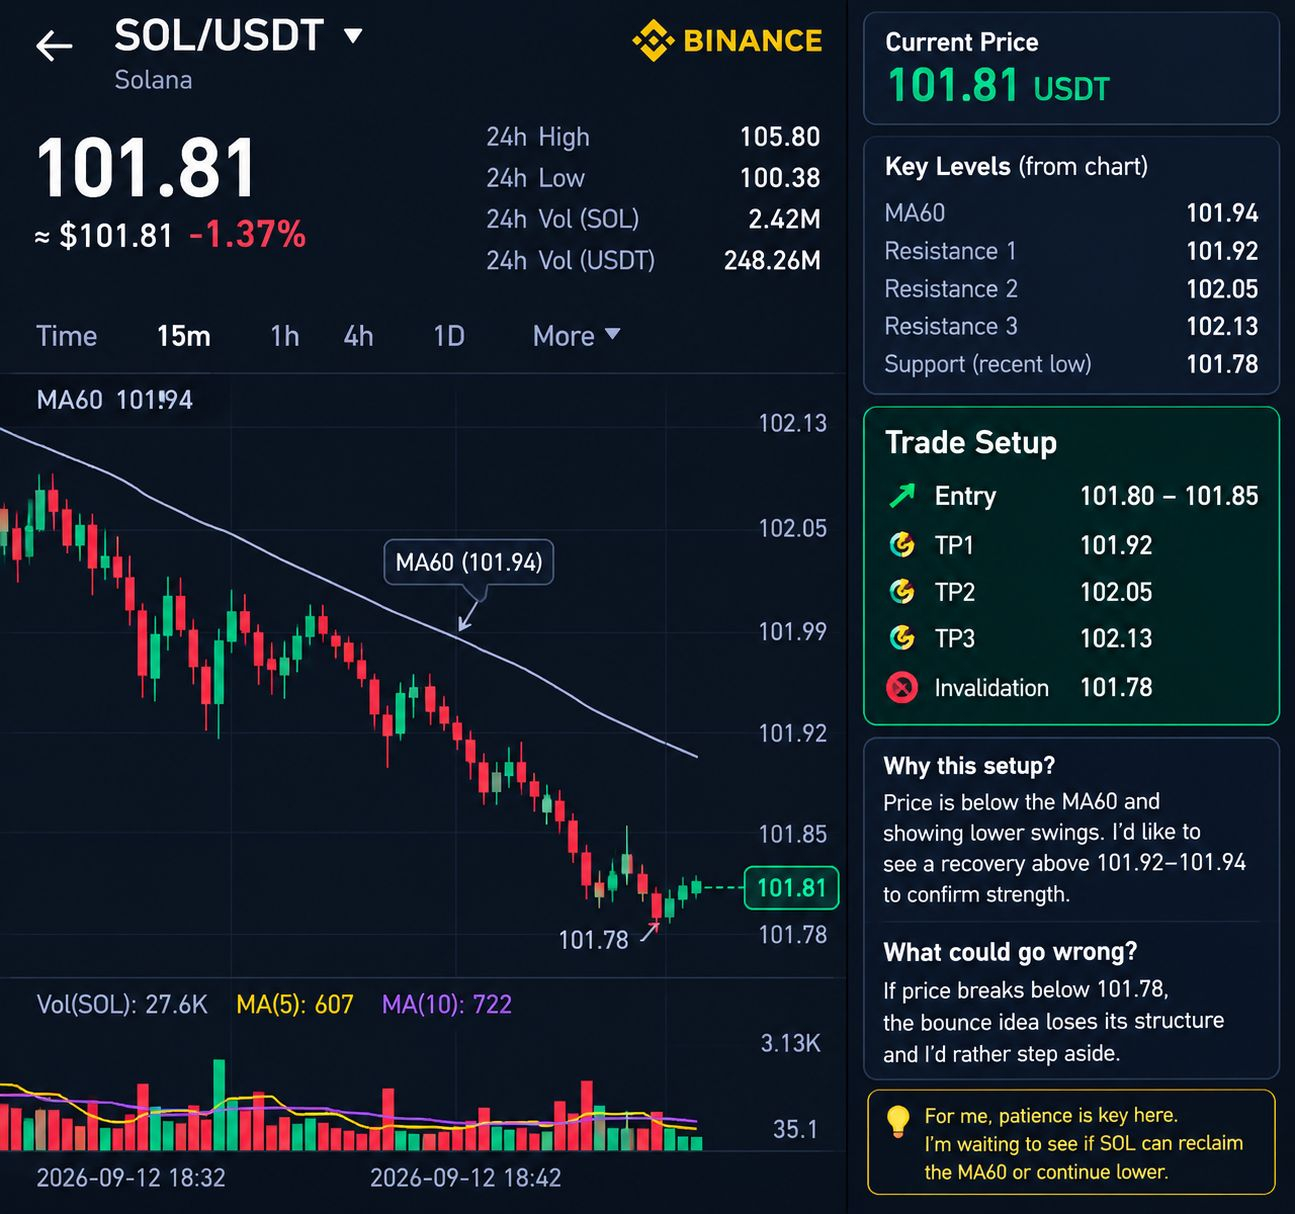
I’m looking at $SOL /USDT around 101.81, and the short-term chart is leaning weak. Price is sitting below the visible MA60 at 101.94, while the recent price movement is making lower swings toward the 101.78 area.
For me, the key zone is 101.92–101.94. I’d like to see price recover this area and hold above it before considering a stronger bounce. If SOL stays below the MA60, the nearby 101.78 low remains the level I’m watching closely.
📍 Entry: 101.80–101.85
🎯 TP1: 101.92
🎯 TP2: 102.05
🎯 TP3: 102.13
🛑 Invalidation: 101.78
This is a cautious setup because the visible momentum is still soft. I’d want price to reclaim 101.92–101.94 with some strength rather than chasing immediately. If it breaks below 101.78, the bounce idea loses its structure and I’d rather step aside than force the trade.
If price loses 101.78, I’d step away from this setup because that is the lowest clearly visible level on the short-term chart.
For me, patience matters here. I’m waiting for SOL to show whether it can reclaim the MA60 or continue pressing lower.
{future}(SOLUSDT)
I’m looking at $SOL /USDT around 101.81, and the short-term chart is leaning weak. Price is sitting below the visible MA60 at 101.94, while the recent price movement is making lower swings toward the 101.78 area.
For me, the key zone is 101.92–101.94. I’d like to see price recover this area and hold above it before considering a stronger bounce. If SOL stays below the MA60, the nearby 101.78 low remains the level I’m watching closely.
📍 Entry: 101.80–101.85
🎯 TP1: 101.92
🎯 TP2: 102.05
🎯 TP3: 102.13
🛑 Invalidation: 101.78
This is a cautious setup because the visible momentum is still soft. I’d want price to reclaim 101.92–101.94 with some strength rather than chasing immediately. If it breaks below 101.78, the bounce idea loses its structure and I’d rather step aside than force the trade.
If price loses 101.78, I’d step away from this setup because that is the lowest clearly visible level on the short-term chart.
For me, patience matters here. I’m waiting for SOL to show whether it can reclaim the MA60 or continue pressing lower.
For me, the key zone is 101.92–101.94. I’d like to see price recover this area and hold above it before considering a stronger bounce. If SOL stays below the MA60, the nearby 101.78 low remains the level I’m watching closely.
📍 Entry: 101.80–101.85
🎯 TP1: 101.92
🎯 TP2: 102.05
🎯 TP3: 102.13
🛑 Invalidation: 101.78
This is a cautious setup because the visible momentum is still soft. I’d want price to reclaim 101.92–101.94 with some strength rather than chasing immediately. If it breaks below 101.78, the bounce idea loses its structure and I’d rather step aside than force the trade.
If price loses 101.78, I’d step away from this setup because that is the lowest clearly visible level on the short-term chart.
For me, patience matters here. I’m waiting for SOL to show whether it can reclaim the MA60 or continue pressing lower.
33
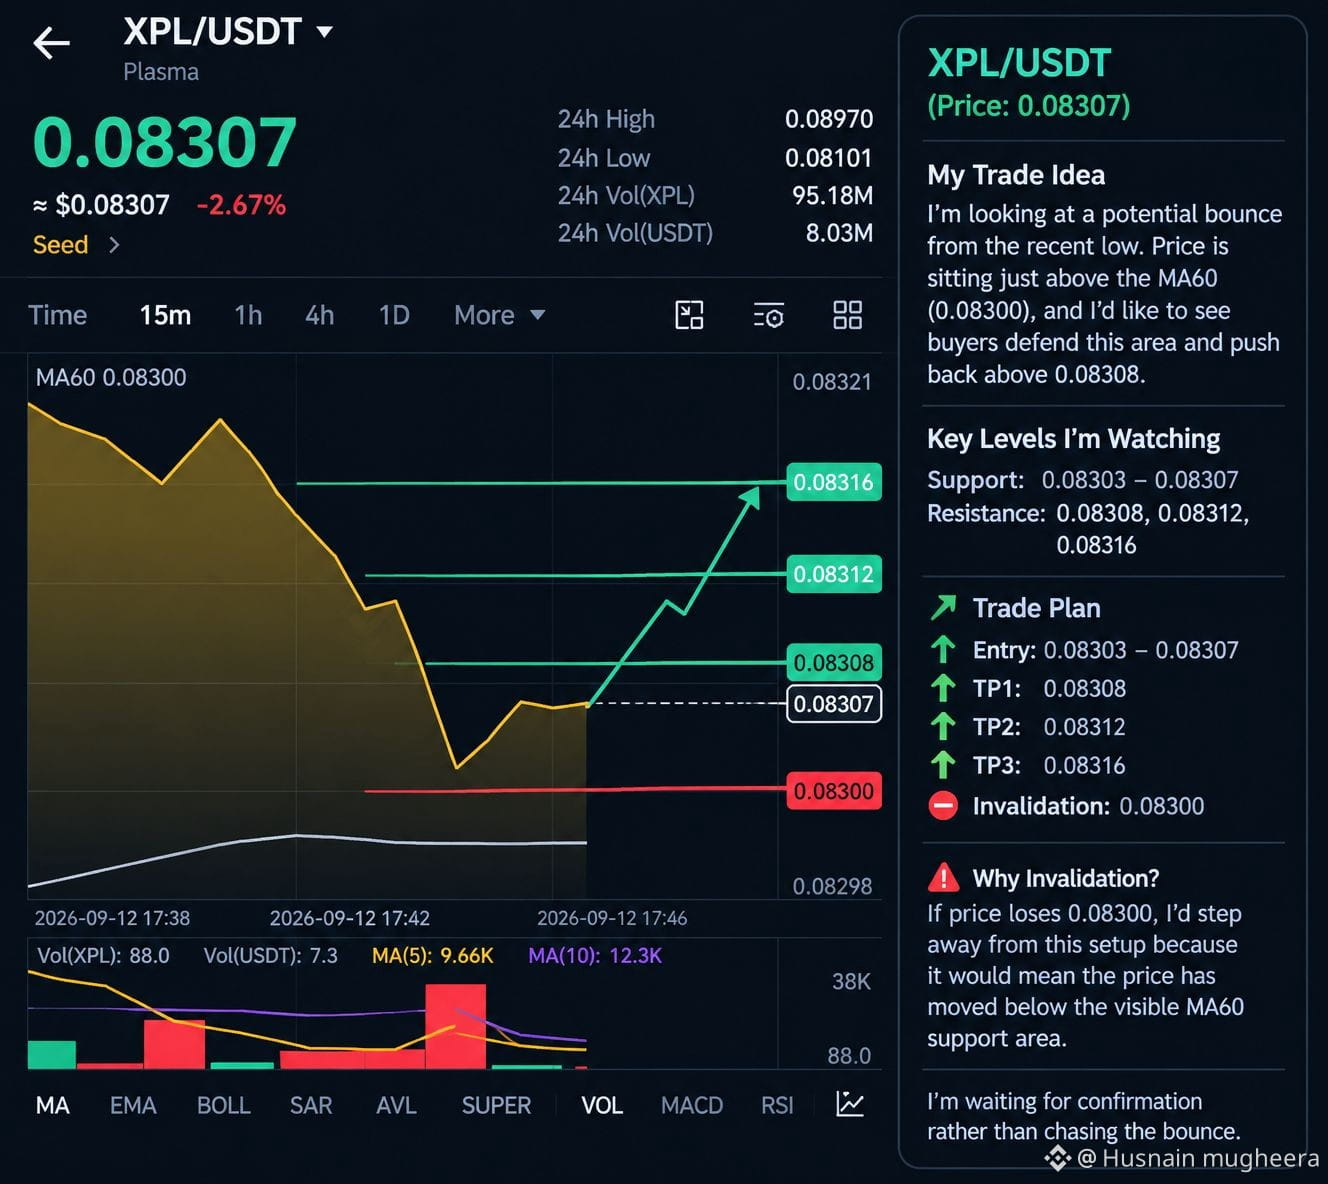
$XPL /USDTを0.08307前後で見ていますが、短期チャートは、0.08321あたりから0.08303へ下落した後もまだ弱い傾向が続いています。0.08307までの小さな戻りは興味深いものの、現時点では十分な確証が見えていません。
私としては、0.08303〜0.08307が注目ポイントです。価格は現在、表示されているMA60(0.08300)のすぐ上に位置しているので、このあたりを買い手が守って0.08308より上へ押し戻すのを確認してから、セットアップを魅力的だと判断したいです。
もしそれが起きれば、上に表示されている水準としては0.08312と0.08316が注目すべき妥当なエリアになります。直近の動きは下方向で、リバウンドもまだ小さいため、期待は控えめにしておきます。
📍 エントリー:0.08303〜0.08307
🎯 TP1:0.08308
🎯 TP2:0.08312
🎯 TP3:0.08316
🛑 無効ライン:0.08300
価格が0.08300を割り込んだ場合は、このセットアップから一旦手を引きます。これは価格が表示されているMA60のサポートエリアの下へ移動したことを意味するからです。
今は、戻りを追いかけるのではなく、確証を待っています。
{future}(XPLUSDT)
$XPL /USDTを0.08307前後で見ていますが、短期チャートは、0.08321あたりから0.08303へ下落した後もまだ弱い傾向が続いています。0.08307までの小さな戻りは興味深いものの、現時点では十分な確証が見えていません。
私としては、0.08303〜0.08307が注目ポイントです。価格は現在、表示されているMA60(0.08300)のすぐ上に位置しているので、このあたりを買い手が守って0.08308より上へ押し戻すのを確認してから、セットアップを魅力的だと判断したいです。
もしそれが起きれば、上に表示されている水準としては0.08312と0.08316が注目すべき妥当なエリアになります。直近の動きは下方向で、リバウンドもまだ小さいため、期待は控えめにしておきます。
📍 エントリー:0.08303〜0.08307
🎯 TP1:0.08308
🎯 TP2:0.08312
🎯 TP3:0.08316
🛑 無効ライン:0.08300
価格が0.08300を割り込んだ場合は、このセットアップから一旦手を引きます。これは価格が表示されているMA60のサポートエリアの下へ移動したことを意味するからです。
今は、戻りを追いかけるのではなく、確証を待っています。
私としては、0.08303〜0.08307が注目ポイントです。価格は現在、表示されているMA60(0.08300)のすぐ上に位置しているので、このあたりを買い手が守って0.08308より上へ押し戻すのを確認してから、セットアップを魅力的だと判断したいです。
もしそれが起きれば、上に表示されている水準としては0.08312と0.08316が注目すべき妥当なエリアになります。直近の動きは下方向で、リバウンドもまだ小さいため、期待は控えめにしておきます。
📍 エントリー:0.08303〜0.08307
🎯 TP1:0.08308
🎯 TP2:0.08312
🎯 TP3:0.08316
🛑 無効ライン:0.08300
価格が0.08300を割り込んだ場合は、このセットアップから一旦手を引きます。これは価格が表示されているMA60のサポートエリアの下へ移動したことを意味するからです。
今は、戻りを追いかけるのではなく、確証を待っています。
66
翻訳参照
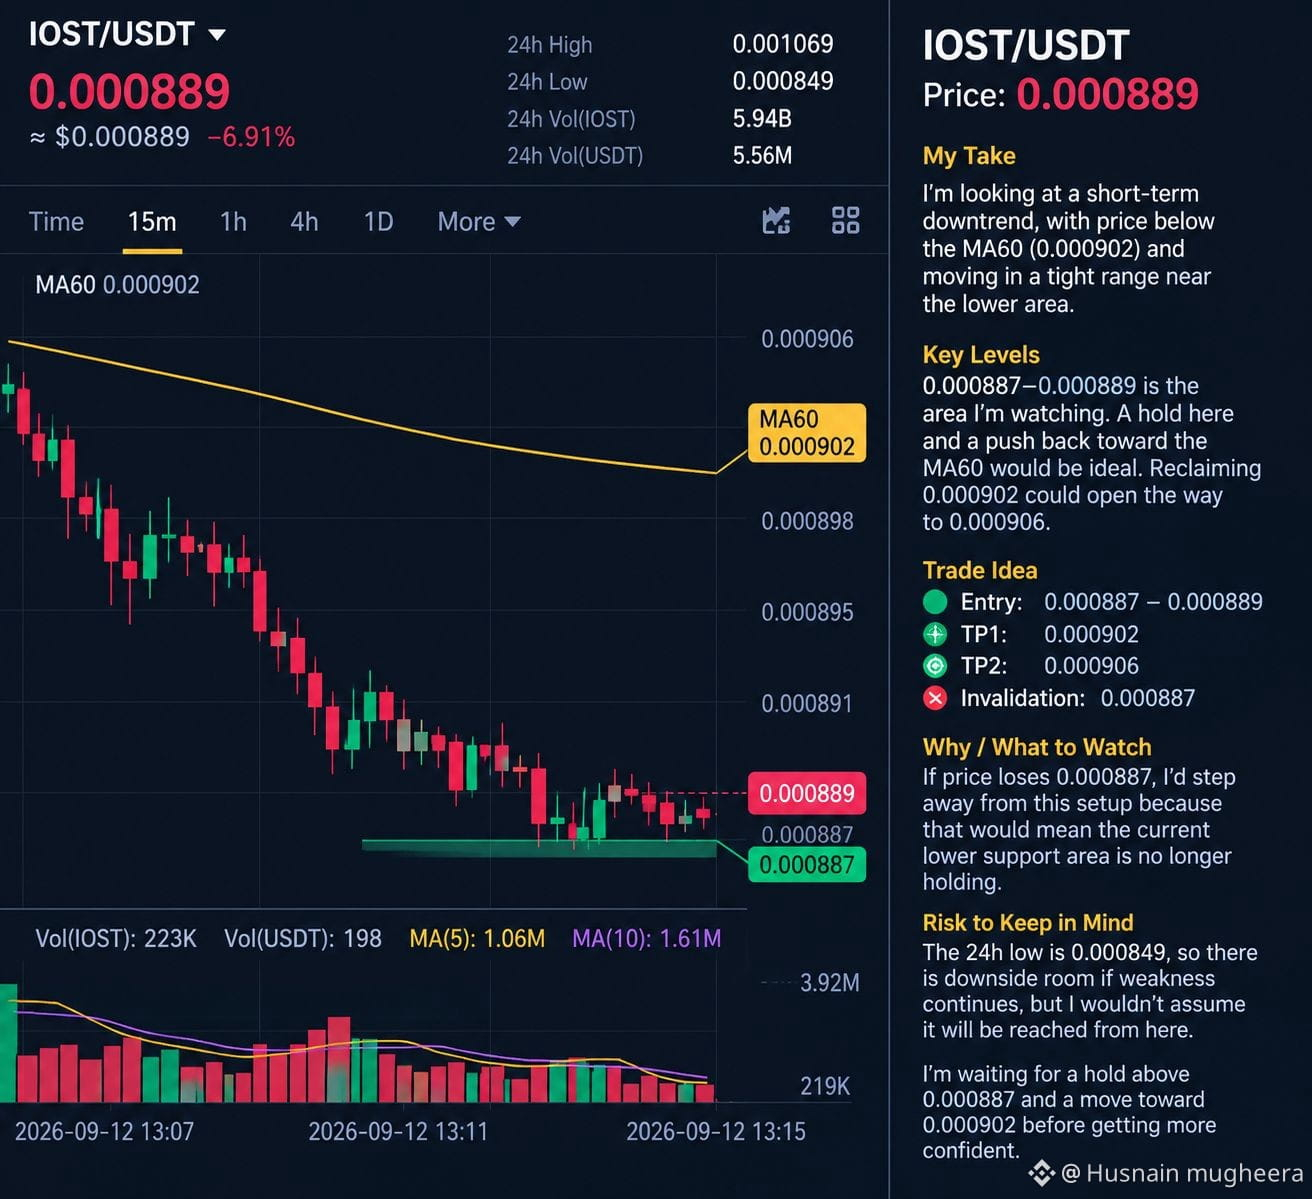
I’m looking at $IOST /USDT around 0.000889, and the short-term chart looks weak rather than cleanly bullish. Price is sitting below the visible MA60 at 0.000902, while the recent candles are moving in a tight range near the lower part of the chart.
For me, 0.000887–0.000889 is the area I’m watching first. I’d like to see price hold this zone and start pushing back toward the MA60. A reclaim of 0.000902 would make the setup more interesting, with 0.000906 acting as the next visible level.
📍 Entry: 0.000887–0.000889
🎯 TP1: 0.000902
🎯 TP2: 0.000906
🛑 Invalidation: 0.000887
If price loses 0.000887, I’d step away from this setup because that would mean the current lower support area is no longer holding.
The 24h low is 0.000849, so there is clearly downside room if weakness continues, but I wouldn’t assume that level will be reached from this chart alone. I’m waiting for a hold above the current low area and a move back toward 0.000902 before getting more confident.
{future}(IOSTUSDT)
I’m looking at $IOST /USDT around 0.000889, and the short-term chart looks weak rather than cleanly bullish. Price is sitting below the visible MA60 at 0.000902, while the recent candles are moving in a tight range near the lower part of the chart.
For me, 0.000887–0.000889 is the area I’m watching first. I’d like to see price hold this zone and start pushing back toward the MA60. A reclaim of 0.000902 would make the setup more interesting, with 0.000906 acting as the next visible level.
📍 Entry: 0.000887–0.000889
🎯 TP1: 0.000902
🎯 TP2: 0.000906
🛑 Invalidation: 0.000887
If price loses 0.000887, I’d step away from this setup because that would mean the current lower support area is no longer holding.
The 24h low is 0.000849, so there is clearly downside room if weakness continues, but I wouldn’t assume that level will be reached from this chart alone. I’m waiting for a hold above the current low area and a move back toward 0.000902 before getting more confident.
For me, 0.000887–0.000889 is the area I’m watching first. I’d like to see price hold this zone and start pushing back toward the MA60. A reclaim of 0.000902 would make the setup more interesting, with 0.000906 acting as the next visible level.
📍 Entry: 0.000887–0.000889
🎯 TP1: 0.000902
🎯 TP2: 0.000906
🛑 Invalidation: 0.000887
If price loses 0.000887, I’d step away from this setup because that would mean the current lower support area is no longer holding.
The 24h low is 0.000849, so there is clearly downside room if weakness continues, but I wouldn’t assume that level will be reached from this chart alone. I’m waiting for a hold above the current low area and a move back toward 0.000902 before getting more confident.
142
翻訳参照
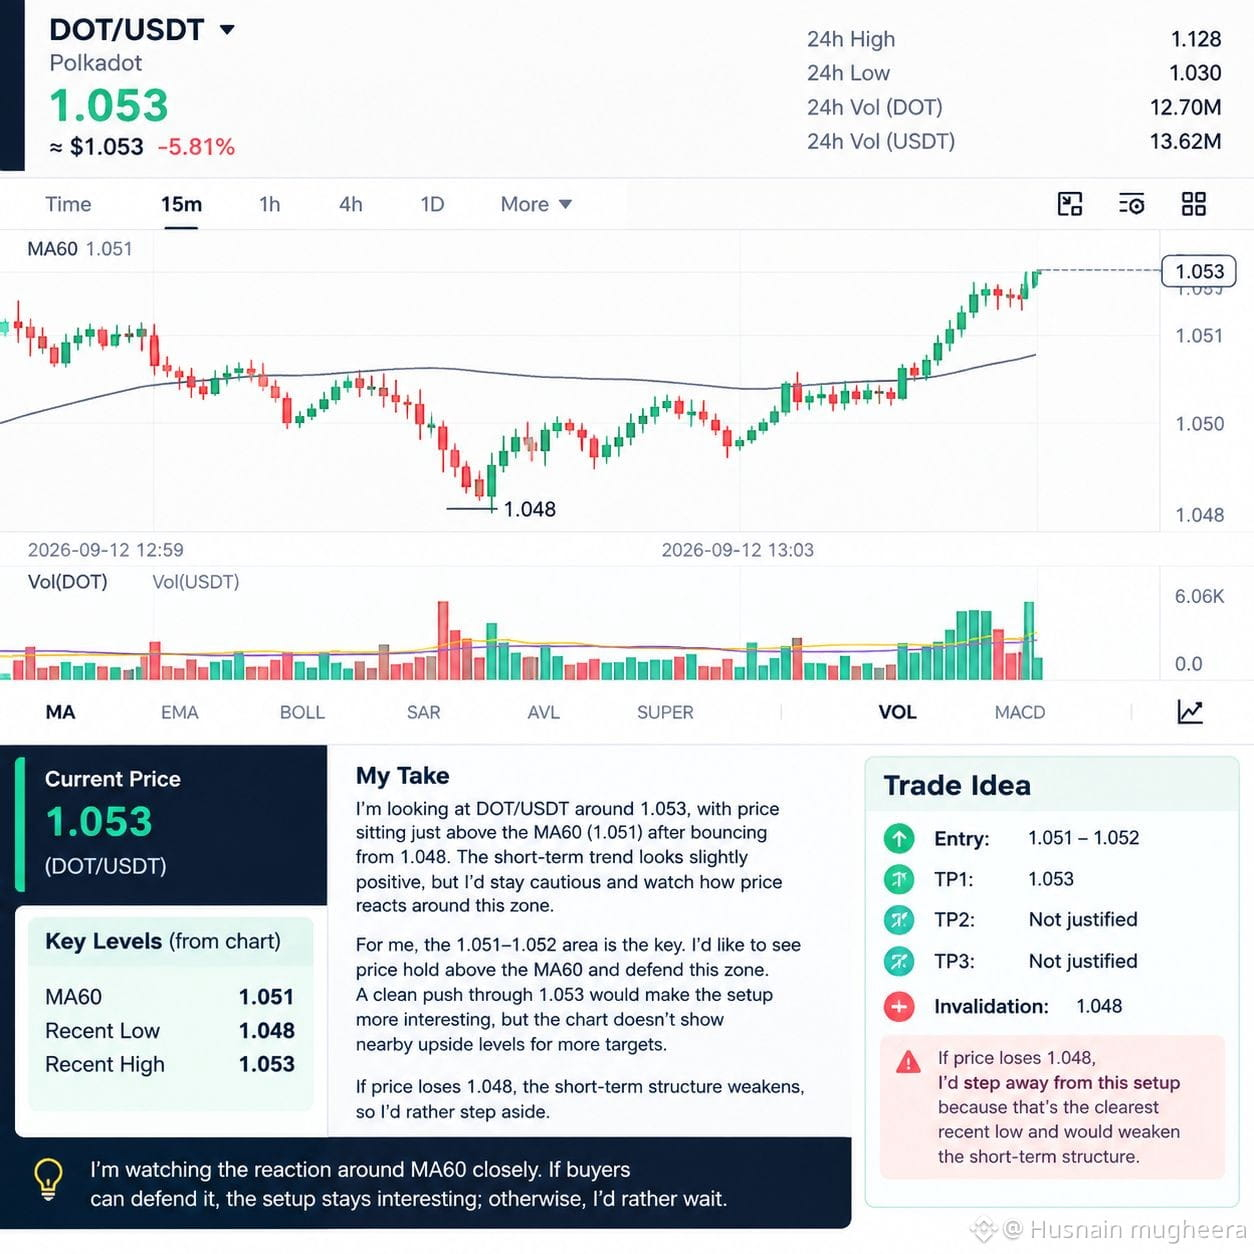
I’m looking at $DOT /USDT around 1.053, with price sitting just above the visible MA60 at 1.051. The short-term chart has bounced from the 1.048 area and is now pressing the local high near 1.053, so I’d stay cautious rather than chase.
For me, the key area is 1.051–1.052. I’d like to see price hold above the MA60 and continue defending that zone. A clean push through 1.053 would make the setup more interesting, but the chart doesn’t give enough nearby upside levels to justify multiple targets.
📍 Entry: 1.051–1.052
🎯 TP1: 1.053
🎯 TP2: Not justified from the visible chart
🎯 TP3: Not justified
🛑 Invalidation: 1.048
If price loses 1.048, I’d step away from this setup because that’s the clearest recent low visible on the chart and would weaken the short-term structure.
I’m watching the reaction around MA60 closely. If buyers can defend it, the setup stays interesting; otherwise, I’d rather wait than force a trade.
{future}(DOTUSDT)
I’m looking at $DOT /USDT around 1.053, with price sitting just above the visible MA60 at 1.051. The short-term chart has bounced from the 1.048 area and is now pressing the local high near 1.053, so I’d stay cautious rather than chase.
For me, the key area is 1.051–1.052. I’d like to see price hold above the MA60 and continue defending that zone. A clean push through 1.053 would make the setup more interesting, but the chart doesn’t give enough nearby upside levels to justify multiple targets.
📍 Entry: 1.051–1.052
🎯 TP1: 1.053
🎯 TP2: Not justified from the visible chart
🎯 TP3: Not justified
🛑 Invalidation: 1.048
If price loses 1.048, I’d step away from this setup because that’s the clearest recent low visible on the chart and would weaken the short-term structure.
I’m watching the reaction around MA60 closely. If buyers can defend it, the setup stays interesting; otherwise, I’d rather wait than force a trade.
For me, the key area is 1.051–1.052. I’d like to see price hold above the MA60 and continue defending that zone. A clean push through 1.053 would make the setup more interesting, but the chart doesn’t give enough nearby upside levels to justify multiple targets.
📍 Entry: 1.051–1.052
🎯 TP1: 1.053
🎯 TP2: Not justified from the visible chart
🎯 TP3: Not justified
🛑 Invalidation: 1.048
If price loses 1.048, I’d step away from this setup because that’s the clearest recent low visible on the chart and would weaken the short-term structure.
I’m watching the reaction around MA60 closely. If buyers can defend it, the setup stays interesting; otherwise, I’d rather wait than force a trade.
46
翻訳参照
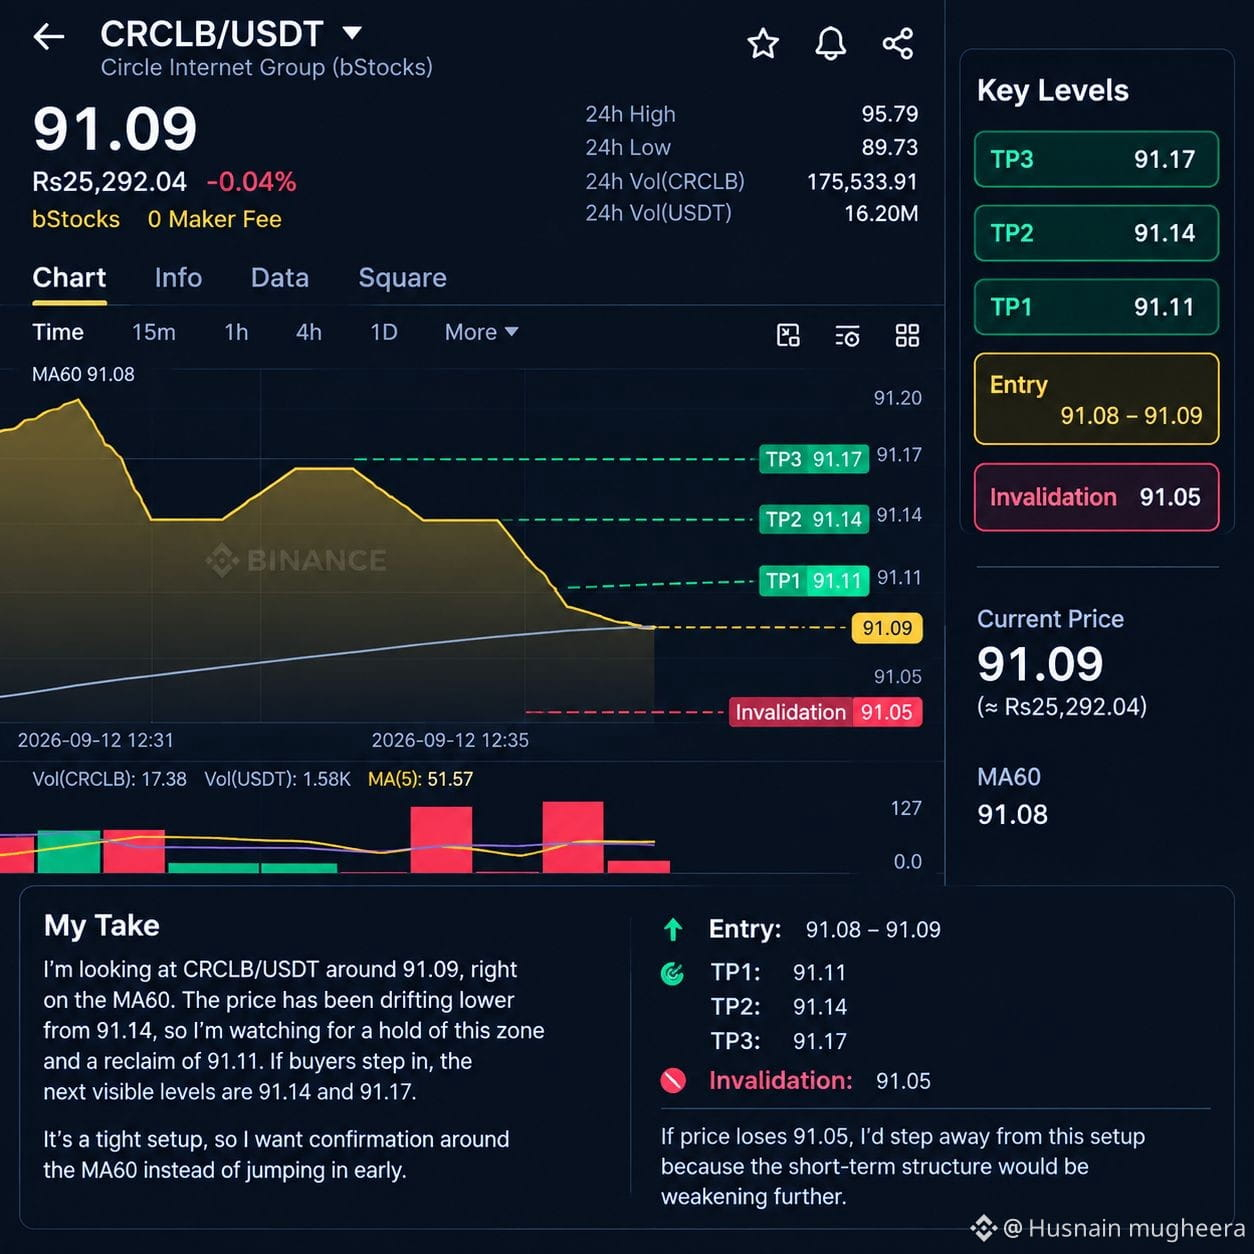
I’m looking at $CRCLB /USDT sitting around 91.09, right on the visible MA60 at 91.08. The short-term chart has been drifting lower from the 91.14 area, so I’d be careful rather than chase the move.
For me, the key area is 91.08–91.09. I’d like to see price hold this zone and reclaim 91.11 before considering the setup attractive. If buyers step in, the next visible levels are 91.14 and 91.17.
📍 Entry: 91.08–91.09
🎯 TP1: 91.11
🎯 TP2: 91.14
🎯 TP3: 91.17
🛑 Invalidation: 91.05
If price loses 91.05, I’d step away from this setup because the visible short-term structure would be weakening further.
The setup is still fairly tight and uncertain, so I’d want confirmation around the MA60 rather than entering blindly. 91.11 is the first level I’m watching for signs that buyers are actually returning.$CRCLB
{spot}(CRCLBUSDT)
I’m looking at $CRCLB /USDT sitting around 91.09, right on the visible MA60 at 91.08. The short-term chart has been drifting lower from the 91.14 area, so I’d be careful rather than chase the move.
For me, the key area is 91.08–91.09. I’d like to see price hold this zone and reclaim 91.11 before considering the setup attractive. If buyers step in, the next visible levels are 91.14 and 91.17.
📍 Entry: 91.08–91.09
🎯 TP1: 91.11
🎯 TP2: 91.14
🎯 TP3: 91.17
🛑 Invalidation: 91.05
If price loses 91.05, I’d step away from this setup because the visible short-term structure would be weakening further.
The setup is still fairly tight and uncertain, so I’d want confirmation around the MA60 rather than entering blindly. 91.11 is the first level I’m watching for signs that buyers are actually returning.$CRCLB
For me, the key area is 91.08–91.09. I’d like to see price hold this zone and reclaim 91.11 before considering the setup attractive. If buyers step in, the next visible levels are 91.14 and 91.17.
📍 Entry: 91.08–91.09
🎯 TP1: 91.11
🎯 TP2: 91.14
🎯 TP3: 91.17
🛑 Invalidation: 91.05
If price loses 91.05, I’d step away from this setup because the visible short-term structure would be weakening further.
The setup is still fairly tight and uncertain, so I’d want confirmation around the MA60 rather than entering blindly. 91.11 is the first level I’m watching for signs that buyers are actually returning.$CRCLB
57
ログインして、さらにコンテンツを読む
厳選トピックで世界の暗号資産トレーダーの仲間入り
⚡️ 暗号資産に関する最新かつ有益な情報が見つかります。
💬 世界最大の暗号資産取引所から信頼されています。
👍 認証を受けたクリエイターから、有益なインサイトを得られます。
メール / 電話番号
トレンドトピック
SECReceivesGrayscaleLitecoinTrustETFFiling
閲覧回数 28,904
617人が討論中
💎 投資家の関心がライトコインに集まる
グレイスケールのETF申請により、$LTCはより大きな話題の中心に入りました。現物取引を行う人にとって、このような出来事は、エントリーする前に強固な資産を見極めて学ぶべきだという注意喚起になります。
#secreceivesgrayscalelitecointrustetffiling
CryptoMahibaloch
·いいね:1件
·閲覧回数 1k
ClarityActFacesProceduralVoteSept15
閲覧回数 137,512
1,601人が討論中
US10YearTreasuryYieldNears5%
閲覧回数 46,837
847人が討論中