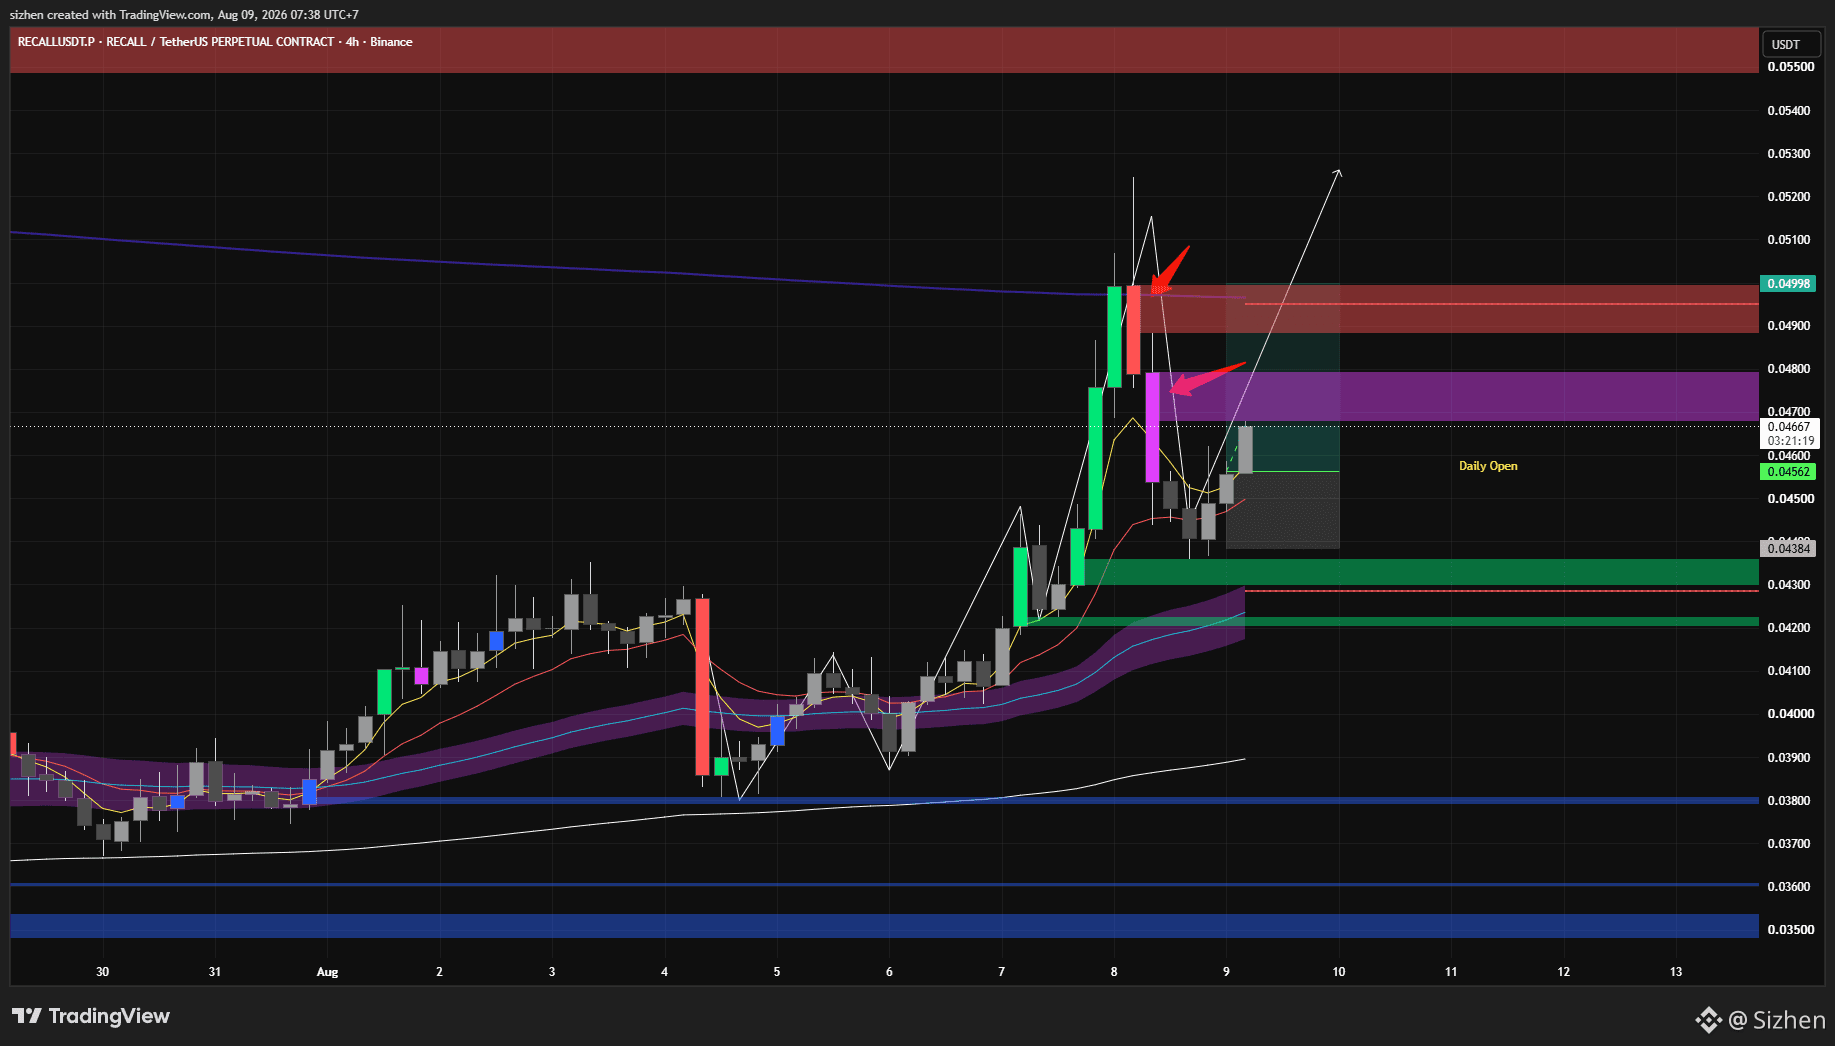
$RECALL is already in play and is approaching the violet vector candle area once the violet vector candle is reached, you can move your stop loss to the entry point or to 50% of your ROI
Sizhen
·
--
ブリッシュ
$RECALL is quite interesting; if the price manages to hold above the 50 EMA (the purple line), there is a chance it could rise to the daily open or higher
On the 4-hour timeframe I’ve shared, there is a vector that could serve as our upside target, let’s assume the price will rise to that area
For the entry, stop-loss and take-profit levels, please refer to the chart I’ve shared
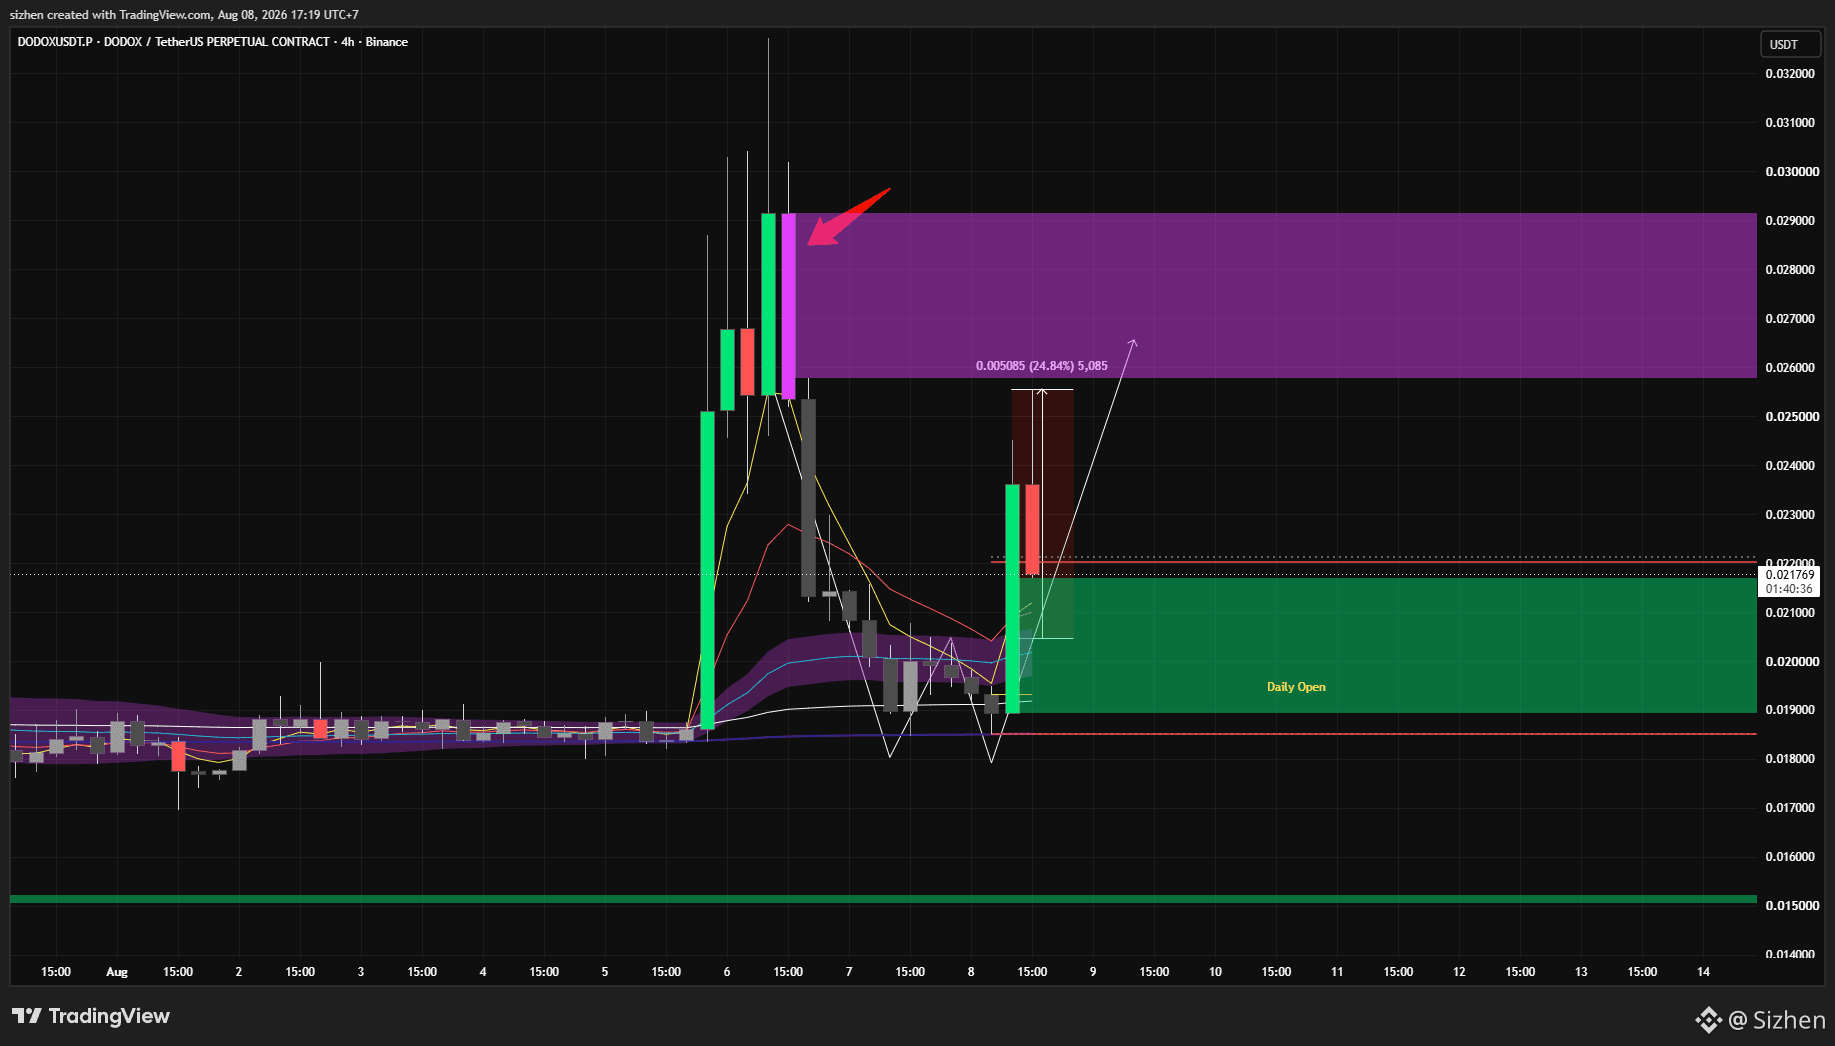
$DODOX I’ve been watching this for a while now, but it seems that whilst I was away for a moment, the price has risen. However, as long as the price doesn’t fall below the daily open, it’s worth keeping an eye on, and I’ve opened a long position even though it’s risen slightly our target is the violet vector above
I had closed my position on the $INX due to a rejection at the EMA, and it has now fully broken through the 50 EMA this breakout was signalled by a green vector candle, which provides sufficient confidence to reopen a long position on the $INX
Sizhen
·
--
ブリッシュ
$INX I’m still holding onto my long position if the price starts to break above the level I’ve marked, it could rise to the red vector candle that hasn’t yet been filled, and if it’s rejected by the 50 EMA, I’ll close the position
$AIO On the 1h timeframe, the price should be able to rise to the two target levels I’ve marked, so I’ve opened another long position – this is the third time I’ve opened one
And on the 4h timeframe, if the price breaks through the 50 EMA and bounces off the 50 EMA, we could see a full recovery upwards and a retrace of all the existing red vector candles
Sizhen
·
--
ブリッシュ
Based on the analysis I shared yesterday, $AIO has moved higher from here you could move your stoploss to the entry point or take partial profits and let the rest run
It looks as though $HEI needs a bit more time to bounce back up
Sizhen
·
--
ブリッシュ
$HEI This one is also interesting; as long as it remains above yesterday’s daily open – or the new one that’s due to appear, there’s a chance it will rise again
$BTC Update On the 1h timeframe, BTC still has an unfilled green vector, so the scenario for today’s Asian session is that BTC will fall to fill that green vector and, at the same time, test the New York low and the UK low
The aggregated spot order book depth difference chart shows a significant volume of selling, so we assume that the price will fall from here; then, when the price touches the green vector, some buyers will start to re-enter the market