

RISKK TAKER
645 投稿

RISKK TAKER
報告
ユーザーをブロック
RISK TAKER, Technical Analyst, Trader, My post NFA
取引を発注
低高頻度トレーダー
8.1か月
6 フォロー
34 フォロワー
890 いいね
投稿
ポートフォリオ
すべて
引用
動画
·
--
翻訳参照
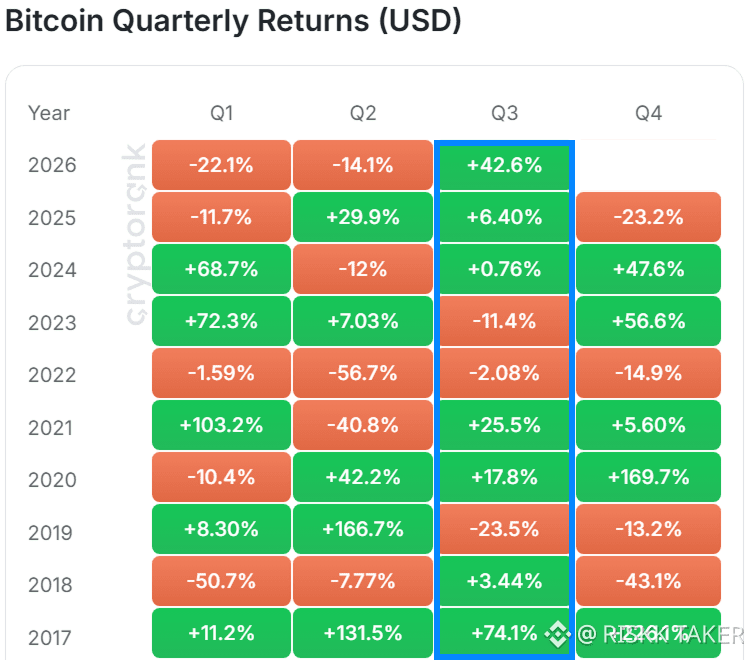
🟢 BITCOIN JUST HAD ITS BEST Q3 SINCE 2017
Bitcoin gained roughly 42.6% in Q3 2026, marking its strongest third quarter performance in nine years.
What makes the move more notable is how much ground BTC had to recover. Bitcoin recorded losses in both Q1 and Q2, putting significant pressure on the market before the third-quarter rebound changed the picture.
Q3 effectively became the quarter where Bitcoin regained momentum, with the rally helping erase a large portion of the weakness seen during the first half of the year.
Now the focus shifts to Q4.
After its strongest Q3 since 2017, can Bitcoin carry that momentum into the final quarter of 2026? #uptober
🟢 BITCOIN JUST HAD ITS BEST Q3 SINCE 2017
Bitcoin gained roughly 42.6% in Q3 2026, marking its strongest third quarter performance in nine years.
What makes the move more notable is how much ground BTC had to recover. Bitcoin recorded losses in both Q1 and Q2, putting significant pressure on the market before the third-quarter rebound changed the picture.
Q3 effectively became the quarter where Bitcoin regained momentum, with the rally helping erase a large portion of the weakness seen during the first half of the year.
Now the focus shifts to Q4.
After its strongest Q3 since 2017, can Bitcoin carry that momentum into the final quarter of 2026? #uptober
Bitcoin gained roughly 42.6% in Q3 2026, marking its strongest third quarter performance in nine years.
What makes the move more notable is how much ground BTC had to recover. Bitcoin recorded losses in both Q1 and Q2, putting significant pressure on the market before the third-quarter rebound changed the picture.
Q3 effectively became the quarter where Bitcoin regained momentum, with the rally helping erase a large portion of the weakness seen during the first half of the year.
Now the focus shifts to Q4.
After its strongest Q3 since 2017, can Bitcoin carry that momentum into the final quarter of 2026? #uptober
1
48
·
--
翻訳参照
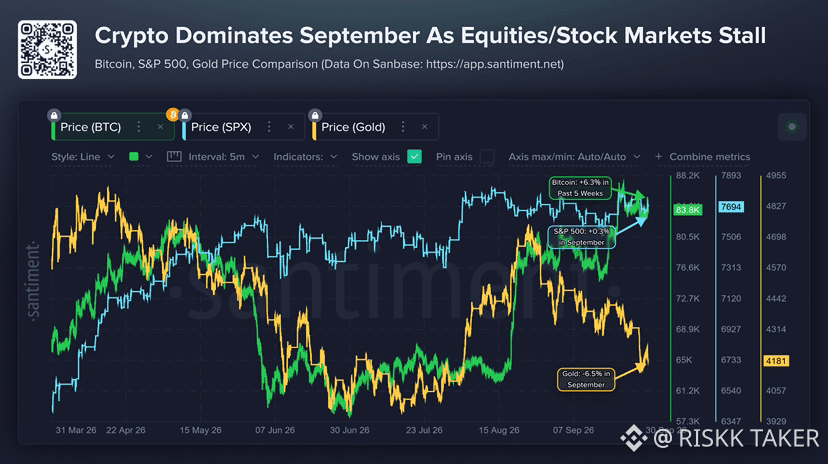
🔥 BITCOIN BEAT STOCKS AND GOLD IN SEPTEMBER
Bitcoin gained roughly 7% in September, while the S&P 500 was nearly flat and gold dropped more than 6%, according to Santiment data.
That’s an interesting shift after a period where Bitcoin was trading more like a risk asset alongside equities.
Gold’s 6%+ decline is particularly notable given how strong the metal had been earlier in the year. Meanwhile, BTC managed to finish the month higher despite elevated Treasury yields and continued macro uncertainty.
The numbers don’t prove Bitcoin has completely decoupled from traditional markets, but they do show that September belonged to BTC.
Bitcoin +7%. Stocks flat. Gold 6%. Q4 starts with crypto back in the spotlight. #uptober
🔥 BITCOIN BEAT STOCKS AND GOLD IN SEPTEMBER
Bitcoin gained roughly 7% in September, while the S&P 500 was nearly flat and gold dropped more than 6%, according to Santiment data.
That’s an interesting shift after a period where Bitcoin was trading more like a risk asset alongside equities.
Gold’s 6%+ decline is particularly notable given how strong the metal had been earlier in the year. Meanwhile, BTC managed to finish the month higher despite elevated Treasury yields and continued macro uncertainty.
The numbers don’t prove Bitcoin has completely decoupled from traditional markets, but they do show that September belonged to BTC.
Bitcoin +7%. Stocks flat. Gold 6%. Q4 starts with crypto back in the spotlight. #uptober
Bitcoin gained roughly 7% in September, while the S&P 500 was nearly flat and gold dropped more than 6%, according to Santiment data.
That’s an interesting shift after a period where Bitcoin was trading more like a risk asset alongside equities.
Gold’s 6%+ decline is particularly notable given how strong the metal had been earlier in the year. Meanwhile, BTC managed to finish the month higher despite elevated Treasury yields and continued macro uncertainty.
The numbers don’t prove Bitcoin has completely decoupled from traditional markets, but they do show that September belonged to BTC.
Bitcoin +7%. Stocks flat. Gold 6%. Q4 starts with crypto back in the spotlight. #uptober
1
61
·
--
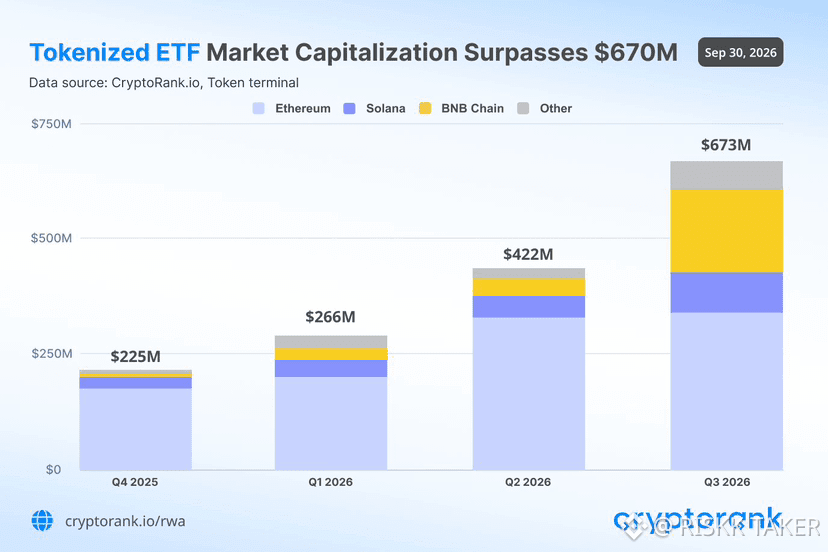
トークン化されたETF市場は第3四半期に時価総額6億7300万ドルに到達し、前四半期からおよそ59%の成長を記録しました。
BNBチェーンは最大のけん引役の一つで、第3四半期中にそのトークン化ETFの時価総額が4倍超に成長し、ほぼ1億6000万ドルに達しました。
ただし、市場は依然として非常に集中しています。上位3つのネットワークが、全体のトークン化ETF市場の約84%を占めています。
より多くのネットワークやプラットフォームがこの分野に参入すれば、その集中度は変わり得ますが、成長はオンチェーン上で従来型の投資商品をトークン化したものへの関心が高まっていることを示しています。
今日の6億7300万ドル。より大きな問いは、従来型の資産がオンチェーンへ移行し続ける中で、トークン化ETFがどこまで大きくなり得るかです。$BNB
{future}(BNBUSDT)
$QNT
{future}(QNTUSDT)
トークン化されたETF市場は第3四半期に時価総額6億7300万ドルに到達し、前四半期からおよそ59%の成長を記録しました。
BNBチェーンは最大のけん引役の一つで、第3四半期中にそのトークン化ETFの時価総額が4倍超に成長し、ほぼ1億6000万ドルに達しました。
ただし、市場は依然として非常に集中しています。上位3つのネットワークが、全体のトークン化ETF市場の約84%を占めています。
より多くのネットワークやプラットフォームがこの分野に参入すれば、その集中度は変わり得ますが、成長はオンチェーン上で従来型の投資商品をトークン化したものへの関心が高まっていることを示しています。
今日の6億7300万ドル。より大きな問いは、従来型の資産がオンチェーンへ移行し続ける中で、トークン化ETFがどこまで大きくなり得るかです。$BNB
$QNT
BNBチェーンは最大のけん引役の一つで、第3四半期中にそのトークン化ETFの時価総額が4倍超に成長し、ほぼ1億6000万ドルに達しました。
ただし、市場は依然として非常に集中しています。上位3つのネットワークが、全体のトークン化ETF市場の約84%を占めています。
より多くのネットワークやプラットフォームがこの分野に参入すれば、その集中度は変わり得ますが、成長はオンチェーン上で従来型の投資商品をトークン化したものへの関心が高まっていることを示しています。
今日の6億7300万ドル。より大きな問いは、従来型の資産がオンチェーンへ移行し続ける中で、トークン化ETFがどこまで大きくなり得るかです。$BNB
$QNT
1
58
·
--
🔥 ONDOのトークン化株式が新記録を更新
Ondo Financeのトークン化株式は、TVL(預託総額)で過去最高の12.6億ドルに到達し、伝統的な株式へのオンチェーン・エクスポージャー需要が引き続き拡大していることを示しています。
Ondo Stocksは今年の早い段階ですでにTVLで10億ドルを超えており、現在はEthereum、Solana、BNB Chainにわたって、260以上のトークン化された米国株式およびETFを提供しています。
このタイミングは注目に値します。トークン化が従来型の金融領域へさらに深く浸透し続けているからです。BlackRockは最近、トークン化されたモデルポートフォリオでOndoと提携しました。また、OndoはDTCCのFund/SERVインフラにも参加しています。
TVLの12.6億ドルは、トークン化株式がニッチな実験の域を越えつつあることを示しています。本当の問題は、ここからこの市場がどれほど大きくなり得るかです。 $ONDO
{future}(ONDOUSDT)
🔥 ONDOのトークン化株式が新記録を更新
Ondo Financeのトークン化株式は、TVL(預託総額)で過去最高の12.6億ドルに到達し、伝統的な株式へのオンチェーン・エクスポージャー需要が引き続き拡大していることを示しています。
Ondo Stocksは今年の早い段階ですでにTVLで10億ドルを超えており、現在はEthereum、Solana、BNB Chainにわたって、260以上のトークン化された米国株式およびETFを提供しています。
このタイミングは注目に値します。トークン化が従来型の金融領域へさらに深く浸透し続けているからです。BlackRockは最近、トークン化されたモデルポートフォリオでOndoと提携しました。また、OndoはDTCCのFund/SERVインフラにも参加しています。
TVLの12.6億ドルは、トークン化株式がニッチな実験の域を越えつつあることを示しています。本当の問題は、ここからこの市場がどれほど大きくなり得るかです。 $ONDO
Ondo Financeのトークン化株式は、TVL(預託総額)で過去最高の12.6億ドルに到達し、伝統的な株式へのオンチェーン・エクスポージャー需要が引き続き拡大していることを示しています。
Ondo Stocksは今年の早い段階ですでにTVLで10億ドルを超えており、現在はEthereum、Solana、BNB Chainにわたって、260以上のトークン化された米国株式およびETFを提供しています。
このタイミングは注目に値します。トークン化が従来型の金融領域へさらに深く浸透し続けているからです。BlackRockは最近、トークン化されたモデルポートフォリオでOndoと提携しました。また、OndoはDTCCのFund/SERVインフラにも参加しています。
TVLの12.6億ドルは、トークン化株式がニッチな実験の域を越えつつあることを示しています。本当の問題は、ここからこの市場がどれほど大きくなり得るかです。 $ONDO

1
269
·
--
翻訳参照
🔥 AVALANCHE JUST MADE BLOCK VERIFICATION 100X FASTER
Avalanche has upgraded its block verification system with Helicon, pushing verification speeds up to 100x faster than previous peak performance.
The upgrade targets one of the biggest challenges for high throughput blockchains, verifying blocks quickly without sacrificing the security of the network.
Faster verification means Avalanche can process and confirm network activity more efficiently, which becomes increasingly important as transaction demand and onchain applications scale.
This isn’t simply about a faster headline number. Improvements at the verification layer can directly affect how much activity a blockchain can handle while keeping confirmation times low.
Avalanche is pushing the infrastructure side of the network forward and Helicon could make a major difference as onchain activity scales.
$AVAX
{future}(AVAXUSDT)
$ONDO
{future}(ONDOUSDT)
🔥 AVALANCHE JUST MADE BLOCK VERIFICATION 100X FASTER
Avalanche has upgraded its block verification system with Helicon, pushing verification speeds up to 100x faster than previous peak performance.
The upgrade targets one of the biggest challenges for high throughput blockchains, verifying blocks quickly without sacrificing the security of the network.
Faster verification means Avalanche can process and confirm network activity more efficiently, which becomes increasingly important as transaction demand and onchain applications scale.
This isn’t simply about a faster headline number. Improvements at the verification layer can directly affect how much activity a blockchain can handle while keeping confirmation times low.
Avalanche is pushing the infrastructure side of the network forward and Helicon could make a major difference as onchain activity scales.
$AVAX
$ONDO
Avalanche has upgraded its block verification system with Helicon, pushing verification speeds up to 100x faster than previous peak performance.
The upgrade targets one of the biggest challenges for high throughput blockchains, verifying blocks quickly without sacrificing the security of the network.
Faster verification means Avalanche can process and confirm network activity more efficiently, which becomes increasingly important as transaction demand and onchain applications scale.
This isn’t simply about a faster headline number. Improvements at the verification layer can directly affect how much activity a blockchain can handle while keeping confirmation times low.
Avalanche is pushing the infrastructure side of the network forward and Helicon could make a major difference as onchain activity scales.
$AVAX
$ONDO

1
88
·
--
翻訳参照
Bitwise’s NEAR ETF ($NRR) is officially trading today on NYSE Arca, giving U.S. investors direct spot exposure to NEAR through a traditional exchange traded product.
What makes this launch more interesting is the staking component. Bitwise plans to stake the fund’s NEAR holdings in house, with staking rewards accruing to shareholders through the fund’s NAV. The ETF carries a 0.75% management fee.
This adds NEAR to the growing list of crypto assets gaining access to U.S. ETF infrastructure beyond Bitcoin and Ethereum.
Spot exposure + staking in one product. Now the market gets to see how much demand U.S. investors have for NEAR.
$NEAR
{future}(NEARUSDT)
$AVAX
Bitwise’s NEAR ETF ($NRR) is officially trading today on NYSE Arca, giving U.S. investors direct spot exposure to NEAR through a traditional exchange traded product.
What makes this launch more interesting is the staking component. Bitwise plans to stake the fund’s NEAR holdings in house, with staking rewards accruing to shareholders through the fund’s NAV. The ETF carries a 0.75% management fee.
This adds NEAR to the growing list of crypto assets gaining access to U.S. ETF infrastructure beyond Bitcoin and Ethereum.
Spot exposure + staking in one product. Now the market gets to see how much demand U.S. investors have for NEAR.
$NEAR
$AVAX
What makes this launch more interesting is the staking component. Bitwise plans to stake the fund’s NEAR holdings in house, with staking rewards accruing to shareholders through the fund’s NAV. The ETF carries a 0.75% management fee.
This adds NEAR to the growing list of crypto assets gaining access to U.S. ETF infrastructure beyond Bitcoin and Ethereum.
Spot exposure + staking in one product. Now the market gets to see how much demand U.S. investors have for NEAR.
$NEAR
$AVAX

1
60
·
--
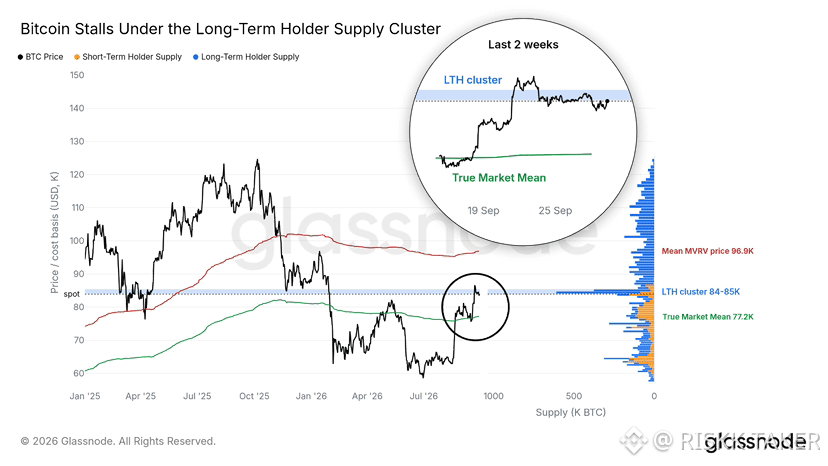
BTCは$84K〜$85Kの付近で停滞しており、そこには長期保有者の供給が最も集中しています。これは、現在のチャート上で最も重い供給クラスターです。
そのため、このゾーンは極めて重要です。ビットコインはこれを突破し、上に定着する必要があります。そうすれば、上昇(ラリー)がさらなる勢いを得られます。
現時点では、買い手は同じ水準付近に以前から蓄積されたBTCの“壁”に直面しています。
$84K〜$85Kが戦場です。これを抜けて定着できるか、それとも上値抵抗の下にラリーが閉じ込められたままになるかにかかっています。
BTCは$84K〜$85Kの付近で停滞しており、そこには長期保有者の供給が最も集中しています。これは、現在のチャート上で最も重い供給クラスターです。
そのため、このゾーンは極めて重要です。ビットコインはこれを突破し、上に定着する必要があります。そうすれば、上昇(ラリー)がさらなる勢いを得られます。
現時点では、買い手は同じ水準付近に以前から蓄積されたBTCの“壁”に直面しています。
$84K〜$85Kが戦場です。これを抜けて定着できるか、それとも上値抵抗の下にラリーが閉じ込められたままになるかにかかっています。
そのため、このゾーンは極めて重要です。ビットコインはこれを突破し、上に定着する必要があります。そうすれば、上昇(ラリー)がさらなる勢いを得られます。
現時点では、買い手は同じ水準付近に以前から蓄積されたBTCの“壁”に直面しています。
$84K〜$85Kが戦場です。これを抜けて定着できるか、それとも上値抵抗の下にラリーが閉じ込められたままになるかにかかっています。
1
42
·
--
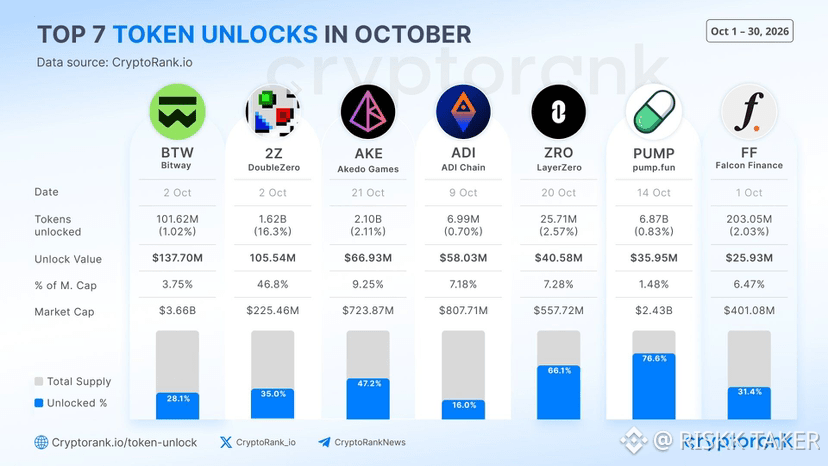
10月に予定されている上位7つのトークン解禁は、概算で約4億7066万ドル相当で、$BTWが1億3770万ドルでトップです。
他の主な解禁には、$2Z(1億0550万ドル)、$AKE(6690万ドル)、$ADI(5800万ドル)が含まれます。
数字が重要なのは、新しく解禁されたトークンが流通供給を押し上げ、受領者が利益確定に動く場合は追加の売り圧力につながる可能性があるためです。
しかし、解禁=自動的な投げ売りとは限りません。実際の影響は、誰がトークンを受け取るのか、どれだけが市場に流入するのか、そして需要が新たな供給を吸収できるかどうかに左右されます。
10月に予定されている上位7つのトークン解禁は、概算で約4億7066万ドル相当で、$BTWが1億3770万ドルでトップです。
他の主な解禁には、$2Z(1億0550万ドル)、$AKE(6690万ドル)、$ADI(5800万ドル)が含まれます。
数字が重要なのは、新しく解禁されたトークンが流通供給を押し上げ、受領者が利益確定に動く場合は追加の売り圧力につながる可能性があるためです。
しかし、解禁=自動的な投げ売りとは限りません。実際の影響は、誰がトークンを受け取るのか、どれだけが市場に流入するのか、そして需要が新たな供給を吸収できるかどうかに左右されます。
他の主な解禁には、$2Z(1億0550万ドル)、$AKE(6690万ドル)、$ADI(5800万ドル)が含まれます。
数字が重要なのは、新しく解禁されたトークンが流通供給を押し上げ、受領者が利益確定に動く場合は追加の売り圧力につながる可能性があるためです。
しかし、解禁=自動的な投げ売りとは限りません。実際の影響は、誰がトークンを受け取るのか、どれだけが市場に流入するのか、そして需要が新たな供給を吸収できるかどうかに左右されます。
1
67
·
--
🔥 戦略がさらに1,666 BTCを追加
戦略は1,666 BTCを購入したと報じられており、その結果、保有するビットコインの総量は847,666 BTCになった。
この動きは、ビットコインが引き続き80Kドル台半ばで取引される中で行われた。戦略は再び、市場の弱さを利用して、すでに非常に大きいBTCポジションを増やしている。
847,666 BTC時点で、戦略はビットコインの最大供給量である2100万のうち約4%をコントロールしており、最大の法人ビットコイン保有者としての地位を強固にしている。
同社の積み増し戦略は、暗号資産における最も注目されているコーポレート・ベットの一つであり続けている。
🔥 戦略がさらに1,666 BTCを追加
戦略は1,666 BTCを購入したと報じられており、その結果、保有するビットコインの総量は847,666 BTCになった。
この動きは、ビットコインが引き続き80Kドル台半ばで取引される中で行われた。戦略は再び、市場の弱さを利用して、すでに非常に大きいBTCポジションを増やしている。
847,666 BTC時点で、戦略はビットコインの最大供給量である2100万のうち約4%をコントロールしており、最大の法人ビットコイン保有者としての地位を強固にしている。
同社の積み増し戦略は、暗号資産における最も注目されているコーポレート・ベットの一つであり続けている。
戦略は1,666 BTCを購入したと報じられており、その結果、保有するビットコインの総量は847,666 BTCになった。
この動きは、ビットコインが引き続き80Kドル台半ばで取引される中で行われた。戦略は再び、市場の弱さを利用して、すでに非常に大きいBTCポジションを増やしている。
847,666 BTC時点で、戦略はビットコインの最大供給量である2100万のうち約4%をコントロールしており、最大の法人ビットコイン保有者としての地位を強固にしている。
同社の積み増し戦略は、暗号資産における最も注目されているコーポレート・ベットの一つであり続けている。

1
34
·
--
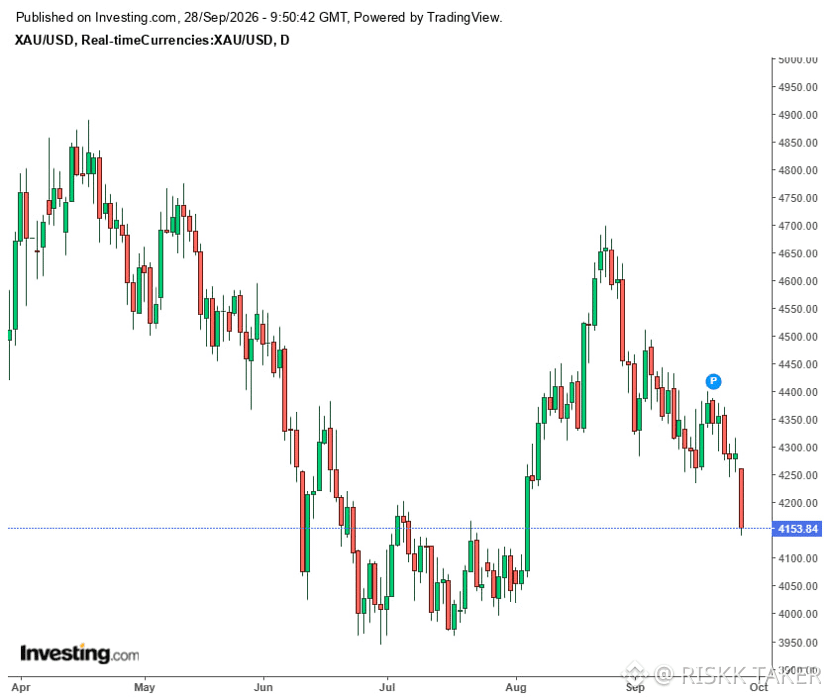
金価格は4,150ドルを下回り、前回の終値からおよそ3.2%下落しました。これはここ数カ月で最も急な日次下落の一つです。
この売りが広がった背景には、原油価格の上昇とインフレ懸念の強まりがあり、FOMCが追加の利上げを行うとの期待が強まっていることが挙げられます。その結果、債券利回りが上昇し、利息を生まない金は相対的に魅力が薄れています。
今年の前半には記録的な高値近辺で取引されていた金にとって、これは注目すべき反転です。
$XAUT
{future}(XAUTUSDT)
金価格は4,150ドルを下回り、前回の終値からおよそ3.2%下落しました。これはここ数カ月で最も急な日次下落の一つです。
この売りが広がった背景には、原油価格の上昇とインフレ懸念の強まりがあり、FOMCが追加の利上げを行うとの期待が強まっていることが挙げられます。その結果、債券利回りが上昇し、利息を生まない金は相対的に魅力が薄れています。
今年の前半には記録的な高値近辺で取引されていた金にとって、これは注目すべき反転です。
$XAUT
この売りが広がった背景には、原油価格の上昇とインフレ懸念の強まりがあり、FOMCが追加の利上げを行うとの期待が強まっていることが挙げられます。その結果、債券利回りが上昇し、利息を生まない金は相対的に魅力が薄れています。
今年の前半には記録的な高値近辺で取引されていた金にとって、これは注目すべき反転です。
$XAUT

1
46
·
--
🔥 アルトコインが激動の1週間を迎えた
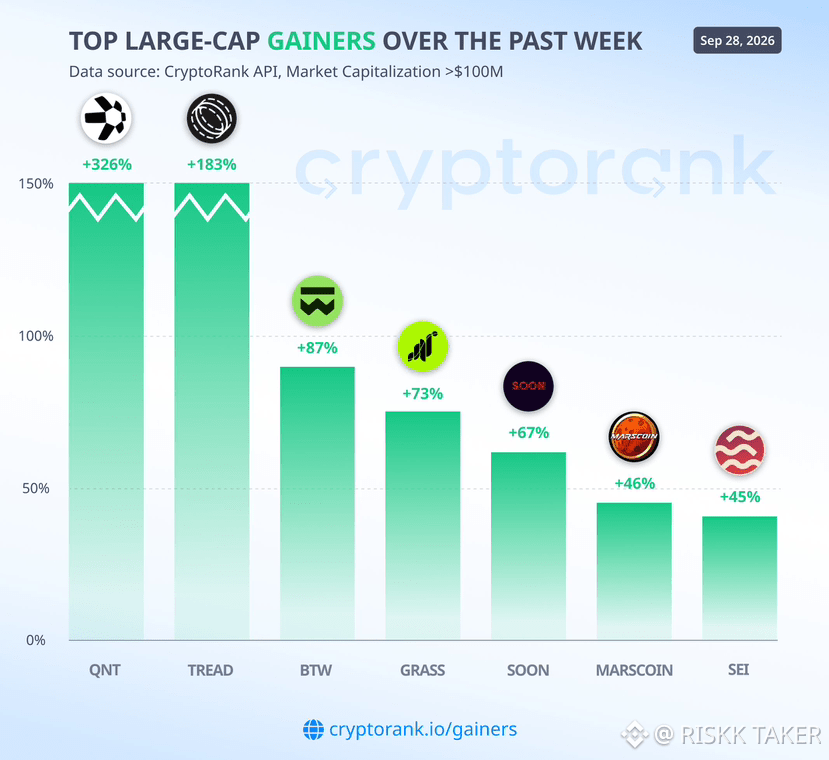
暗号資産全体でのリスクオンが追い風となり、いくつかの大型銘柄が週次で大幅な上昇を記録。先頭を切ったのは $QNT で、+326% でした。
続いて $TREAD が +183% 、$BTW が 87% 、$GRASS が 73% 、$SOON が 67% 、$MARSCOIN が 46% 、そして $SEI が 45% と上昇しました。
注目すべきは、この動きの幅です。これは単にビットコインが市場を押し上げただけではなく、投機的な資金が攻めの姿勢でベータの高いアルトコインへと積極的にローテーションし、数日で3桁の上昇率を記録する銘柄もありました。
現在の市場データでも、QNT は大型株の中で最も強いパフォーマーの1つであることが示されていますが、正確な週次のパーセンテージはスナップショットや取引所によって変わり得ます。
これほど大きな値動きは深刻なFOMO(取り残され不安)を呼び込みますが、一方でこれらの銘柄は急激な利益確定の影響を受けやすくなります。
リスク志向は明らかに再び戻ってきました。では、このアルトコインの勢いはどれくらいの期間持続できるのでしょうか。
🔥 アルトコインが激動の1週間を迎えた
暗号資産全体でのリスクオンが追い風となり、いくつかの大型銘柄が週次で大幅な上昇を記録。先頭を切ったのは $QNT で、+326% でした。
続いて $TREAD が +183% 、$BTW が 87% 、$GRASS が 73% 、$SOON が 67% 、$MARSCOIN が 46% 、そして $SEI が 45% と上昇しました。
注目すべきは、この動きの幅です。これは単にビットコインが市場を押し上げただけではなく、投機的な資金が攻めの姿勢でベータの高いアルトコインへと積極的にローテーションし、数日で3桁の上昇率を記録する銘柄もありました。
現在の市場データでも、QNT は大型株の中で最も強いパフォーマーの1つであることが示されていますが、正確な週次のパーセンテージはスナップショットや取引所によって変わり得ます。
これほど大きな値動きは深刻なFOMO(取り残され不安)を呼び込みますが、一方でこれらの銘柄は急激な利益確定の影響を受けやすくなります。
リスク志向は明らかに再び戻ってきました。では、このアルトコインの勢いはどれくらいの期間持続できるのでしょうか。
暗号資産全体でのリスクオンが追い風となり、いくつかの大型銘柄が週次で大幅な上昇を記録。先頭を切ったのは $QNT で、+326% でした。
続いて $TREAD が +183% 、$BTW が 87% 、$GRASS が 73% 、$SOON が 67% 、$MARSCOIN が 46% 、そして $SEI が 45% と上昇しました。
注目すべきは、この動きの幅です。これは単にビットコインが市場を押し上げただけではなく、投機的な資金が攻めの姿勢でベータの高いアルトコインへと積極的にローテーションし、数日で3桁の上昇率を記録する銘柄もありました。
現在の市場データでも、QNT は大型株の中で最も強いパフォーマーの1つであることが示されていますが、正確な週次のパーセンテージはスナップショットや取引所によって変わり得ます。
これほど大きな値動きは深刻なFOMO(取り残され不安)を呼び込みますが、一方でこれらの銘柄は急激な利益確定の影響を受けやすくなります。
リスク志向は明らかに再び戻ってきました。では、このアルトコインの勢いはどれくらいの期間持続できるのでしょうか。
1
64
·
--
先週、BTC、ETH、SOL、XRPのスポットETFはすべて純流入を記録し、数十億ドル規模の新規資金が市場に流入しました。
BTC: $2.39B
ETH: $689.88M
SOL: $188.22M
XRP: $75.59M
これは、9月21日〜25日の1週間で合計約$3.34Bの流入に相当します。ビットコインがけん引し、2025年10月以来で最も強い週間純流入を記録しました。一方、イーサリアムは先週の$140Mの流出を反転させました。
注目すべきは、買いがビットコインに限定されていないことです。ETH、SOL、XRPも同時にプラスのフローを集めており、規制された投資商品を通じたより広範な需要が示唆されています。
たった1週間で、4つの暗号資産ETFカテゴリーに$3.34Bが流入。これは深刻な流動性シグナルです。
先週、BTC、ETH、SOL、XRPのスポットETFはすべて純流入を記録し、数十億ドル規模の新規資金が市場に流入しました。
BTC: $2.39B
ETH: $689.88M
SOL: $188.22M
XRP: $75.59M
これは、9月21日〜25日の1週間で合計約$3.34Bの流入に相当します。ビットコインがけん引し、2025年10月以来で最も強い週間純流入を記録しました。一方、イーサリアムは先週の$140Mの流出を反転させました。
注目すべきは、買いがビットコインに限定されていないことです。ETH、SOL、XRPも同時にプラスのフローを集めており、規制された投資商品を通じたより広範な需要が示唆されています。
たった1週間で、4つの暗号資産ETFカテゴリーに$3.34Bが流入。これは深刻な流動性シグナルです。
BTC: $2.39B
ETH: $689.88M
SOL: $188.22M
XRP: $75.59M
これは、9月21日〜25日の1週間で合計約$3.34Bの流入に相当します。ビットコインがけん引し、2025年10月以来で最も強い週間純流入を記録しました。一方、イーサリアムは先週の$140Mの流出を反転させました。
注目すべきは、買いがビットコインに限定されていないことです。ETH、SOL、XRPも同時にプラスのフローを集めており、規制された投資商品を通じたより広範な需要が示唆されています。
たった1週間で、4つの暗号資産ETFカテゴリーに$3.34Bが流入。これは深刻な流動性シグナルです。
83
·
--
🔥 アルトコインが絶好調
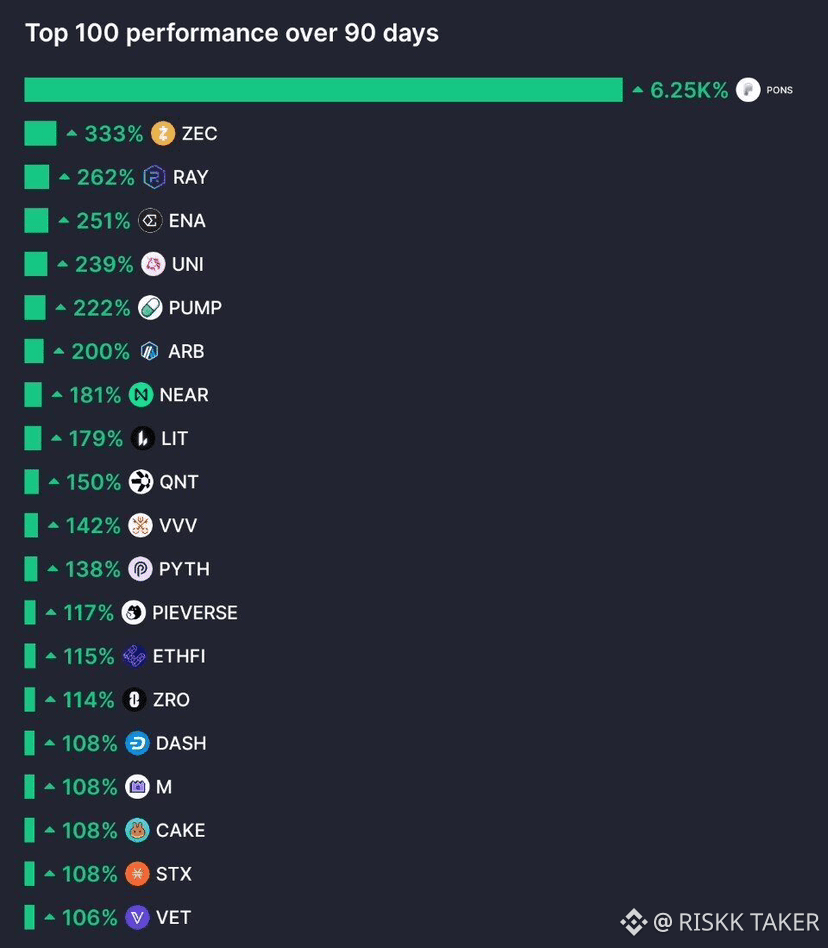
上位100のアルトコインのうち、過去90日でマイナス(赤字)なのはわずか9つ。一方で、少なくとも100%上昇したものは22あります。
これは、強さがほんの一部の大型銘柄に限られているわけではない、かなり明確なサインです。アルトコイン市場の幅広い領域が、ここ3か月で好調を示しています。
さらに、現在のマーケット・ローテーションにも見通しを与えてくれます。CryptoRankの「アルトコイン・シーズン・インデックス」は上位100のアルトを用い、90日間でBTCを少なくとも75%上回っている場合をアルトシーズンとみなします。
赤は9、100%超は22。
本当の問題は、この広がりが今後も続くのか、それとも最も強いアルトの値動きが、そろそろ過熱し始めているのかです。
🔥 アルトコインが絶好調
上位100のアルトコインのうち、過去90日でマイナス(赤字)なのはわずか9つ。一方で、少なくとも100%上昇したものは22あります。
これは、強さがほんの一部の大型銘柄に限られているわけではない、かなり明確なサインです。アルトコイン市場の幅広い領域が、ここ3か月で好調を示しています。
さらに、現在のマーケット・ローテーションにも見通しを与えてくれます。CryptoRankの「アルトコイン・シーズン・インデックス」は上位100のアルトを用い、90日間でBTCを少なくとも75%上回っている場合をアルトシーズンとみなします。
赤は9、100%超は22。
本当の問題は、この広がりが今後も続くのか、それとも最も強いアルトの値動きが、そろそろ過熱し始めているのかです。
上位100のアルトコインのうち、過去90日でマイナス(赤字)なのはわずか9つ。一方で、少なくとも100%上昇したものは22あります。
これは、強さがほんの一部の大型銘柄に限られているわけではない、かなり明確なサインです。アルトコイン市場の幅広い領域が、ここ3か月で好調を示しています。
さらに、現在のマーケット・ローテーションにも見通しを与えてくれます。CryptoRankの「アルトコイン・シーズン・インデックス」は上位100のアルトを用い、90日間でBTCを少なくとも75%上回っている場合をアルトシーズンとみなします。
赤は9、100%超は22。
本当の問題は、この広がりが今後も続くのか、それとも最も強いアルトの値動きが、そろそろ過熱し始めているのかです。
2
4
·
--
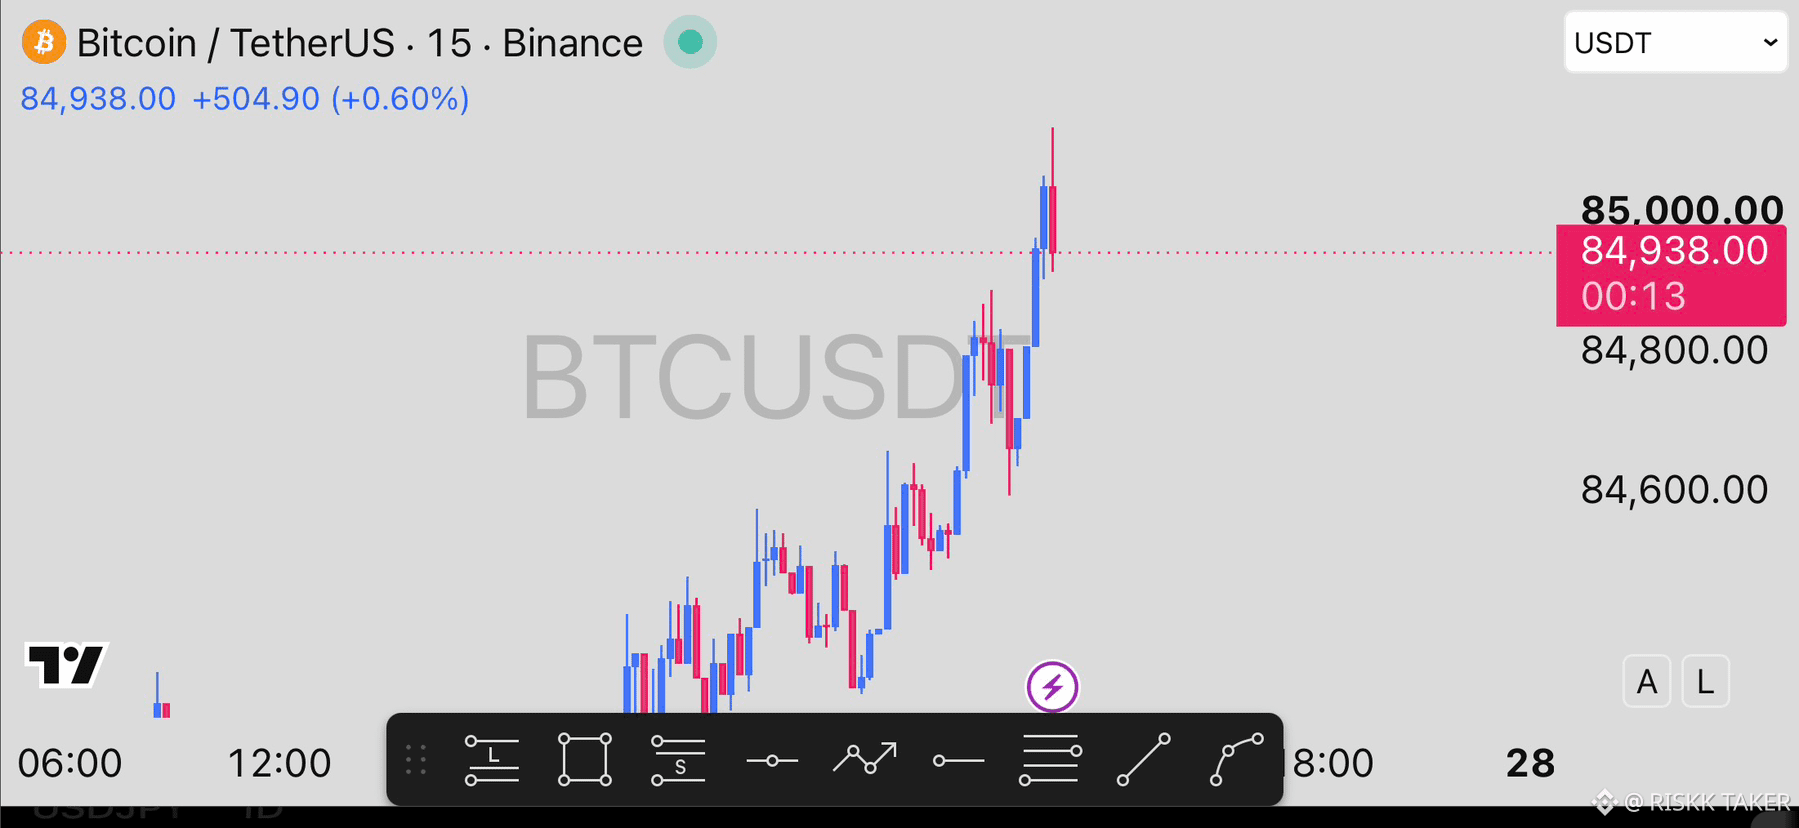
今日BTCが$78,300を上抜けて終値をつければ、50週移動平均(50週MA)を上回る週足の連続2回目の終値となります。
これは重要です。50週MAは、これまでビットコインのベア相場の間において主要な天井として機能してきたためです。Galaxy Researchは、それを上回る状態が持続することを「サイクルの底が近い可能性を示す強いシグナル」として説明しています。
しかし、指標は1つだけではベア相場が終わったことを確定しません。ポイントは、ブレイクアウト後にBTCが移動平均の上を維持し続けられるかどうかです。
2回目の週足終値は、重大なテクニカルシグナルになるでしょう。$ZEC
{future}(ZECUSDT)
$GRAM
{future}(GRAMUSDT)
今日BTCが$78,300を上抜けて終値をつければ、50週移動平均(50週MA)を上回る週足の連続2回目の終値となります。
これは重要です。50週MAは、これまでビットコインのベア相場の間において主要な天井として機能してきたためです。Galaxy Researchは、それを上回る状態が持続することを「サイクルの底が近い可能性を示す強いシグナル」として説明しています。
しかし、指標は1つだけではベア相場が終わったことを確定しません。ポイントは、ブレイクアウト後にBTCが移動平均の上を維持し続けられるかどうかです。
2回目の週足終値は、重大なテクニカルシグナルになるでしょう。$ZEC
$GRAM
これは重要です。50週MAは、これまでビットコインのベア相場の間において主要な天井として機能してきたためです。Galaxy Researchは、それを上回る状態が持続することを「サイクルの底が近い可能性を示す強いシグナル」として説明しています。
しかし、指標は1つだけではベア相場が終わったことを確定しません。ポイントは、ブレイクアウト後にBTCが移動平均の上を維持し続けられるかどうかです。
2回目の週足終値は、重大なテクニカルシグナルになるでしょう。$ZEC
$GRAM
1
26
·
--
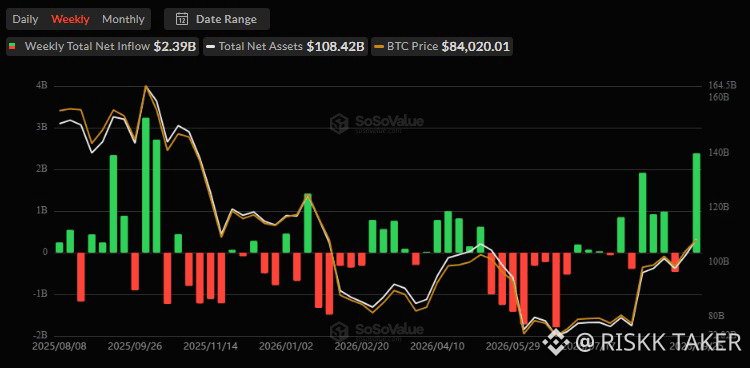
米国のスポット型ビットコインETFは先週、純流入が23.9億ドルに達し、2025年10月以来の最も強い週次パフォーマンスとなりました。
5営業日すべてでプラスのフローが記録され、月曜日だけで約10億ドルがファンドに流入しました。
さらに興味深いのは、より大きな全体像です。今回の流入により、ビットコインETFは2026年のプラス圏に戻りました。今年の初めにはおよそ58億ドルのマイナス圏に位置していました。
機関投資家の需要が、明らかに再び高まっています。
$HYPE
{future}(HYPEUSDT)
$NEAR
{future}(NEARUSDT)
米国のスポット型ビットコインETFは先週、純流入が23.9億ドルに達し、2025年10月以来の最も強い週次パフォーマンスとなりました。
5営業日すべてでプラスのフローが記録され、月曜日だけで約10億ドルがファンドに流入しました。
さらに興味深いのは、より大きな全体像です。今回の流入により、ビットコインETFは2026年のプラス圏に戻りました。今年の初めにはおよそ58億ドルのマイナス圏に位置していました。
機関投資家の需要が、明らかに再び高まっています。
$HYPE
$NEAR
5営業日すべてでプラスのフローが記録され、月曜日だけで約10億ドルがファンドに流入しました。
さらに興味深いのは、より大きな全体像です。今回の流入により、ビットコインETFは2026年のプラス圏に戻りました。今年の初めにはおよそ58億ドルのマイナス圏に位置していました。
機関投資家の需要が、明らかに再び高まっています。
$HYPE
$NEAR
1
31
·
--
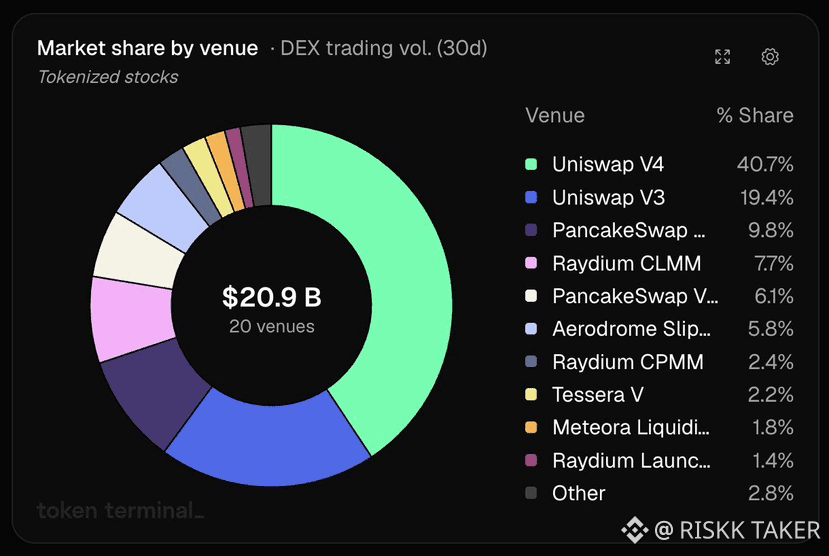
過去30日間にDEX上でトークン化株式が$20.9Bの出来高を生み出し、そしてUniswapがそのうち約$12.6Bを占めました。
つまりUniswapは市場全体の約60%を獲得しており、V4だけで40.7%、V3がさらに19.4%追加しています。
この数値は、トークン化株式がニッチなRWA(現実世界資産)という物語から、実際に活発取引されるオンチェーン市場へ、いかに速いスピードで移行しているかを示しています。Uniswapはすでに、Apple、Tesla、NVIDIAのトークン化証券を、その製品群に統合しています。
$20.9B取引。 $12.6BがUniswap経由。
トークン化株式は実際のDEX出来高になりつつあり、Uniswapは現在それを大きく占めています。
$UNI
{future}(UNIUSDT)
$AVAX
{future}(AVAXUSDT)
過去30日間にDEX上でトークン化株式が$20.9Bの出来高を生み出し、そしてUniswapがそのうち約$12.6Bを占めました。
つまりUniswapは市場全体の約60%を獲得しており、V4だけで40.7%、V3がさらに19.4%追加しています。
この数値は、トークン化株式がニッチなRWA(現実世界資産)という物語から、実際に活発取引されるオンチェーン市場へ、いかに速いスピードで移行しているかを示しています。Uniswapはすでに、Apple、Tesla、NVIDIAのトークン化証券を、その製品群に統合しています。
$20.9B取引。 $12.6BがUniswap経由。
トークン化株式は実際のDEX出来高になりつつあり、Uniswapは現在それを大きく占めています。
$UNI
$AVAX
つまりUniswapは市場全体の約60%を獲得しており、V4だけで40.7%、V3がさらに19.4%追加しています。
この数値は、トークン化株式がニッチなRWA(現実世界資産)という物語から、実際に活発取引されるオンチェーン市場へ、いかに速いスピードで移行しているかを示しています。Uniswapはすでに、Apple、Tesla、NVIDIAのトークン化証券を、その製品群に統合しています。
$20.9B取引。 $12.6BがUniswap経由。
トークン化株式は実際のDEX出来高になりつつあり、Uniswapは現在それを大きく占めています。
$UNI
$AVAX
1
186
·
--
バイナンスはUSDCの発行元であるサークルに1億ドルの出資を行い、同社プラットフォーム全体でステーブルコインの採用を拡大するための新たな5年間の合意を締結しました。
この取引のもとで、バイナンスはUSDCをグローバルなユーザー基盤に促進し、一方でサークルはステーブルコインの保有と利用を支えるインフラを提供します。
より大きなポイントは流通規模です。バイナンスは、暗号資産の中でも最大級の取引エコシステムの1つへのアクセスをUSDCに提供し、特に新興市場において、取引、決済、国境を越えた送金における同社の役割を強化する可能性があります。
また、主要な取引所と、最大級のステーブルコイン発行体との間で、より緊密な戦略的関係が生まれることになります。
バイナンスはもはやUSDCを上場するだけではありません。USDCの背後にいる企業に投資し、その到達範囲を拡大するために5年間コミットしています。
$USDC
{future}(USDCUSDT)
$BNB
{future}(BNBUSDT)
バイナンスはUSDCの発行元であるサークルに1億ドルの出資を行い、同社プラットフォーム全体でステーブルコインの採用を拡大するための新たな5年間の合意を締結しました。
この取引のもとで、バイナンスはUSDCをグローバルなユーザー基盤に促進し、一方でサークルはステーブルコインの保有と利用を支えるインフラを提供します。
より大きなポイントは流通規模です。バイナンスは、暗号資産の中でも最大級の取引エコシステムの1つへのアクセスをUSDCに提供し、特に新興市場において、取引、決済、国境を越えた送金における同社の役割を強化する可能性があります。
また、主要な取引所と、最大級のステーブルコイン発行体との間で、より緊密な戦略的関係が生まれることになります。
バイナンスはもはやUSDCを上場するだけではありません。USDCの背後にいる企業に投資し、その到達範囲を拡大するために5年間コミットしています。
$USDC
$BNB
この取引のもとで、バイナンスはUSDCをグローバルなユーザー基盤に促進し、一方でサークルはステーブルコインの保有と利用を支えるインフラを提供します。
より大きなポイントは流通規模です。バイナンスは、暗号資産の中でも最大級の取引エコシステムの1つへのアクセスをUSDCに提供し、特に新興市場において、取引、決済、国境を越えた送金における同社の役割を強化する可能性があります。
また、主要な取引所と、最大級のステーブルコイン発行体との間で、より緊密な戦略的関係が生まれることになります。
バイナンスはもはやUSDCを上場するだけではありません。USDCの背後にいる企業に投資し、その到達範囲を拡大するために5年間コミットしています。
$USDC
$BNB
1
58
·
--
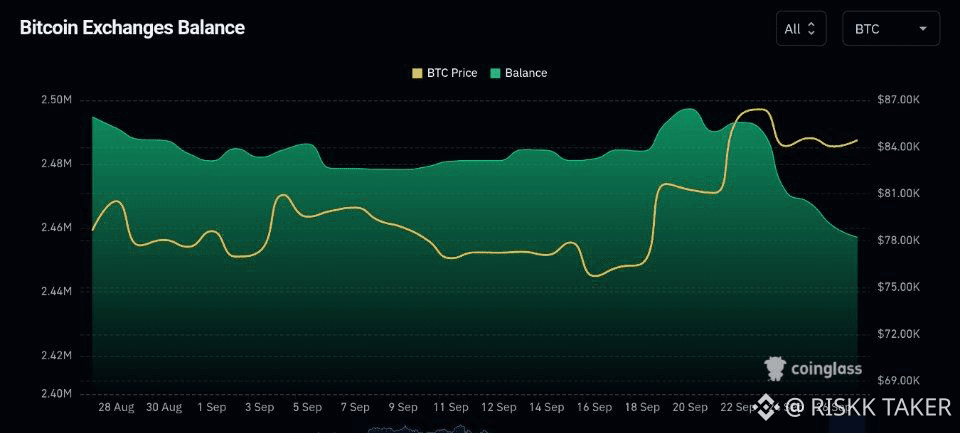
過去7日間で、中央集計所(取引所)から約30,000 BTCが流出したと報じられており、現行価格でおよそ25億ドル相当です。
これは取引所の残高における注目すべき変化です。大量のBTCが引き出されると、特にそれらのコインが長期保管(コールドストレージ等)に移されている場合、取引にすぐ利用できる供給が直ちに減る可能性があります。
しかし、取引所からの流出だけでは価格が上昇することは保証されません。コインはさまざまな理由で移動され得ます。真のシグナルは、引き出しが需要や蓄積(アキュムレーション)と並行して継続するかどうかにあります。
1週間で取引所から25億ドル相当のBTCが流出しました。注目に値するフローです。
$NEAR
{future}(NEARUSDT)
$GLMR
{spot}(GLMRUSDT)
過去7日間で、中央集計所(取引所)から約30,000 BTCが流出したと報じられており、現行価格でおよそ25億ドル相当です。
これは取引所の残高における注目すべき変化です。大量のBTCが引き出されると、特にそれらのコインが長期保管(コールドストレージ等)に移されている場合、取引にすぐ利用できる供給が直ちに減る可能性があります。
しかし、取引所からの流出だけでは価格が上昇することは保証されません。コインはさまざまな理由で移動され得ます。真のシグナルは、引き出しが需要や蓄積(アキュムレーション)と並行して継続するかどうかにあります。
1週間で取引所から25億ドル相当のBTCが流出しました。注目に値するフローです。
$NEAR
$GLMR
これは取引所の残高における注目すべき変化です。大量のBTCが引き出されると、特にそれらのコインが長期保管(コールドストレージ等)に移されている場合、取引にすぐ利用できる供給が直ちに減る可能性があります。
しかし、取引所からの流出だけでは価格が上昇することは保証されません。コインはさまざまな理由で移動され得ます。真のシグナルは、引き出しが需要や蓄積(アキュムレーション)と並行して継続するかどうかにあります。
1週間で取引所から25億ドル相当のBTCが流出しました。注目に値するフローです。
$NEAR
$GLMR
1
66
·
--
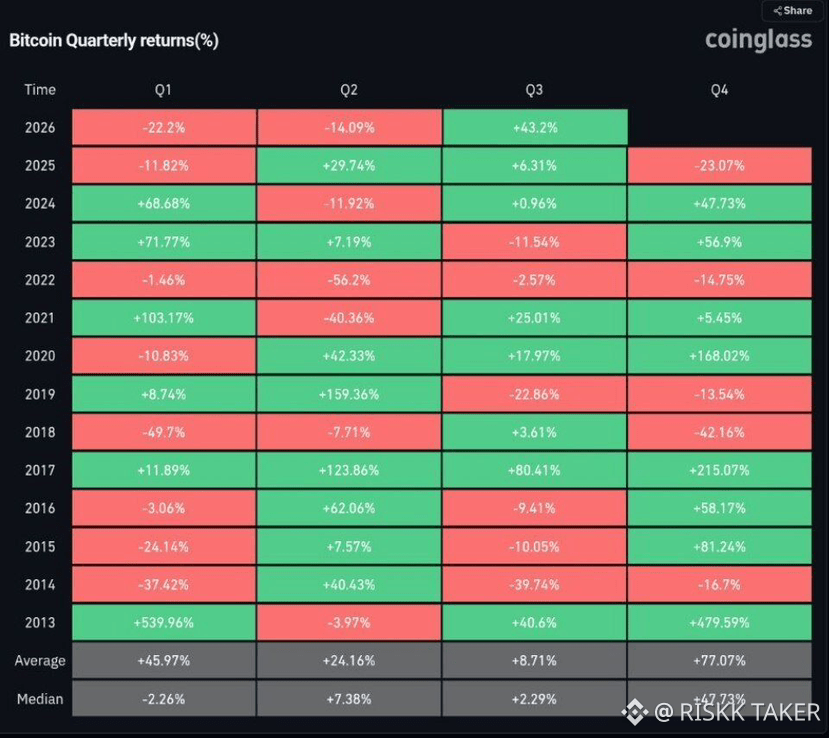
ビットコインは第3四半期に約50%上昇し、四半期初めの約57.8Kドルから今週は86Kドル超まで上がりました。
これは、2026年の第3四半期が、過去記録でも最も強い四半期の1つになることを意味します。唯一、第3四半期の2017年が、約80%のより大きな上昇を記録しました。
この上昇は特に、ビットコインが3四半期連続で下落を経験した後に起きた点で注目に値します。
壊滅的だった前半から、BTC史上でも屈指の強い四半期へ。
ビットコインは第3四半期に約50%上昇し、四半期初めの約57.8Kドルから今週は86Kドル超まで上がりました。
これは、2026年の第3四半期が、過去記録でも最も強い四半期の1つになることを意味します。唯一、第3四半期の2017年が、約80%のより大きな上昇を記録しました。
この上昇は特に、ビットコインが3四半期連続で下落を経験した後に起きた点で注目に値します。
壊滅的だった前半から、BTC史上でも屈指の強い四半期へ。
これは、2026年の第3四半期が、過去記録でも最も強い四半期の1つになることを意味します。唯一、第3四半期の2017年が、約80%のより大きな上昇を記録しました。
この上昇は特に、ビットコインが3四半期連続で下落を経験した後に起きた点で注目に値します。
壊滅的だった前半から、BTC史上でも屈指の強い四半期へ。
1
54
·
--
🔥 暗号資産におけるETF需要は依然強い
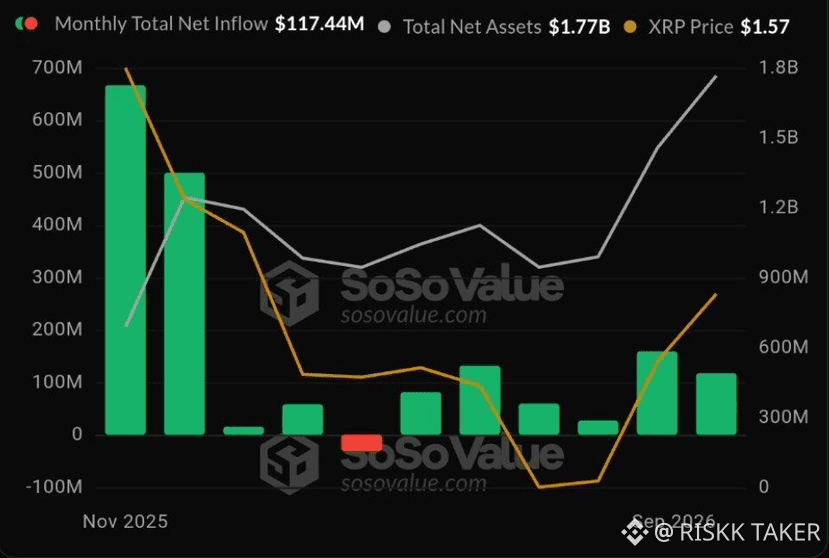
最新のフローデータによると、ビットコイン、イーサリアム、ソラナ、XRPのETFは、少なくとも3か月連続で月次の純流入を記録しています。
しかし、XRPはさらに目立ちます。
XRPのETFはこれで6か月連続で月次フローがプラスを維持しており、従来型の投資商品を通じたXRPへのエクスポージャー需要が驚くほど安定していることを示しています。
とはいえ、毎月の強さが同じというわけではありませんが、その一貫性は注目に値します。BTCとETHのETFフローが弱まった局面でも、XRPファンドは資金を引き付け続けました。
主要暗号資産4つ。月次純流入は3か月超。XRPは6.
機関投資家の需要は、もはやビットコインだけに限られて広がりつつあるのは明らかです。
$HYPE
{future}(HYPEUSDT)
$AERO
{future}(AEROUSDT)
🔥 暗号資産におけるETF需要は依然強い
最新のフローデータによると、ビットコイン、イーサリアム、ソラナ、XRPのETFは、少なくとも3か月連続で月次の純流入を記録しています。
しかし、XRPはさらに目立ちます。
XRPのETFはこれで6か月連続で月次フローがプラスを維持しており、従来型の投資商品を通じたXRPへのエクスポージャー需要が驚くほど安定していることを示しています。
とはいえ、毎月の強さが同じというわけではありませんが、その一貫性は注目に値します。BTCとETHのETFフローが弱まった局面でも、XRPファンドは資金を引き付け続けました。
主要暗号資産4つ。月次純流入は3か月超。XRPは6.
機関投資家の需要は、もはやビットコインだけに限られて広がりつつあるのは明らかです。
$HYPE
$AERO
最新のフローデータによると、ビットコイン、イーサリアム、ソラナ、XRPのETFは、少なくとも3か月連続で月次の純流入を記録しています。
しかし、XRPはさらに目立ちます。
XRPのETFはこれで6か月連続で月次フローがプラスを維持しており、従来型の投資商品を通じたXRPへのエクスポージャー需要が驚くほど安定していることを示しています。
とはいえ、毎月の強さが同じというわけではありませんが、その一貫性は注目に値します。BTCとETHのETFフローが弱まった局面でも、XRPファンドは資金を引き付け続けました。
主要暗号資産4つ。月次純流入は3か月超。XRPは6.
機関投資家の需要は、もはやビットコインだけに限られて広がりつつあるのは明らかです。
$HYPE
$AERO
1
54
ログインして、さらにコンテンツを読む
厳選トピックで世界の暗号資産トレーダーの仲間入り
⚡️ 暗号資産に関する最新かつ有益な情報が見つかります。
💬 世界最大の暗号資産取引所から信頼されています。
👍 認証を受けたクリエイターから、有益なインサイトを得られます。
メール / 電話番号
トレンドトピック
EtherGains70.9%InQ3
閲覧回数 2,533
157人が討論中
#EtherGains70.9%InQ3
🚀 2026年Q3にイーサリアムが70.9%上昇
💎 ETHは7月から9月にかけて約70.9%急騰し、イーサリアム史上でも最強クラスの四半期の反発の一つを記録しました。
📈 今回の上昇は、スポットのイーサETF需要の再燃、スポット市場の取引活発化、そしてより広範な「クリプトのリスクオン」ムーブと同時期に起きました。
💰 現在のETH: 約$2,697.43
📊 24H: +0.56%
⚠️ 短期の状況はすぐに変わり得るため、四半期の好成績が今後の勢いの継続を保証するものではありません。
👀 このQ3の勢いをQ4へ持ち越せるでしょうか?
#Ethereum #ETH #CryptoMarket #CryptoNews
CrypVexa
·いいね:1件
·閲覧回数 15
US10YearYieldNears5.3%
閲覧回数 35,545
380人が討論中
DollarIndexHitsHighestSinceMay2025
閲覧回数 1,267
90人が討論中