

Royal Queen9
4.7k 投稿

Royal Queen9
報告
ユーザーをブロック
LETS BE FRIENDS AND TRADE TOGETHER.
484 フォロー
463 フォロワー
239 いいね
投稿
·
--
#earningsseason $XAUT $XAU
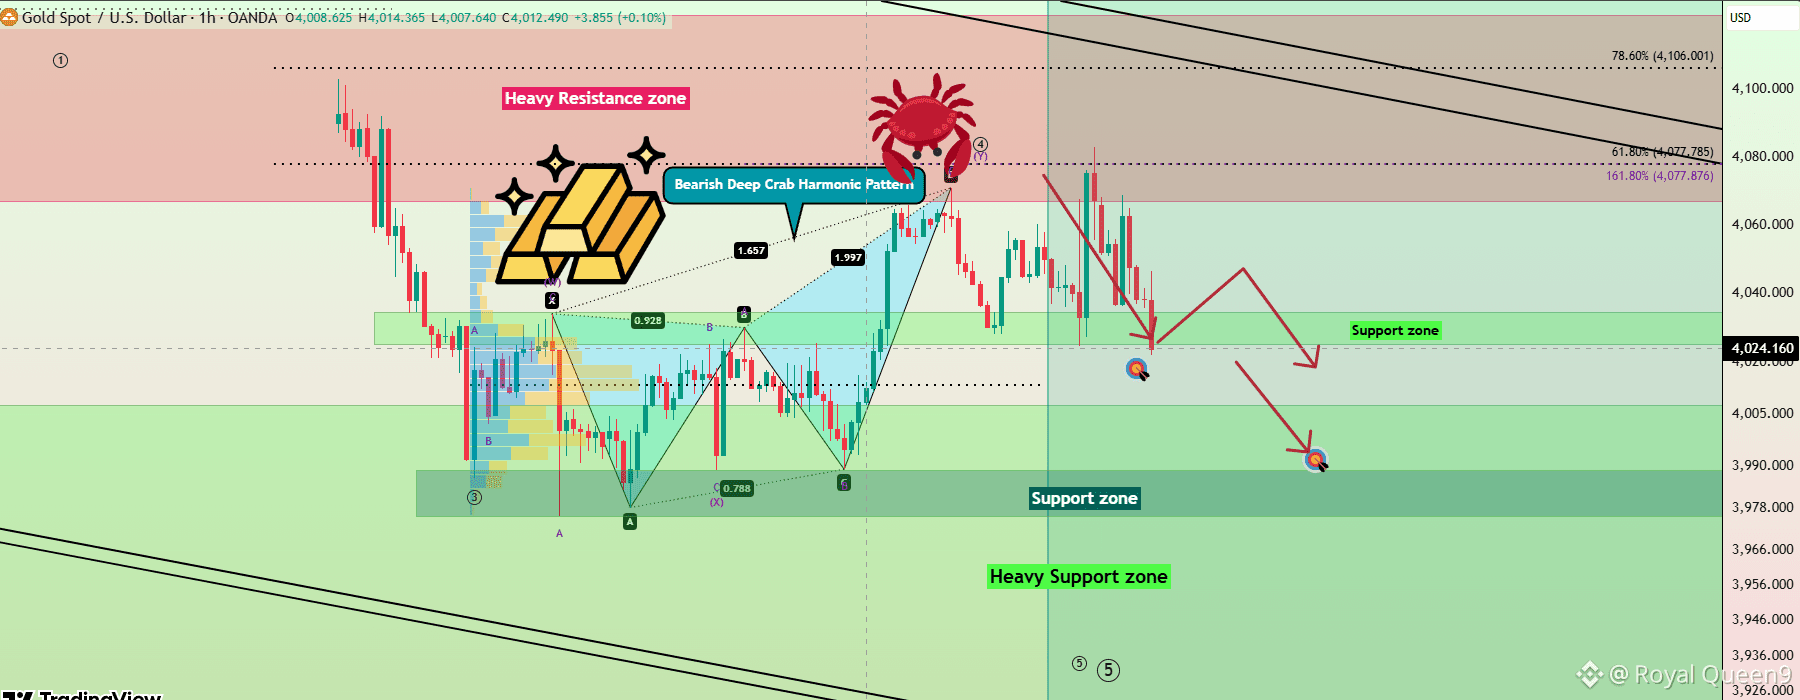
強いレジスタンス
$4,068–$4,080
直近のスイング高値で反落したゾーン。この水準を継続的に上抜ければ、弱気シナリオは弱まるでしょう。
ハーモニック・レジスタンス
$4,077.8–$4,078.0
表示されている61.8%と161.8%のフィボナッチ水準がこの付近に集中しています。上側の反転エリアと重なっています。
第1サポート
$4,024–$4,032
チャート上に示された目先のサポートゾーン。価格はこのエリアに近づいています。
第2サポート
$3,978–$3,990
下側に示された需要ゾーンで、$4,024を割り込んだ場合に次に意識される下値エリアです。
下値の拡張エリア
$3,956–$3,966
両方のサポートゾーンを明確に下抜けた場合、さらに下落した際の目標候補です。
{future}(XAUTUSDT)
{spot}(XAUTUSDT)
#earningsseason $XAUT $XAU
強いレジスタンス
$4,068–$4,080
直近のスイング高値で反落したゾーン。この水準を継続的に上抜ければ、弱気シナリオは弱まるでしょう。
ハーモニック・レジスタンス
$4,077.8–$4,078.0
表示されている61.8%と161.8%のフィボナッチ水準がこの付近に集中しています。上側の反転エリアと重なっています。
第1サポート
$4,024–$4,032
チャート上に示された目先のサポートゾーン。価格はこのエリアに近づいています。
第2サポート
$3,978–$3,990
下側に示された需要ゾーンで、$4,024を割り込んだ場合に次に意識される下値エリアです。
下値の拡張エリア
$3,956–$3,966
両方のサポートゾーンを明確に下抜けた場合、さらに下落した際の目標候補です。
173
·
--
翻訳参照
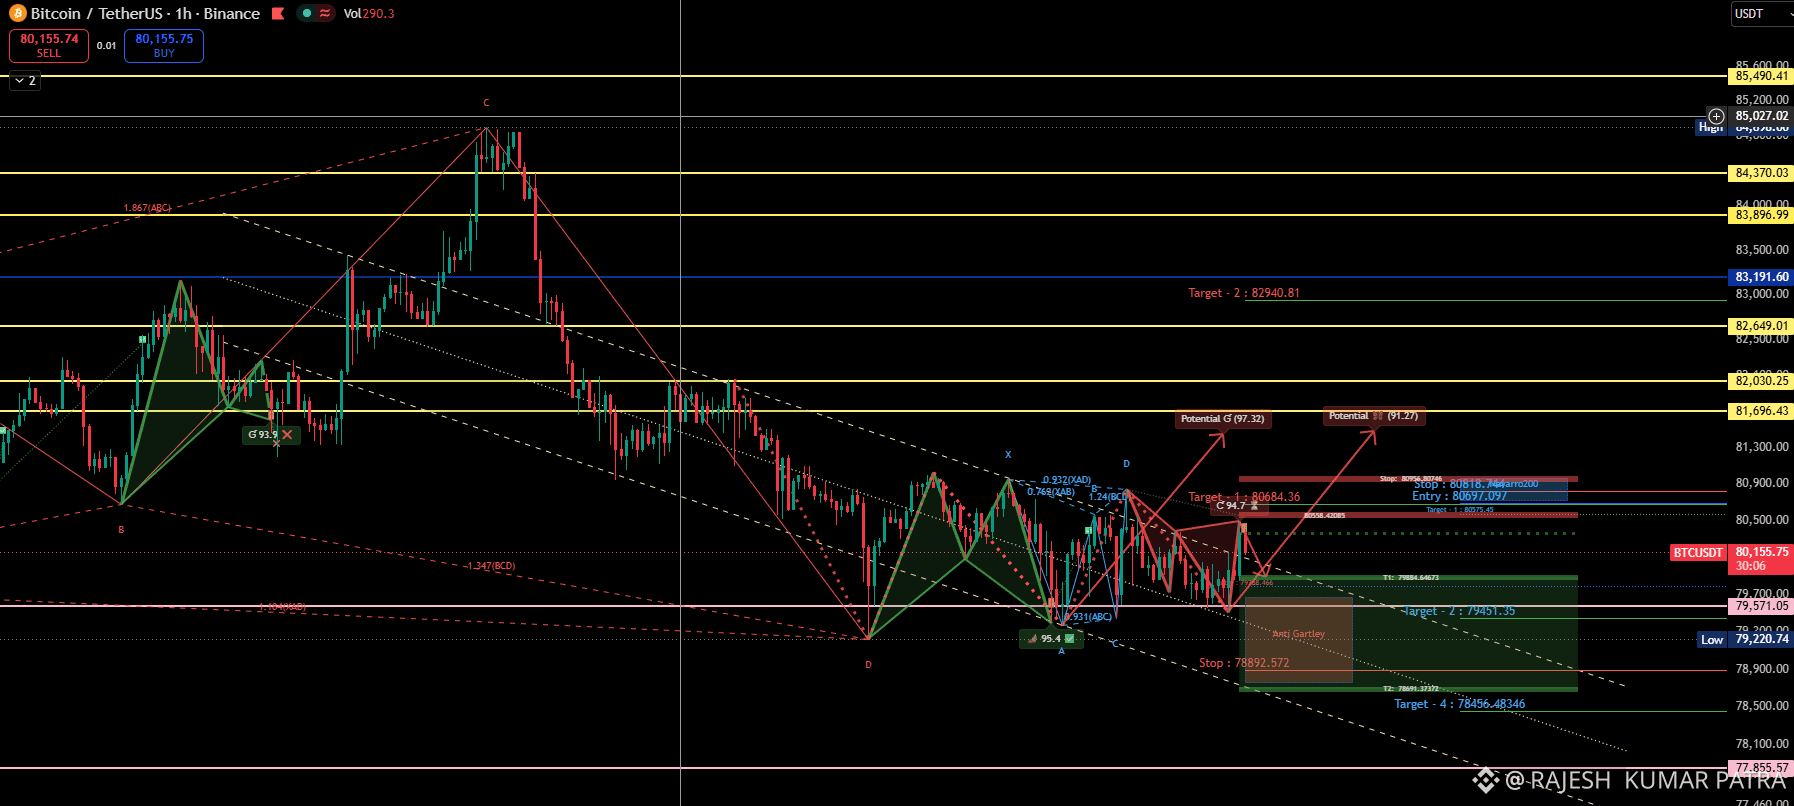
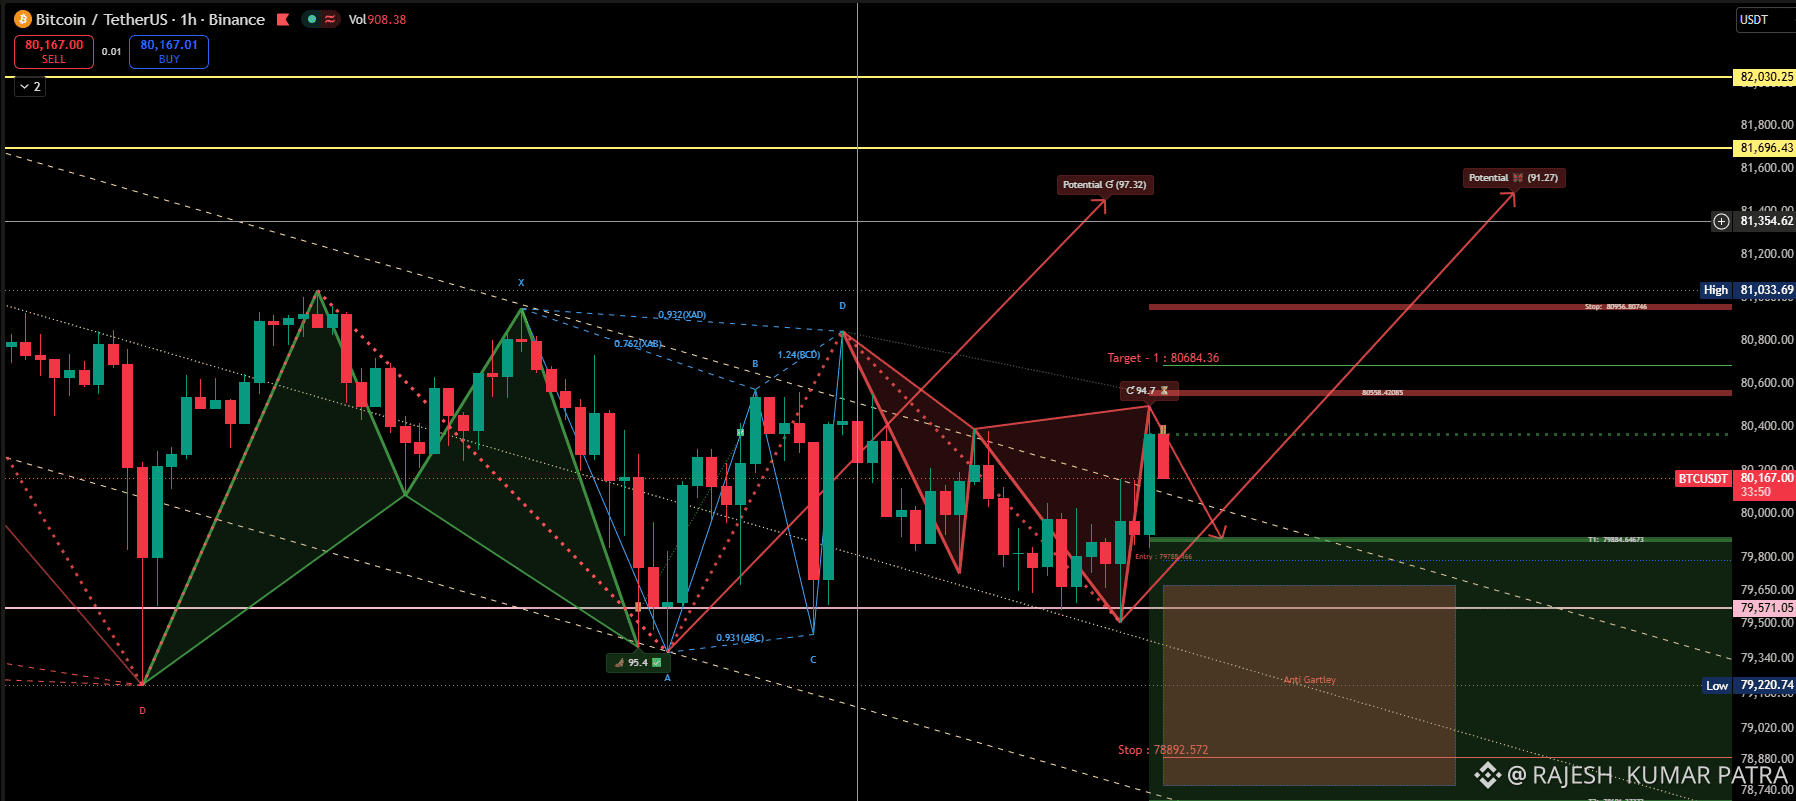
$BTC TC/USDT is trading around 80,167 USDT on the 1-hour Binance chart
$BTC Scenario 1: Bearish pullback
Confirmation: Price loses 79,850–79,900 and fails to reclaim it.
Potential levels: 79,571, followed by 79,220.
Extension: Around 78,893 if selling accelerates.
Invalidation: A sustained reclaim of the breakdown zone, especially with strong buying volume.
Scenario 2: Bullish continuation
Confirmation: A 1H close above 80,550–80,685, ideally followed by a successful retest.
Potential levels: 81,033, then 81,355.
Further resistance: 81,696.
Invalidation: A failed breakout followed by a move back below the reclaimed zone.
My conclusion
At roughly 80,167, I would wait for confirmation rather than chase a trade.
Below 79,850: bearish momentum could increase.
Above 80,600–80,685: the bullish recovery becomes more credible.
Between these zones: price may remain choppy, so risk/reward could be less attractive.
{future}(BTCUSDT)
{spot}(BTCUSDT)
$BTC TC/USDT is trading around 80,167 USDT on the 1-hour Binance chart
$BTC Scenario 1: Bearish pullback
Confirmation: Price loses 79,850–79,900 and fails to reclaim it.
Potential levels: 79,571, followed by 79,220.
Extension: Around 78,893 if selling accelerates.
Invalidation: A sustained reclaim of the breakdown zone, especially with strong buying volume.
Scenario 2: Bullish continuation
Confirmation: A 1H close above 80,550–80,685, ideally followed by a successful retest.
Potential levels: 81,033, then 81,355.
Further resistance: 81,696.
Invalidation: A failed breakout followed by a move back below the reclaimed zone.
My conclusion
At roughly 80,167, I would wait for confirmation rather than chase a trade.
Below 79,850: bearish momentum could increase.
Above 80,600–80,685: the bullish recovery becomes more credible.
Between these zones: price may remain choppy, so risk/reward could be less attractive.
62
·
--
翻訳参照
$BTC
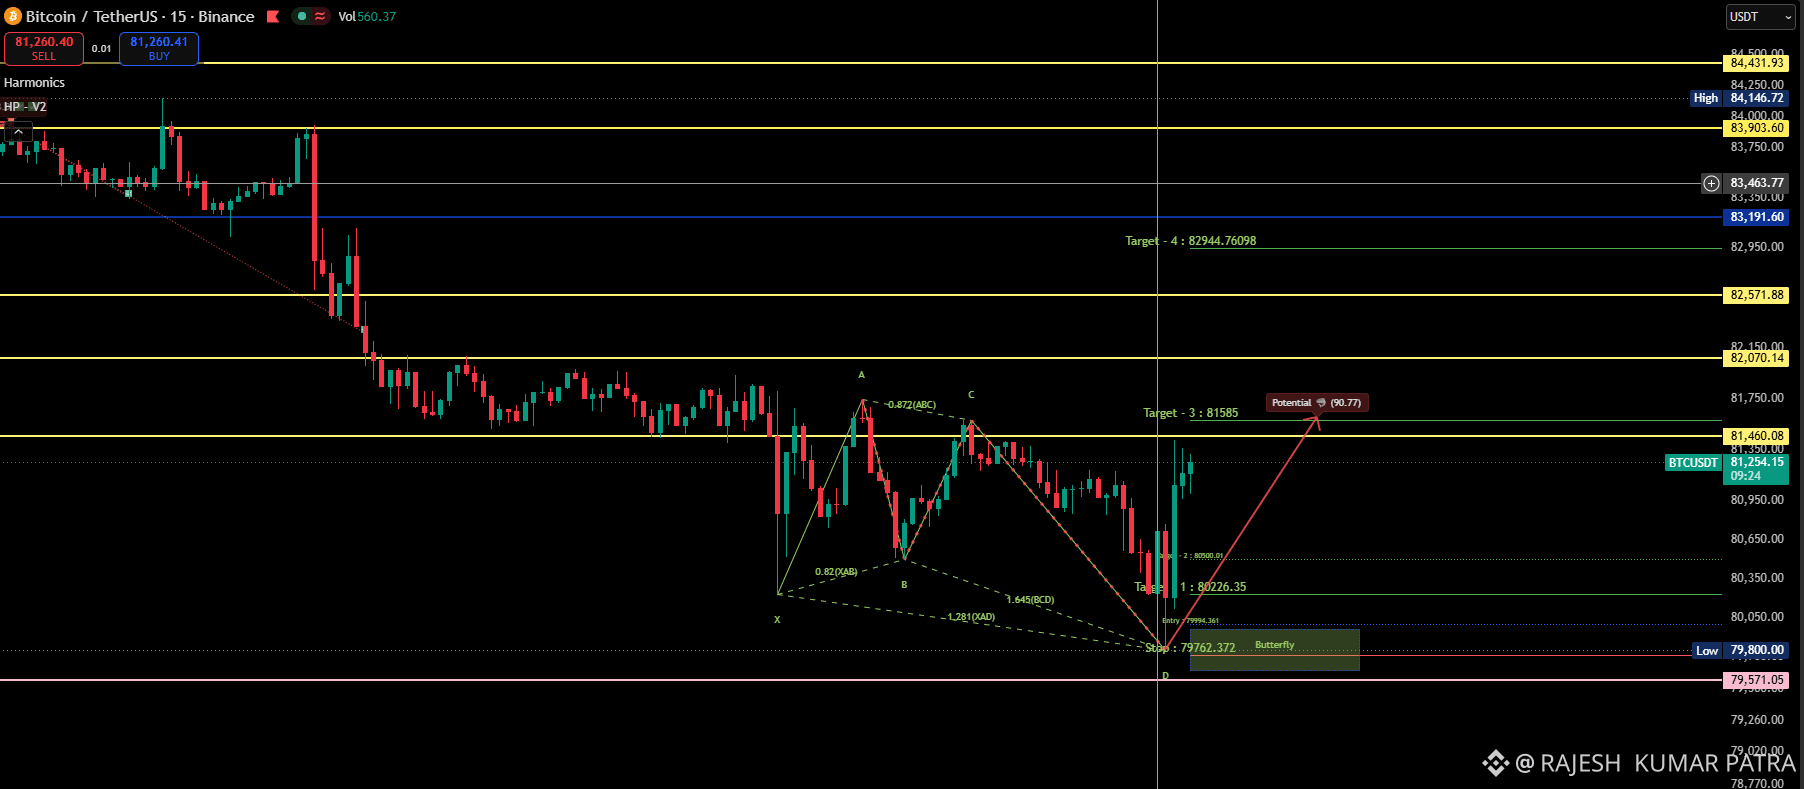
👍$BTC Harmonic Butterfly pattern
Your chart marks a potential bullish Butterfly completion near point D around 79,762.
X–A–B–C–D: The projected harmonic structure identifies a possible reversal zone.
D zone: The sharp reaction from around 79,800 supports the possibility that buyers are defending this level.
Projected rebound: The red arrow points toward approximately 81,585, which is a plausible first major recovery target if momentum continues.
Important: a harmonic pattern is a setup, not confirmation. The bounce alone does not prove that the low is in.
BTC closes a 15-minute candle above 81,460–81,585 and successfully retests that zone as support.
First upside objective: 82,070
Next objective: 82,572
Extended objective: 82,945
A breakout without a successful retest can still fail.
{future}(BTCUSDT)
{spot}(BTCUSDT)
$BTC
👍$BTC Harmonic Butterfly pattern
Your chart marks a potential bullish Butterfly completion near point D around 79,762.
X–A–B–C–D: The projected harmonic structure identifies a possible reversal zone.
D zone: The sharp reaction from around 79,800 supports the possibility that buyers are defending this level.
Projected rebound: The red arrow points toward approximately 81,585, which is a plausible first major recovery target if momentum continues.
Important: a harmonic pattern is a setup, not confirmation. The bounce alone does not prove that the low is in.
BTC closes a 15-minute candle above 81,460–81,585 and successfully retests that zone as support.
First upside objective: 82,070
Next objective: 82,572
Extended objective: 82,945
A breakout without a successful retest can still fail.
104
·
--
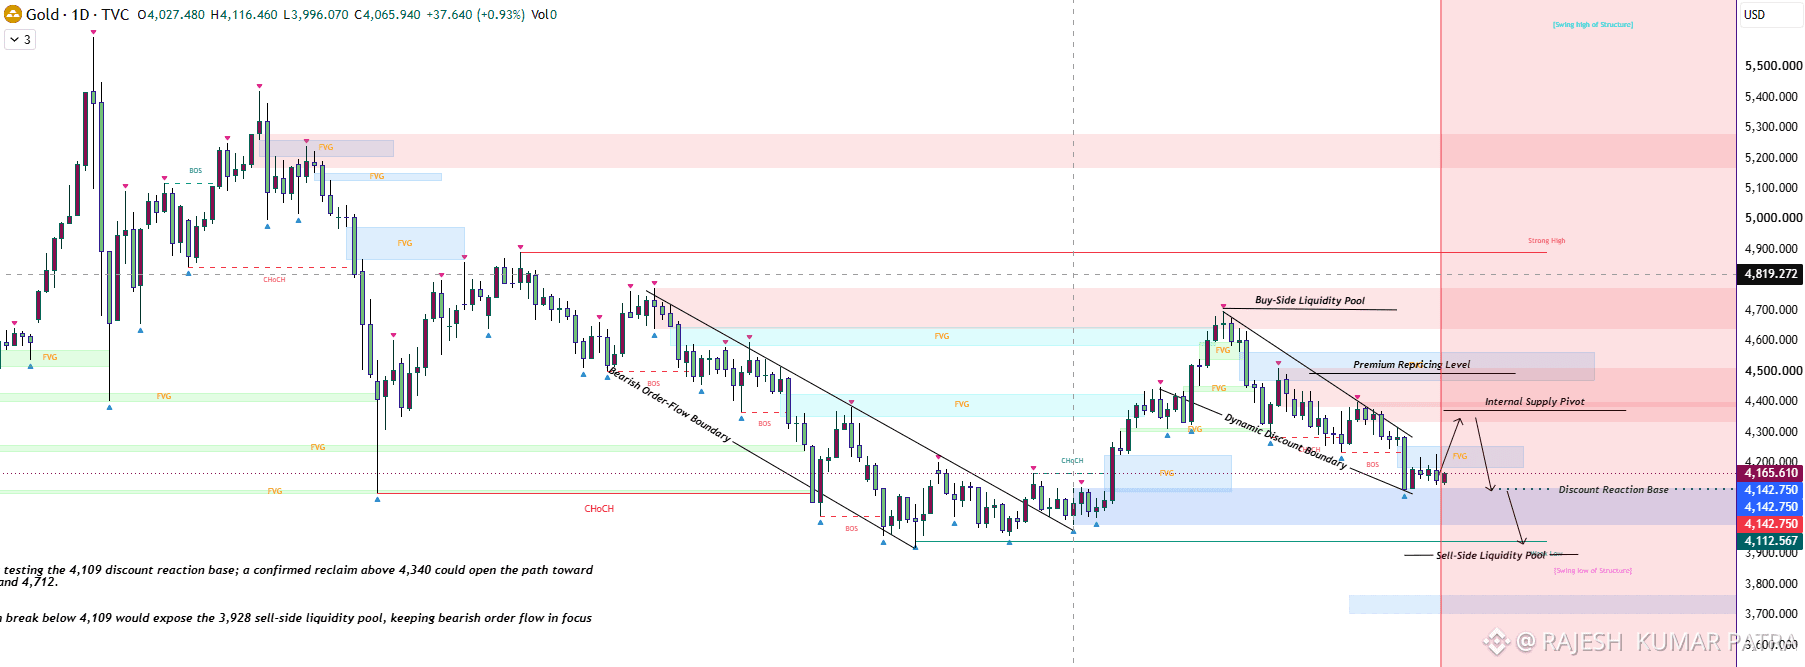
$XAU 現在の状況
現在価格はおよそ4,165です。
重要な構造は次のとおりです。
4,109–4,143:ディスカウント反応/サポートゾーン
4,340:重要な強気回復レベル
4,400:内部供給のピボット
4,500:プレミアムへの再評価エリア
4,600–4,700:買いサイド流動性/主要な供給ゾーン
3,928:売りサイド流動性のターゲット
チャートでは、4,109がディスカウント反応の基点として明確に示されています。これは非常に重要です。
🟢 強気シナリオ
価格は現在、ディスカウントゾーンの下部を試しています。
買い手が4,109–4,143を守り、価格が近辺の構造を回復し始めた場合、注目する水準は次のとおりです。
4,165 → 4,250 → 4,340
重要な確認ポイントは、D1で4,340を上回って回復することです。
そうなれば、チャート上の上昇経路がかなり興味深くなります。
4,340 → 4,400 → 4,500 → 4,600 → 4,712
したがって、大きな構造が弱気だからという理由だけで、機械的にショートするつもりはありません。
4,109をしっかり守った後、4,340を回復できれば、かなり大きな逆トレンドラリーにつながる可能性があります。
🔴 弱気シナリオ
構造面では、こちらのシナリオの方が重要だと考えています。
価格が4,109を維持できなければ、ディスカウント反応の基点が失われます。
すると、チャートに示されている次の主要な目標は以下のとおりです。
4,109を下抜け → 売りサイド流動性の3,928
これは4,109から約181ポイントの値動きです。
さらに3,928を下回ると、チャートには3,700–3,750付近に別の大きな需要/流動性ゾーンがあります。
したがって、弱気の展開は次のようになります。
4,109を下抜け → 3,928 → 約3,700
ここでは、最初のチャートにある3,800のサポートも関係してきます。2つのチャートがまったく同じ水準を示しているわけではありませんが、より広い意味では同じ下値ゾーンを指しています。
最も重要な水準:4,340
4,340を、弱気継続と、意味のある回復につながる可能性の境界線として捉えます。
4,340未満
弱気の注文フローが引き続き優勢です。
4,300–4,340まで上昇して反落するなら、4,165で売るよりも、より良いショートの機会となる可能性があります。
4,340超
{future}(XAUTUSDT)
{future}(XAUUSDT)
$XAU 現在の状況
現在価格はおよそ4,165です。
重要な構造は次のとおりです。
4,109–4,143:ディスカウント反応/サポートゾーン
4,340:重要な強気回復レベル
4,400:内部供給のピボット
4,500:プレミアムへの再評価エリア
4,600–4,700:買いサイド流動性/主要な供給ゾーン
3,928:売りサイド流動性のターゲット
チャートでは、4,109がディスカウント反応の基点として明確に示されています。これは非常に重要です。
🟢 強気シナリオ
価格は現在、ディスカウントゾーンの下部を試しています。
買い手が4,109–4,143を守り、価格が近辺の構造を回復し始めた場合、注目する水準は次のとおりです。
4,165 → 4,250 → 4,340
重要な確認ポイントは、D1で4,340を上回って回復することです。
そうなれば、チャート上の上昇経路がかなり興味深くなります。
4,340 → 4,400 → 4,500 → 4,600 → 4,712
したがって、大きな構造が弱気だからという理由だけで、機械的にショートするつもりはありません。
4,109をしっかり守った後、4,340を回復できれば、かなり大きな逆トレンドラリーにつながる可能性があります。
🔴 弱気シナリオ
構造面では、こちらのシナリオの方が重要だと考えています。
価格が4,109を維持できなければ、ディスカウント反応の基点が失われます。
すると、チャートに示されている次の主要な目標は以下のとおりです。
4,109を下抜け → 売りサイド流動性の3,928
これは4,109から約181ポイントの値動きです。
さらに3,928を下回ると、チャートには3,700–3,750付近に別の大きな需要/流動性ゾーンがあります。
したがって、弱気の展開は次のようになります。
4,109を下抜け → 3,928 → 約3,700
ここでは、最初のチャートにある3,800のサポートも関係してきます。2つのチャートがまったく同じ水準を示しているわけではありませんが、より広い意味では同じ下値ゾーンを指しています。
最も重要な水準:4,340
4,340を、弱気継続と、意味のある回復につながる可能性の境界線として捉えます。
4,340未満
弱気の注文フローが引き続き優勢です。
4,300–4,340まで上昇して反落するなら、4,165で売るよりも、より良いショートの機会となる可能性があります。
4,340超
210
·
--
$BTC 今日$BTC
$BTC
BTCUSDT — 今日の分析(2026年9月28日)
BTCUSDTは約$84.4Kです。今日の早い時間帯にBinanceがBTCが一時的に$84Kを下回ったと報告しましたが、現在のテクニカルデータでは市場は$84.4K付近に位置しています。B
デイトレードのシナリオ
強気シナリオ
15分/1時間足で$85,050〜85,600を明確に上抜けることができれば、$86.5K〜87.4Kへの道が開ける可能性があります。
$87.4Kを取り戻せば、短期の構造が大幅に強化されます。
弱気シナリオ
$84.6K〜85K付近での失敗の後、$84Kを下抜けすると、$83.5Kが露出する可能性があります。
$83.5Kがはっきりと失速した場合、次に重要なエリアはおよそ$81K〜82Kです。
$BTC 今日
$BTC
$BTC
BTCUSDT — 今日の分析(2026年9月28日)
BTCUSDTは約$84.4Kです。今日の早い時間帯にBinanceがBTCが一時的に$84Kを下回ったと報告しましたが、現在のテクニカルデータでは市場は$84.4K付近に位置しています。B
デイトレードのシナリオ
強気シナリオ
15分/1時間足で$85,050〜85,600を明確に上抜けることができれば、$86.5K〜87.4Kへの道が開ける可能性があります。
$87.4Kを取り戻せば、短期の構造が大幅に強化されます。
弱気シナリオ
$84.6K〜85K付近での失敗の後、$84Kを下抜けすると、$83.5Kが露出する可能性があります。
$83.5Kがはっきりと失速した場合、次に重要なエリアはおよそ$81K〜82Kです。
84
·
--
記事
XAU$XAUT
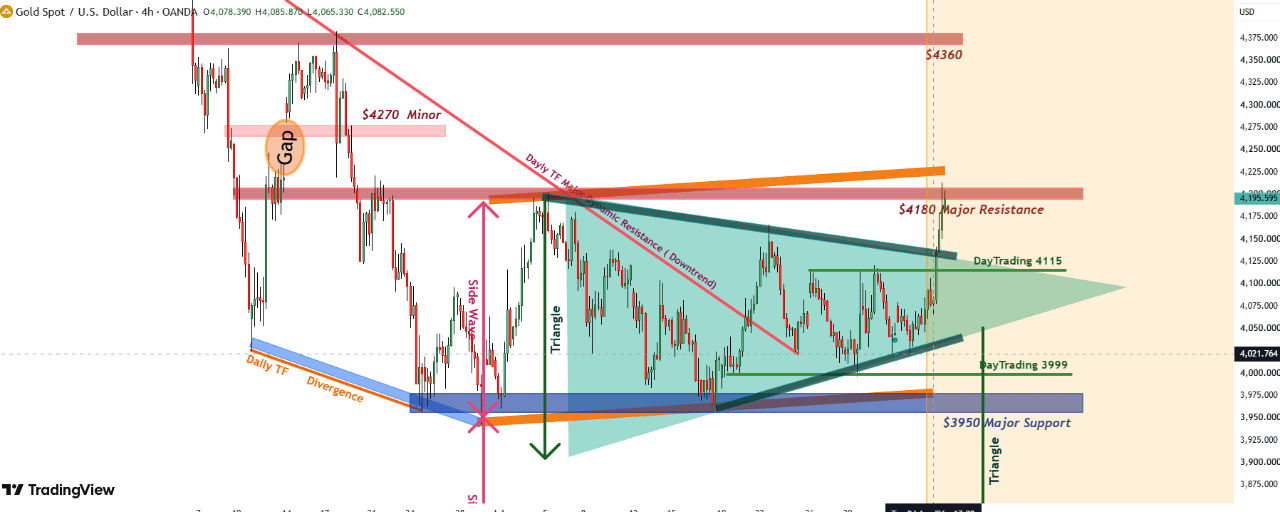
マーケット構造
トレンド:より大きなトレンドは弱気(高値からの下降トレンドライン)ですが、価格は最近、対称トライアングルの上限を上抜けました。
現在の価格:4082あたりで、マークされた$4180の主要レジスタンスのすぐ下に位置しています。
ブレイクアウトの足は強く勢いがあり、買い手が短期的に主導権を得たことを示唆しています。
重要な水準
レジスタンス
4180 – 主要なレジスタンス(現在テスト中)。
4270 – 軽微なレジスタンス。
4360 – 上位足の主要なレジスタンス。
XAU
$XAUT
マーケット構造
トレンド:より大きなトレンドは弱気(高値からの下降トレンドライン)ですが、価格は最近、対称トライアングルの上限を上抜けました。
現在の価格:4082あたりで、マークされた$4180の主要レジスタンスのすぐ下に位置しています。
ブレイクアウトの足は強く勢いがあり、買い手が短期的に主導権を得たことを示唆しています。
重要な水準
レジスタンス
4180 – 主要なレジスタンス(現在テスト中)。
4270 – 軽微なレジスタンス。
4360 – 上位足の主要なレジスタンス。
マーケット構造
トレンド:より大きなトレンドは弱気(高値からの下降トレンドライン)ですが、価格は最近、対称トライアングルの上限を上抜けました。
現在の価格:4082あたりで、マークされた$4180の主要レジスタンスのすぐ下に位置しています。
ブレイクアウトの足は強く勢いがあり、買い手が短期的に主導権を得たことを示唆しています。
重要な水準
レジスタンス
4180 – 主要なレジスタンス(現在テスト中)。
4270 – 軽微なレジスタンス。
4360 – 上位足の主要なレジスタンス。
128
·
--
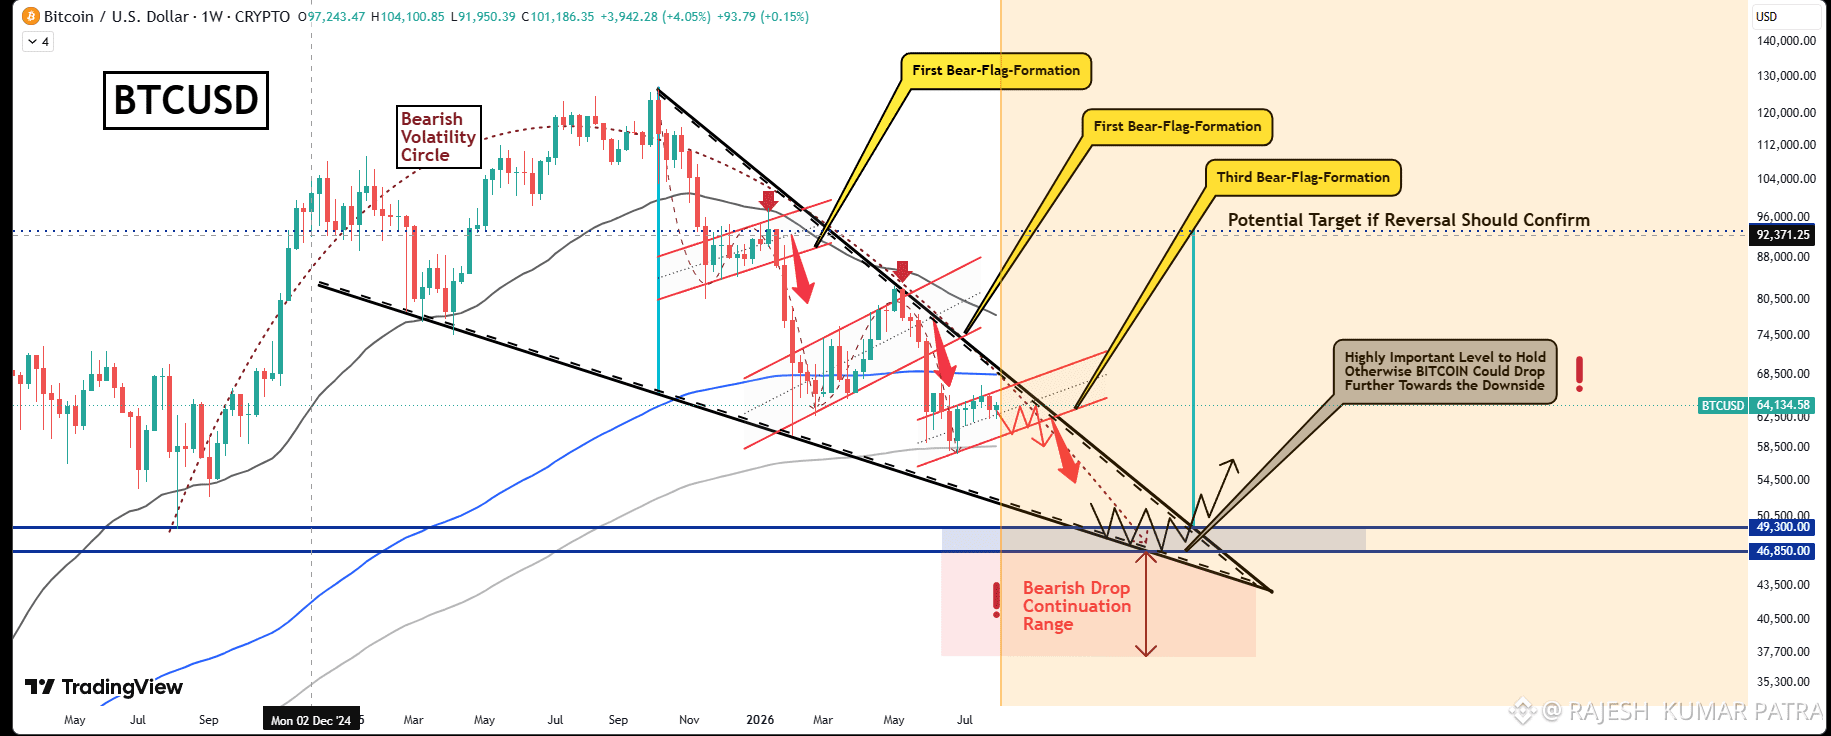
$BTC 現在のテクニカル構造
主要トレンド:弱気。チャートは主要な高値の後に、より低い高値とより低い安値の連続を示しています。パターン:複数の下落チャネル/ベアフラッグが描かれています。急落の後に繰り返し現れるベアフラッグは、通常は継続パターンを示唆しますが、確約ではありません。移動平均:
価格は短期の移動平均(グレー)を下回っており、途中のモメンタムが弱いことを示しています。一方で価格は長期の移動平均(青)を上回っているため、長期の強気相場が必ずしも無効になったわけではありません。
重要な価格水準
主要サポート・ゾーン:およそ$46.8k〜49.3k(青で強調表示)。
これはチャート上で最も重要なサポートです。ここでの強い週足の反応が見られれば、中期的なリカバリーにつながる可能性があります。
現在の価格帯:およそ$64kで、主要サポートと上側のより高いレジスタンスの間に位置しています。レジスタンス
およそ$74k〜80k、次に$92k〜96kで、チャート上では反転のターゲット候補としてラベル付けされています。
弱気シナリオを強める要因は?
弱気の継続は、以下の場合により説得力が増します:
価格が上向きの赤いサポート・チャネルを下抜ける。週足の終値が下降する黒いトレンドラインを下回ったままになる。ブレイクダウン時に売りの出来高が増加する。$46.8k〜49.3kのサポート・ゾーンが維持されない。
弱気シナリオを弱める要因は?
以下の場合、弱気の見通しは強さを失います:
BTCが下降する黒いトレンドラインを下抜けるのではなく、ブレイクして終値ベースで上回る。週足の時間軸で、より高い高値とより高い安値が作られ始める。ブレイクが強い出来高によって裏付けられる。
$46kへの想定移動について
チャートは、サポート・ゾーンに向けた下落の見込みを示しています。これは考えられるシナリオの1つであり、予測ではありません。ベアフラッグのようなテクニカル・パターンは、市場心理やマクロ経済状況が変化することで失敗することがあります。
重要な注記
{future}(BTCUSDT)
$BTC 現在のテクニカル構造
主要トレンド:弱気。チャートは主要な高値の後に、より低い高値とより低い安値の連続を示しています。パターン:複数の下落チャネル/ベアフラッグが描かれています。急落の後に繰り返し現れるベアフラッグは、通常は継続パターンを示唆しますが、確約ではありません。移動平均:
価格は短期の移動平均(グレー)を下回っており、途中のモメンタムが弱いことを示しています。一方で価格は長期の移動平均(青)を上回っているため、長期の強気相場が必ずしも無効になったわけではありません。
重要な価格水準
主要サポート・ゾーン:およそ$46.8k〜49.3k(青で強調表示)。
これはチャート上で最も重要なサポートです。ここでの強い週足の反応が見られれば、中期的なリカバリーにつながる可能性があります。
現在の価格帯:およそ$64kで、主要サポートと上側のより高いレジスタンスの間に位置しています。レジスタンス
およそ$74k〜80k、次に$92k〜96kで、チャート上では反転のターゲット候補としてラベル付けされています。
弱気シナリオを強める要因は?
弱気の継続は、以下の場合により説得力が増します:
価格が上向きの赤いサポート・チャネルを下抜ける。週足の終値が下降する黒いトレンドラインを下回ったままになる。ブレイクダウン時に売りの出来高が増加する。$46.8k〜49.3kのサポート・ゾーンが維持されない。
弱気シナリオを弱める要因は?
以下の場合、弱気の見通しは強さを失います:
BTCが下降する黒いトレンドラインを下抜けるのではなく、ブレイクして終値ベースで上回る。週足の時間軸で、より高い高値とより高い安値が作られ始める。ブレイクが強い出来高によって裏付けられる。
$46kへの想定移動について
チャートは、サポート・ゾーンに向けた下落の見込みを示しています。これは考えられるシナリオの1つであり、予測ではありません。ベアフラッグのようなテクニカル・パターンは、市場心理やマクロ経済状況が変化することで失敗することがあります。
重要な注記
82
·
--
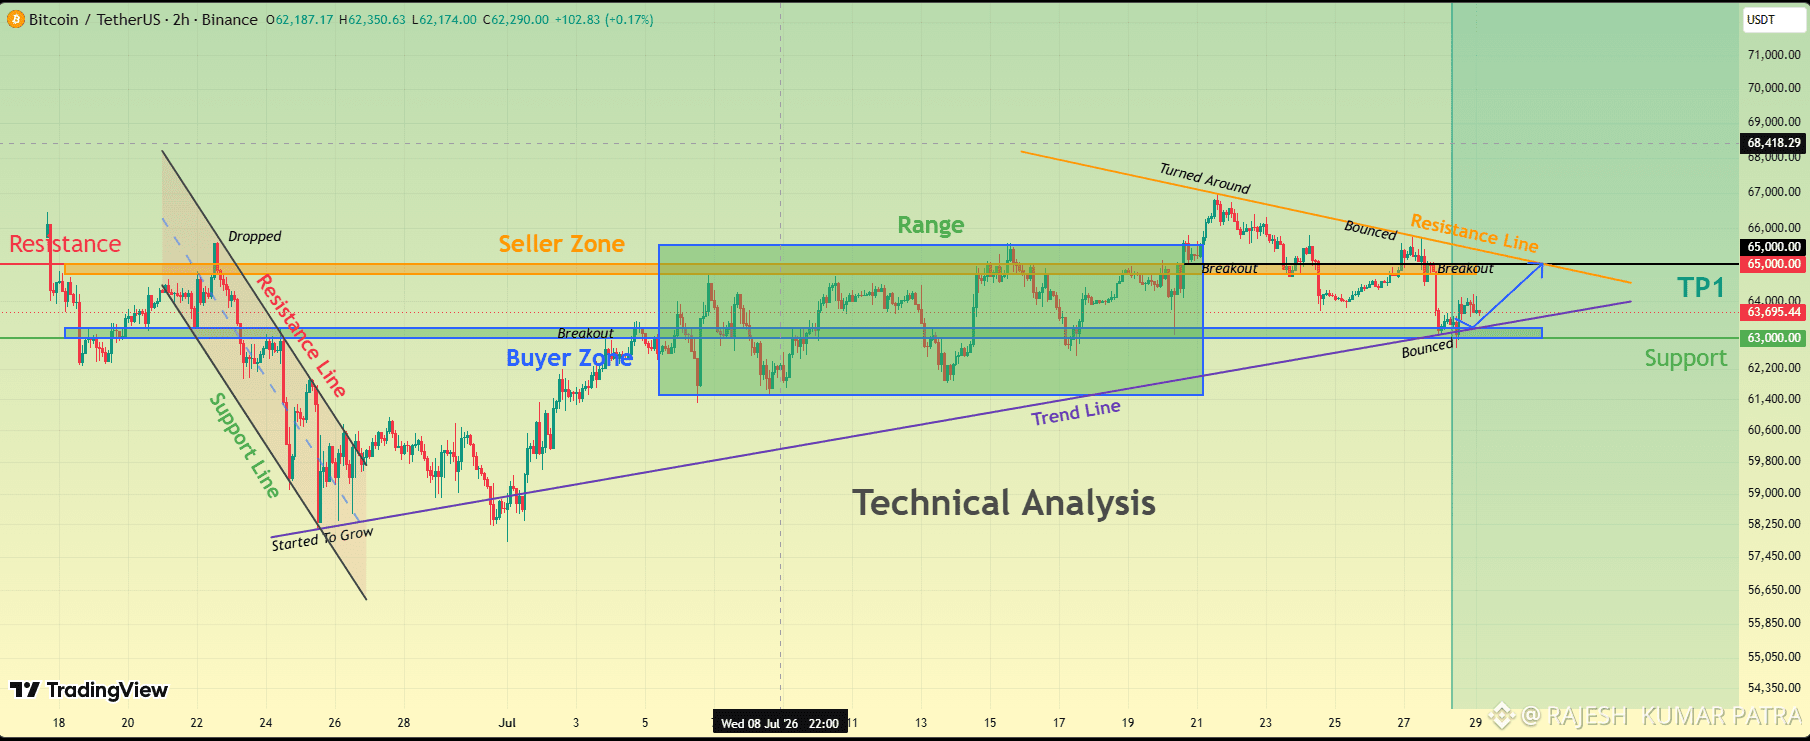
$BTC ビットコインは、トレーダーがきっかけとなる材料を待つなか、レンジ(保ち合い)局面で取引されています。最大の短期イベントはFOMC(米連邦公開市場委員会)会合で、これが変動率(ボラティリティ)を比較的抑えています。市場の見方でも、最近の業界動向により取引活動が減少し、レンジ相場につながっていると指摘されています。
テクニカル見通し
トレンド:短期ではニュートラル〜やや弱気。モメンタム:弱い。買い手がまだブレイクアウトを確認していません。ボラティリティ:圧縮されており、より大きな値動きが続く可能性を示唆します。
強気シナリオ
現在のレジスタンス帯を上抜ける強いブレイクアウトと出来高の増加があれば、勢いを伴う買いが発生する可能性があります。ロングエントリーを検討する前に、4時間足または日足のローソク足での確認を見てください。
弱気シナリオ
ビットコインが直近のサポートを失うと、トレーダーがマクロ経済発表に備えてリスクを抑えることで、売りが価格を押し下げる可能性があります。高い出来高を伴うサポート割れは、弱気シナリオをより強固にします
{future}(BTCUSDT)
$BTC ビットコインは、トレーダーがきっかけとなる材料を待つなか、レンジ(保ち合い)局面で取引されています。最大の短期イベントはFOMC(米連邦公開市場委員会)会合で、これが変動率(ボラティリティ)を比較的抑えています。市場の見方でも、最近の業界動向により取引活動が減少し、レンジ相場につながっていると指摘されています。
テクニカル見通し
トレンド:短期ではニュートラル〜やや弱気。モメンタム:弱い。買い手がまだブレイクアウトを確認していません。ボラティリティ:圧縮されており、より大きな値動きが続く可能性を示唆します。
強気シナリオ
現在のレジスタンス帯を上抜ける強いブレイクアウトと出来高の増加があれば、勢いを伴う買いが発生する可能性があります。ロングエントリーを検討する前に、4時間足または日足のローソク足での確認を見てください。
弱気シナリオ
ビットコインが直近のサポートを失うと、トレーダーがマクロ経済発表に備えてリスクを抑えることで、売りが価格を押し下げる可能性があります。高い出来高を伴うサポート割れは、弱気シナリオをより強固にします
69
·
--
翻訳参照
#opg $OPG Exploring @OpenGradient today and I’m impressed by the vision of verifiable AI infrastructure. OpenGradient Chat stands out by combining access to leading AI models with privacy-focused architecture that separates user identity from prompts. As AI adoption grows, transparency, security, and cryptographic verification could become essential building blocks for the next generation of intelligent applications. The utility of $OPG within this ecosystem makes the project worth watching as decentralized AI continues to evolve. #OPG
#opg $OPG Exploring @OpenGradient today and I’m impressed by the vision of verifiable AI infrastructure. OpenGradient Chat stands out by combining access to leading AI models with privacy-focused architecture that separates user identity from prompts. As AI adoption grows, transparency, security, and cryptographic verification could become essential building blocks for the next generation of intelligent applications. The utility of $OPG within this ecosystem makes the project worth watching as decentralized AI continues to evolve. #OPG
1
71
·
--
翻訳参照
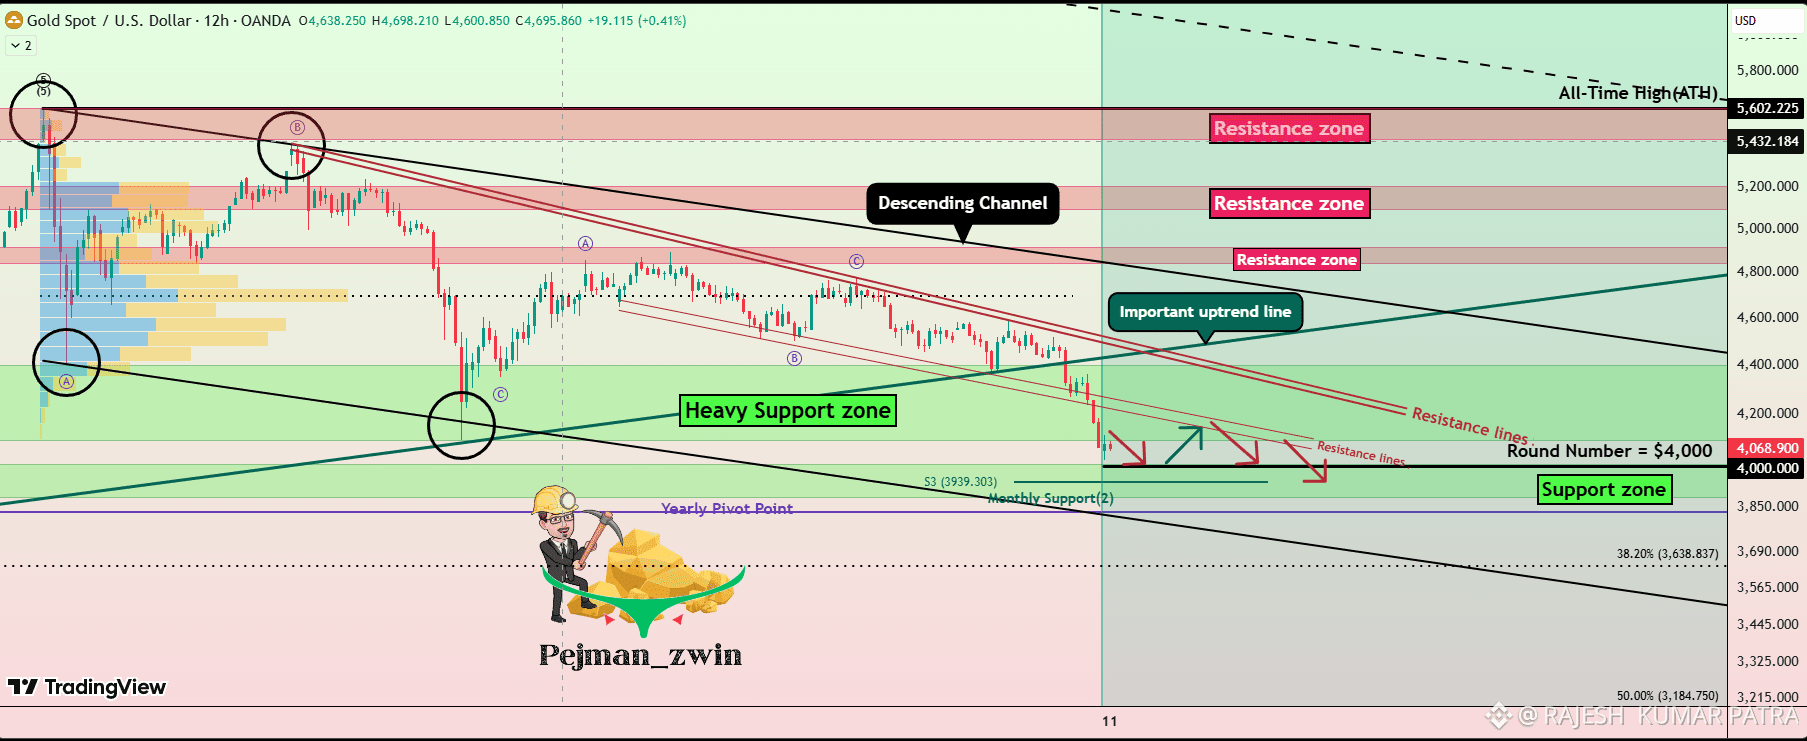
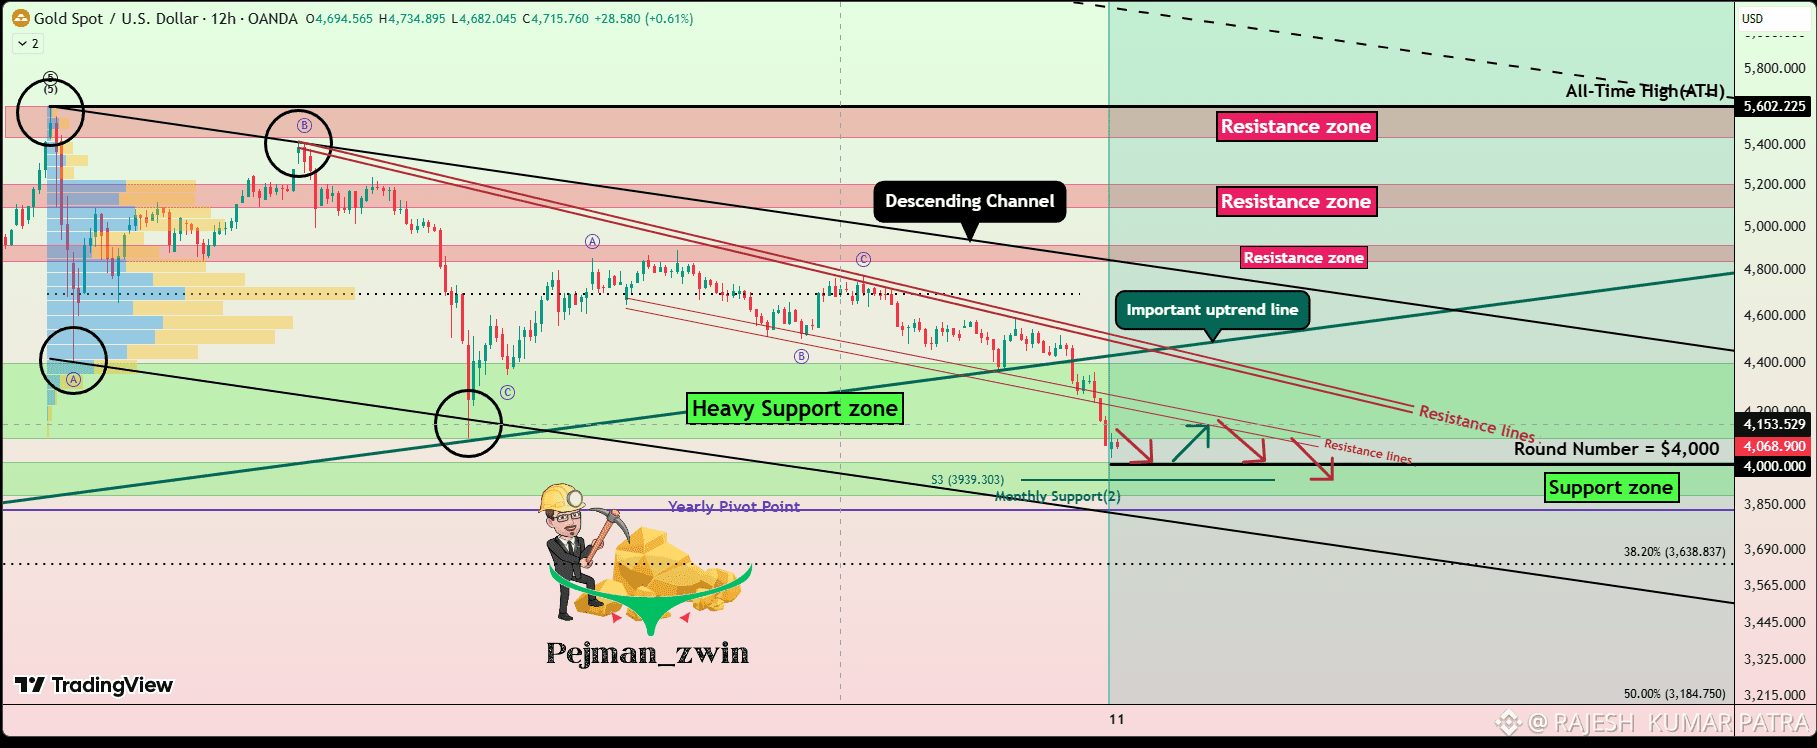
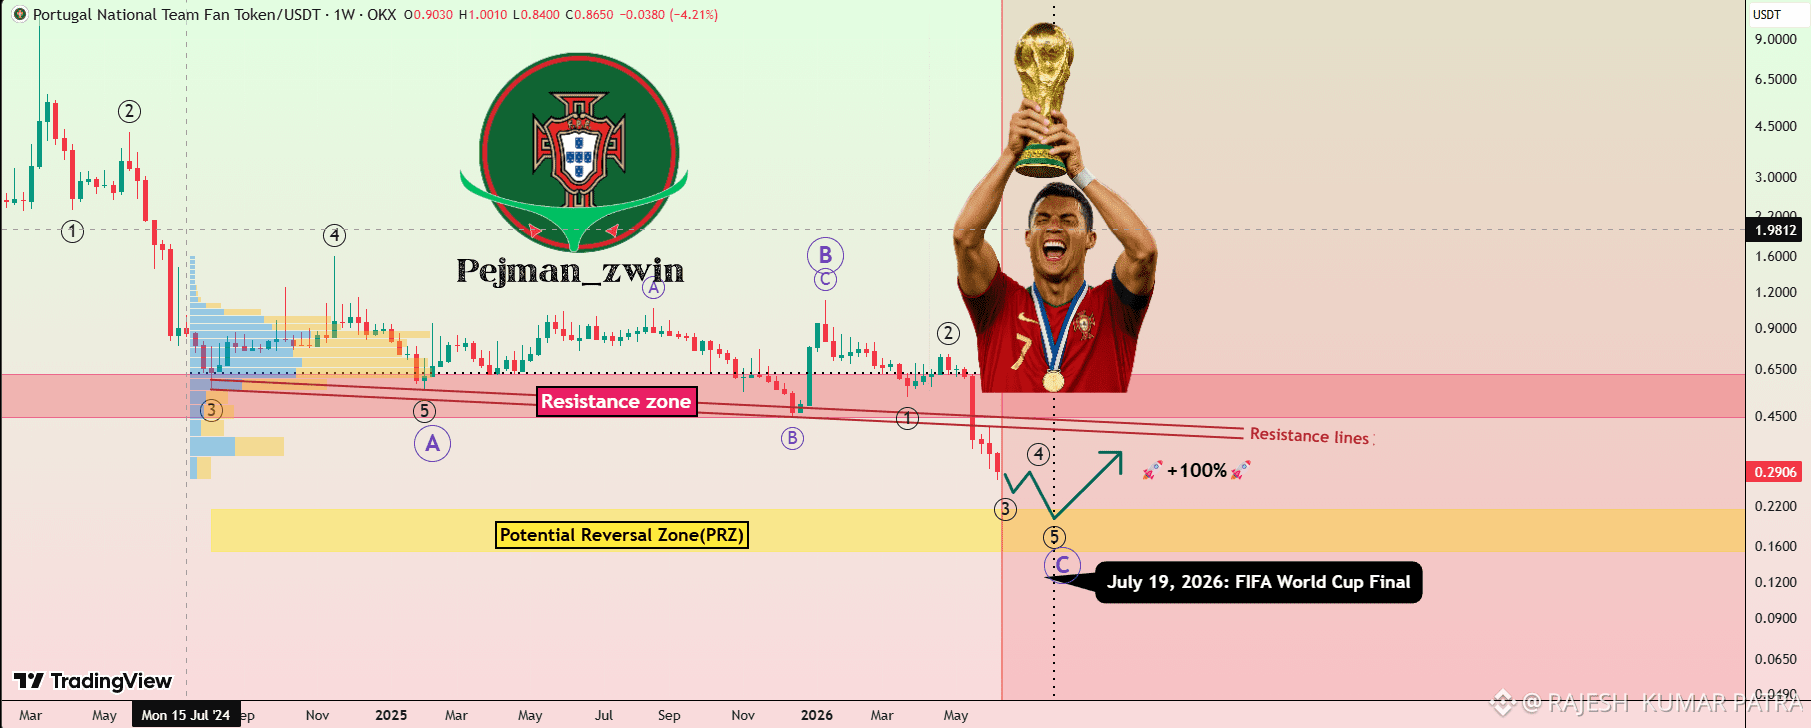
#BinancePickAndWin This is a interesting Event for all binance users🥳🥳🥳
join WC football match prediction and win the big reward🥳
#BinancePickAndWin This is a interesting Event for all binance users🥳🥳🥳
join WC football match prediction and win the big reward🥳
join WC football match prediction and win the big reward🥳

56
·
--
翻訳参照
#BinancePickAndWin This is a interesting Event for all binance users🥳🥳🥳
join WC football match prediction and win the big reward🥳
#BinancePickAndWin This is a interesting Event for all binance users🥳🥳🥳
join WC football match prediction and win the big reward🥳
join WC football match prediction and win the big reward🥳

66

·
--
本人確認中
翻訳参照
#bedrock $BR The $60K level remains the most important support for Bitcoin right now. Holding above it keeps the bullish recovery scenario alive, while a breakdown could open the door to lower levels. #Bitcoin #CryptoMarket
#bedrock $BR The $60K level remains the most important support for Bitcoin right now. Holding above it keeps the bullish recovery scenario alive, while a breakdown could open the door to lower levels. #Bitcoin #CryptoMarket
59
·
--
翻訳参照
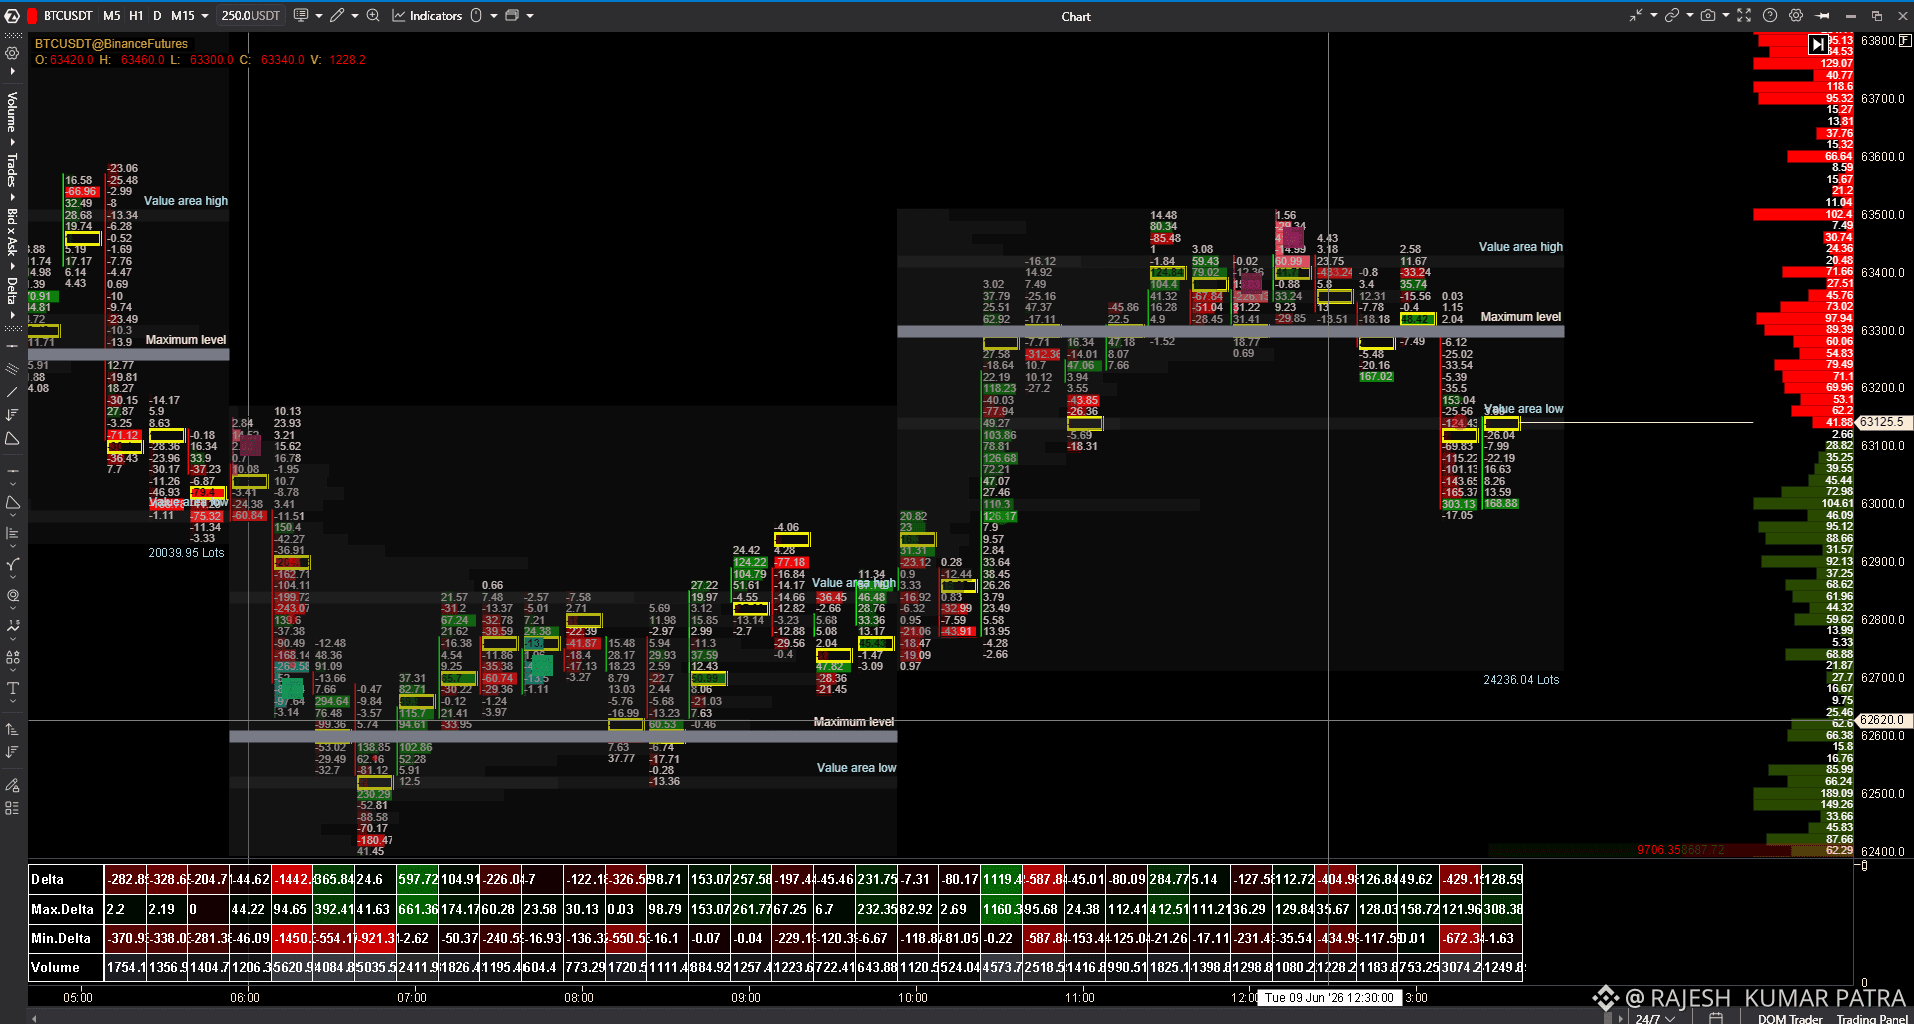
BTC (Bitcoin) Analysis – June 9, 2026
Bitcoin is currently trading around $63,000–$63,400 after rebounding from a recent low near $59,100.
Technical Outlook
Bullish scenario
BTC holds above the $60,000–$61,000 support zone.
A breakout above $65,000–$66,000 could signal renewed upward momentum and open the door toward higher highs.
Bearish scenario
A sustained move below $60,000 would weaken the market structure.
The next major downside targets could be in the $55,000–$50,000 range.
Key Levels
LevelPrice ZoneResistance 2$70,000Resistance 1$65,000–66,000Current Price~$63,000Support 1$60,000–61,000Support 2$55,000Major Support$50,000
Fundamental Factors
ETF outflows have continued to weigh on Bitcoin sentiment.
Institutional buying remains a supportive factor, helping offset some selling pressure.
Macroeconomic conditions and interest-rate expectations remain important drivers for crypto markets.
Short-Term Scenarios
Bullish:
BTC breaks above $66,000 → target $70,000+.
Neutral / Range-bound:
BTC trades between $60,000 and $66,000.
Bearish:
BTC loses $60,000 support → potential move toward $55,000–$50,000.
Conclusion
The short-term trend is neutral to slightly bearish, but the $60,000 support area is critical. As long as Bitcoin remains above this level, a recovery toward $66,000–$70,000 is possible. A decisive breakdown below it would increase the probability of a deeper correction.
If you'd like, I can also provide a more detailed trading analysis for 1-hour, 4-hour, or daily charts, including entry zones, stop-loss levels, and profit targets.
72
ログインして、さらにコンテンツを読む
厳選トピックで世界の暗号資産トレーダーの仲間入り
⚡️ 暗号資産に関する最新かつ有益な情報が見つかります。
💬 世界最大の暗号資産取引所から信頼されています。
👍 認証を受けたクリエイターから、有益なインサイトを得られます。
メール / 電話番号