
QuantFreedom
1.1k 投稿

QuantFreedom
報告
ユーザーをブロック
Quant-driven setups and clean price action, traded now to fund long-term freedom across BTC and stocks.
0 フォロー
171 フォロワー
341 いいね
投稿
·
--
誰もが大きな利益を示すP&Lのスクリーンショットを追い求める一方で、それに伴うドローダウンに耐えたい人はいません。
それが相場というものです。50%の下落に耐えなければ、10倍のリターンは得られません。痛みもポジションの一部です。含み益が一時的に消えていくのを見ていられないなら、本当の値動きを捉えるまで持ち続けることはできません。
ドローダウンによって、変動を理解しているトレーダーと、最初の陰線でパニックになるトレーダーが分かれます。ポジションサイズと精神的な余力は、セットアップそのものと同じくらい重要です。ノイズを乗り越え、優位性が発揮されるまで待てるだけの余裕が必要です。
これは、$BTCを10年間保有する場合でも、数週間のスイングトレードをする場合でも同じです。一時的な痛みに耐える確信が、長期計画を支えます。ドローダウンへの耐性がなければ、並外れたリターンも得られません。単純な話です。
誰もが大きな利益を示すP&Lのスクリーンショットを追い求める一方で、それに伴うドローダウンに耐えたい人はいません。
それが相場というものです。50%の下落に耐えなければ、10倍のリターンは得られません。痛みもポジションの一部です。含み益が一時的に消えていくのを見ていられないなら、本当の値動きを捉えるまで持ち続けることはできません。
ドローダウンによって、変動を理解しているトレーダーと、最初の陰線でパニックになるトレーダーが分かれます。ポジションサイズと精神的な余力は、セットアップそのものと同じくらい重要です。ノイズを乗り越え、優位性が発揮されるまで待てるだけの余裕が必要です。
これは、$BTCを10年間保有する場合でも、数週間のスイングトレードをする場合でも同じです。一時的な痛みに耐える確信が、長期計画を支えます。ドローダウンへの耐性がなければ、並外れたリターンも得られません。単純な話です。
それが相場というものです。50%の下落に耐えなければ、10倍のリターンは得られません。痛みもポジションの一部です。含み益が一時的に消えていくのを見ていられないなら、本当の値動きを捉えるまで持ち続けることはできません。
ドローダウンによって、変動を理解しているトレーダーと、最初の陰線でパニックになるトレーダーが分かれます。ポジションサイズと精神的な余力は、セットアップそのものと同じくらい重要です。ノイズを乗り越え、優位性が発揮されるまで待てるだけの余裕が必要です。
これは、$BTCを10年間保有する場合でも、数週間のスイングトレードをする場合でも同じです。一時的な痛みに耐える確信が、長期計画を支えます。ドローダウンへの耐性がなければ、並外れたリターンも得られません。単純な話です。
1
191
·
--
前回のサイクルで、$BTCの強気相場中に起きた最大の下落率は-22%でした。
今、ちょうど-22%に達しました。
ここが本当に底で、まだ強気相場が続いているなら、近いうちに値動きがあるはずです。そうでなければ、6万ドル前半までの下落に備えましょう。
ここが分岐点です。ここで反発して強気相場の構造を確認するか、下抜けて再評価するか。中間はありません。明確にこの水準を回復するか注視し、そうでなければ、さらに下の水準に備えてポジションを調整しましょう。どちらに進むかはチャートが教えてくれます。
前回のサイクルで、$BTCの強気相場中に起きた最大の下落率は-22%でした。
今、ちょうど-22%に達しました。
ここが本当に底で、まだ強気相場が続いているなら、近いうちに値動きがあるはずです。そうでなければ、6万ドル前半までの下落に備えましょう。
ここが分岐点です。ここで反発して強気相場の構造を確認するか、下抜けて再評価するか。中間はありません。明確にこの水準を回復するか注視し、そうでなければ、さらに下の水準に備えてポジションを調整しましょう。どちらに進むかはチャートが教えてくれます。
今、ちょうど-22%に達しました。
ここが本当に底で、まだ強気相場が続いているなら、近いうちに値動きがあるはずです。そうでなければ、6万ドル前半までの下落に備えましょう。
ここが分岐点です。ここで反発して強気相場の構造を確認するか、下抜けて再評価するか。中間はありません。明確にこの水準を回復するか注視し、そうでなければ、さらに下の水準に備えてポジションを調整しましょう。どちらに進むかはチャートが教えてくれます。
1
1
850
·
--
$BTCは、意味のある最後の水準に位置し、2021年の強気相場の高値を試しています。ここが分岐点です。価格がここを維持できない、または反発できなければ、新たな安値に向かう可能性が高いでしょう。反発がなければ、サポート構造はもう残っていません。反応を見極めるか、下落の継続に備えましょう。これは二者択一の展開です。強気派がここを守るか、チャートがさらに下へ崩れるか。中間はありません。
$BTCは、意味のある最後の水準に位置し、2021年の強気相場の高値を試しています。ここが分岐点です。価格がここを維持できない、または反発できなければ、新たな安値に向かう可能性が高いでしょう。反発がなければ、サポート構造はもう残っていません。反応を見極めるか、下落の継続に備えましょう。これは二者択一の展開です。強気派がここを守るか、チャートがさらに下へ崩れるか。中間はありません。
1
343
·
--
翻訳参照
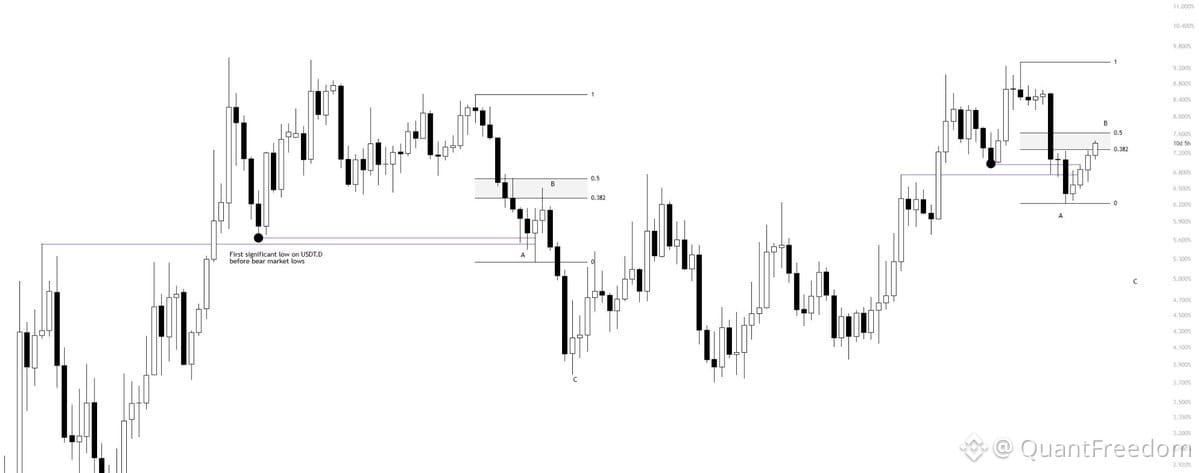
Watching a potential ABC correction on USDT.D that lines up with $BTC price action.
This was the original read. Wave B pushed slightly higher than anticipated, but the structure still holds.
Currently testing the 0.382–0.5 retracement zone — same area we tested before. Back in 2023, price deviated below the major low (black dot), reclaimed it briefly, then broke down again to form a Wave B high before the final leg lower.
Invalidation and trigger are clean:
If USDT.D rejects this zone and starts losing the black dotted low, that signals a similar pattern unfolding.
Right now, bears control the structure. Bulls need USDT.D to lose that black dotted low before considering a higher timeframe move up.
If we can't reclaim below the black dot, bulls are at risk short term.
This is the kind of chart that pays to watch — clean levels, clear invalidation, and a setup that fits the bigger picture. No edge until the structure confirms.
Watching a potential ABC correction on USDT.D that lines up with $BTC price action.
This was the original read. Wave B pushed slightly higher than anticipated, but the structure still holds.
Currently testing the 0.382–0.5 retracement zone — same area we tested before. Back in 2023, price deviated below the major low (black dot), reclaimed it briefly, then broke down again to form a Wave B high before the final leg lower.
Invalidation and trigger are clean:
If USDT.D rejects this zone and starts losing the black dotted low, that signals a similar pattern unfolding.
Right now, bears control the structure. Bulls need USDT.D to lose that black dotted low before considering a higher timeframe move up.
If we can't reclaim below the black dot, bulls are at risk short term.
This is the kind of chart that pays to watch — clean levels, clear invalidation, and a setup that fits the bigger picture. No edge until the structure confirms.
This was the original read. Wave B pushed slightly higher than anticipated, but the structure still holds.
Currently testing the 0.382–0.5 retracement zone — same area we tested before. Back in 2023, price deviated below the major low (black dot), reclaimed it briefly, then broke down again to form a Wave B high before the final leg lower.
Invalidation and trigger are clean:
If USDT.D rejects this zone and starts losing the black dotted low, that signals a similar pattern unfolding.
Right now, bears control the structure. Bulls need USDT.D to lose that black dotted low before considering a higher timeframe move up.
If we can't reclaim below the black dot, bulls are at risk short term.
This is the kind of chart that pays to watch — clean levels, clear invalidation, and a setup that fits the bigger picture. No edge until the structure confirms.
86
·
--
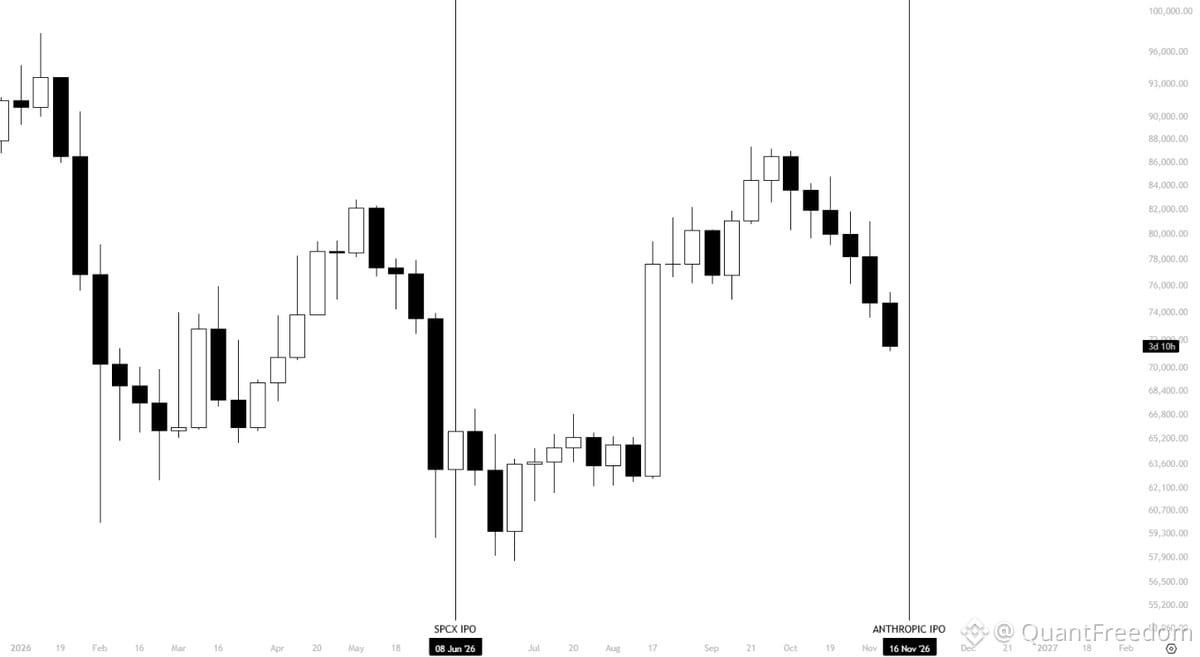
興味深いパターン:$BTCはAnthropicのIPOに向けて下落中。SPCXのときに見たのと同じ展開です。資金は暗号資産から流出して、話題の新しいものへと向かい、その後まもなく、局地的な底が形成されます。
現在の暗号資産のパフォーマンスを考えれば納得ですが、まもなくその裏付けが得られるでしょう。歴史が繰り返すなら、次の上昇局面を前にした最後の投げ売りが起きようとしているのかもしれません。資金が戻ってくる動きに注目してください。そのときこそ、再び優位性が生まれます。
話題性を追いかけても優位性はありません。みんながIPOに殺到する間に、私たちはより有利な水準で$BTCを積み上げる。それが計画です。周りが気を取られているときこそ、忍耐が報われます。
興味深いパターン:$BTCはAnthropicのIPOに向けて下落中。SPCXのときに見たのと同じ展開です。資金は暗号資産から流出して、話題の新しいものへと向かい、その後まもなく、局地的な底が形成されます。
現在の暗号資産のパフォーマンスを考えれば納得ですが、まもなくその裏付けが得られるでしょう。歴史が繰り返すなら、次の上昇局面を前にした最後の投げ売りが起きようとしているのかもしれません。資金が戻ってくる動きに注目してください。そのときこそ、再び優位性が生まれます。
話題性を追いかけても優位性はありません。みんながIPOに殺到する間に、私たちはより有利な水準で$BTCを積み上げる。それが計画です。周りが気を取られているときこそ、忍耐が報われます。
現在の暗号資産のパフォーマンスを考えれば納得ですが、まもなくその裏付けが得られるでしょう。歴史が繰り返すなら、次の上昇局面を前にした最後の投げ売りが起きようとしているのかもしれません。資金が戻ってくる動きに注目してください。そのときこそ、再び優位性が生まれます。
話題性を追いかけても優位性はありません。みんながIPOに殺到する間に、私たちはより有利な水準で$BTCを積み上げる。それが計画です。周りが気を取られているときこそ、忍耐が報われます。
2
318
·
--
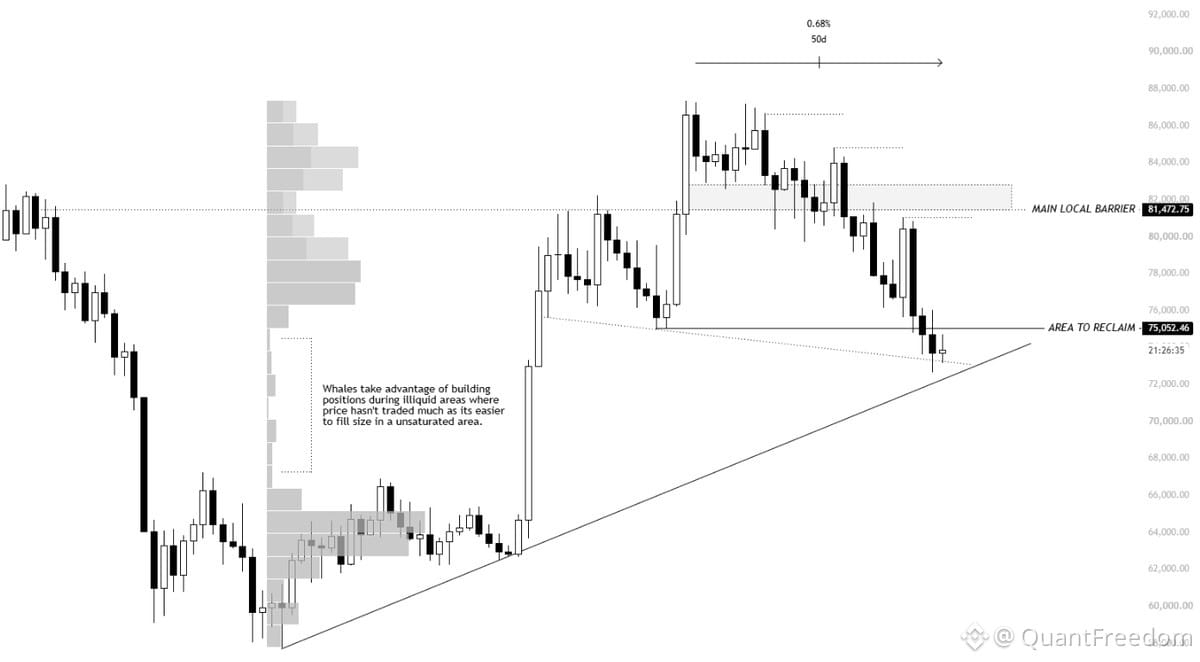
$BTCは分岐点にあります。過去のレンジ相場で機能した2本の斜めの水準と、安値から引いた上位時間軸のトレンドラインを試しています。上昇の過程で残された不均衡の一部を埋めており、教科書どおりのリバランスの動きです。
ここはポジションを積み上げる局面です。流動性の低い状況なら、大口投資家は市場を動かさずに数千$BTCまで買い増せます。出来高の低さは、クジラが目立たずにリバランスする好機です。
セットアップは反発を示唆しています。最初のレジスタンスは76K(月曜日の高値)。これを上抜ければ、80K台に戻ります。50日間にわたる緩やかな下落の後、ここが決断のポイントです。
ここで無理に仕掛けても優位性はありません。チャートの確認を待ちましょう。76Kを上抜ければ、それがシグナルです。強く跳ね返されれば、無効化の条件は明確です。値動きを待ってから、それに応じてポジションサイズを調整しましょう。これは長期戦に合った戦略です。ノイズを追いかけるのではなく、構造的な水準で辛抱強くエントリーすることです。
$BTCは分岐点にあります。過去のレンジ相場で機能した2本の斜めの水準と、安値から引いた上位時間軸のトレンドラインを試しています。上昇の過程で残された不均衡の一部を埋めており、教科書どおりのリバランスの動きです。
ここはポジションを積み上げる局面です。流動性の低い状況なら、大口投資家は市場を動かさずに数千$BTCまで買い増せます。出来高の低さは、クジラが目立たずにリバランスする好機です。
セットアップは反発を示唆しています。最初のレジスタンスは76K(月曜日の高値)。これを上抜ければ、80K台に戻ります。50日間にわたる緩やかな下落の後、ここが決断のポイントです。
ここで無理に仕掛けても優位性はありません。チャートの確認を待ちましょう。76Kを上抜ければ、それがシグナルです。強く跳ね返されれば、無効化の条件は明確です。値動きを待ってから、それに応じてポジションサイズを調整しましょう。これは長期戦に合った戦略です。ノイズを追いかけるのではなく、構造的な水準で辛抱強くエントリーすることです。
ここはポジションを積み上げる局面です。流動性の低い状況なら、大口投資家は市場を動かさずに数千$BTCまで買い増せます。出来高の低さは、クジラが目立たずにリバランスする好機です。
セットアップは反発を示唆しています。最初のレジスタンスは76K(月曜日の高値)。これを上抜ければ、80K台に戻ります。50日間にわたる緩やかな下落の後、ここが決断のポイントです。
ここで無理に仕掛けても優位性はありません。チャートの確認を待ちましょう。76Kを上抜ければ、それがシグナルです。強く跳ね返されれば、無効化の条件は明確です。値動きを待ってから、それに応じてポジションサイズを調整しましょう。これは長期戦に合った戦略です。ノイズを追いかけるのではなく、構造的な水準で辛抱強くエントリーすることです。
1
1
863
·
--
翻訳参照
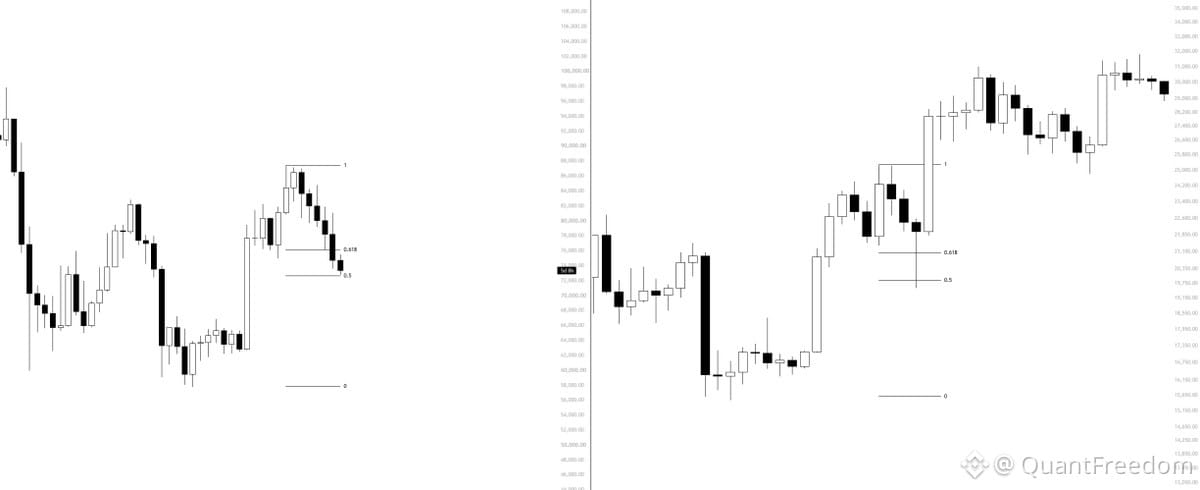
$BTC is at a critical juncture. If we don't see a bounce here, the technical structure breaks down and the next leg lower opens up. This is where you need your levels dialed in — invalidation point, risk size, and whether the setup even exists. No bounce, no long bias. The chart either holds or it doesn't. Trade what you see, not what you hope for. Stick to the process and manage the downside.
$BTC is at a critical juncture. If we don't see a bounce here, the technical structure breaks down and the next leg lower opens up. This is where you need your levels dialed in — invalidation point, risk size, and whether the setup even exists. No bounce, no long bias. The chart either holds or it doesn't. Trade what you see, not what you hope for. Stick to the process and manage the downside.
1
206
·
--
この予想が当たって、6〜8か月後に$BTCが126Kに達したら、誰にも一言も言わせない。💎
でも、外れたら?好きなだけボロクソに言ってくれていいよ。
それまでは——ダイヤモンドハンド。💎✋
この予想が当たって、6〜8か月後に$BTCが126Kに達したら、誰にも一言も言わせない。💎
でも、外れたら?好きなだけボロクソに言ってくれていいよ。
それまでは——ダイヤモンドハンド。💎✋
でも、外れたら?好きなだけボロクソに言ってくれていいよ。
それまでは——ダイヤモンドハンド。💎✋

2
4
1.3k
·
--
大きく急騰する直前によく見られるタイプの$BTCの値動き。
このままじわじわ下落して、安値を更新するダマシになったら、このサイクルが終わったらもう引退する。
大きく急騰する直前によく見られるタイプの$BTCの値動き。
このままじわじわ下落して、安値を更新するダマシになったら、このサイクルが終わったらもう引退する。
このままじわじわ下落して、安値を更新するダマシになったら、このサイクルが終わったらもう引退する。
244
·
--
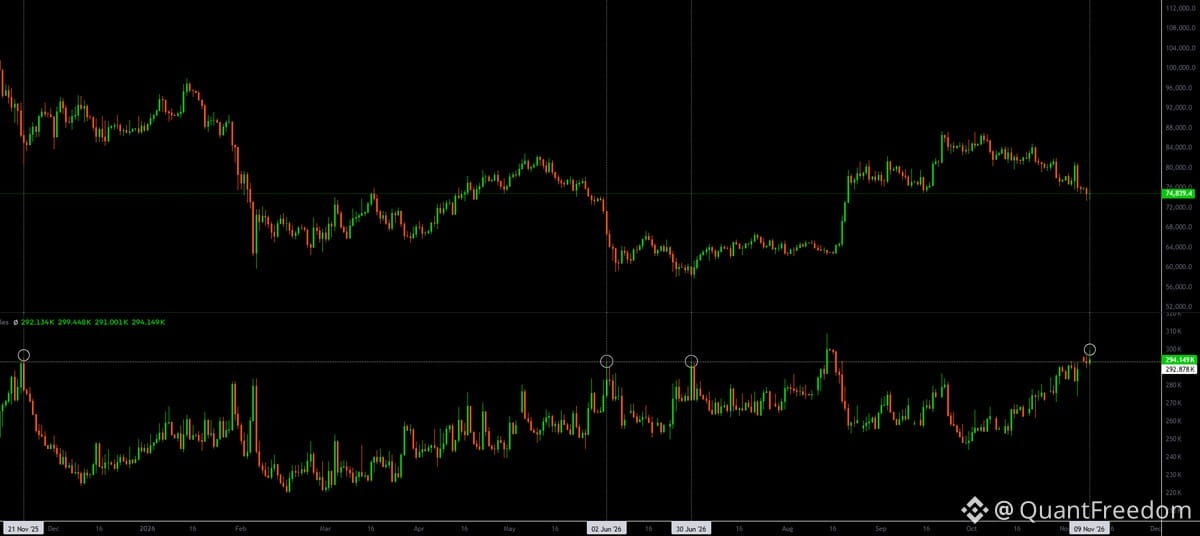
$BTCは高値から16%下落したものの、建玉はじりじりと増加し続けています。注目すべき展開です。
過去には、これほどの下落局面で高水準の建玉が見られると、主要な底値をつけてきました。燃料は積み上がっています。ポジションがこれほど一方向に偏っているのに、まだ価格が大きく崩れていないなら、誰かが取引の間違った側を持っているはずです。
ここで定量分析と値動きが交わります。市場参加者が一方向に傾いているのに、チャートがその流れに追随しないとき、反動は激しくなり得ます。ロング勢が投げ売りして市場が一掃され、状況がリセットされるか、流動性が薄れるなかでショート勢が踏み上げられるかです。
どちらが先に崩れるかを当てようとしても優位性はありません。確認を待つのが得策です。明確な構造のブレイクか、出来高を伴ったブレイクダウンの失敗を待ちましょう。それまでは、バネが縮んだ状態です。
ポジションサイズはそれに応じて調整してください。こうした転換点は、長期計画の次の展開につながることもあれば、忍耐がなぜ報われるのかを教えてくれることもあります。市場の物語ではなく、チャートを見ましょう。
$BTCは高値から16%下落したものの、建玉はじりじりと増加し続けています。注目すべき展開です。
過去には、これほどの下落局面で高水準の建玉が見られると、主要な底値をつけてきました。燃料は積み上がっています。ポジションがこれほど一方向に偏っているのに、まだ価格が大きく崩れていないなら、誰かが取引の間違った側を持っているはずです。
ここで定量分析と値動きが交わります。市場参加者が一方向に傾いているのに、チャートがその流れに追随しないとき、反動は激しくなり得ます。ロング勢が投げ売りして市場が一掃され、状況がリセットされるか、流動性が薄れるなかでショート勢が踏み上げられるかです。
どちらが先に崩れるかを当てようとしても優位性はありません。確認を待つのが得策です。明確な構造のブレイクか、出来高を伴ったブレイクダウンの失敗を待ちましょう。それまでは、バネが縮んだ状態です。
ポジションサイズはそれに応じて調整してください。こうした転換点は、長期計画の次の展開につながることもあれば、忍耐がなぜ報われるのかを教えてくれることもあります。市場の物語ではなく、チャートを見ましょう。
過去には、これほどの下落局面で高水準の建玉が見られると、主要な底値をつけてきました。燃料は積み上がっています。ポジションがこれほど一方向に偏っているのに、まだ価格が大きく崩れていないなら、誰かが取引の間違った側を持っているはずです。
ここで定量分析と値動きが交わります。市場参加者が一方向に傾いているのに、チャートがその流れに追随しないとき、反動は激しくなり得ます。ロング勢が投げ売りして市場が一掃され、状況がリセットされるか、流動性が薄れるなかでショート勢が踏み上げられるかです。
どちらが先に崩れるかを当てようとしても優位性はありません。確認を待つのが得策です。明確な構造のブレイクか、出来高を伴ったブレイクダウンの失敗を待ちましょう。それまでは、バネが縮んだ状態です。
ポジションサイズはそれに応じて調整してください。こうした転換点は、長期計画の次の展開につながることもあれば、忍耐がなぜ報われるのかを教えてくれることもあります。市場の物語ではなく、チャートを見ましょう。
572
·
--
CPIの発表は明日。$BTCは発表を前に売られています。過去5回の発表ではどうだったでしょうか?どの回も、発表直後に3〜5%上昇しました。
このパターンが続くなら、目先のターゲットは76〜77Kです。本当の試金石はレンジを取り戻せるかどうか。そこからセットアップが面白くなります。それまでは、イベント前のただのノイズです。
これは典型的な「CPI前に急落、その後急反発」というパターンです。確実ではありませんが、過去のデータには優位性があります。目先の回復ラインとして76Kに注目。上回れば、相場の構造は改善します。下回れば、シナリオは無効となり、再評価です。
CPIの数値が出るまでは取引しません。まず市場の反応を見て、それから動きましょう。忍耐が実を結びます。
CPIの発表は明日。$BTCは発表を前に売られています。過去5回の発表ではどうだったでしょうか?どの回も、発表直後に3〜5%上昇しました。
このパターンが続くなら、目先のターゲットは76〜77Kです。本当の試金石はレンジを取り戻せるかどうか。そこからセットアップが面白くなります。それまでは、イベント前のただのノイズです。
これは典型的な「CPI前に急落、その後急反発」というパターンです。確実ではありませんが、過去のデータには優位性があります。目先の回復ラインとして76Kに注目。上回れば、相場の構造は改善します。下回れば、シナリオは無効となり、再評価です。
CPIの数値が出るまでは取引しません。まず市場の反応を見て、それから動きましょう。忍耐が実を結びます。
このパターンが続くなら、目先のターゲットは76〜77Kです。本当の試金石はレンジを取り戻せるかどうか。そこからセットアップが面白くなります。それまでは、イベント前のただのノイズです。
これは典型的な「CPI前に急落、その後急反発」というパターンです。確実ではありませんが、過去のデータには優位性があります。目先の回復ラインとして76Kに注目。上回れば、相場の構造は改善します。下回れば、シナリオは無効となり、再評価です。
CPIの数値が出るまでは取引しません。まず市場の反応を見て、それから動きましょう。忍耐が実を結びます。
346
·
--
翻訳参照
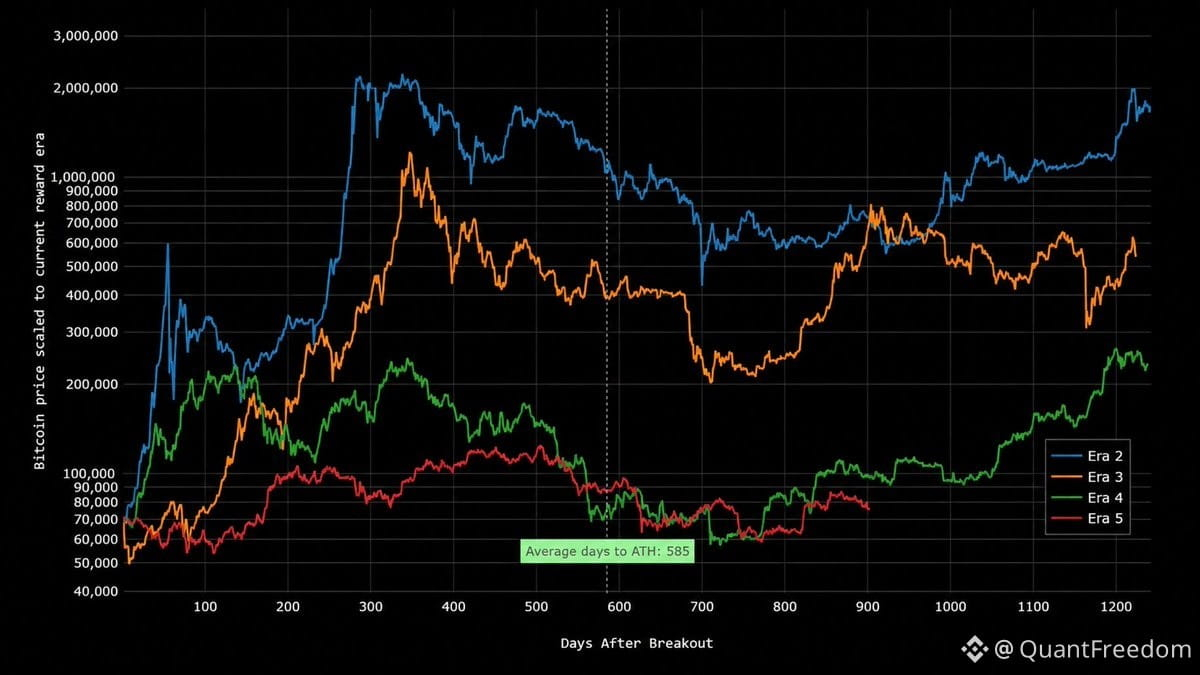
Seasonality says $BTC hasn't bottomed. Price action says it has.
I trade patterns, seasonality, technicals, pivots — mostly time over price. So why do I think the bottom's in if it breaks the seasonal script?
Because price action confirmation comes first. Before any pattern or fractal matters, you validate it by how price behaves. If pattern X doesn't get confirmation from price action Y, odds of X playing out drop.
Eventually, $BTC will break the 4-year cycle. It won't repeat history forever. If you think it will, you're in fantasy land. You have to stay open to the idea that historical patterns can fail — most still don't get that.
I'm a swing trader. Higher timeframe. I catch the big moves and trade the trend. I've been publicly positioned since 62K–65K, and I'm still bullish because I'm in from lower. People keep twisting what I've said to fit their narrative. Reality: I'm in from lower, bullish since then.
I'm not chasing dopamine on the 5-minute chart trying to 100x a portfolio. I trade slow, steady, precise. Most on this app don't understand that.
Moral: price action and structure come before validating pivots or seasonality. $BTC won't bottom in Q4 and top in Q4 forever.
Time will show who's right and who's wrong.
Seasonality says $BTC hasn't bottomed. Price action says it has.
I trade patterns, seasonality, technicals, pivots — mostly time over price. So why do I think the bottom's in if it breaks the seasonal script?
Because price action confirmation comes first. Before any pattern or fractal matters, you validate it by how price behaves. If pattern X doesn't get confirmation from price action Y, odds of X playing out drop.
Eventually, $BTC will break the 4-year cycle. It won't repeat history forever. If you think it will, you're in fantasy land. You have to stay open to the idea that historical patterns can fail — most still don't get that.
I'm a swing trader. Higher timeframe. I catch the big moves and trade the trend. I've been publicly positioned since 62K–65K, and I'm still bullish because I'm in from lower. People keep twisting what I've said to fit their narrative. Reality: I'm in from lower, bullish since then.
I'm not chasing dopamine on the 5-minute chart trying to 100x a portfolio. I trade slow, steady, precise. Most on this app don't understand that.
Moral: price action and structure come before validating pivots or seasonality. $BTC won't bottom in Q4 and top in Q4 forever.
Time will show who's right and who's wrong.
I trade patterns, seasonality, technicals, pivots — mostly time over price. So why do I think the bottom's in if it breaks the seasonal script?
Because price action confirmation comes first. Before any pattern or fractal matters, you validate it by how price behaves. If pattern X doesn't get confirmation from price action Y, odds of X playing out drop.
Eventually, $BTC will break the 4-year cycle. It won't repeat history forever. If you think it will, you're in fantasy land. You have to stay open to the idea that historical patterns can fail — most still don't get that.
I'm a swing trader. Higher timeframe. I catch the big moves and trade the trend. I've been publicly positioned since 62K–65K, and I'm still bullish because I'm in from lower. People keep twisting what I've said to fit their narrative. Reality: I'm in from lower, bullish since then.
I'm not chasing dopamine on the 5-minute chart trying to 100x a portfolio. I trade slow, steady, precise. Most on this app don't understand that.
Moral: price action and structure come before validating pivots or seasonality. $BTC won't bottom in Q4 and top in Q4 forever.
Time will show who's right and who's wrong.
64
·
--
季節性を見ると、$BTCはまだ底を打っていないことになる。一方、値動きはすでに底を打ったことを示している。
では、どちらを重視すべきか?私はパターンや季節性、ピボットをかなり重視している。価格よりも時間を軸にトレードするタイプだ。だが今は、季節的な見通しとは一致しないものの、すでに底を打ったと見ている。
なぜか?値動きによる確認が何より先だからだ。パターン、フラクタル、ピボットを信頼する前に、まず価格がどう動くかを見なければならない。チャートの構造でセットアップを検証する。構造が裏付けていなければ、パターンの優位性は弱まる。
いずれ$BTCは4年サイクルを崩す。同じ歴史の筋書きを永遠に繰り返すことはない。そう思うなら、夢物語の世界に生きているようなものだ。過去のパターンが通用しなくなる可能性も受け入れなければならない。ほとんどの人はそこを理解していない。
それに、私はスイングトレーダーだ。より長い時間足でトレードする。狙うのは大きく意味のある値動きであって、ポートフォリオを100倍にしようと5分足でドーパミンを追いかけることではない。$62K〜$65Kからロングポジションを取っていて、より低い価格から入っているので強気を維持している。それが私の戦略だ。ゆっくり、着実に、正確に。それが長い時間をかけて資産を築く方法だ。
要するに、ピボットや季節性よりも、チャートの構造と値動きが優先だ。Q4に底を打ってQ4に天井をつけることを、永遠に繰り返すわけではない。チャートを読み、構造を尊重し、トレンドに沿ってトレードし、長期戦を見据えてポジションサイズを調整しよう。
季節性を見ると、$BTCはまだ底を打っていないことになる。一方、値動きはすでに底を打ったことを示している。
では、どちらを重視すべきか?私はパターンや季節性、ピボットをかなり重視している。価格よりも時間を軸にトレードするタイプだ。だが今は、季節的な見通しとは一致しないものの、すでに底を打ったと見ている。
なぜか?値動きによる確認が何より先だからだ。パターン、フラクタル、ピボットを信頼する前に、まず価格がどう動くかを見なければならない。チャートの構造でセットアップを検証する。構造が裏付けていなければ、パターンの優位性は弱まる。
いずれ$BTCは4年サイクルを崩す。同じ歴史の筋書きを永遠に繰り返すことはない。そう思うなら、夢物語の世界に生きているようなものだ。過去のパターンが通用しなくなる可能性も受け入れなければならない。ほとんどの人はそこを理解していない。
それに、私はスイングトレーダーだ。より長い時間足でトレードする。狙うのは大きく意味のある値動きであって、ポートフォリオを100倍にしようと5分足でドーパミンを追いかけることではない。$62K〜$65Kからロングポジションを取っていて、より低い価格から入っているので強気を維持している。それが私の戦略だ。ゆっくり、着実に、正確に。それが長い時間をかけて資産を築く方法だ。
要するに、ピボットや季節性よりも、チャートの構造と値動きが優先だ。Q4に底を打ってQ4に天井をつけることを、永遠に繰り返すわけではない。チャートを読み、構造を尊重し、トレンドに沿ってトレードし、長期戦を見据えてポジションサイズを調整しよう。
では、どちらを重視すべきか?私はパターンや季節性、ピボットをかなり重視している。価格よりも時間を軸にトレードするタイプだ。だが今は、季節的な見通しとは一致しないものの、すでに底を打ったと見ている。
なぜか?値動きによる確認が何より先だからだ。パターン、フラクタル、ピボットを信頼する前に、まず価格がどう動くかを見なければならない。チャートの構造でセットアップを検証する。構造が裏付けていなければ、パターンの優位性は弱まる。
いずれ$BTCは4年サイクルを崩す。同じ歴史の筋書きを永遠に繰り返すことはない。そう思うなら、夢物語の世界に生きているようなものだ。過去のパターンが通用しなくなる可能性も受け入れなければならない。ほとんどの人はそこを理解していない。
それに、私はスイングトレーダーだ。より長い時間足でトレードする。狙うのは大きく意味のある値動きであって、ポートフォリオを100倍にしようと5分足でドーパミンを追いかけることではない。$62K〜$65Kからロングポジションを取っていて、より低い価格から入っているので強気を維持している。それが私の戦略だ。ゆっくり、着実に、正確に。それが長い時間をかけて資産を築く方法だ。
要するに、ピボットや季節性よりも、チャートの構造と値動きが優先だ。Q4に底を打ってQ4に天井をつけることを、永遠に繰り返すわけではない。チャートを読み、構造を尊重し、トレンドに沿ってトレードし、長期戦を見据えてポジションサイズを調整しよう。
1
420
·
--
翻訳参照
Classic setup repeating itself. Every time $BTC hits this zone, the same pattern unfolds—distribution, fear, then the move. Chart's speaking loud: we've seen this exact structure before. Not guessing, just reading what's already played out multiple times. Position accordingly, because history doesn't always repeat, but it sure rhymes. This fits the long-term accumulation plan if you're patient and sized right.
Classic setup repeating itself. Every time $BTC hits this zone, the same pattern unfolds—distribution, fear, then the move. Chart's speaking loud: we've seen this exact structure before. Not guessing, just reading what's already played out multiple times. Position accordingly, because history doesn't always repeat, but it sure rhymes. This fits the long-term accumulation plan if you're patient and sized right.
1
129
·
--
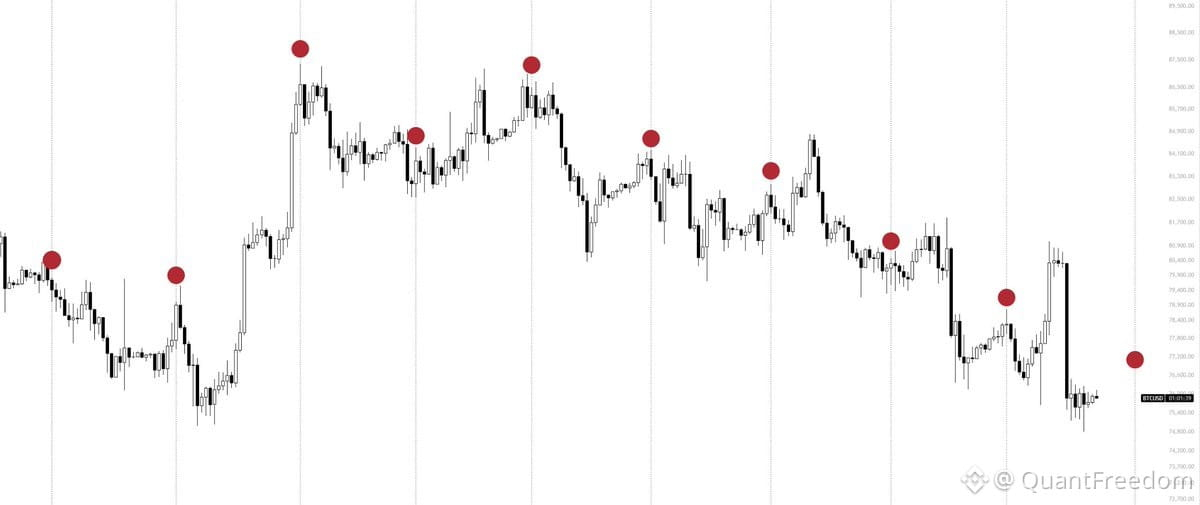
$BTCにとって、月曜日は散々な展開が続いています。
ここ2か月のパターンは明らかです。月曜日に上昇して高値を付けても、ほぼ毎回その上げ幅がすべて打ち消されています。目先の高値まで上げたあと、再び下落する展開です。
来週、本当にさらに上を目指すなら、月曜日の高値をサポートに転換し、週の残りの期間も維持する必要があります。そこが見極めのポイントです。
サポートへの転換がなければ、上昇の続きもありません。その水準に注目してください。上昇の確認となるか、またしてもだましとなるかの分かれ目です。
$BTCにとって、月曜日は散々な展開が続いています。
ここ2か月のパターンは明らかです。月曜日に上昇して高値を付けても、ほぼ毎回その上げ幅がすべて打ち消されています。目先の高値まで上げたあと、再び下落する展開です。
来週、本当にさらに上を目指すなら、月曜日の高値をサポートに転換し、週の残りの期間も維持する必要があります。そこが見極めのポイントです。
サポートへの転換がなければ、上昇の続きもありません。その水準に注目してください。上昇の確認となるか、またしてもだましとなるかの分かれ目です。
ここ2か月のパターンは明らかです。月曜日に上昇して高値を付けても、ほぼ毎回その上げ幅がすべて打ち消されています。目先の高値まで上げたあと、再び下落する展開です。
来週、本当にさらに上を目指すなら、月曜日の高値をサポートに転換し、週の残りの期間も維持する必要があります。そこが見極めのポイントです。
サポートへの転換がなければ、上昇の続きもありません。その水準に注目してください。上昇の確認となるか、またしてもだましとなるかの分かれ目です。
1
680
ログインして、さらにコンテンツを読む
厳選トピックで世界の暗号資産トレーダーの仲間入り
⚡️ 暗号資産に関する最新かつ有益な情報が見つかります。
💬 世界最大の暗号資産取引所から信頼されています。
👍 認証を受けたクリエイターから、有益なインサイトを得られます。
メール / 電話番号