

OMI_ST
47 投稿

OMI_ST
報告
ユーザーをブロック
取引を発注
高頻度トレーダー
5.7年
0 フォロー
42 フォロワー
79 いいね
投稿
ポートフォリオ
すべて
引用
·
--
翻訳参照
TECHNICALLY!!Technical Analysis & Structure
Macro Context (Weekly Chart): The token experienced a massive initial run-up toward 0.0120 followed by a prolonged, brutal downtrend down to the 0.0013 low area.
Trendline Breakout Attempt: You have drawn a descending trendline connecting the recent lower highs. Current weekly price action (0.002318, up +74%) is attempting a breakout above this resistance trendline.
Support Level: The dashed horizontal blue line around 0.002296 acts as the immediate structural pivot/retest level.
Technical Strengths & Key Risks
Bullish Factors
High-Timeframe Breakout Signal: Breaking a downtrend on the Weekly timeframe carries significantly more weight than low-timeframe setups (like 15m).
Volume & Momentum: A strong green weekly candle (+74%) breaking past multi-month resistance shows strong buyer interest rebounding off macro bottom levels (~0.0013).
Risk Factors
Unclosed Weekly Candle: Since this is on the 1w timeframe, the candle is still active. A rejection before weekly close can turn this into a long upper wick (fakeout/bull trap).
Immediate Heavy Resistance Overhead:
Previous lower high consolidation sits around 0.0035 – 0.0040.
Strong structural resistance sits at 0.0060.
Potential Trading Scenarios
Scenario 1: Long Position (Breakout & Retest)
Entry Concept: Wait for the weekly candle to close firmly above the trendline (~0.002300), or enter on a lower-timeframe (1H/4H) retest of the 0.002200 – 0.002300 support zone.
Stop Loss (SL): Placed below the recent swing low / back inside the trendline structure (around 0.001800 - 0.001900).
Take Profit Targets:
TP1: 0.003500 – 0.003800 (First major resistance cluster)
TP2: 0.005800 – 0.006000 (Macro supply zone)
Scenario 2: Short Position (Fakeout / Rejection)
Entry Concept: If the 4H/1D candles start closing back below 0.002200, signaling a fake breakout above the weekly trendline.
Stop Loss (SL): Placed above the weekly wick high (~0.002450 - 0.002500).
Take Profit Targets:
TP1: 0.001800
TP2: 0.001350 (Macro range low)
#DYOR🟢
TECHNICALLY!!
Technical Analysis & Structure
Macro Context (Weekly Chart): The token experienced a massive initial run-up toward 0.0120 followed by a prolonged, brutal downtrend down to the 0.0013 low area.
Trendline Breakout Attempt: You have drawn a descending trendline connecting the recent lower highs. Current weekly price action (0.002318, up +74%) is attempting a breakout above this resistance trendline.
Support Level: The dashed horizontal blue line around 0.002296 acts as the immediate structural pivot/retest level.
Technical Strengths & Key Risks
Bullish Factors
High-Timeframe Breakout Signal: Breaking a downtrend on the Weekly timeframe carries significantly more weight than low-timeframe setups (like 15m).
Volume & Momentum: A strong green weekly candle (+74%) breaking past multi-month resistance shows strong buyer interest rebounding off macro bottom levels (~0.0013).
Risk Factors
Unclosed Weekly Candle: Since this is on the 1w timeframe, the candle is still active. A rejection before weekly close can turn this into a long upper wick (fakeout/bull trap).
Immediate Heavy Resistance Overhead:
Previous lower high consolidation sits around 0.0035 – 0.0040.
Strong structural resistance sits at 0.0060.
Potential Trading Scenarios
Scenario 1: Long Position (Breakout & Retest)
Entry Concept: Wait for the weekly candle to close firmly above the trendline (~0.002300), or enter on a lower-timeframe (1H/4H) retest of the 0.002200 – 0.002300 support zone.
Stop Loss (SL): Placed below the recent swing low / back inside the trendline structure (around 0.001800 - 0.001900).
Take Profit Targets:
TP1: 0.003500 – 0.003800 (First major resistance cluster)
TP2: 0.005800 – 0.006000 (Macro supply zone)
Scenario 2: Short Position (Fakeout / Rejection)
Entry Concept: If the 4H/1D candles start closing back below 0.002200, signaling a fake breakout above the weekly trendline.
Stop Loss (SL): Placed above the weekly wick high (~0.002450 - 0.002500).
Take Profit Targets:
TP1: 0.001800
TP2: 0.001350 (Macro range low)
#DYOR🟢
186
·
--
弱気相場
翻訳参照
#JCTUSDT
Technical Analysis & Pattern Breakdown
Pattern Identified: You have drawn an Ascending Triangle or a Bullish Pennant / Flag following a massive upward impulse (the price is up +136% on the day).
Resistance Zone: Horizontal resistance is forming around the 0.004850 – 0.005000 area (peaks B & D).
Support Trendline: Higher lows (A & C) are forming along an ascending trendline, showing strong buying pressure on dips.
Technical Strengths & Risks
Pros (Bullish Factors)
Consolidation after Expansion: A high-volatility surge (+130%+) followed by tight consolidation near the highs usually signals continuation rather than immediate reversal.
Higher Lows: Buyers are defending higher price levels aggressively (Point C is significantly higher than Point A).
Cons & Key Risks (Bearish/Cautionary Factors)
Extreme Volatility: Low-cap / high-percentage gainers on 15m charts carry high risk of fakeouts (wicks above resistance followed by sharp dumps).
Double Top / Resistance Rejection Risk: Until a clear candle closes above 0.004850 - 0.005000, the resistance line remains strong, and price could reject back down toward trendline support or lower (~0.003410).
Potential Trade Execution Strategies
Scenario 1: Breakout Confirmation (Safer Long Entry)
Entry: Wait for a 15m candle close above 0.004850 - 0.005000 with healthy volume.
Stop Loss (SL): Placed back inside the triangle (e.g., around 0.004350 - 0.004400).
Take Profit (TP): Target the measured move height of the triangle base (~0.006000 – 0.006500).
Scenario 2: Rejection / Short Setup (If Resistance Holds)
Entry: If price gets rejected sharply at 0.004850 - 0.005000 with a bearish reversal candle (e.g., Shooting Star or Bearish Engulfing).
Stop Loss (SL): Placed just above the recent high (~0.004950 - 0.005050).
Take Profit (TP): Target 1 at trendline support (~0.004200), Target 2 at primary horizontal support (~0.003410).
#DYOR🟢
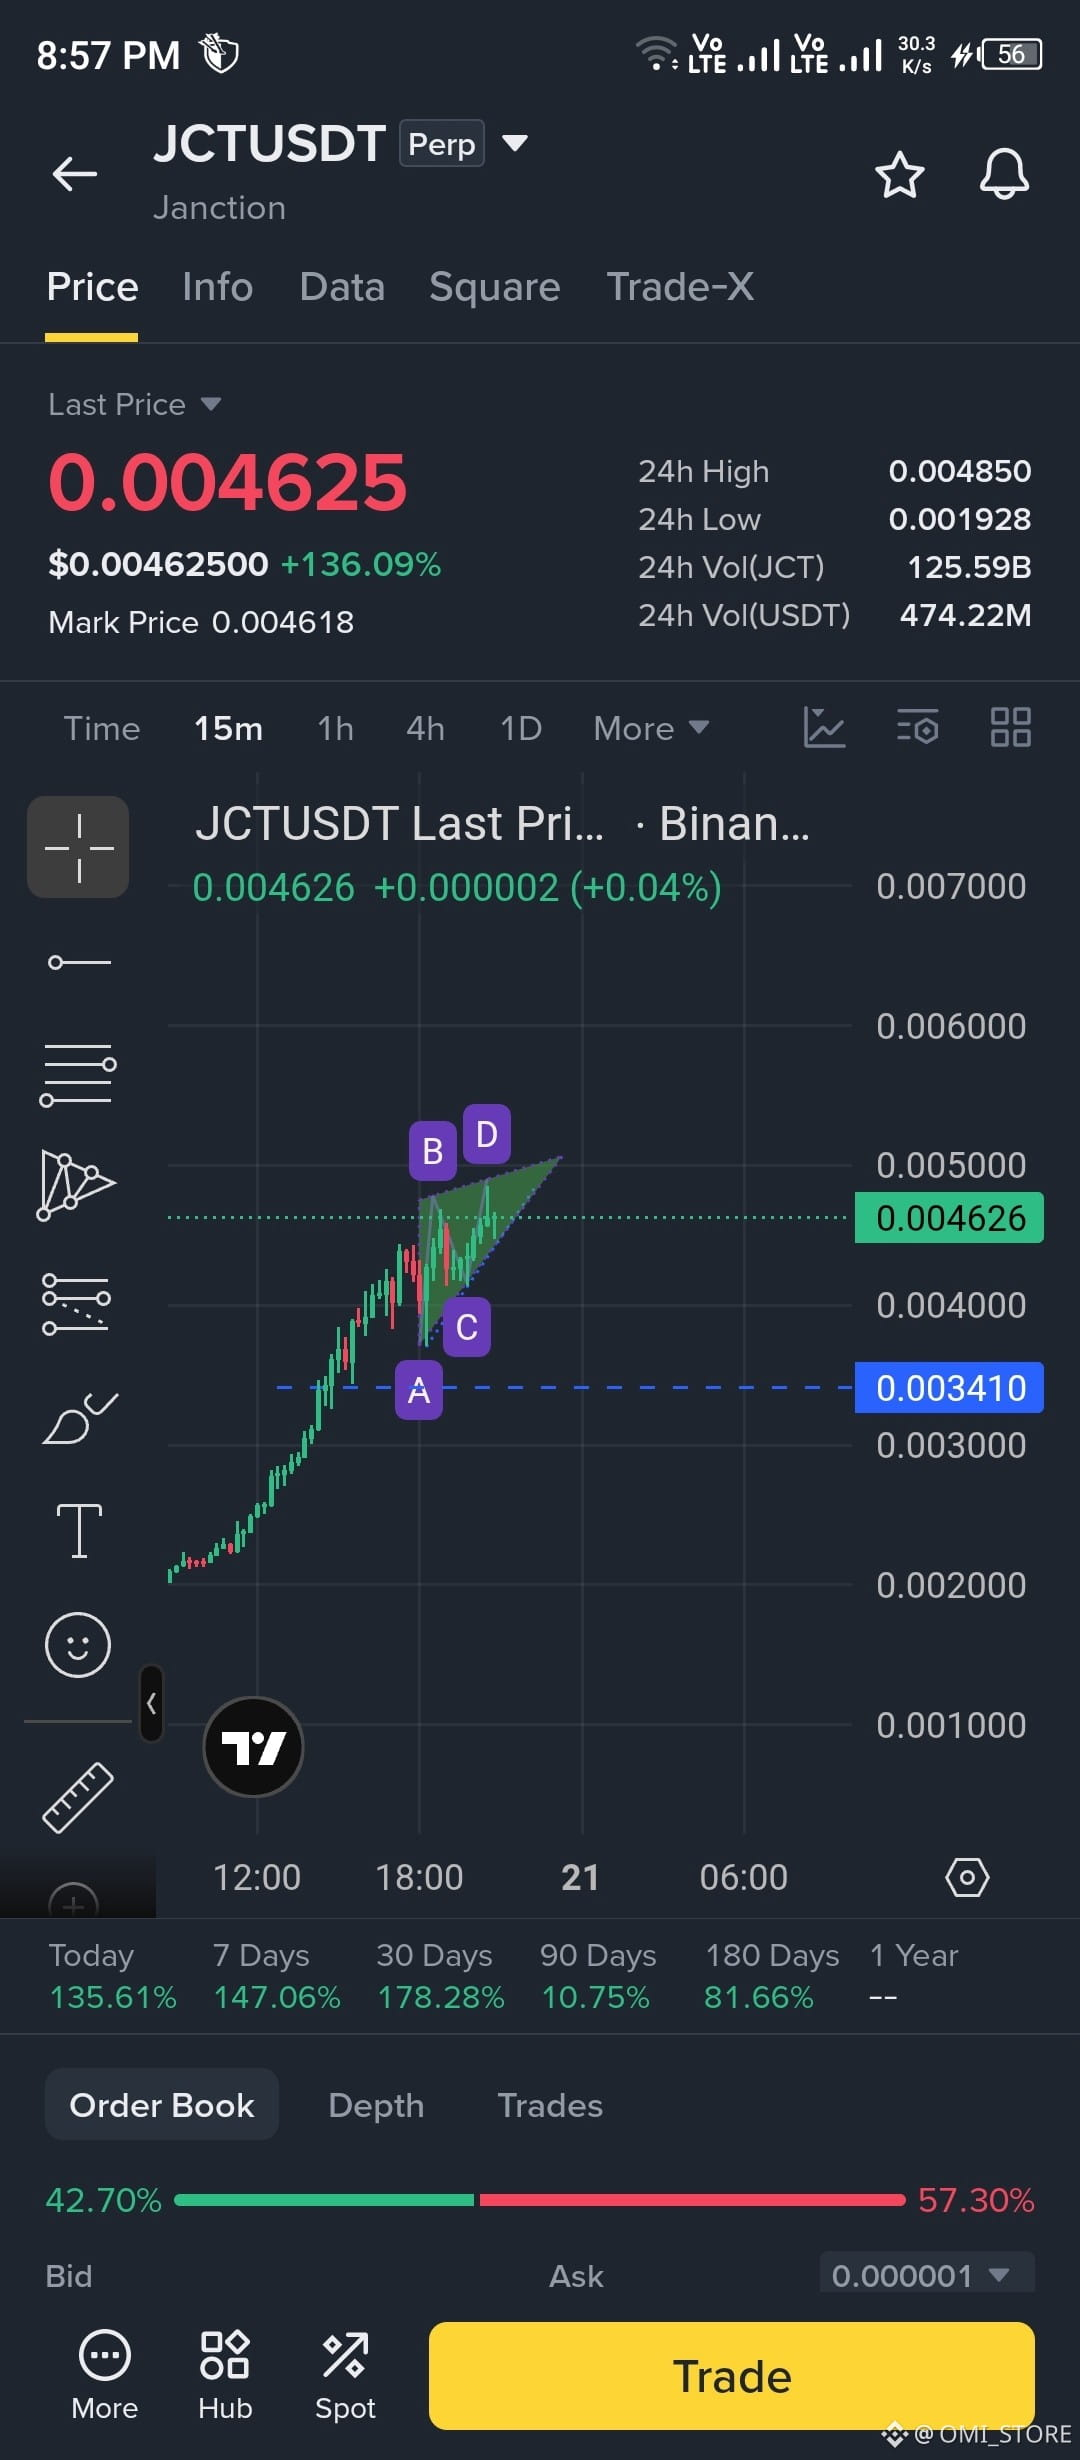
476
·
--
#vanar $VANRY
実行は人間がユーザーであるときに機能しました。
エージェントが支配すると壊れます。
私たちのCOOアッシュ(@AshVanar)が、ステートレスシステムがどのように厳しい限界に達し、次に何を変える必要があるかを説明します。
https://x.com/AshVanar/status/2016841839395983801
#vanar $VANRY
実行は人間がユーザーであるときに機能しました。
エージェントが支配すると壊れます。
私たちのCOOアッシュ(@AshVanar)が、ステートレスシステムがどのように厳しい限界に達し、次に何を変える必要があるかを説明します。
https://x.com/AshVanar/status/2016841839395983801
実行は人間がユーザーであるときに機能しました。
エージェントが支配すると壊れます。
私たちのCOOアッシュ(@AshVanar)が、ステートレスシステムがどのように厳しい限界に達し、次に何を変える必要があるかを説明します。
https://x.com/AshVanar/status/2016841839395983801

1
7
·
--
弱気相場
私のBTC分析の正確な市場の下落をチェックしてください。
だから、誰かが私の分析に気づくことを願っています。グッドラック🍀
コインの分析を希望する方は、コメントしてください。私は🙋すぐに分析を投稿します❤
私のBTC分析の正確な市場の下落をチェックしてください。
だから、誰かが私の分析に気づくことを願っています。グッドラック🍀
コインの分析を希望する方は、コメントしてください。私は🙋すぐに分析を投稿します❤
だから、誰かが私の分析に気づくことを願っています。グッドラック🍀
コインの分析を希望する方は、コメントしてください。私は🙋すぐに分析を投稿します❤
OMI_ST
·
--
弱気相場ここに私の短い分析があります 🆎暗号市場について
現在、BTCは84Kの周りを動いています
今、私はそれが72Kのようにもっと下がることを期待しています、そしてBTCは再び良くなることができます 🍀 $BTC
現在、BTCは84Kの周りを動いています
今、私はそれが72Kのようにもっと下がることを期待しています、そしてBTCは再び良くなることができます 🍀 $BTC


11
·
--
弱気相場
速報:
ドバイに移動する必要はありません。今では金と銀でブルジュ・ハリファを見ることができます。😅
損失が出ている方には申し訳ありません。
速報:
ドバイに移動する必要はありません。今では金と銀でブルジュ・ハリファを見ることができます。😅
損失が出ている方には申し訳ありません。
ドバイに移動する必要はありません。今では金と銀でブルジュ・ハリファを見ることができます。😅
損失が出ている方には申し訳ありません。

1
11
·
--
ここに私の予測に基づくビットコイン分析があります。ビットコインが80,000ドルを突破しなければ、現在ほぼ163,000ドルでATHを簡単に更新することができます。
あなたの提案を教えてください。$BTC
{spot}(BTCUSDT)
ここに私の予測に基づくビットコイン分析があります。ビットコインが80,000ドルを突破しなければ、現在ほぼ163,000ドルでATHを簡単に更新することができます。
あなたの提案を教えてください。$BTC
あなたの提案を教えてください。$BTC

1
31


·
--
ブリッシュ
#kiteusdt 現在ブレイクアウト中です。迅速な利益を得られることを願っています。
他の詳細は、スクリーンショットのエントリーまたはエグジットを参照してください。
#kiteusdt 現在ブレイクアウト中です。迅速な利益を得られることを願っています。
他の詳細は、スクリーンショットのエントリーまたはエグジットを参照してください。
他の詳細は、スクリーンショットのエントリーまたはエグジットを参照してください。

339
·
--
私は会いたい 🥲 私は7$ に入りますが、ほんの少し$ の利益のために🥲
私は会いたい 🥲 私は7$ に入りますが、ほんの少し$ の利益のために🥲

Cowabungadingdong
·
--
$MLN 50$ すぐに
i told you at 7$
i told you at 7$
2
·
--
弱気相場
#SquareMentionsHeatwave
ここに#INUUSDT #INU #inuprice があります
今、私たちは0.2-0.14$ の周りの下落エリアに引き戻しを見ることができます。もっと多くのダンプがすぐにあるかもしれないので、ロングを避けてストップロスを入れてください
いいねとコメントをフォローしてください
任意のコイン分析について無料です
#SquareMentionsHeatwave
ここに#INUUSDT #INU #inuprice があります
今、私たちは0.2-0.14$ の周りの下落エリアに引き戻しを見ることができます。もっと多くのダンプがすぐにあるかもしれないので、ロングを避けてストップロスを入れてください
いいねとコメントをフォローしてください
任意のコイン分析について無料です
ここに#INUUSDT #INU #inuprice があります
今、私たちは0.2-0.14$ の周りの下落エリアに引き戻しを見ることができます。もっと多くのダンプがすぐにあるかもしれないので、ロングを避けてストップロスを入れてください
いいねとコメントをフォローしてください
任意のコイン分析について無料です

1
14


·
--
ブリッシュ
##bank #BAN #bankusdt #BTC #BNBBreaksATH
ここではbankusdtについてのいくつかの分析があります。p
少しのブレイクアウトを見て、その後0.33$以上に上昇するでしょう。
私の分析で利益を上げた場合は、ぜひサポートしてください。そうすれば、もっとお伝えします。
78217913
OMI_STORE
##bank #BAN #bankusdt #BTC #BNBBreaksATH
ここではbankusdtについてのいくつかの分析があります。p
少しのブレイクアウトを見て、その後0.33$以上に上昇するでしょう。
私の分析で利益を上げた場合は、ぜひサポートしてください。そうすれば、もっとお伝えします。
78217913
OMI_STORE
ここではbankusdtについてのいくつかの分析があります。p
少しのブレイクアウトを見て、その後0.33$以上に上昇するでしょう。
私の分析で利益を上げた場合は、ぜひサポートしてください。そうすれば、もっとお伝えします。
78217913
OMI_STORE

2
96
·
--
#coaiusdt #CoaiTradingCompetition #COAIUSD
ここに##COAI についての小さな分析があります。
常に損切りを設定してください。私たちは9ドル以上まで見ることができます。
ビットコインが下落した後、地球に向かって下がるでしょう。
#coaiusdt #CoaiTradingCompetition #COAIUSD
ここに##COAI についての小さな分析があります。
常に損切りを設定してください。私たちは9ドル以上まで見ることができます。
ビットコインが下落した後、地球に向かって下がるでしょう。
ここに##COAI についての小さな分析があります。
常に損切りを設定してください。私たちは9ドル以上まで見ることができます。
ビットコインが下落した後、地球に向かって下がるでしょう。

1
425
·
--
ブリッシュ
ここには#AIAUSDT が大物のためにあります
トレンドも見ることができますが、ここには巨大なポンプもあります。少なくとも4$+++がすぐに見られるでしょう。そうでなければ、赤いラインの向こうにストップロスを追加して、機会をつかんでください。幸運を祈ります🍀#BNBBreaksATH #BNBBreaksATH #AITokensRally #ETHBreaks3700
支持を示すためにフォロー、いいね、シェアしてください
ここには#AIAUSDT が大物のためにあります
トレンドも見ることができますが、ここには巨大なポンプもあります。少なくとも4$+++がすぐに見られるでしょう。そうでなければ、赤いラインの向こうにストップロスを追加して、機会をつかんでください。幸運を祈ります🍀#BNBBreaksATH #BNBBreaksATH #AITokensRally #ETHBreaks3700
支持を示すためにフォロー、いいね、シェアしてください
トレンドも見ることができますが、ここには巨大なポンプもあります。少なくとも4$+++がすぐに見られるでしょう。そうでなければ、赤いラインの向こうにストップロスを追加して、機会をつかんでください。幸運を祈ります🍀#BNBBreaksATH #BNBBreaksATH #AITokensRally #ETHBreaks3700
支持を示すためにフォロー、いいね、シェアしてください

2
516
·
--
ブリッシュ
$HYPER 私は正しい場所にいます 今すぐ注文をし、そして大きな利益を得てください
エントリー mine 0.4965
私の tp
0.55
0.60
0.65
DYOR これは私の計画であり、私の利益損失です。まず自分で調査を行い、盲目的な犬のように転ばないでください。
$HYPER 私は正しい場所にいます 今すぐ注文をし、そして大きな利益を得てください
エントリー mine 0.4965
私の tp
0.55
0.60
0.65
DYOR これは私の計画であり、私の利益損失です。まず自分で調査を行い、盲目的な犬のように転ばないでください。
エントリー mine 0.4965
私の tp
0.55
0.60
0.65
DYOR これは私の計画であり、私の利益損失です。まず自分で調査を行い、盲目的な犬のように転ばないでください。

1
1
2
318
ログインして、さらにコンテンツを読む
厳選トピックで世界の暗号資産トレーダーの仲間入り
⚡️ 暗号資産に関する最新かつ有益な情報が見つかります。
💬 世界最大の暗号資産取引所から信頼されています。
👍 認証を受けたクリエイターから、有益なインサイトを得られます。
メール / 電話番号
トレンドトピック
UniswapA16zSeekDeFiExemptionFromIllinoisCryptoTax
閲覧回数 22,332
724人が討論中
#CryptoTax 🚨 暗号資産市場・規制動向アップデート #HKDollarStablecoinHKDAPToLaunchOnSolana
#uniswapa16zseekdefiexemptionfromillinoiscryptotax Uniswap、a16z、DeFi Education Fundがイリノイ州の暗号資産税規則に異議
2026年10月30日 | 市場の変動と業界の動向
📊 1. 市場スナップショット
暗号資産市場はまちまちの動きを見せており、一部の資産が大幅に上昇する一方、複数の主要暗号資産は引き続き下落圧力にさらされています。
📈 主な上昇銘柄
SOPH: +60.81% — $0.00238
BEAMX: +37.94% — $0.004701
SKDDB: +16.81% — $9.38
📉 主な下落銘柄
INTWUSDT: −61.09% — $6.72
AKEUSDT: −31.47% — $0.013989
SNXXUSDT: −30.71% — $6.43
🔎 下落圧力にさらされる主要暗号資産
DOGE: −5.06%
PEPE: −4.91%
SUI: −4.83%
NEAR: −3.28%
XRP: −3.13%
Uniswap Labs、Andreessen Horowitz(a16z)、およびDeFi Education Fund(DEF)は、イリノイ州の適用除外を求めています。
#Uniswap #a16z #DeFi #CryptoRegulation #Illinois # #Web3 #BinanceSquare
#HKDollarStablecoinHKDAPToLaunchOnSolana #HKDAP #Stablecoin #CryptoNews #Blockchain #DeFi #DigitalPayments
⚖️ 3. UNISWAP、a16z、イリノイ州の暗号資産税規則
Uniswap Labs、Andreessen Horowitz(a16z)、およびDeFi Education Fundは、イリノイ州で提案されている暗号資産税の要件について、適用除外を求める取り組みに関わっています。
この議論では、重要な問いが浮き彫りになっています。従来型の金融仲介機関のようには運営されていない可能性のある分散型の事業者に、税務報告義務をどのように適用すべきでしょうか。
その結果は、DeFiのコンプライアンス、開発者の義務、そして今後の規制環境に影響を及ぼす可能性があります。
#BinanceSquare #CryptoNews #HKDAP #Stablecoin #Uniswap #a16z #DeFi #CryptoTax
CHASEPA SULUXù
·いいね:2件
·閲覧回数 156
HKDollarStablecoinHKDAPToLaunchOnSolana
閲覧回数 18,102
463人が討論中
$1.5BInLeveragedCryptoBetsLiquidated
閲覧回数 36,356
242人が討論中