

Odunerd
54 投稿

Odunerd
報告
ユーザーをブロック
BP-24948D0AD5FF
94 フォロー
432 フォロワー
1.3K+ いいね
投稿
すべて
引用
PINNED
·
--
ブリッシュ
多くの場合、私たちは自分の信念を無視し、それが現実になると叫んでしまいます😬 しまった。
TA と FA の他に、感情分析と呼ばれるものがあります
暗号通貨業界の特定の物語について、あなたはどのような感情を抱いていますか。また、あなたの感情は、良いか悪いか、どのような影響を与えますか?
つまり、強気か弱気か、重要なのはあなたの心の状態であり、チャートや MM がそこに何を出しているかだけではありません。
集中し続けてください🤳
私が自分の信念を駆り立てているトークン
#memes
#L2s
#AI
#exchtokens
多くの場合、私たちは自分の信念を無視し、それが現実になると叫んでしまいます😬 しまった。
TA と FA の他に、感情分析と呼ばれるものがあります
暗号通貨業界の特定の物語について、あなたはどのような感情を抱いていますか。また、あなたの感情は、良いか悪いか、どのような影響を与えますか?
つまり、強気か弱気か、重要なのはあなたの心の状態であり、チャートや MM がそこに何を出しているかだけではありません。
集中し続けてください🤳
私が自分の信念を駆り立てているトークン
#memes
#L2s
#AI
#exchtokens
TA と FA の他に、感情分析と呼ばれるものがあります
暗号通貨業界の特定の物語について、あなたはどのような感情を抱いていますか。また、あなたの感情は、良いか悪いか、どのような影響を与えますか?
つまり、強気か弱気か、重要なのはあなたの心の状態であり、チャートや MM がそこに何を出しているかだけではありません。
集中し続けてください🤳
私が自分の信念を駆り立てているトークン
#memes
#L2s
#AI
#exchtokens

3
8
2.5k
·
--
かろうじて生き延びて、なんとか立ち直ろうとしているトークン——これはリップル一家にとって今かなり厳しい状況です..
#BitgetHackerMoves$83MStolenXRP
かろうじて生き延びて、なんとか立ち直ろうとしているトークン——これはリップル一家にとって今かなり厳しい状況です..
#BitgetHackerMoves$83MStolenXRP
#BitgetHackerMoves$83MStolenXRP
351
·
--
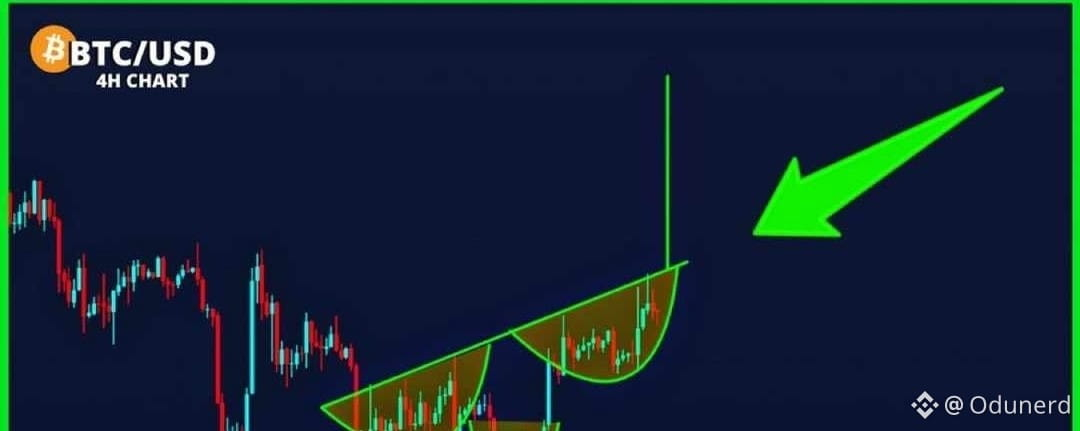
記事
翻訳参照
BITCOIN INCONSISTENCIES ANALYTICAL PROVEN..Was June 30, 2026 the Bitcoin Cycle Bottom?
One question has been sitting at the center of my Bitcoin analysis:
Did Bitcoin actually find its cycle bottom on June 30, 2026?
Rather than relying on the chart alone, I approached the question from two sides:
Market structure + on-chain and market data.
1. Starting With Price Action
I deliberately kept the technical analysis simple.
No complicated indicators.
Just price structure.
Bitcoin reached a low of approximately $58.53K on June 30.
Since then, the market has behaved differently from the downtrend that led into that low.
On the daily chart, $BTC moved away from the June low and entered a period of consolidation before beginning to form a sequence of higher highs and higher lows.
The weekly chart adds another important piece of context.
The June low has remained intact, while Bitcoin has recovered substantially from that level.
That is certainly worth paying attention to.
But there is an important distinction:
A strong recovery from a low does not, by itself, prove that the cycle bottom is in.
So I went deeper.
2. Looking Beneath the Chart
To test the June low from a data perspective, I built a framework around several metrics and historical comparisons:
- MVRV
- Bitcoin Realized Price
- ETF flows
- Historical cycle bottoms
- Peak-to-bottom drawdowns
- Post-bottom recovery behaviour
The objective wasn't to find one magic indicator.
Instead, I wanted to see whether multiple independent pieces of evidence were pointing toward the same conclusion.
Key numbers from the analysis
$58.53K — June 30 low
-53.11% — Peak-to-bottom drawdown
1.47 — Current MVRV
$53.19K — Realized Price
+30.52% — Recovery from the June low at the time of the analysis
When these figures are placed alongside historical Bitcoin cycle behaviour, the June 30 low starts to look increasingly significant.
3. What Does the Evidence Actually Tell Us?
The analysis suggests that June 30 is a credible candidate for the cycle bottom.
But there is an important caveat:
A candidate bottom is not the same thing as a confirmed cycle bottom.
Bitcoin has historically experienced significant recoveries that were later followed by another major move lower.
That's why I don't think one should look at the June low in isolation.
The more interesting observation is that both price structure and the underlying data are pointing toward a potential change in market behaviour around that period.
Price is showing a different structure.
The on-chain and market data provide additional evidence worth investigating.
But the higher-timeframe cycle still needs to prove itself.
4. Why Combine Technical Analysis With Data Analytics?
This is actually the bigger lesson behind the research.
The chart tells us what price is doing.
But data can help us investigate what may be happening underneath the price.
Instead of asking:
«"Does the chart look bullish?"»
The better analytical question becomes:
"Do multiple independent datasets support the same market hypothesis?"
That shift changes the way I approach crypto research.
Rather than relying on a single indicator or prediction, I want to combine:
Price → On-chain data → Historical behaviour → Market flows → Statistical context
Then let the evidence tell the story.
So, was June 30, 2026 the Bitcoin cycle bottom?
It is a credible candidate — but the data does not make it a confirmed fact yet.
For me, that's where the research becomes interesting.
The goal isn't to predict the market with certainty.
It's to identify important market events, collect the relevant data, test the hypothesis, and continue monitoring whether the evidence holds.
PS: I've put together the full research, dashboard, and methodology for anyone interested in going through the analysis from start to finish.
BITCOIN INCONSISTENCIES ANALYTICAL PROVEN..
Was June 30, 2026 the Bitcoin Cycle Bottom?
One question has been sitting at the center of my Bitcoin analysis:
Did Bitcoin actually find its cycle bottom on June 30, 2026?
Rather than relying on the chart alone, I approached the question from two sides:
Market structure + on-chain and market data.
1. Starting With Price Action
I deliberately kept the technical analysis simple.
No complicated indicators.
Just price structure.
Bitcoin reached a low of approximately $58.53K on June 30.
Since then, the market has behaved differently from the downtrend that led into that low.
On the daily chart, $BTC moved away from the June low and entered a period of consolidation before beginning to form a sequence of higher highs and higher lows.
The weekly chart adds another important piece of context.
The June low has remained intact, while Bitcoin has recovered substantially from that level.
That is certainly worth paying attention to.
But there is an important distinction:
A strong recovery from a low does not, by itself, prove that the cycle bottom is in.
So I went deeper.
2. Looking Beneath the Chart
To test the June low from a data perspective, I built a framework around several metrics and historical comparisons:
- MVRV
- Bitcoin Realized Price
- ETF flows
- Historical cycle bottoms
- Peak-to-bottom drawdowns
- Post-bottom recovery behaviour
The objective wasn't to find one magic indicator.
Instead, I wanted to see whether multiple independent pieces of evidence were pointing toward the same conclusion.
Key numbers from the analysis
$58.53K — June 30 low
-53.11% — Peak-to-bottom drawdown
1.47 — Current MVRV
$53.19K — Realized Price
+30.52% — Recovery from the June low at the time of the analysis
When these figures are placed alongside historical Bitcoin cycle behaviour, the June 30 low starts to look increasingly significant.
3. What Does the Evidence Actually Tell Us?
The analysis suggests that June 30 is a credible candidate for the cycle bottom.
But there is an important caveat:
A candidate bottom is not the same thing as a confirmed cycle bottom.
Bitcoin has historically experienced significant recoveries that were later followed by another major move lower.
That's why I don't think one should look at the June low in isolation.
The more interesting observation is that both price structure and the underlying data are pointing toward a potential change in market behaviour around that period.
Price is showing a different structure.
The on-chain and market data provide additional evidence worth investigating.
But the higher-timeframe cycle still needs to prove itself.
4. Why Combine Technical Analysis With Data Analytics?
This is actually the bigger lesson behind the research.
The chart tells us what price is doing.
But data can help us investigate what may be happening underneath the price.
Instead of asking:
«"Does the chart look bullish?"»
The better analytical question becomes:
"Do multiple independent datasets support the same market hypothesis?"
That shift changes the way I approach crypto research.
Rather than relying on a single indicator or prediction, I want to combine:
Price → On-chain data → Historical behaviour → Market flows → Statistical context
Then let the evidence tell the story.
So, was June 30, 2026 the Bitcoin cycle bottom?
It is a credible candidate — but the data does not make it a confirmed fact yet.
For me, that's where the research becomes interesting.
The goal isn't to predict the market with certainty.
It's to identify important market events, collect the relevant data, test the hypothesis, and continue monitoring whether the evidence holds.
PS: I've put together the full research, dashboard, and methodology for anyone interested in going through the analysis from start to finish.
One question has been sitting at the center of my Bitcoin analysis:
Did Bitcoin actually find its cycle bottom on June 30, 2026?
Rather than relying on the chart alone, I approached the question from two sides:
Market structure + on-chain and market data.
1. Starting With Price Action
I deliberately kept the technical analysis simple.
No complicated indicators.
Just price structure.
Bitcoin reached a low of approximately $58.53K on June 30.
Since then, the market has behaved differently from the downtrend that led into that low.
On the daily chart, $BTC moved away from the June low and entered a period of consolidation before beginning to form a sequence of higher highs and higher lows.
The weekly chart adds another important piece of context.
The June low has remained intact, while Bitcoin has recovered substantially from that level.
That is certainly worth paying attention to.
But there is an important distinction:
A strong recovery from a low does not, by itself, prove that the cycle bottom is in.
So I went deeper.
2. Looking Beneath the Chart
To test the June low from a data perspective, I built a framework around several metrics and historical comparisons:
- MVRV
- Bitcoin Realized Price
- ETF flows
- Historical cycle bottoms
- Peak-to-bottom drawdowns
- Post-bottom recovery behaviour
The objective wasn't to find one magic indicator.
Instead, I wanted to see whether multiple independent pieces of evidence were pointing toward the same conclusion.
Key numbers from the analysis
$58.53K — June 30 low
-53.11% — Peak-to-bottom drawdown
1.47 — Current MVRV
$53.19K — Realized Price
+30.52% — Recovery from the June low at the time of the analysis
When these figures are placed alongside historical Bitcoin cycle behaviour, the June 30 low starts to look increasingly significant.
3. What Does the Evidence Actually Tell Us?
The analysis suggests that June 30 is a credible candidate for the cycle bottom.
But there is an important caveat:
A candidate bottom is not the same thing as a confirmed cycle bottom.
Bitcoin has historically experienced significant recoveries that were later followed by another major move lower.
That's why I don't think one should look at the June low in isolation.
The more interesting observation is that both price structure and the underlying data are pointing toward a potential change in market behaviour around that period.
Price is showing a different structure.
The on-chain and market data provide additional evidence worth investigating.
But the higher-timeframe cycle still needs to prove itself.
4. Why Combine Technical Analysis With Data Analytics?
This is actually the bigger lesson behind the research.
The chart tells us what price is doing.
But data can help us investigate what may be happening underneath the price.
Instead of asking:
«"Does the chart look bullish?"»
The better analytical question becomes:
"Do multiple independent datasets support the same market hypothesis?"
That shift changes the way I approach crypto research.
Rather than relying on a single indicator or prediction, I want to combine:
Price → On-chain data → Historical behaviour → Market flows → Statistical context
Then let the evidence tell the story.
So, was June 30, 2026 the Bitcoin cycle bottom?
It is a credible candidate — but the data does not make it a confirmed fact yet.
For me, that's where the research becomes interesting.
The goal isn't to predict the market with certainty.
It's to identify important market events, collect the relevant data, test the hypothesis, and continue monitoring whether the evidence holds.
PS: I've put together the full research, dashboard, and methodology for anyone interested in going through the analysis from start to finish.
1
62
·
--
ブリッシュ
$ARB
$ZAMA
$SUI
代替(アルト)は目覚めつつありますが、一部のトークンの回復率はいまだにその勢い(モメンタム)に一致していません。
$ARB
$ZAMA
$SUI
代替(アルト)は目覚めつつありますが、一部のトークンの回復率はいまだにその勢い(モメンタム)に一致していません。
$ZAMA
$SUI
代替(アルト)は目覚めつつありますが、一部のトークンの回復率はいまだにその勢い(モメンタム)に一致していません。
1
594
·
--
私のためにダークモードをいつでもどんな方法でも持ってきてください。本当にライトモードが引き起こしたダメージにはもっと注意を払う必要があります。
私のためにダークモードをいつでもどんな方法でも持ってきてください。本当にライトモードが引き起こしたダメージにはもっと注意を払う必要があります。

Odunerd
·
--
ブリッシュ開発者として学習し、コーディングしているとき、画面上ではどの画面を好みますか。
▪︎明るい画面
▪︎暗い画面
お話ししましょう。
▪︎明るい画面
▪︎暗い画面
お話ししましょう。
1
6
·
--
#StockMarketCrash 戦争の影響は確実に今見ているものの後に展開されます。これは人々を誘い込むための餌です。
#StockMarketCrash 戦争の影響は確実に今見ているものの後に展開されます。これは人々を誘い込むための餌です。
1
53
·
--
ブリッシュ
ビットコインが73,000ドルに達することは、到達感を感じるための基準ではなく、現在市場のスパイクを引き起こしているのは、在庫の$BTCの量であり、戦争はマイナーを気を散らせていると言える。
ビットコインが73,000ドルに達することは、到達感を感じるための基準ではなく、現在市場のスパイクを引き起こしているのは、在庫の$BTCの量であり、戦争はマイナーを気を散らせていると言える。
1
65
·
--
彼らは本当にその地位にいる全員を無力化した
彼らは本当にその地位にいる全員を無力化した

Tyler Oliveira
·
--
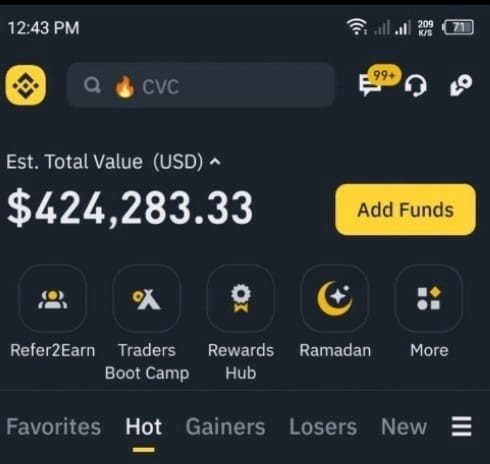
数時間前に私の口座には120万ドルがありました💔😭
$POWER でほぼ80万ドルを失いました。この損失をどうやって取り戻せますか??😰
私は$RIVER を購入しています📈✅
$POWER でほぼ80万ドルを失いました。この損失をどうやって取り戻せますか??😰
私は$RIVER を購入しています📈✅

1
16
·
--
ブリッシュ
ここで$KAITOに対して同様に強気です
ここで$KAITOに対して同様に強気です


CoinQuest
·
--
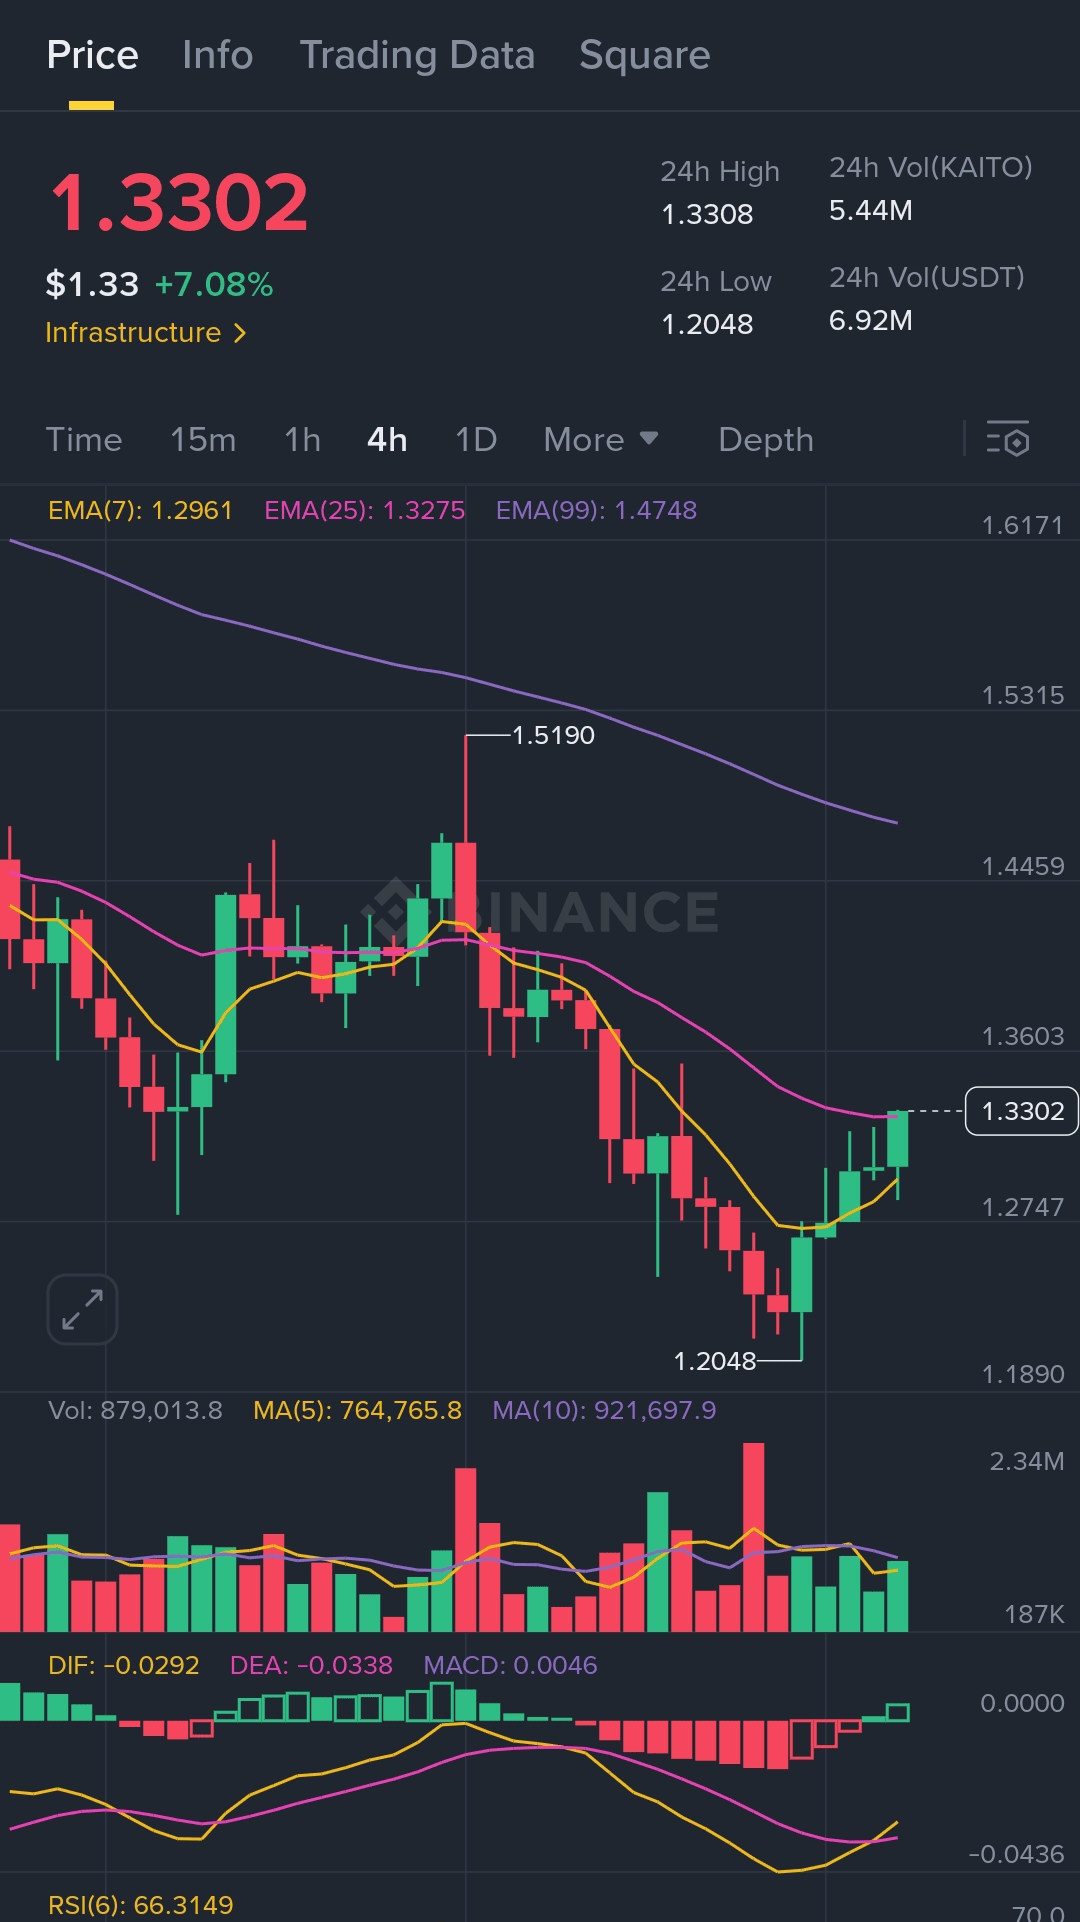
ブリッシュ$KAITO 動いているブレイクアウト構造 ✅
KAITOはボリューム確認で抵抗を突破し、クリーンな高値を形成しており、ブルが完全にコントロールを取り戻しています。
🎯 エントリー: $1.3300
ターゲット: $1.3538 | $1.3850 | $1.4200(スケーリング用オプション)
🛡️ ストップロス: $1.2975
モメンタムは継続を支持しています。ブレイクアウトトレーダーは$1.33以上の強さに注目し、上昇延長のためのクリーンなセットアップを確認すべきです。
KAITOはボリューム確認で抵抗を突破し、クリーンな高値を形成しており、ブルが完全にコントロールを取り戻しています。
🎯 エントリー: $1.3300
ターゲット: $1.3538 | $1.3850 | $1.4200(スケーリング用オプション)
🛡️ ストップロス: $1.2975
モメンタムは継続を支持しています。ブレイクアウトトレーダーは$1.33以上の強さに注目し、上昇延長のためのクリーンなセットアップを確認すべきです。
182
·
--
ブリッシュ
➠唯一重要なのは時間ですが、長期的にはまずあなたの安全を優先してください。他のすべてのことはただの冗談です。
📢📢
➠唯一重要なのは時間ですが、長期的にはまずあなたの安全を優先してください。他のすべてのことはただの冗談です。
📢📢
📢📢
16


·
--
弱気相場
オープンネットワーク(TON)は、TelegramのCEOの逮捕により、突然深刻な状況に陥っています。
#PavelDurov
今こそ、Tonブロックチェーンの注目のミームに素早く反応し、この機会を利用して購入票を獲得する時です。
#Fish
#Notcoin
#utyab
#Raff
Tpet
Durev
Tcandy
Tmonk。
その他、geckoterminal.comで確認したり、これらのdexを使用して上場トークンを購入したりできるものがたくさんあります。
Ston.fi
DeDust.io
オープンネットワーク(TON)は、TelegramのCEOの逮捕により、突然深刻な状況に陥っています。
#PavelDurov
今こそ、Tonブロックチェーンの注目のミームに素早く反応し、この機会を利用して購入票を獲得する時です。
#Fish
#Notcoin
#utyab
#Raff
Tpet
Durev
Tcandy
Tmonk。
その他、geckoterminal.comで確認したり、これらのdexを使用して上場トークンを購入したりできるものがたくさんあります。
Ston.fi
DeDust.io
#PavelDurov
今こそ、Tonブロックチェーンの注目のミームに素早く反応し、この機会を利用して購入票を獲得する時です。
#Fish
#Notcoin
#utyab
#Raff
Tpet
Durev
Tcandy
Tmonk。
その他、geckoterminal.comで確認したり、これらのdexを使用して上場トークンを購入したりできるものがたくさんあります。
Ston.fi
DeDust.io

4
720
·
--
ブリッシュ
この教育の部分は、Binance から世界へ、いつも私の心を温めてくれます。
#BNB 💛
この教育の部分は、Binance から世界へ、いつも私の心を温めてくれます。
#BNB 💛
#BNB 💛


Binance Square Official
·
--
Squareで長い記事を書く方法
202
·
--
ブリッシュ
今日の DEFI の世界に対する私の考えは、より多くのテクノロジーとイノベーションを受け入れ、暗号通貨の分野でアイデアがまったく不足しないようにすることです。
生産的であること
つながりを持つこと
オープンマインドであること
今日の DEFI の世界に対する私の考えは、より多くのテクノロジーとイノベーションを受け入れ、暗号通貨の分野でアイデアがまったく不足しないようにすることです。
生産的であること
つながりを持つこと
オープンマインドであること
生産的であること
つながりを持つこと
オープンマインドであること
5
269
·
--
#MarketSentimentToday 現時点では市場はドジスタンドにあり、決定を下す際には細心の注意を払う必要があると言えます。
#MarketSentimentToday 現時点では市場はドジスタンドにあり、決定を下す際には細心の注意を払う必要があると言えます。
5
3k
·
--
ブリッシュ
開発者として学習し、コーディングしているとき、画面上ではどの画面を好みますか。
▪︎明るい画面
▪︎暗い画面
お話ししましょう。
開発者として学習し、コーディングしているとき、画面上ではどの画面を好みますか。
▪︎明るい画面
▪︎暗い画面
お話ししましょう。
▪︎明るい画面
▪︎暗い画面
お話ししましょう。
1
2
5.5k
ログインして、さらにコンテンツを読む
厳選トピックで世界の暗号資産トレーダーの仲間入り
⚡️ 暗号資産に関する最新かつ有益な情報が見つかります。
💬 世界最大の暗号資産取引所から信頼されています。
👍 認証を受けたクリエイターから、有益なインサイトを得られます。
メール / 電話番号
トレンドトピック
UKFCAWinsCourtOrderToRecover851400Pounds
閲覧回数 40,422
851人が討論中
🚨 暗号資産の規制が新たな段階に突入:彼らはルールを書くだけじゃない――お金を取り戻している。
英国のFCA(金融行為監督機構)は、裁判所の裏付けを得た別の資産回収を確保し、不正な金融および暗号資産関連活動に対する、より広範な取締りの強化を裏付けています。
そして同時に起きていることを見ると:
🇬🇧 FCA → 執行+資産回収
🇺🇸 SEC → 機能的な暗号資産に対するより明確なルール
🇺🇸 FRB → GENIUS法の下での正式なステーブルコイン監督
この組み合わせが重要です。
規制当局はもはや、「暗号資産を金融システムの中に入れてよいのか」を議論している段階ではありません。
彼らはますます、誰がアクセスできるのか、どんなルールに従うのか、そしてそのルールが破られたときに何が起きるのかを決めています。
次の暗号資産サイクルは、「規制 vs イノベーション」ではないかもしれません。
それは、基準を満たせる人たちの“規制された暗号資産” vs、基準を満たせないすべての人――かもしれません。 👀
$COIN $CRCL $BTC
#ukfcawinscourtordertorecover851400pounds #ChainlinkLaunchesCCIP2WithEnterpriseVerification #GoldFallsTo$4144 #QNTFallsOver40%FromMorningHigh #USDTAdds845900HoldersInPast7Days
KimHotbae
·いいね:3件
·閲覧回数 4.4k
ChainlinkLaunchesCCIP2WithEnterpriseVerification
閲覧回数 52,434
1,014人が討論中
GoldFallsTo$4144
閲覧回数 17,744
169人が討論中