

MUX_40
22 投稿

MUX_40
報告
ユーザーをブロック
11 フォロー
24 フォロワー
8 いいね
投稿
すべて
引用
動画
·
--
弱気相場
翻訳参照
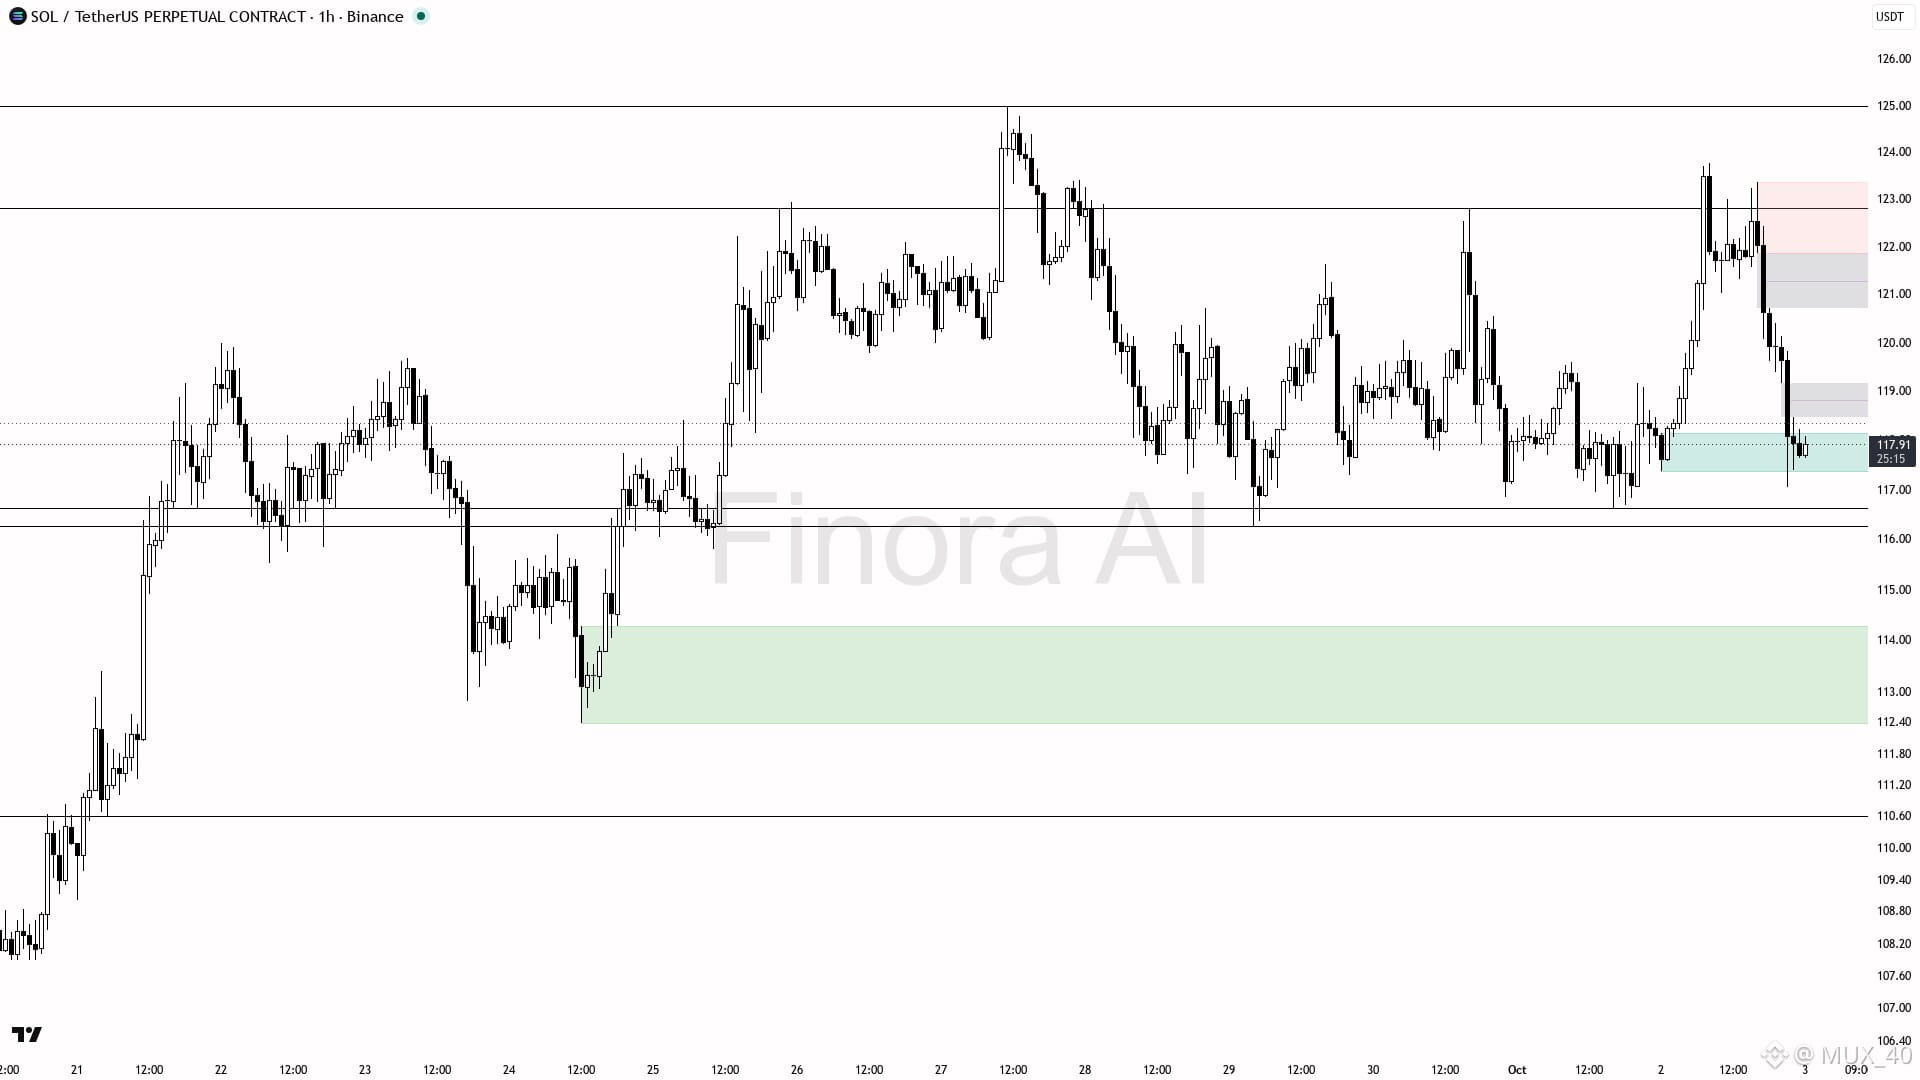
$SOL /USDT — 1H Chart Analysis
Current price: ~117.91
Market structure: Short-term bearish after a strong rejection from the 122–123 resistance area.
Key levels:
🔴 Resistance: 118.8–119.0
🔴 Major resistance: 121.0–122.0
🔴 Supply zone: 122.0–123.5
🟢 Support: 117.0
🟢 Major support: 116.0–116.5
🟢 Demand zone: 112.4–114.2
Scenario:
If SOL reclaims 119 and holds above it, the chart could retest 121–123.
If price breaks and closes below 117, downside attention shifts toward 116–114.
A decisive break of 114 would expose the lower demand area around 112.4.
Bias: Bearish below 119–120; confirmation is needed before acting.
$SOL #sol
$SOL /USDT — 1H Chart Analysis
Current price: ~117.91
Market structure: Short-term bearish after a strong rejection from the 122–123 resistance area.
Key levels:
🔴 Resistance: 118.8–119.0
🔴 Major resistance: 121.0–122.0
🔴 Supply zone: 122.0–123.5
🟢 Support: 117.0
🟢 Major support: 116.0–116.5
🟢 Demand zone: 112.4–114.2
Scenario:
If SOL reclaims 119 and holds above it, the chart could retest 121–123.
If price breaks and closes below 117, downside attention shifts toward 116–114.
A decisive break of 114 would expose the lower demand area around 112.4.
Bias: Bearish below 119–120; confirmation is needed before acting.
$SOL #sol
Current price: ~117.91
Market structure: Short-term bearish after a strong rejection from the 122–123 resistance area.
Key levels:
🔴 Resistance: 118.8–119.0
🔴 Major resistance: 121.0–122.0
🔴 Supply zone: 122.0–123.5
🟢 Support: 117.0
🟢 Major support: 116.0–116.5
🟢 Demand zone: 112.4–114.2
Scenario:
If SOL reclaims 119 and holds above it, the chart could retest 121–123.
If price breaks and closes below 117, downside attention shifts toward 116–114.
A decisive break of 114 would expose the lower demand area around 112.4.
Bias: Bearish below 119–120; confirmation is needed before acting.
$SOL #sol
82
·
--
ブリッシュ
$BTC
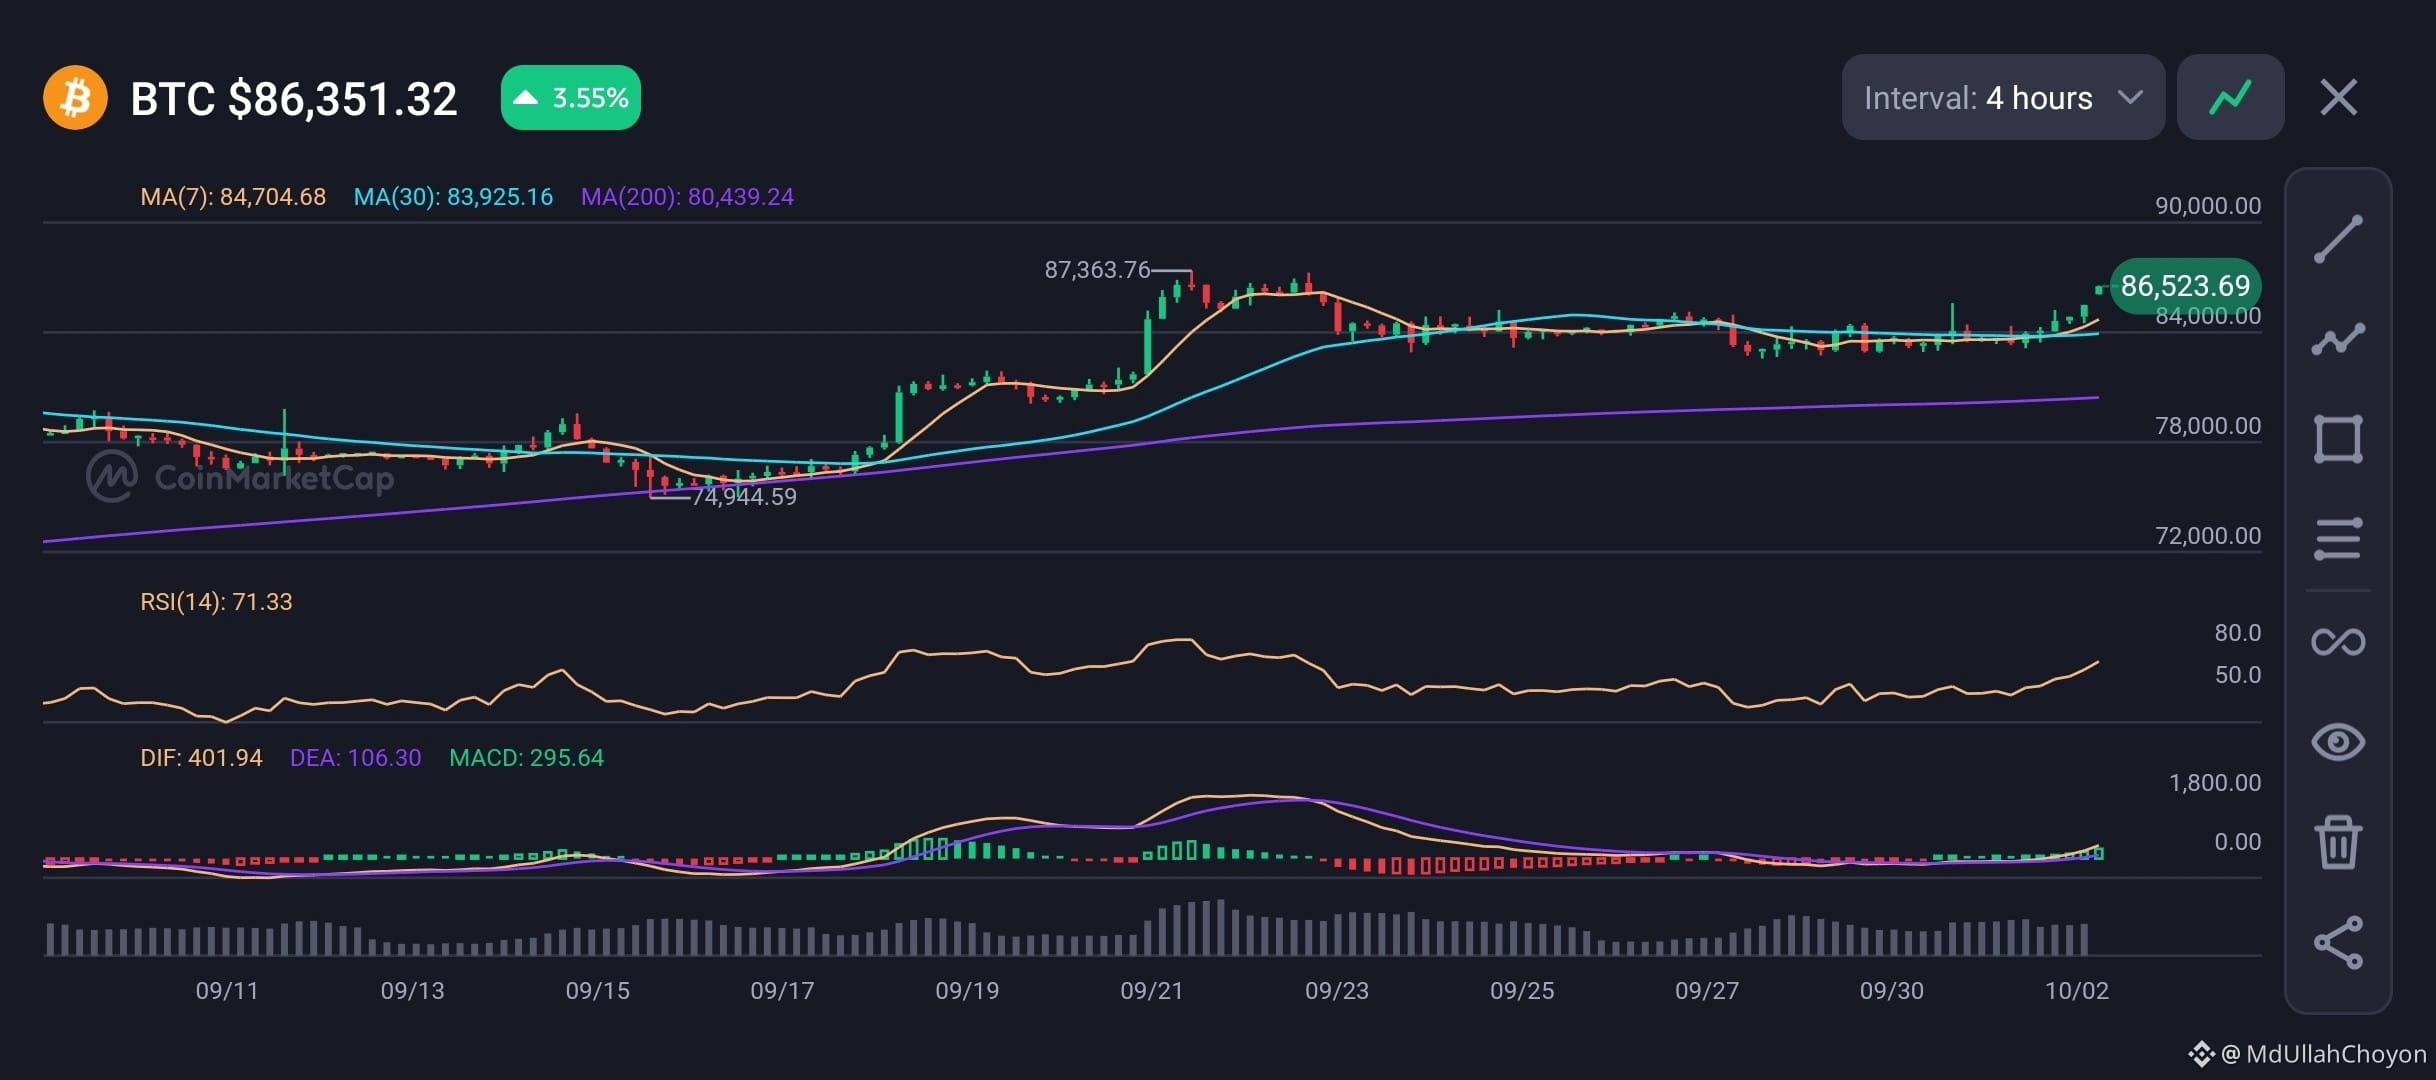
BTCUSDT — 4H テクニカル分析 📊
現在価格: $86,351
24時間変化: +3.55%
トレンド: 🟢 強気
移動平均
MA(7): 84,704
MA(30): 83,925
MA(200): 80,439
価格は3つすべての上 → 強気の構造。
RSI(14): 71.33
⚠️ モメンタムは強いものの、RSIが70を超えているため短期的な押し戻しが起こり得ます。
MACD
DIF: 401.94
DEA: 106.30
ヒストグラム: +295.64
🟢 ポジティブなモメンタムが強まっています。
重要な水準
🔴 レジスタンス: 87,364
🟢 サポート: 84,700
🟢 強いサポート: 83,925
🟢 主要サポート: 80,439
#BTC #BTC走势分析 #TradingSignals
$BTC
BTCUSDT — 4H テクニカル分析 📊
現在価格: $86,351
24時間変化: +3.55%
トレンド: 🟢 強気
移動平均
MA(7): 84,704
MA(30): 83,925
MA(200): 80,439
価格は3つすべての上 → 強気の構造。
RSI(14): 71.33
⚠️ モメンタムは強いものの、RSIが70を超えているため短期的な押し戻しが起こり得ます。
MACD
DIF: 401.94
DEA: 106.30
ヒストグラム: +295.64
🟢 ポジティブなモメンタムが強まっています。
重要な水準
🔴 レジスタンス: 87,364
🟢 サポート: 84,700
🟢 強いサポート: 83,925
🟢 主要サポート: 80,439
#BTC #BTC走势分析 #TradingSignals
BTCUSDT — 4H テクニカル分析 📊
現在価格: $86,351
24時間変化: +3.55%
トレンド: 🟢 強気
移動平均
MA(7): 84,704
MA(30): 83,925
MA(200): 80,439
価格は3つすべての上 → 強気の構造。
RSI(14): 71.33
⚠️ モメンタムは強いものの、RSIが70を超えているため短期的な押し戻しが起こり得ます。
MACD
DIF: 401.94
DEA: 106.30
ヒストグラム: +295.64
🟢 ポジティブなモメンタムが強まっています。
重要な水準
🔴 レジスタンス: 87,364
🟢 サポート: 84,700
🟢 強いサポート: 83,925
🟢 主要サポート: 80,439
#BTC #BTC走势分析 #TradingSignals
2
76

·
--
イーサリアム(ETH)の売買概要
イーサリアム(ETH)は時価総額で2番目に大きい暗号資産であり、分散型金融(DeFi)、スマートコントラクト、分散型アプリケーション(dApps)からなる巨大なエコシステムを支えています。ETHの売買は、暗号資産取引所を通じて、法定通貨(例:USD)またはその他のデジタル資産を交換することです。
#sellthenews #BuytheDips #Ethereum $ETH
イーサリアム(ETH)の売買概要
イーサリアム(ETH)は時価総額で2番目に大きい暗号資産であり、分散型金融(DeFi)、スマートコントラクト、分散型アプリケーション(dApps)からなる巨大なエコシステムを支えています。ETHの売買は、暗号資産取引所を通じて、法定通貨(例:USD)またはその他のデジタル資産を交換することです。
#sellthenews #BuytheDips #Ethereum $ETH
イーサリアム(ETH)は時価総額で2番目に大きい暗号資産であり、分散型金融(DeFi)、スマートコントラクト、分散型アプリケーション(dApps)からなる巨大なエコシステムを支えています。ETHの売買は、暗号資産取引所を通じて、法定通貨(例:USD)またはその他のデジタル資産を交換することです。
#sellthenews #BuytheDips #Ethereum $ETH

52
·
--
🚨「ハッカーは盗んだ資金を動かそうとしている――そして、暗号資産のインフラが反撃を始めている」という言葉は、暗号資産取引所Bitgetで発生した巨額(3億8800万ドル)の大規模なセキュリティ侵害の余波における劇的な転機を捉えています。
何が起きたのか、ハッカーが現金化を試みた方法、そして分散型インフラがなぜ反撃してきたのかを分解して説明します:
1. 準備:3億8800万ドル規模の強奪が起きた経緯
侵害:攻撃者はBitgetのバックエンド・インフラに侵入することに成功しました(報道では、第三者のセキュリティ製品に関連する脆弱性を悪用し、数週間前からシステムを侵害していたとされています)。
奪取:彼らは取引所の内部にある自動化されたシステムをだまして、正当な出金命令のように見えるものを偽造させ、約3億8800万ドル相当の複数の資産(ETH、XRP、BNB、USDT、USDCなど)を、複数のブロックチェーンにまたがって攻撃者が管理するアドレスへと一掃しました。
帰属:セキュリティ企業やBitgetの幹部(CEOのGracy Chen氏のような人物)は、国家による支援を受けたような極めて精巧な関係者の関与を強く指摘し、北朝鮮に関連するサイバー犯罪グループに結びつく形で、手口やインフラのパターンを具体的に関連づけています。
2. 壁に突き当たる:暗号資産インフラが反撃
ハッカーが、盗んだ大量の暗号資産を分散型およびクロスチェーンのプロトコルを通じて浄化(ロンダリング)し、ブリッジし、交換しようとし始めると、暗号資産エコシステム全体が強い勢いで押し返してきました:
DeFi & インテント型プロトコルが資金を遮断:NEAR Intentsのようなプロトコルは体制を強化し、大規模なロンダリングの試みを阻止しました。ハックに紐づく資産のうち50百万ドル超を、彼らのパイプラインを通って移動できないように止め、いくつかの部分をその場で凍結しました。
ステーブルコインの凍結:TetherやCircleを含む主要な中央集権型ステーブルコイン発行者は、関連する攻撃者ウォレットのアドレスを迅速にブラックリスト化し、USDTやUSDCの数百万ドル相当を、交換されたり現金に回されたりする前にロックダウンしました。
#BTC #Ethereum #Xrp🔥🔥 #bnb #TradingCommunity
🚨「ハッカーは盗んだ資金を動かそうとしている――そして、暗号資産のインフラが反撃を始めている」という言葉は、暗号資産取引所Bitgetで発生した巨額(3億8800万ドル)の大規模なセキュリティ侵害の余波における劇的な転機を捉えています。
何が起きたのか、ハッカーが現金化を試みた方法、そして分散型インフラがなぜ反撃してきたのかを分解して説明します:
1. 準備:3億8800万ドル規模の強奪が起きた経緯
侵害:攻撃者はBitgetのバックエンド・インフラに侵入することに成功しました(報道では、第三者のセキュリティ製品に関連する脆弱性を悪用し、数週間前からシステムを侵害していたとされています)。
奪取:彼らは取引所の内部にある自動化されたシステムをだまして、正当な出金命令のように見えるものを偽造させ、約3億8800万ドル相当の複数の資産(ETH、XRP、BNB、USDT、USDCなど)を、複数のブロックチェーンにまたがって攻撃者が管理するアドレスへと一掃しました。
帰属:セキュリティ企業やBitgetの幹部(CEOのGracy Chen氏のような人物)は、国家による支援を受けたような極めて精巧な関係者の関与を強く指摘し、北朝鮮に関連するサイバー犯罪グループに結びつく形で、手口やインフラのパターンを具体的に関連づけています。
2. 壁に突き当たる:暗号資産インフラが反撃
ハッカーが、盗んだ大量の暗号資産を分散型およびクロスチェーンのプロトコルを通じて浄化(ロンダリング)し、ブリッジし、交換しようとし始めると、暗号資産エコシステム全体が強い勢いで押し返してきました:
DeFi & インテント型プロトコルが資金を遮断:NEAR Intentsのようなプロトコルは体制を強化し、大規模なロンダリングの試みを阻止しました。ハックに紐づく資産のうち50百万ドル超を、彼らのパイプラインを通って移動できないように止め、いくつかの部分をその場で凍結しました。
ステーブルコインの凍結:TetherやCircleを含む主要な中央集権型ステーブルコイン発行者は、関連する攻撃者ウォレットのアドレスを迅速にブラックリスト化し、USDTやUSDCの数百万ドル相当を、交換されたり現金に回されたりする前にロックダウンしました。
#BTC #Ethereum #Xrp🔥🔥 #bnb #TradingCommunity
何が起きたのか、ハッカーが現金化を試みた方法、そして分散型インフラがなぜ反撃してきたのかを分解して説明します:
1. 準備:3億8800万ドル規模の強奪が起きた経緯
侵害:攻撃者はBitgetのバックエンド・インフラに侵入することに成功しました(報道では、第三者のセキュリティ製品に関連する脆弱性を悪用し、数週間前からシステムを侵害していたとされています)。
奪取:彼らは取引所の内部にある自動化されたシステムをだまして、正当な出金命令のように見えるものを偽造させ、約3億8800万ドル相当の複数の資産(ETH、XRP、BNB、USDT、USDCなど)を、複数のブロックチェーンにまたがって攻撃者が管理するアドレスへと一掃しました。
帰属:セキュリティ企業やBitgetの幹部(CEOのGracy Chen氏のような人物)は、国家による支援を受けたような極めて精巧な関係者の関与を強く指摘し、北朝鮮に関連するサイバー犯罪グループに結びつく形で、手口やインフラのパターンを具体的に関連づけています。
2. 壁に突き当たる:暗号資産インフラが反撃
ハッカーが、盗んだ大量の暗号資産を分散型およびクロスチェーンのプロトコルを通じて浄化(ロンダリング)し、ブリッジし、交換しようとし始めると、暗号資産エコシステム全体が強い勢いで押し返してきました:
DeFi & インテント型プロトコルが資金を遮断:NEAR Intentsのようなプロトコルは体制を強化し、大規模なロンダリングの試みを阻止しました。ハックに紐づく資産のうち50百万ドル超を、彼らのパイプラインを通って移動できないように止め、いくつかの部分をその場で凍結しました。
ステーブルコインの凍結:TetherやCircleを含む主要な中央集権型ステーブルコイン発行者は、関連する攻撃者ウォレットのアドレスを迅速にブラックリスト化し、USDTやUSDCの数百万ドル相当を、交換されたり現金に回されたりする前にロックダウンしました。
#BTC #Ethereum #Xrp🔥🔥 #bnb #TradingCommunity

151
·
--
$ETH 🚀 イーサリアム(ETH)は、次世代の分散型アプリケーション、スマートコントラクト、そしてWeb3の革新を推進しています。
⚡ 強力なエコシステム
🔗 スマートコントラクト & DeFi
🌐 Web3の普及が拡大
💎 ETHは、最も注目されている暗号資産の1つです
ETHの見通しはどうですか? 👀📈
#Ethereum #ETH #Binance #Crypto #Web3 #DeFi #Blockchain
$ETH 🚀 イーサリアム(ETH)は、次世代の分散型アプリケーション、スマートコントラクト、そしてWeb3の革新を推進しています。
⚡ 強力なエコシステム
🔗 スマートコントラクト & DeFi
🌐 Web3の普及が拡大
💎 ETHは、最も注目されている暗号資産の1つです
ETHの見通しはどうですか? 👀📈
#Ethereum #ETH #Binance #Crypto #Web3 #DeFi #Blockchain
⚡ 強力なエコシステム
🔗 スマートコントラクト & DeFi
🌐 Web3の普及が拡大
💎 ETHは、最も注目されている暗号資産の1つです
ETHの見通しはどうですか? 👀📈
#Ethereum #ETH #Binance #Crypto #Web3 #DeFi #Blockchain

91


ログインして、さらにコンテンツを読む
厳選トピックで世界の暗号資産トレーダーの仲間入り
⚡️ 暗号資産に関する最新かつ有益な情報が見つかります。
💬 世界最大の暗号資産取引所から信頼されています。
👍 認証を受けたクリエイターから、有益なインサイトを得られます。
メール / 電話番号
トレンドトピック
BitcoinParesGainsAfterRallyTo$86.5K
閲覧回数 1,296
33人が討論中
$BTCがちょうど86kドルのナイフエッジ上にいます。強気派はその水準を守るために1,436 BTCを積み上げ、弱気派は86.5kドルに壁を作るように1,008 BTCを投入しています。これは純粋な清算燃料です——この戦いで負けた側は容赦なく核攻撃を食らいます。
短期のスキャルプ(小刻み)領域。もし強気派が出来高を伴って$86.5kを上抜けるなら、$88kへ急速に走る可能性が高いです。弱気派が踏みとどまって下に押し込むなら、次の目的地は$84kで、ロング勢は一掃(フラッシュ)されます。
テープを注意深く監視してください。どちらかが壊滅させられる寸前で、この動きはどちらに転んでも暴力的になります。
AI Market Brief
·いいね:6件
·閲覧回数 7.6k
CerebrasSinksNearly20%OnReportNvidiaToPowerOpenAI
閲覧回数 6,055
136人が討論中
SECProposesCryptoCustodyRules
閲覧回数 28,183
290人が討論中