
Nouha X
96 投稿

Nouha X
報告
ユーザーをブロック
Binance square content creator | 500k Pumpfun Gained.
5.8年
26 フォロー
33 フォロワー
39 いいね
投稿
すべて
動画
·
--
翻訳参照
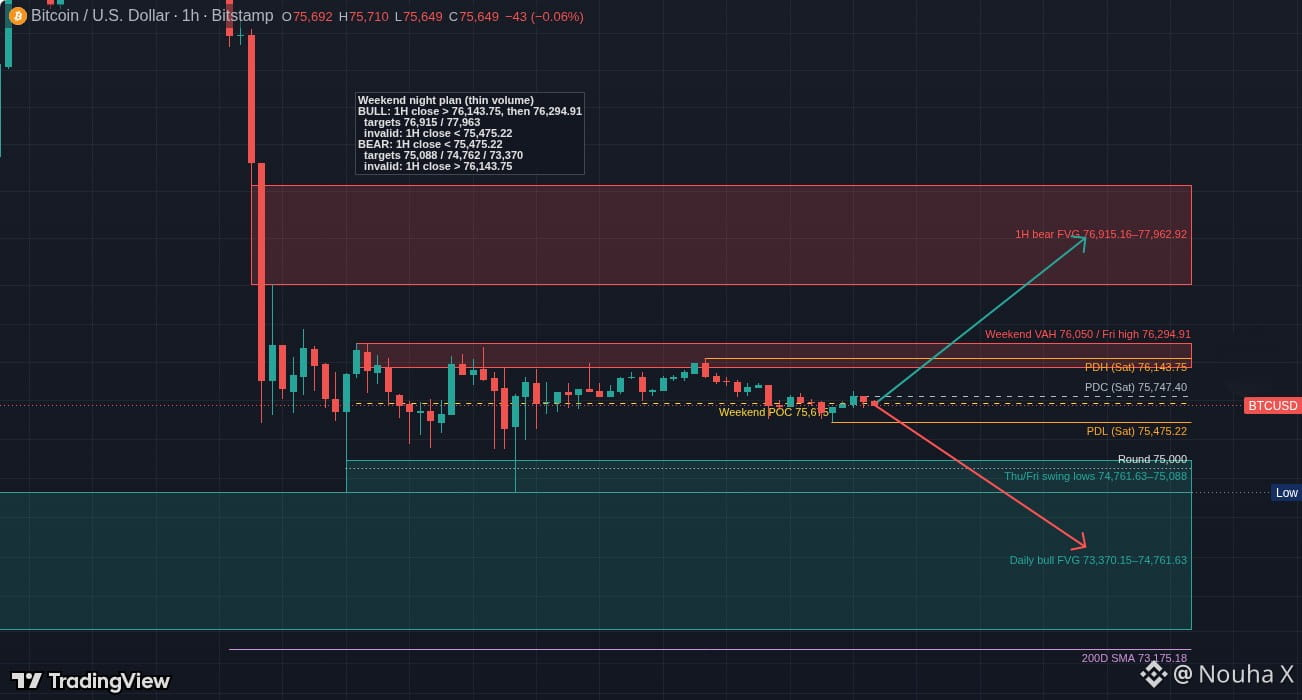
weekend drift around 75,650 in a tight range between 75,475 and 76,144 for $BTC
thin volume means an hourly close outside that range is needed to trust direction
daily structure is below the 50D SMA at 81,762 but above the 200D SMA at 73,175
weekend drift around 75,650 in a tight range between 75,475 and 76,144 for $BTC
thin volume means an hourly close outside that range is needed to trust direction
daily structure is below the 50D SMA at 81,762 but above the 200D SMA at 73,175
thin volume means an hourly close outside that range is needed to trust direction
daily structure is below the 50D SMA at 81,762 but above the 200D SMA at 73,175
28
·
--
翻訳参照
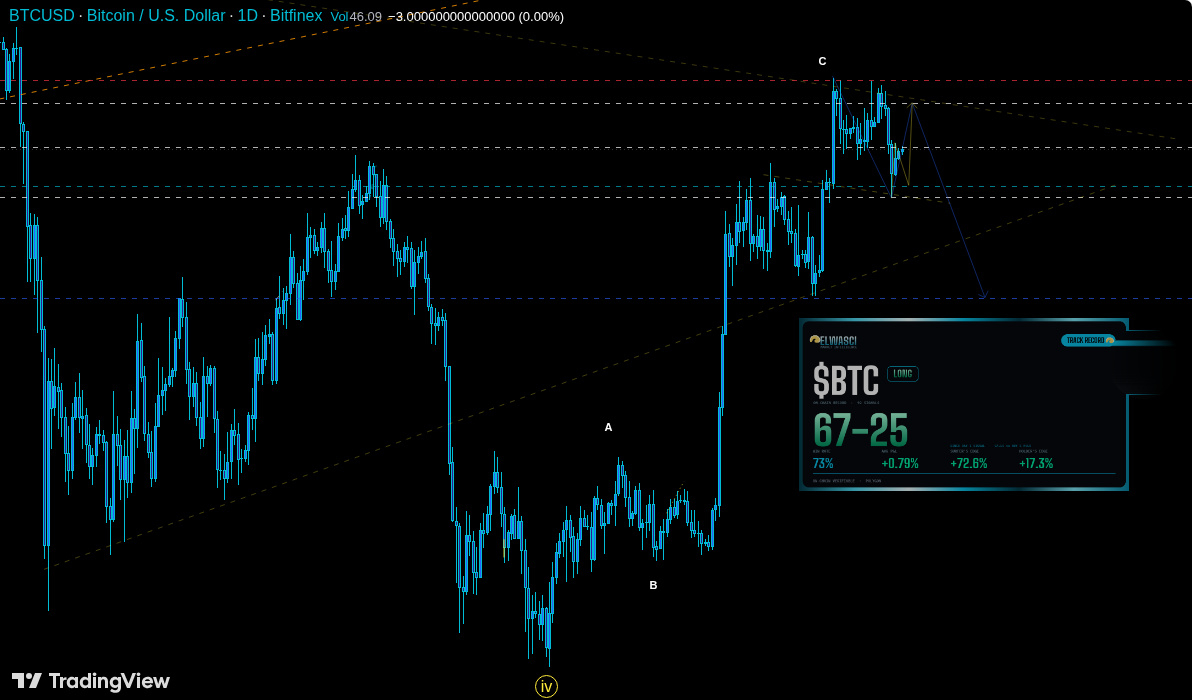
Looks like BearFriends think $BTC might dip to 75K eventually. 🐻
There's a pending drop toward $81K maybe in the next 72 hours, unless it clears the red horizontal near $87,262.
I've seen a simulated deviation of +72% tracking via immutable transactions compared to the +17% gains for current holders. #BTCshort
Looks like BearFriends think $BTC might dip to 75K eventually. 🐻
There's a pending drop toward $81K maybe in the next 72 hours, unless it clears the red horizontal near $87,262.
I've seen a simulated deviation of +72% tracking via immutable transactions compared to the +17% gains for current holders. #BTCshort
There's a pending drop toward $81K maybe in the next 72 hours, unless it clears the red horizontal near $87,262.
I've seen a simulated deviation of +72% tracking via immutable transactions compared to the +17% gains for current holders. #BTCshort
67
·
--
翻訳参照
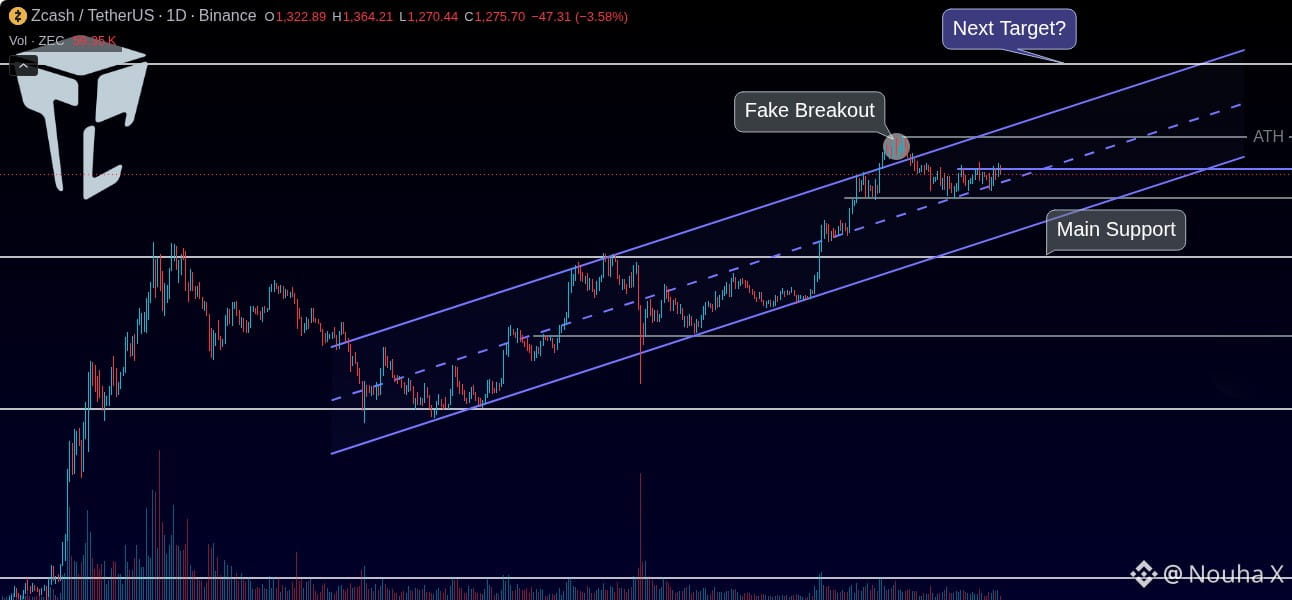
zcash $ZEC had that explosive rally through 2025, topping out near $670 after breaking $55.
it’s in a bullish structure, supported by the $204 range, with a higher low at $363 showing buying pressure. 🚀
#PrivacyCoins
zcash $ZEC had that explosive rally through 2025, topping out near $670 after breaking $55.
it’s in a bullish structure, supported by the $204 range, with a higher low at $363 showing buying pressure. 🚀
#PrivacyCoins
it’s in a bullish structure, supported by the $204 range, with a higher low at $363 showing buying pressure. 🚀
#PrivacyCoins
264
·
--
翻訳参照
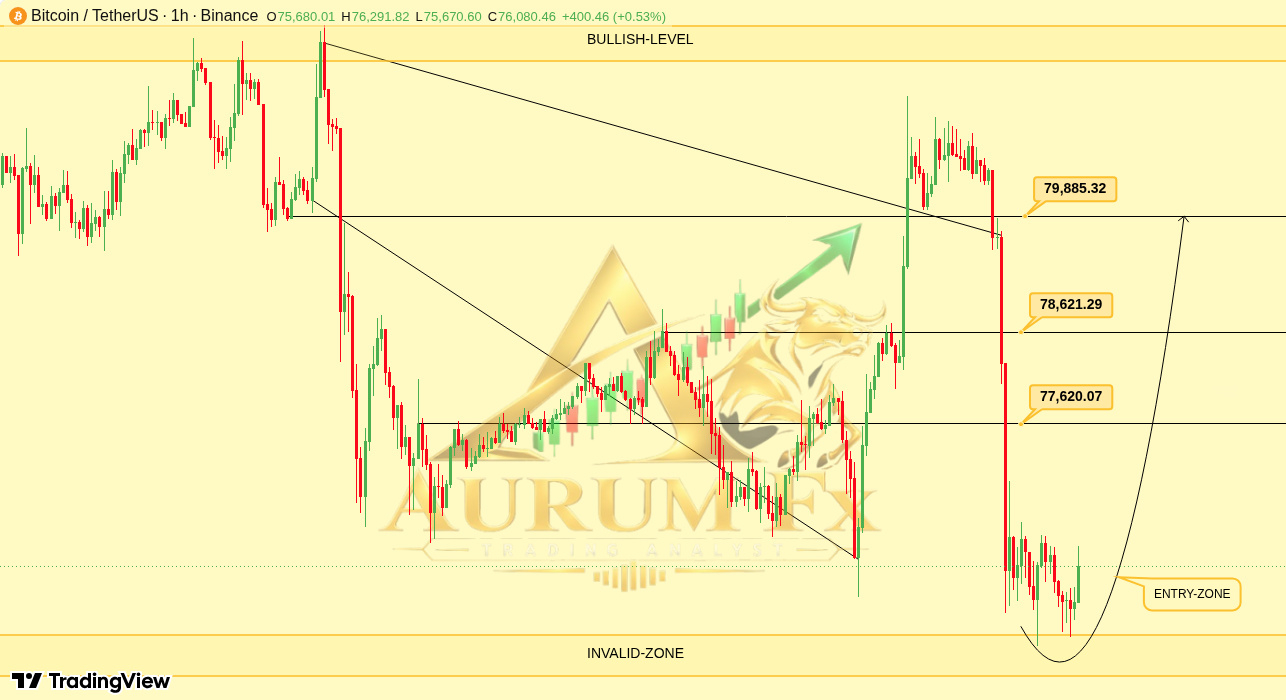
BTC is testing a key demand zone after an intraday selloff on the 1H chart.
If that support holds, we're looking for a gradual recovery.
Target 1 is $77,620, then $78,621, and finally $79,885. 🐂 #BitcoinRecovery
BTC is testing a key demand zone after an intraday selloff on the 1H chart.
If that support holds, we're looking for a gradual recovery.
Target 1 is $77,620, then $78,621, and finally $79,885. 🐂 #BitcoinRecovery
If that support holds, we're looking for a gradual recovery.
Target 1 is $77,620, then $78,621, and finally $79,885. 🐂 #BitcoinRecovery
88
·
--
翻訳参照
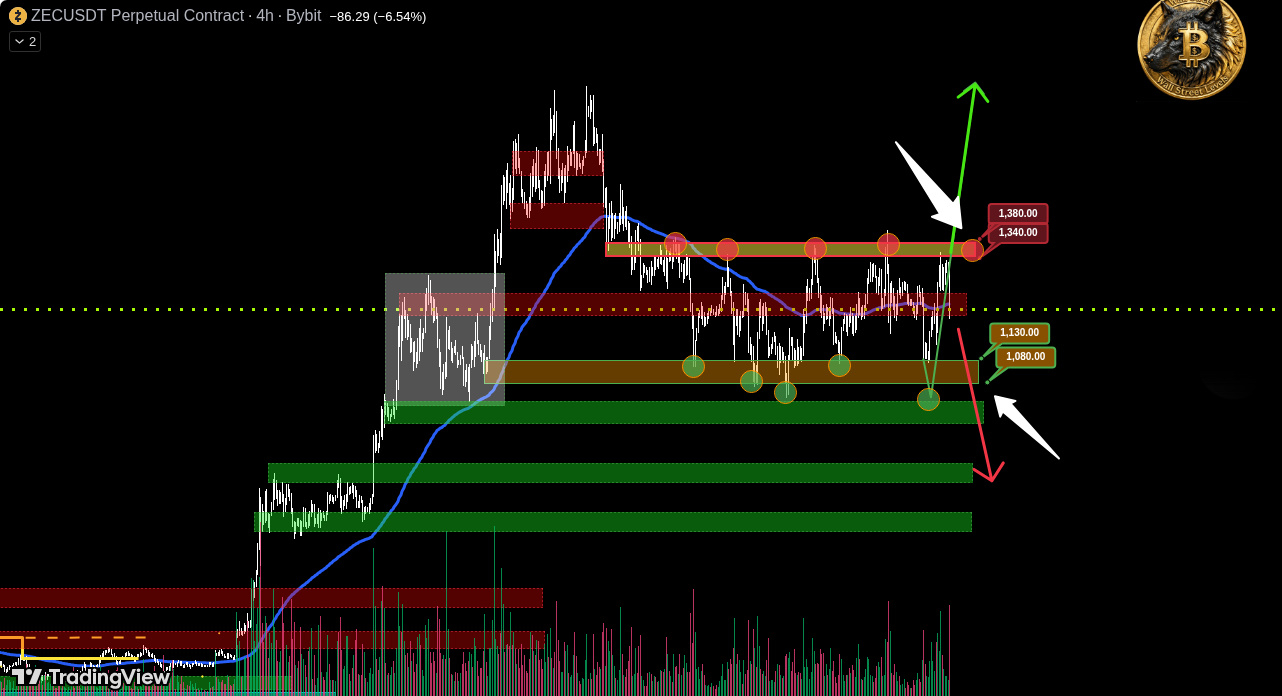
$ZEC tapped the $1340-$1380 zone on BYBIT:ZECUSDT.P but failed to reclaim it, so the price dropped.
IMA showed zero capital inflow during that breakout attempt.
Now we're waiting for a move down to the lower range boundary of $1080-$1130.
A break and hold above $1380 would cancel the short scenario.
$ZEC tapped the $1340-$1380 zone on BYBIT:ZECUSDT.P but failed to reclaim it, so the price dropped.
IMA showed zero capital inflow during that breakout attempt.
Now we're waiting for a move down to the lower range boundary of $1080-$1130.
A break and hold above $1380 would cancel the short scenario.
IMA showed zero capital inflow during that breakout attempt.
Now we're waiting for a move down to the lower range boundary of $1080-$1130.
A break and hold above $1380 would cancel the short scenario.
413
·
--
翻訳参照
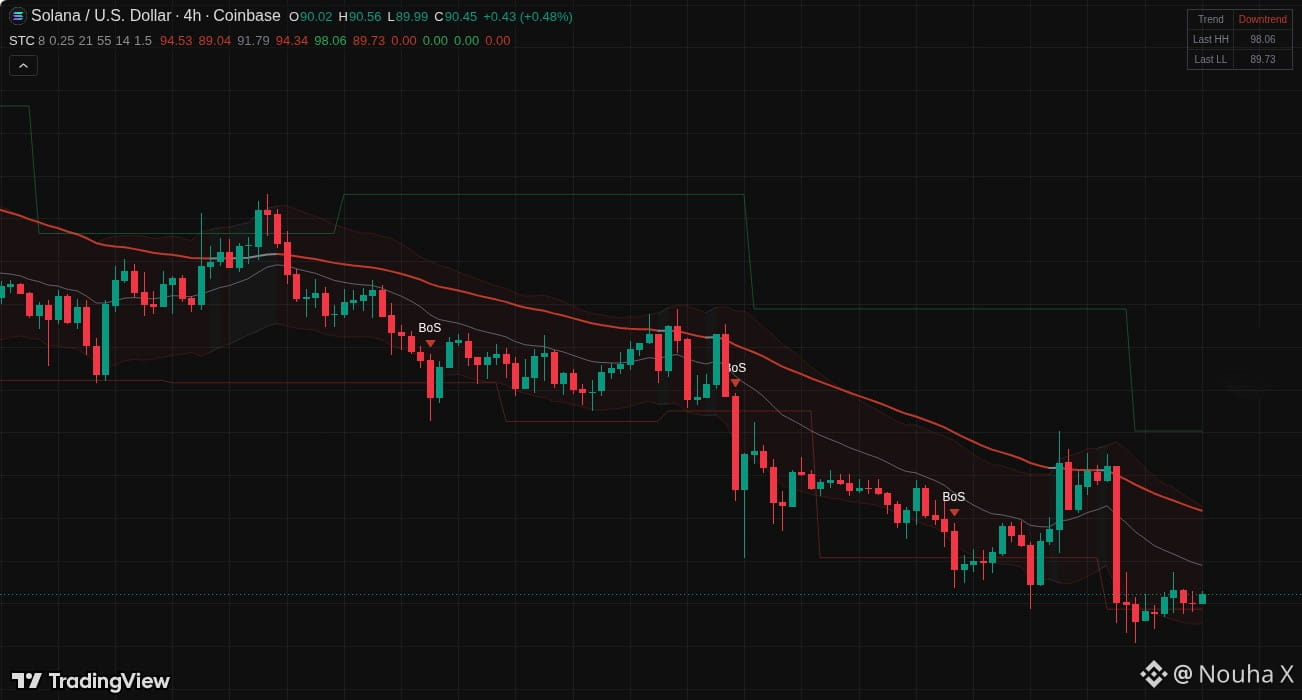
SOL is trading at 90.65 on the 4H, with a down trend bias. 📉
It's pinned in the lower half of the volatility band, below both EMA21 at 91.92 and EMA55 at 94.48.
The last swing low at 89.86 remains open under the current price. $SOL
SOL is trading at 90.65 on the 4H, with a down trend bias. 📉
It's pinned in the lower half of the volatility band, below both EMA21 at 91.92 and EMA55 at 94.48.
The last swing low at 89.86 remains open under the current price. $SOL
It's pinned in the lower half of the volatility band, below both EMA21 at 91.92 and EMA55 at 94.48.
The last swing low at 89.86 remains open under the current price. $SOL
164
·
--
翻訳参照
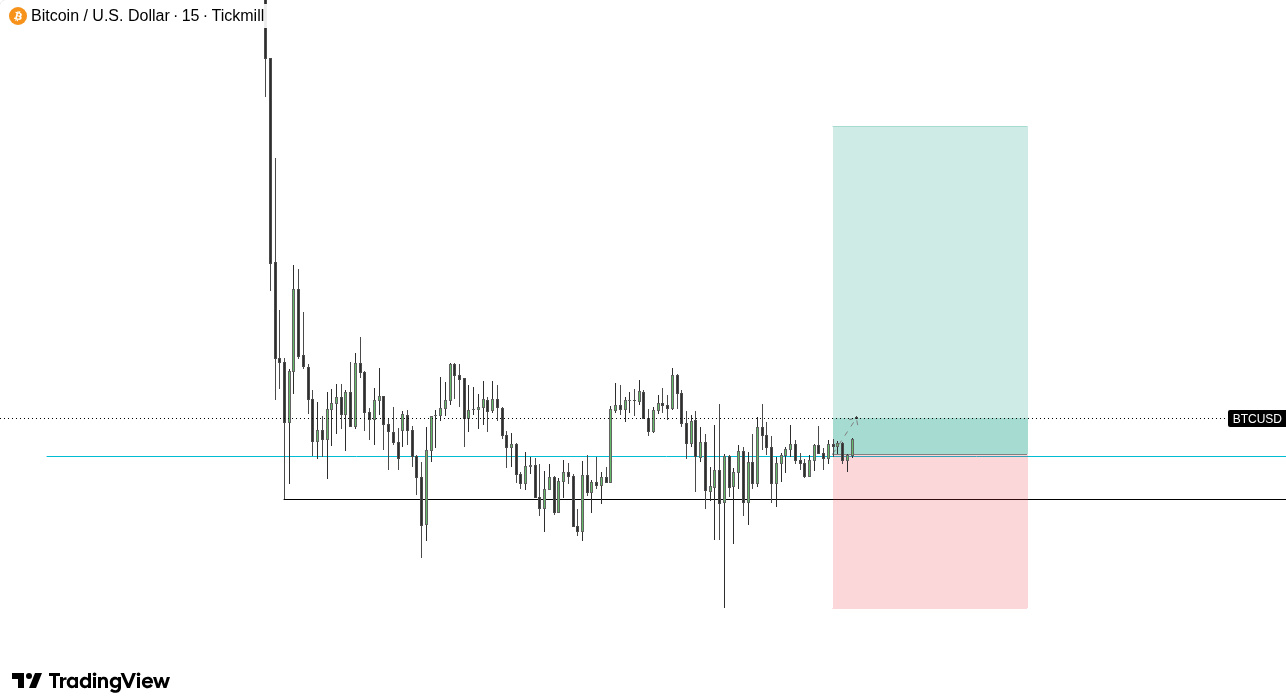
$BTC swept below the 75,450.50 low then reclaimed it on the 15m chart. Now consolidating near 75,700–75,800. A long entry around 75,729 has a stop at 74,763. If $BTC decisively breaks above 76,000, heading toward 77,781.66 could happen. 🤔 #CryptoAnalysis
$BTC swept below the 75,450.50 low then reclaimed it on the 15m chart. Now consolidating near 75,700–75,800. A long entry around 75,729 has a stop at 74,763. If $BTC decisively breaks above 76,000, heading toward 77,781.66 could happen. 🤔 #CryptoAnalysis
63
·
--
翻訳参照
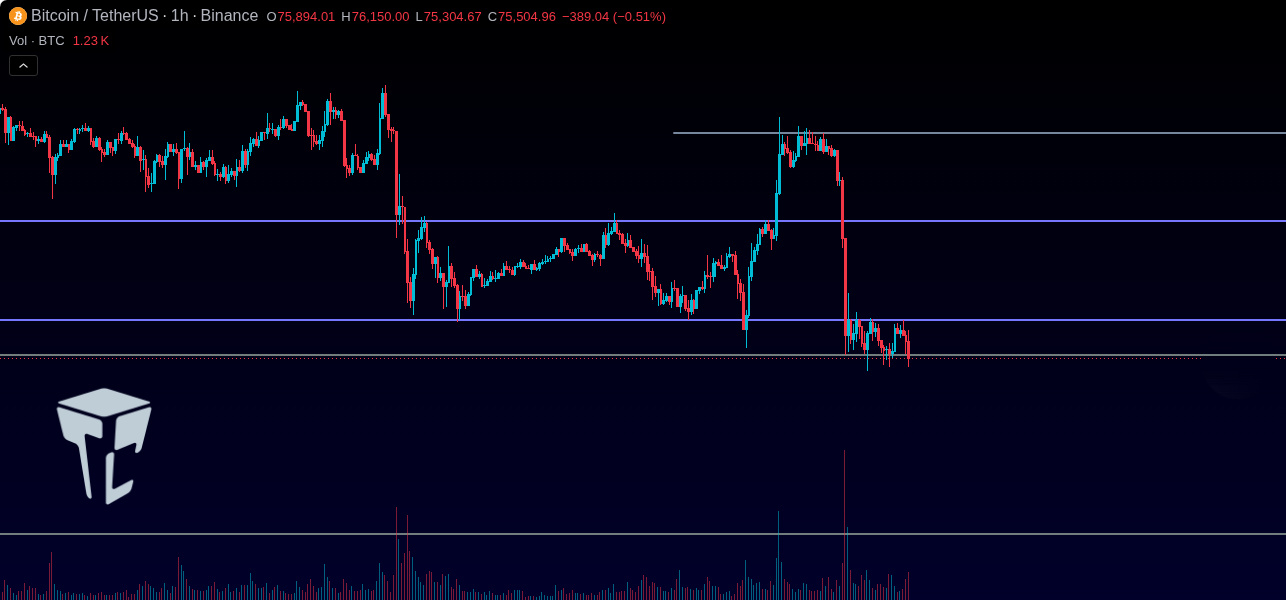
BTC $BTC is in a critical support zone after yesterday's sell-off. ⌛️ On the 1-hour chart, $BTC is consolidating tight between $75,568 and $76,385. A break below $75,568 acts as a bearish trigger. Opportunities exist on a breakout, but risk profiles differ. #CryptoAnalysis 🧐
BTC $BTC is in a critical support zone after yesterday's sell-off. ⌛️ On the 1-hour chart, $BTC is consolidating tight between $75,568 and $76,385. A break below $75,568 acts as a bearish trigger. Opportunities exist on a breakout, but risk profiles differ. #CryptoAnalysis 🧐
47
·
--
翻訳参照
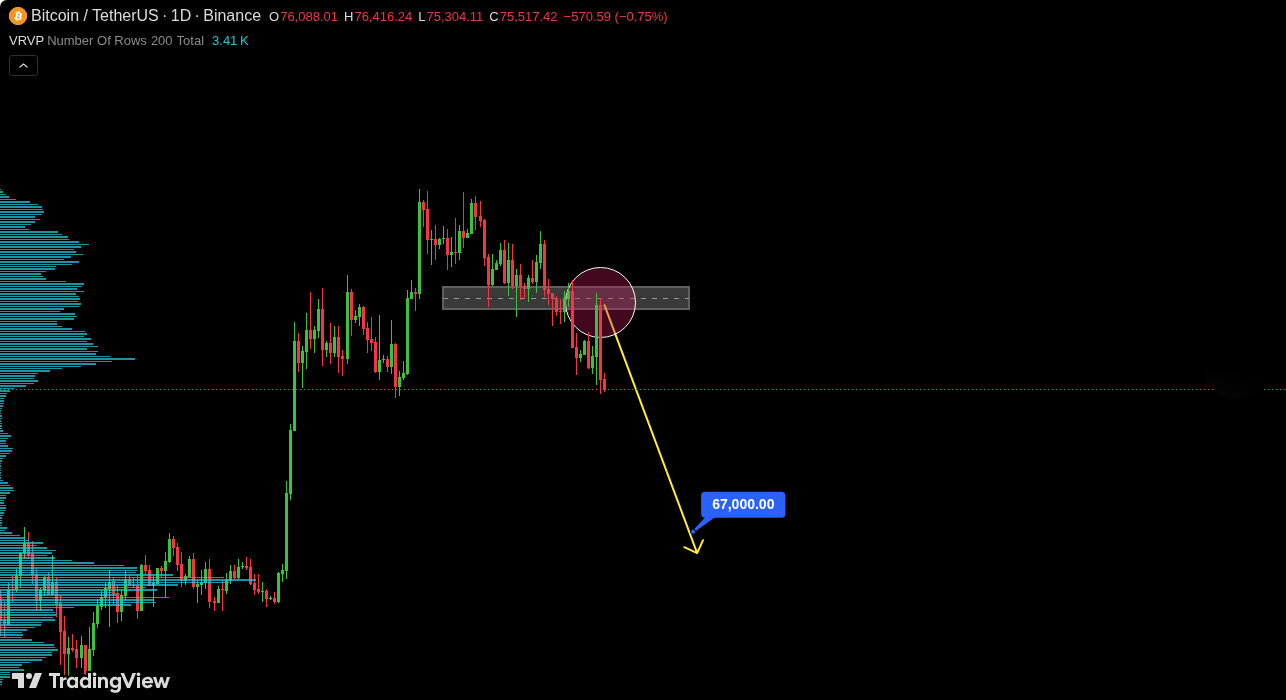
BTCUSDT is struggling on the daily chart. That recent rebound failed to hold at the former support zone, showing sellers are still in control. The lower highs confirm the bearish structure, and Bitcoin $BTC lost its recovery momentum fast. 📉 $BTC
BTCUSDT is struggling on the daily chart. That recent rebound failed to hold at the former support zone, showing sellers are still in control. The lower highs confirm the bearish structure, and Bitcoin $BTC lost its recovery momentum fast. 📉 $BTC
58
·
--
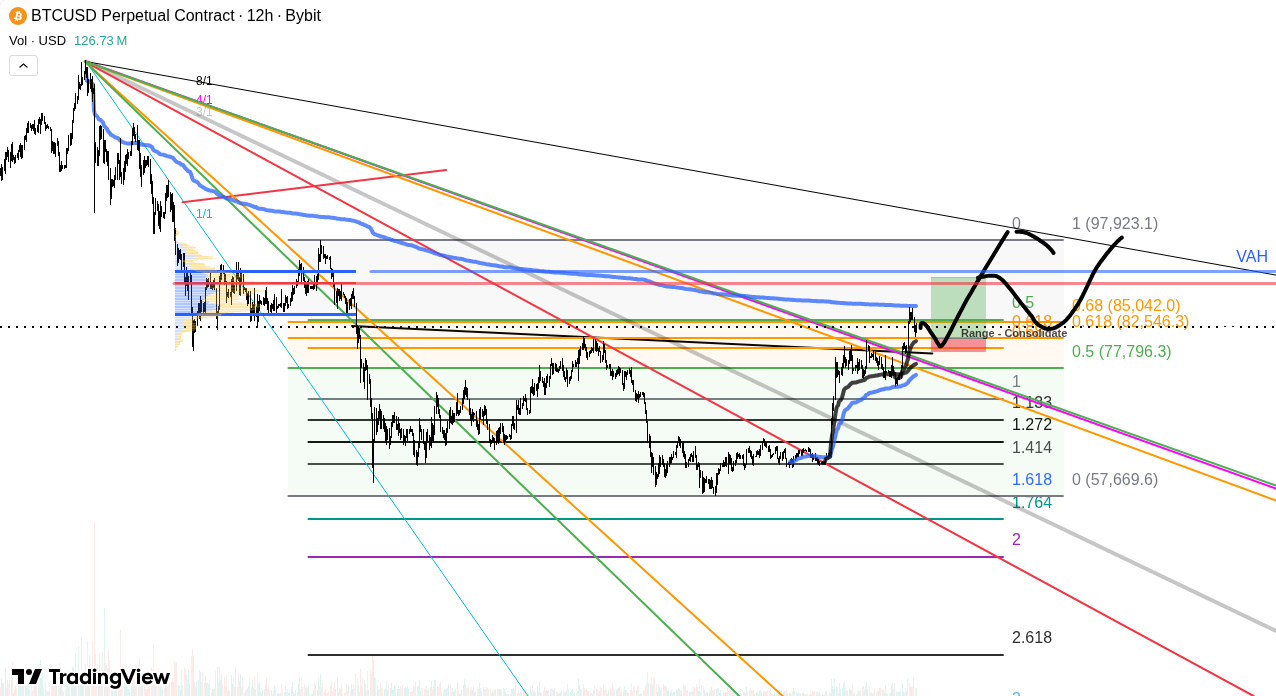
BTC $BTC は、25.09.26の日足を見ると、AvwapとPOC付近で強い抵抗に直面しているようです🤔。現在の形は緩やかなABCジグザグですが、BTC $BTC は以前にもその抵抗線を下回る範囲で推移しており、それが勢いにつながる可能性があります。大きな調整はあまり予想されていませんが、その可能性はあります。#CryptoTrading $BTC
BTC $BTC は、25.09.26の日足を見ると、AvwapとPOC付近で強い抵抗に直面しているようです🤔。現在の形は緩やかなABCジグザグですが、BTC $BTC は以前にもその抵抗線を下回る範囲で推移しており、それが勢いにつながる可能性があります。大きな調整はあまり予想されていませんが、その可能性はあります。#CryptoTrading $BTC
77
·
--
翻訳参照
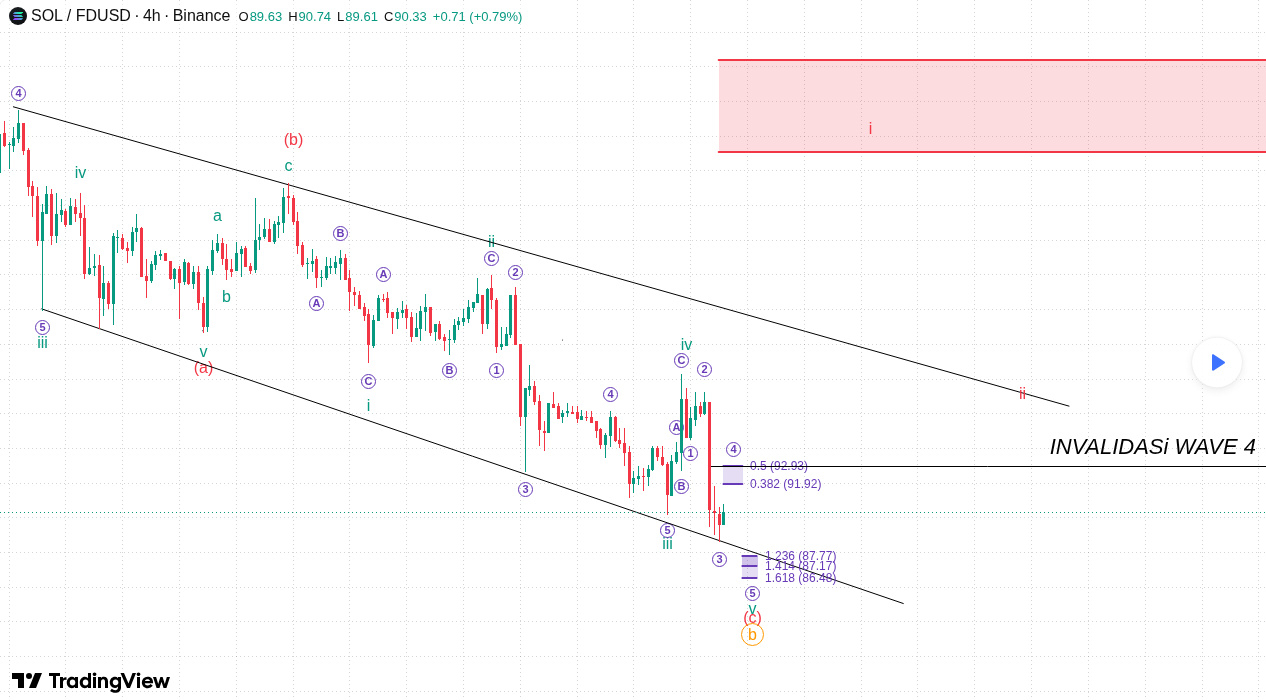
Looking at the SOL $SOL / FDUSD chart, we've got a dual possibility macro update inside that corrective descending channel 🧐. Scenario 1 suggests the Green Wave 5 and the bigger purple ABC correction are done at the lower trendline, which could signal a bullish reversal. But then there's Scenario 2, where $SOL is still navigating purple Wave 4 and one final low is pending. We need to watch that action closely. #CryptoTrading 📈
Looking at the SOL $SOL / FDUSD chart, we've got a dual possibility macro update inside that corrective descending channel 🧐. Scenario 1 suggests the Green Wave 5 and the bigger purple ABC correction are done at the lower trendline, which could signal a bullish reversal. But then there's Scenario 2, where $SOL is still navigating purple Wave 4 and one final low is pending. We need to watch that action closely. #CryptoTrading 📈
96
·
--
翻訳参照
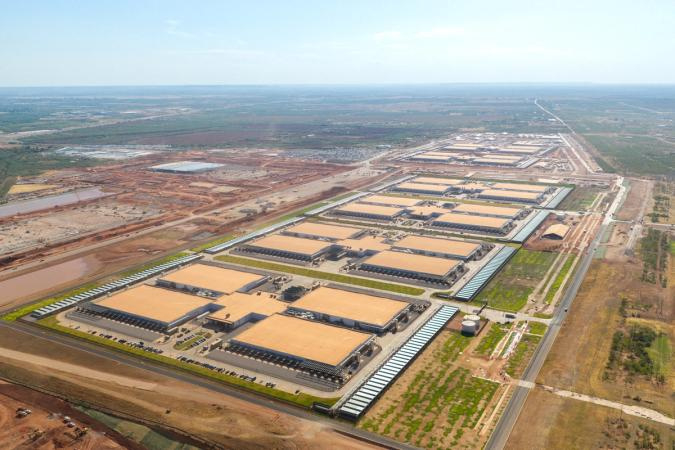
Wall Street is trimming Bitcoin miner price targets after Democrats took Texas. 🏛️ That's the headline, and it's a reminder of how fast policy can flip a whole sector.
The angle here is the data center boom. New blue Texas threatens that boom. Miners and AI hyperscalers are competing for the same power, and a change in the political landscape just made the energy picture less predictable for the industry.
It's not about BTC price. It's about the miners' access to cheap electricity and the demand side they've been counting on. Cut targets mean the market is repricing risk, not necessarily fundamentals.
Keep an eye on how this plays out in the next few quarters. Policy-driven energy constraints move faster than most people expect.
Wall Street is trimming Bitcoin miner price targets after Democrats took Texas. 🏛️ That's the headline, and it's a reminder of how fast policy can flip a whole sector.
The angle here is the data center boom. New blue Texas threatens that boom. Miners and AI hyperscalers are competing for the same power, and a change in the political landscape just made the energy picture less predictable for the industry.
It's not about BTC price. It's about the miners' access to cheap electricity and the demand side they've been counting on. Cut targets mean the market is repricing risk, not necessarily fundamentals.
Keep an eye on how this plays out in the next few quarters. Policy-driven energy constraints move faster than most people expect.
The angle here is the data center boom. New blue Texas threatens that boom. Miners and AI hyperscalers are competing for the same power, and a change in the political landscape just made the energy picture less predictable for the industry.
It's not about BTC price. It's about the miners' access to cheap electricity and the demand side they've been counting on. Cut targets mean the market is repricing risk, not necessarily fundamentals.
Keep an eye on how this plays out in the next few quarters. Policy-driven energy constraints move faster than most people expect.
91
·
--
速報: 大手機関暗号資産カストディアンのCopperが、5億ドルの大規模な売却を検討中で、ウォール街の巨人Cantor Fitzgeraldを任命して取引を円滑に進めています!従来の金融業界が暗号インフラを積極的に買い込んでいます。大きな動きが待っています!
$BTC #CryptoNews #BinanceSquare $ETH $XRP
速報: 大手機関暗号資産カストディアンのCopperが、5億ドルの大規模な売却を検討中で、ウォール街の巨人Cantor Fitzgeraldを任命して取引を円滑に進めています!従来の金融業界が暗号インフラを積極的に買い込んでいます。大きな動きが待っています!
$BTC #CryptoNews #BinanceSquare $ETH $XRP
$BTC #CryptoNews #BinanceSquare $ETH $XRP

113
·
--
$ARKMは究極の蓄積ゾーンに突入中!
最近のセクター修正を受けて、AIの力を持つArkham ($ARKM)は歴史的なマクロボトム ($0.11 - $0.12)に直接到達しました。ここに素早いゲームプランがあります:
エントリーゾーン: $0.110 - $0.118(クジラの蓄積ブロック)
ターゲット: $0.142 👉 $0.185 👉 $0.250
ストップロス: 日次クローズが$0.090未満
{future}(ARKMUSDT)
$ARKMは究極の蓄積ゾーンに突入中!
最近のセクター修正を受けて、AIの力を持つArkham ($ARKM)は歴史的なマクロボトム ($0.11 - $0.12)に直接到達しました。ここに素早いゲームプランがあります:
エントリーゾーン: $0.110 - $0.118(クジラの蓄積ブロック)
ターゲット: $0.142 👉 $0.185 👉 $0.250
ストップロス: 日次クローズが$0.090未満
最近のセクター修正を受けて、AIの力を持つArkham ($ARKM)は歴史的なマクロボトム ($0.11 - $0.12)に直接到達しました。ここに素早いゲームプランがあります:
エントリーゾーン: $0.110 - $0.118(クジラの蓄積ブロック)
ターゲット: $0.142 👉 $0.185 👉 $0.250
ストップロス: 日次クローズが$0.090未満

38
·
--
🚨 ウォール街は24/7のトレーディングを望んでいる!新しいハイパーリキッドETF($HYPE)への大きな流入
機関投資家たちは週末の市場閉鎖に公式にうんざりしている。21SharesはNasdaqでハイパーリキッドETF($THYP)を立ち上げ、初期の流入は膨大だ!
重要なポイント:
24/7の需要:ウォール街からのノンストップで時計を気にしないDeFiトレーディングへの巨大な食欲。
リアルタイム発見:ハイパーリキッドは、伝統的な取引所(CMEなど)が閉まっているときでも、グローバルな価格発見をリードしている。
BTC/ETHを超えて:大金が高いユーティリティのアルトコインに積極的に移動している
$BTC $HYPE
{future}(HYPEUSDT)
🚨 ウォール街は24/7のトレーディングを望んでいる!新しいハイパーリキッドETF($HYPE )への大きな流入
機関投資家たちは週末の市場閉鎖に公式にうんざりしている。21SharesはNasdaqでハイパーリキッドETF($THYP)を立ち上げ、初期の流入は膨大だ!
重要なポイント:
24/7の需要:ウォール街からのノンストップで時計を気にしないDeFiトレーディングへの巨大な食欲。
リアルタイム発見:ハイパーリキッドは、伝統的な取引所(CMEなど)が閉まっているときでも、グローバルな価格発見をリードしている。
BTC/ETHを超えて:大金が高いユーティリティのアルトコインに積極的に移動している
$BTC $HYPE
機関投資家たちは週末の市場閉鎖に公式にうんざりしている。21SharesはNasdaqでハイパーリキッドETF($THYP)を立ち上げ、初期の流入は膨大だ!
重要なポイント:
24/7の需要:ウォール街からのノンストップで時計を気にしないDeFiトレーディングへの巨大な食欲。
リアルタイム発見:ハイパーリキッドは、伝統的な取引所(CMEなど)が閉まっているときでも、グローバルな価格発見をリードしている。
BTC/ETHを超えて:大金が高いユーティリティのアルトコインに積極的に移動している
$BTC $HYPE
·
--
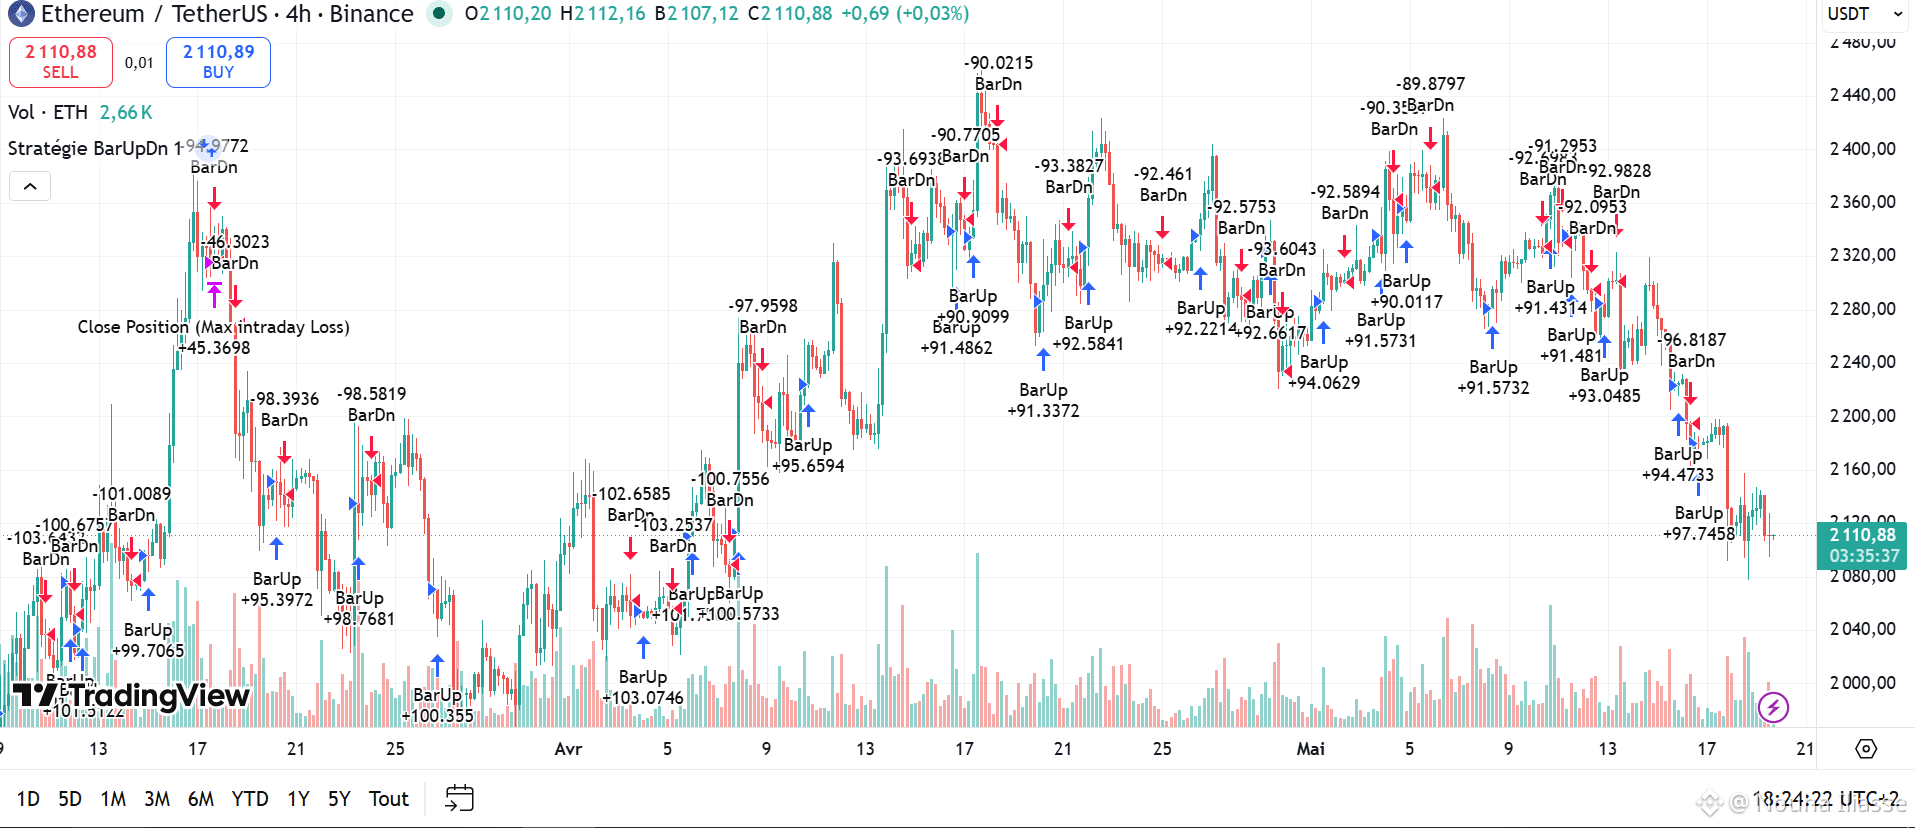
最近のEthereumに関するニュースを受けて、これが実際にブルなサインで良い買いチャンスなのか、それとも悪いニュースでエグジットの合図なのか、誰か教えてくれませんか?いつ出た方がいいですか?
$ETH
{future}(ETHUSDT)
最近のEthereumに関するニュースを受けて、これが実際にブルなサインで良い買いチャンスなのか、それとも悪いニュースでエグジットの合図なのか、誰か教えてくれませんか?いつ出た方がいいですか?
$ETH
$ETH
1
2
203
·
--
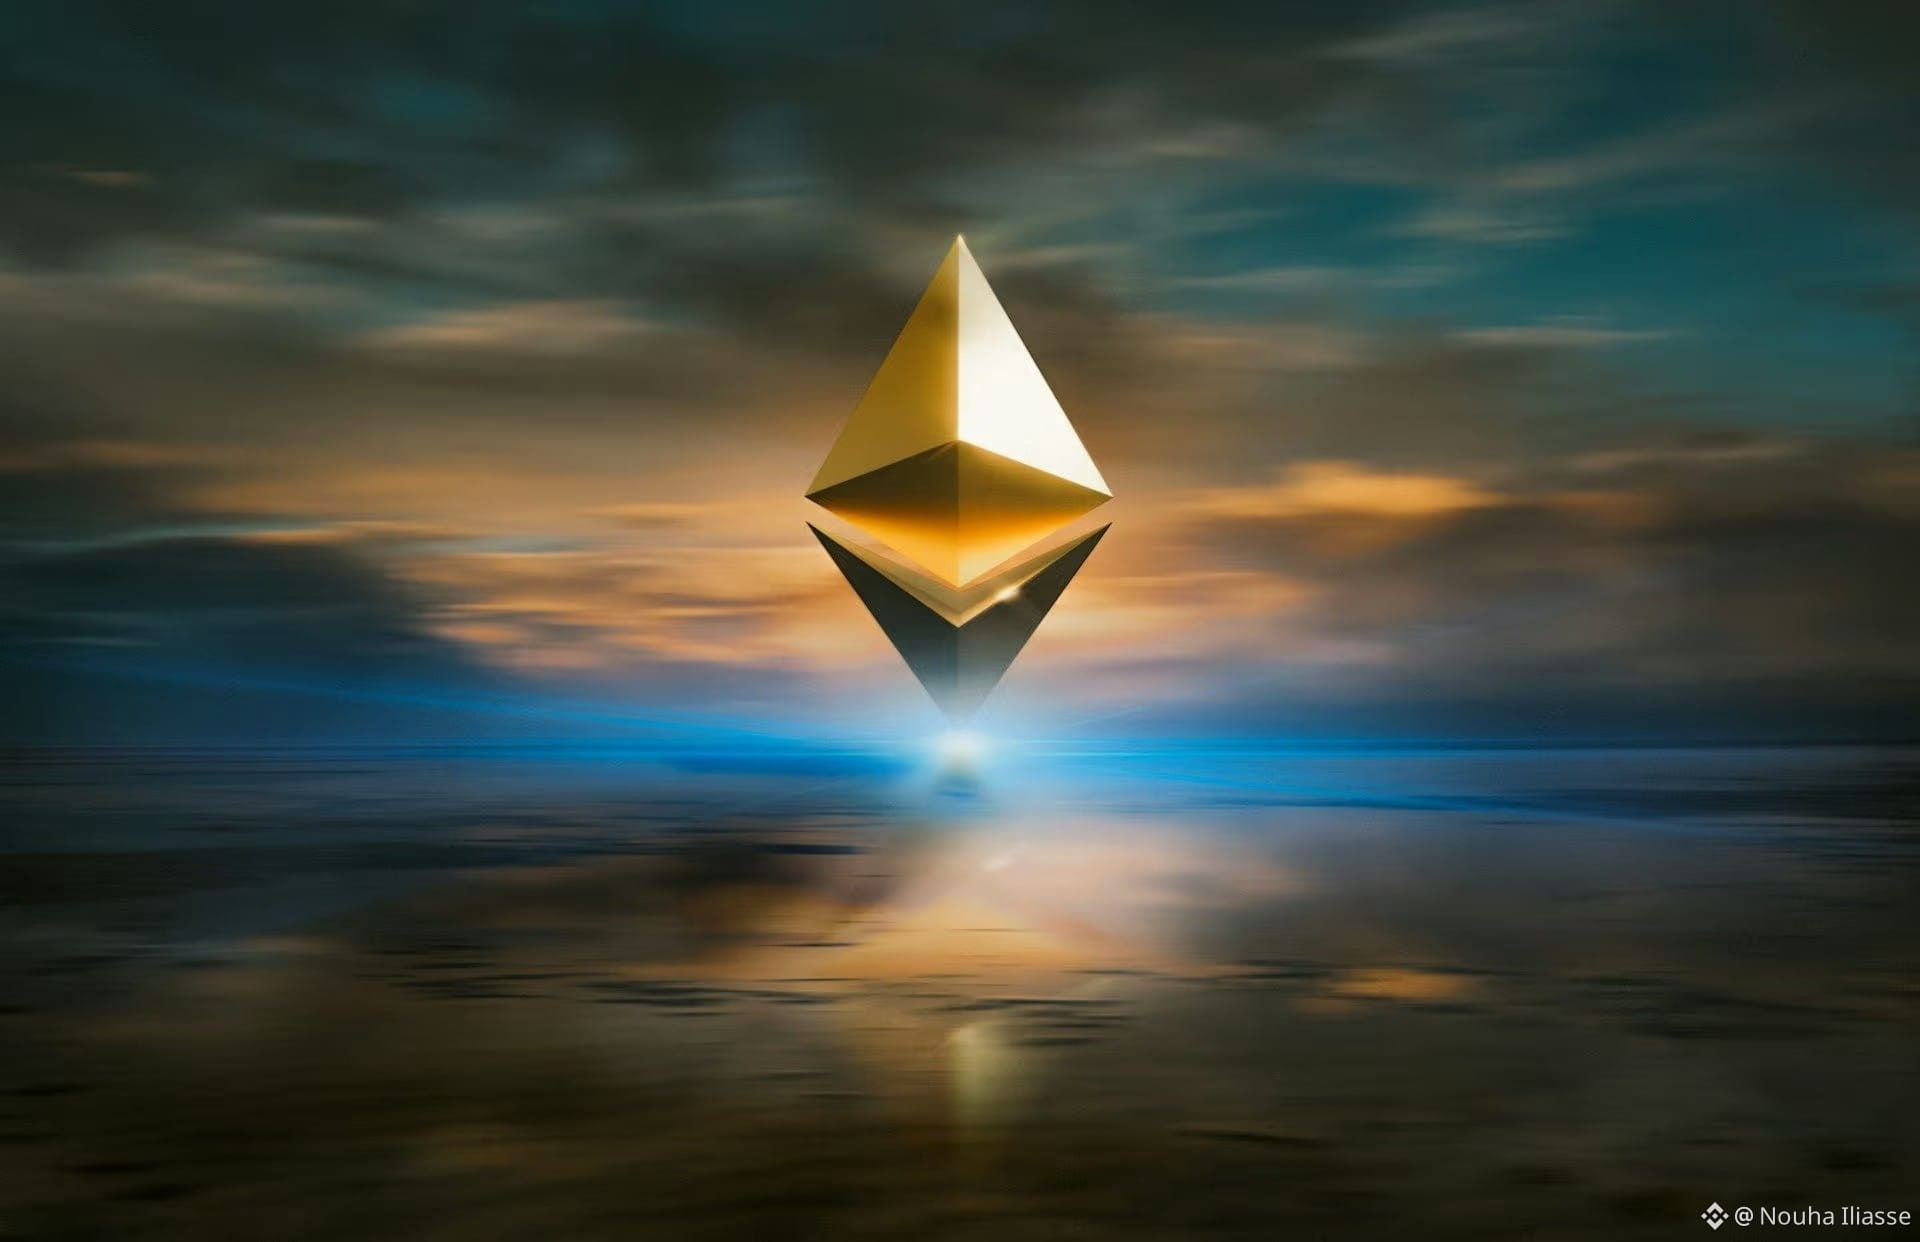
🚨イーサリアムの内部で何が起こっているのか? 大規模な離脱とアップグレードの遅延!
みんなが$ETH の価格チャートを見つめている間、イーサリアム財団での大きな内部の変化がコミュニティに答えを求めさせています:
ブレインドレイン:高名な離脱の大波(共同エグゼクティブディレクターのトマシュ・スタンチャクやティム・ベイコのようなコアリーダーを含む)が財団を襲いました。
理由は? リストラクチャリングと厳しい予算。トップタレントが新しい高給のL1/L2プロジェクトに移籍しているとのこと。
影響:非常に期待されていたグラムスターダムアップグレードは、当初6月に予定されていましたが、公式に2026年第3四半期に遅延されました。
財団は、これがイーサリアムをより分散化するための「引き算」戦略の一環であると主張していますが、クリプトツイッターはFUDで溢れています
$BTC
$ETH
{spot}(ETHUSDT)
🚨イーサリアムの内部で何が起こっているのか? 大規模な離脱とアップグレードの遅延!
みんなが$ETH の価格チャートを見つめている間、イーサリアム財団での大きな内部の変化がコミュニティに答えを求めさせています:
ブレインドレイン:高名な離脱の大波(共同エグゼクティブディレクターのトマシュ・スタンチャクやティム・ベイコのようなコアリーダーを含む)が財団を襲いました。
理由は? リストラクチャリングと厳しい予算。トップタレントが新しい高給のL1/L2プロジェクトに移籍しているとのこと。
影響:非常に期待されていたグラムスターダムアップグレードは、当初6月に予定されていましたが、公式に2026年第3四半期に遅延されました。
財団は、これがイーサリアムをより分散化するための「引き算」戦略の一環であると主張していますが、クリプトツイッターはFUDで溢れています
$BTC
$ETH
みんなが$ETH の価格チャートを見つめている間、イーサリアム財団での大きな内部の変化がコミュニティに答えを求めさせています:
ブレインドレイン:高名な離脱の大波(共同エグゼクティブディレクターのトマシュ・スタンチャクやティム・ベイコのようなコアリーダーを含む)が財団を襲いました。
理由は? リストラクチャリングと厳しい予算。トップタレントが新しい高給のL1/L2プロジェクトに移籍しているとのこと。
影響:非常に期待されていたグラムスターダムアップグレードは、当初6月に予定されていましたが、公式に2026年第3四半期に遅延されました。
財団は、これがイーサリアムをより分散化するための「引き算」戦略の一環であると主張していますが、クリプトツイッターはFUDで溢れています
$BTC
$ETH
99
·
--
ブリッシュ
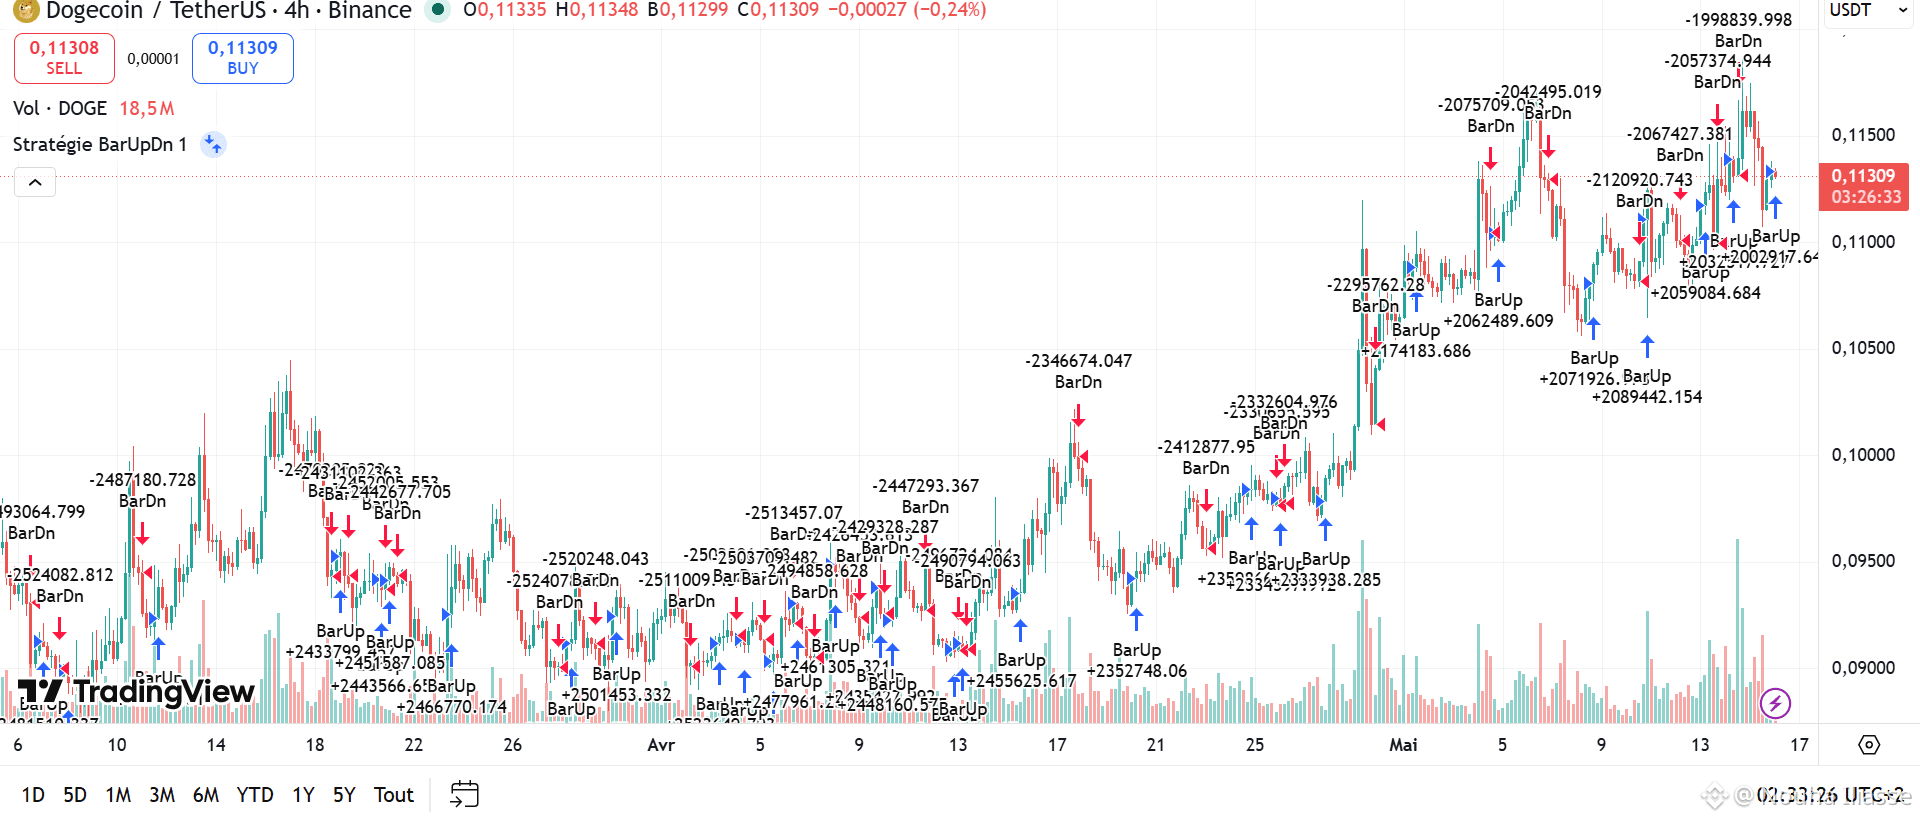
🚀🔥$DOGEのチャートがSpaceXのニュースで点火!
シェアした分析(画像参照)を見てみて—まさにその通りになってる!IPOニュースの後、Dogecoinは「グリーンキャンドル」を印刷し、蓄積ゾーンを突破した。
今、チャートから何がわかる?
クジラたちがこのレベルで116億ドルの資金を投入した。
次のターゲットは$0.13で、6月4日にSpaceXのロードショーが始まると、大きなボラティリティが見られるだろう。
テクニカルヒント:ディップで売らないこと。チャートは「上昇トレンド」が今まさに加熱していると言ってる。💥🤑
{spot}(DOGEUSDT)
🚀🔥$DOGEのチャートがSpaceXのニュースで点火!
シェアした分析(画像参照)を見てみて—まさにその通りになってる!IPOニュースの後、Dogecoinは「グリーンキャンドル」を印刷し、蓄積ゾーンを突破した。
今、チャートから何がわかる?
クジラたちがこのレベルで116億ドルの資金を投入した。
次のターゲットは$0.13で、6月4日にSpaceXのロードショーが始まると、大きなボラティリティが見られるだろう。
テクニカルヒント:ディップで売らないこと。チャートは「上昇トレンド」が今まさに加熱していると言ってる。💥🤑
シェアした分析(画像参照)を見てみて—まさにその通りになってる!IPOニュースの後、Dogecoinは「グリーンキャンドル」を印刷し、蓄積ゾーンを突破した。
今、チャートから何がわかる?
クジラたちがこのレベルで116億ドルの資金を投入した。
次のターゲットは$0.13で、6月4日にSpaceXのロードショーが始まると、大きなボラティリティが見られるだろう。
テクニカルヒント:ディップで売らないこと。チャートは「上昇トレンド」が今まさに加熱していると言ってる。💥🤑
1
308
·
--
ブリッシュ
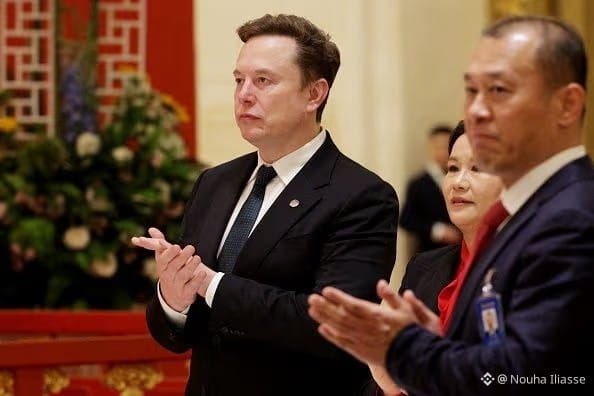
🚀 速報: SpaceXがNasdaqで6月11日にIPOを目指す!🌌
イーロン・マスクのSpaceXが、SECの迅速なレビューを受けて上場を加速しました!取引は6月12日から$SPCXというティッカーで開始される見込みです。
スケール: $1.75Tから$2Tの評価を目指して最大$75Bを調達し、瞬時に歴史上最大のIPOとなるでしょう。
クリプトへの影響: これだけの規模のテックモンスターは、大規模な流動性バキュームとして機能します。来月は全てのリスク資産において激しい資本移動と市場のボラティリティが予想されます!
あなたはクリプトをホールドしていますか、それとも6月に$SPCXを買いますか?話しましょう!
$BTC $DOGE
🚀 速報: SpaceXがNasdaqで6月11日にIPOを目指す!🌌
イーロン・マスクのSpaceXが、SECの迅速なレビューを受けて上場を加速しました!取引は6月12日から$SPCXというティッカーで開始される見込みです。
スケール: $1.75Tから$2Tの評価を目指して最大$75Bを調達し、瞬時に歴史上最大のIPOとなるでしょう。
クリプトへの影響: これだけの規模のテックモンスターは、大規模な流動性バキュームとして機能します。来月は全てのリスク資産において激しい資本移動と市場のボラティリティが予想されます!
あなたはクリプトをホールドしていますか、それとも6月に$SPCXを買いますか?話しましょう!
$BTC $DOGE
イーロン・マスクのSpaceXが、SECの迅速なレビューを受けて上場を加速しました!取引は6月12日から$SPCXというティッカーで開始される見込みです。
スケール: $1.75Tから$2Tの評価を目指して最大$75Bを調達し、瞬時に歴史上最大のIPOとなるでしょう。
クリプトへの影響: これだけの規模のテックモンスターは、大規模な流動性バキュームとして機能します。来月は全てのリスク資産において激しい資本移動と市場のボラティリティが予想されます!
あなたはクリプトをホールドしていますか、それとも6月に$SPCXを買いますか?話しましょう!
$BTC $DOGE
114
·
--
👽米国の議員がトランプにCFTCを修正するよう促す! 🇺🇸
上院の議員たちは、トランプ大統領にCFTCの空席を急いで埋めるように二党派のリーダーシップを求めています。
これがあなたのポートフォリオにとって重要な理由は? 🤔
さようならSEC:CLARITY法案が急速に進行中で、CFTCが米国の暗号取引を監視する絶対的な権限を正式に引き継ぎます。
問題点:CFTCは現在、スタッフが非常に不足しています。議員たちは、このリーダーシップの空白が重要な明確な暗号規制の遅延を引き起こすことを懸念しています。
クジラにとってのグリーンライト:二党派の安定性は、機関投資家たちが政治的リスクなしに市場に数兆ドルを注入するために必要なものです。
結論:暗号は正式に機関化されつつあります。明確なルール = 大量の流動性が到来します。
$BTC $ETH $XRP
👽米国の議員がトランプにCFTCを修正するよう促す! 🇺🇸
上院の議員たちは、トランプ大統領にCFTCの空席を急いで埋めるように二党派のリーダーシップを求めています。
これがあなたのポートフォリオにとって重要な理由は? 🤔
さようならSEC:CLARITY法案が急速に進行中で、CFTCが米国の暗号取引を監視する絶対的な権限を正式に引き継ぎます。
問題点:CFTCは現在、スタッフが非常に不足しています。議員たちは、このリーダーシップの空白が重要な明確な暗号規制の遅延を引き起こすことを懸念しています。
クジラにとってのグリーンライト:二党派の安定性は、機関投資家たちが政治的リスクなしに市場に数兆ドルを注入するために必要なものです。
結論:暗号は正式に機関化されつつあります。明確なルール = 大量の流動性が到来します。
$BTC $ETH $XRP
上院の議員たちは、トランプ大統領にCFTCの空席を急いで埋めるように二党派のリーダーシップを求めています。
これがあなたのポートフォリオにとって重要な理由は? 🤔
さようならSEC:CLARITY法案が急速に進行中で、CFTCが米国の暗号取引を監視する絶対的な権限を正式に引き継ぎます。
問題点:CFTCは現在、スタッフが非常に不足しています。議員たちは、このリーダーシップの空白が重要な明確な暗号規制の遅延を引き起こすことを懸念しています。
クジラにとってのグリーンライト:二党派の安定性は、機関投資家たちが政治的リスクなしに市場に数兆ドルを注入するために必要なものです。
結論:暗号は正式に機関化されつつあります。明確なルール = 大量の流動性が到来します。
$BTC $ETH $XRP
83
ログインして、さらにコンテンツを読む
厳選トピックで世界の暗号資産トレーダーの仲間入り
⚡️ 暗号資産に関する最新かつ有益な情報が見つかります。
💬 世界最大の暗号資産取引所から信頼されています。
👍 認証を受けたクリエイターから、有益なインサイトを得られます。
メール / 電話番号