
NIGHTEYE
7.8k 投稿

NIGHTEYE
報告
ユーザーをブロック
average gambler with daily signals and analysis daily market update and analysis @nighteye22 @sakibulefty2
取引を発注

AXISホルダー
高頻度トレーダー
5.8年
21 フォロー
2.6K+ フォロワー
4.4K+ いいね
投稿
ポートフォリオ
すべて
引用
動画
ライブ
PINNED
·
--
弱気相場
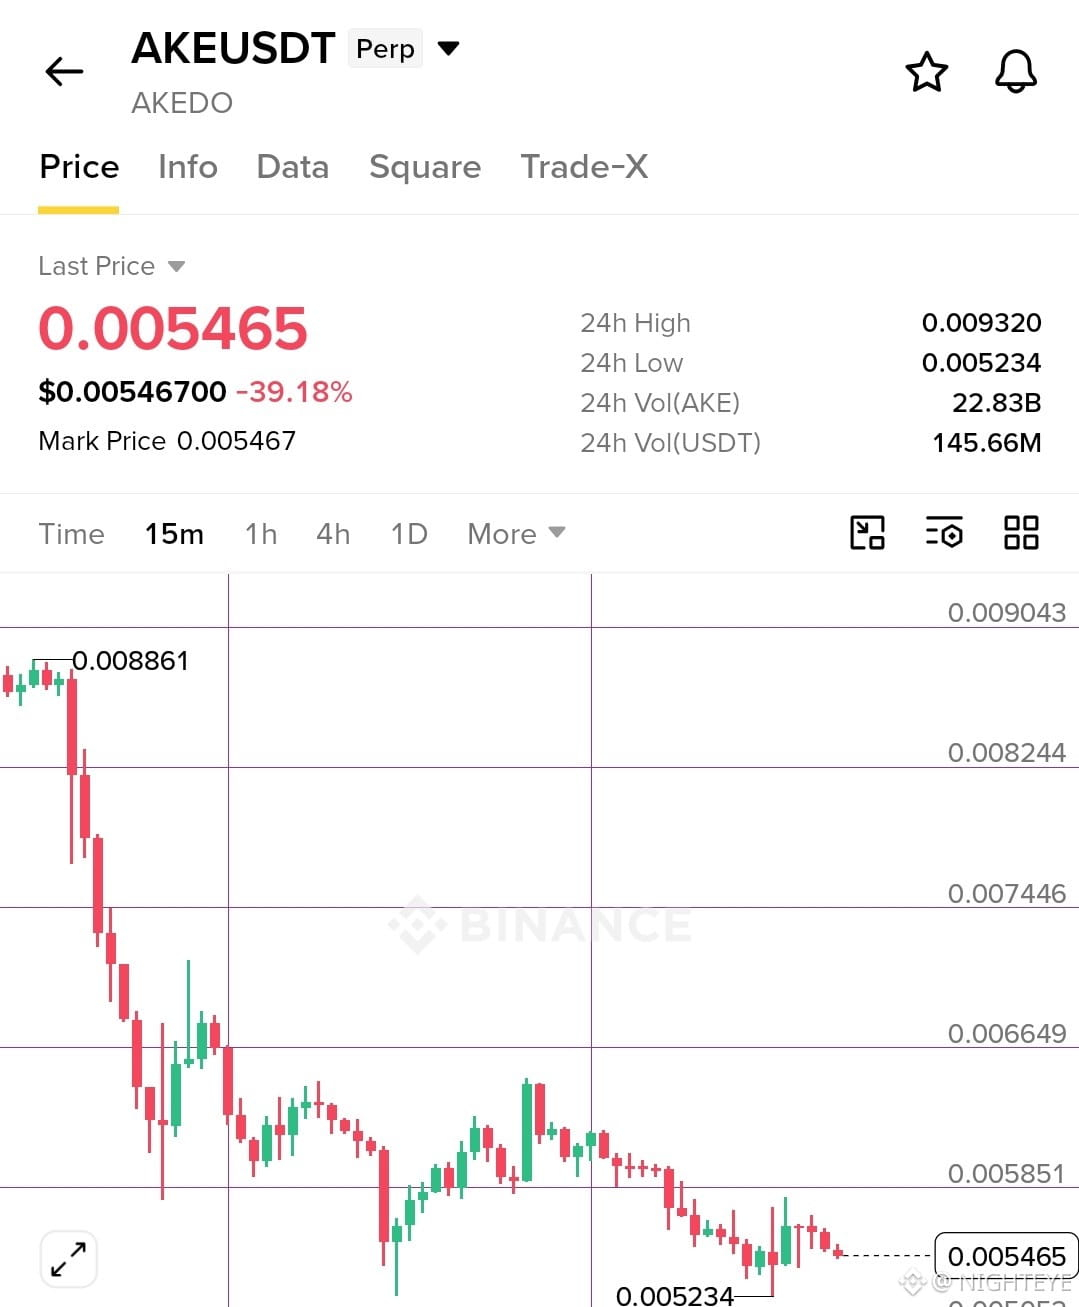
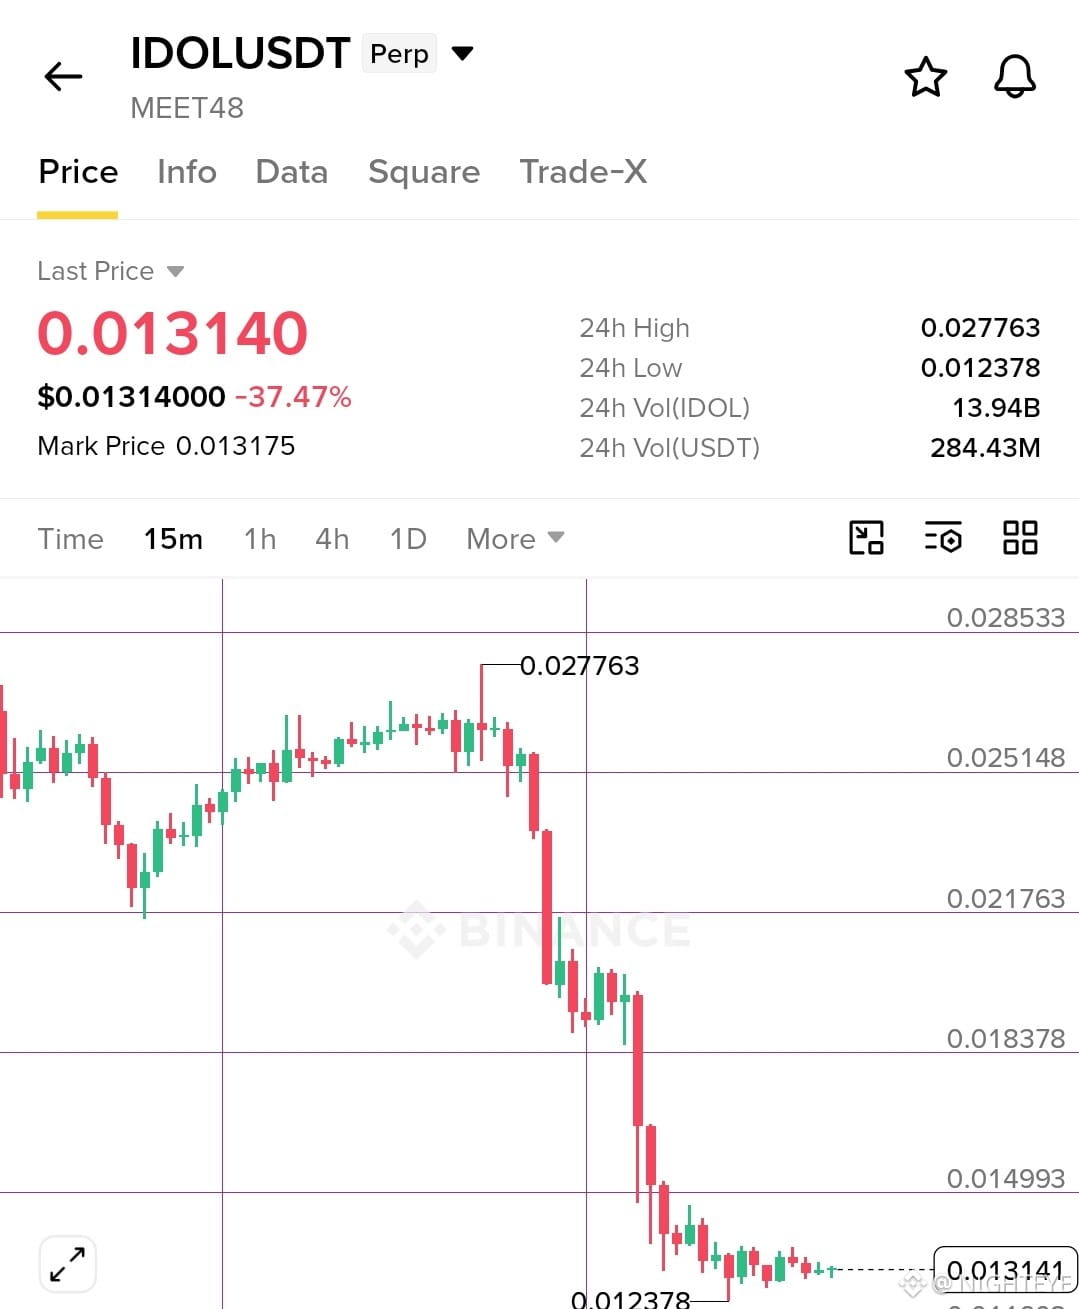
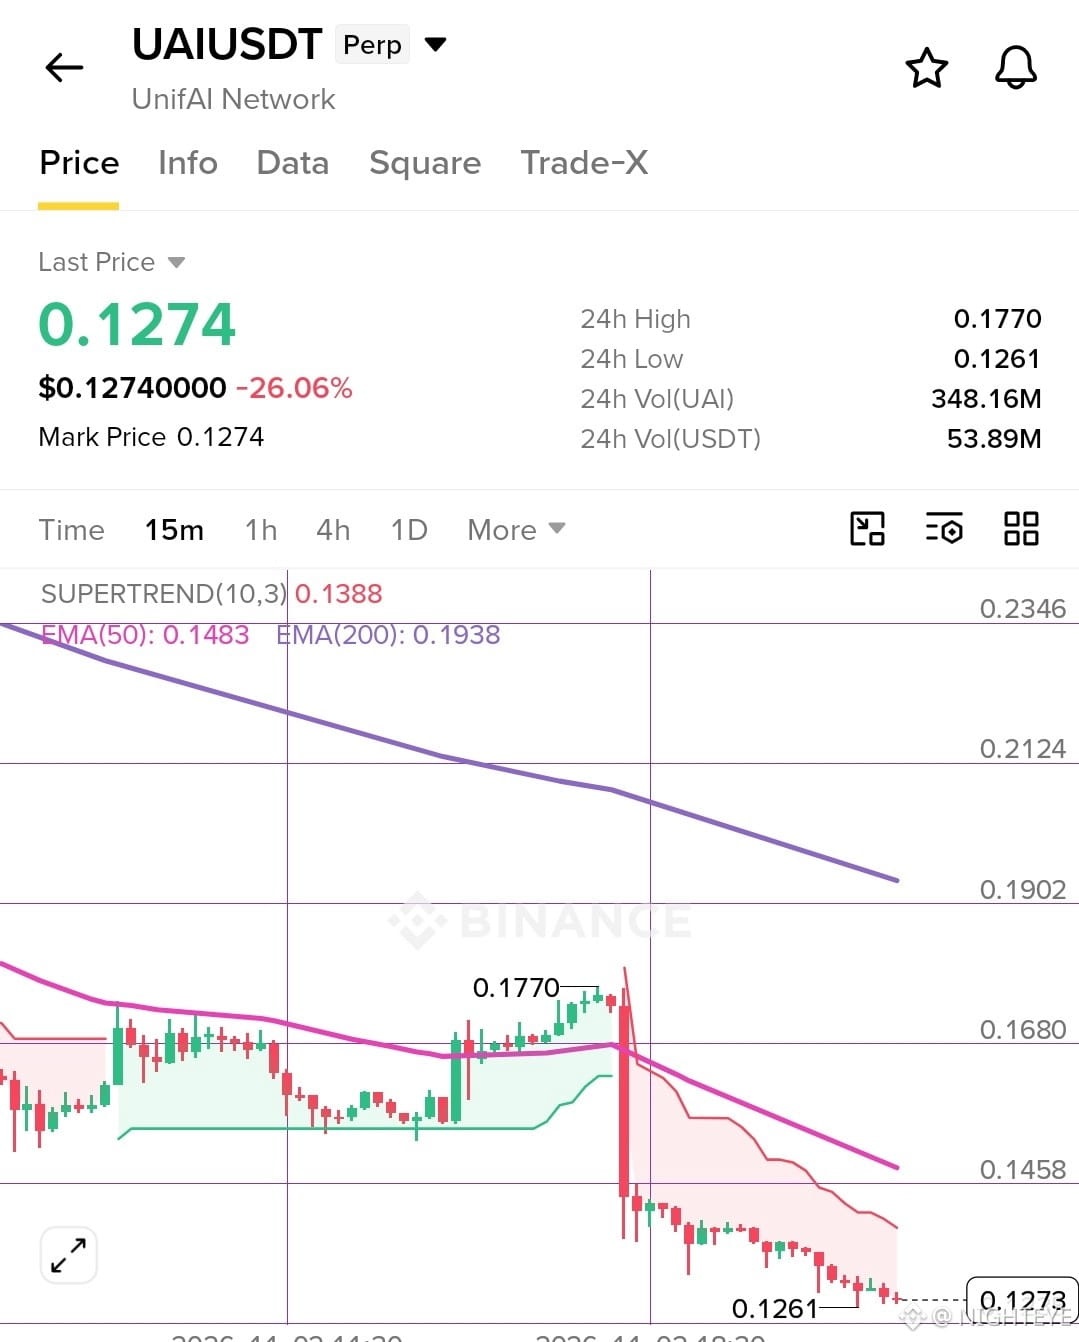
最も操作されているトークンのうち3つが、わずか1週間で大幅に下落しました。同じ週に下落しているのは偶然ではありません。
これらのトークンを操作しているクジラは、100個のアカウントを作ってトークンを操作する単一のグループです。これはもう数年近く続いています。以前は1日でパンプ・アンド・ダンプをしていましたが、今では何か月もトークンを操作した後、たった1日で個人投資家に売りつけています。
今日、$AKE 、$IDOL 、$UAI が下落しました。明日にはまた新しいトークンが出てくるでしょう。今ではそれもゲームの一部です。個人投資家はこうしたトークンを好むため、取引量が非常に多くなっています。
$BTWも次に下落する可能性があるトークンです。
{future}(UAIUSDT)
{future}(IDOLUSDT)
{future}(AKEUSDT)
最も操作されているトークンのうち3つが、わずか1週間で大幅に下落しました。同じ週に下落しているのは偶然ではありません。
これらのトークンを操作しているクジラは、100個のアカウントを作ってトークンを操作する単一のグループです。これはもう数年近く続いています。以前は1日でパンプ・アンド・ダンプをしていましたが、今では何か月もトークンを操作した後、たった1日で個人投資家に売りつけています。
今日、$AKE 、$IDOL 、$UAI が下落しました。明日にはまた新しいトークンが出てくるでしょう。今ではそれもゲームの一部です。個人投資家はこうしたトークンを好むため、取引量が非常に多くなっています。
$BTWも次に下落する可能性があるトークンです。
これらのトークンを操作しているクジラは、100個のアカウントを作ってトークンを操作する単一のグループです。これはもう数年近く続いています。以前は1日でパンプ・アンド・ダンプをしていましたが、今では何か月もトークンを操作した後、たった1日で個人投資家に売りつけています。
今日、$AKE 、$IDOL 、$UAI が下落しました。明日にはまた新しいトークンが出てくるでしょう。今ではそれもゲームの一部です。個人投資家はこうしたトークンを好むため、取引量が非常に多くなっています。
$BTWも次に下落する可能性があるトークンです。
1.4k
·
--
弱気相場
翻訳参照
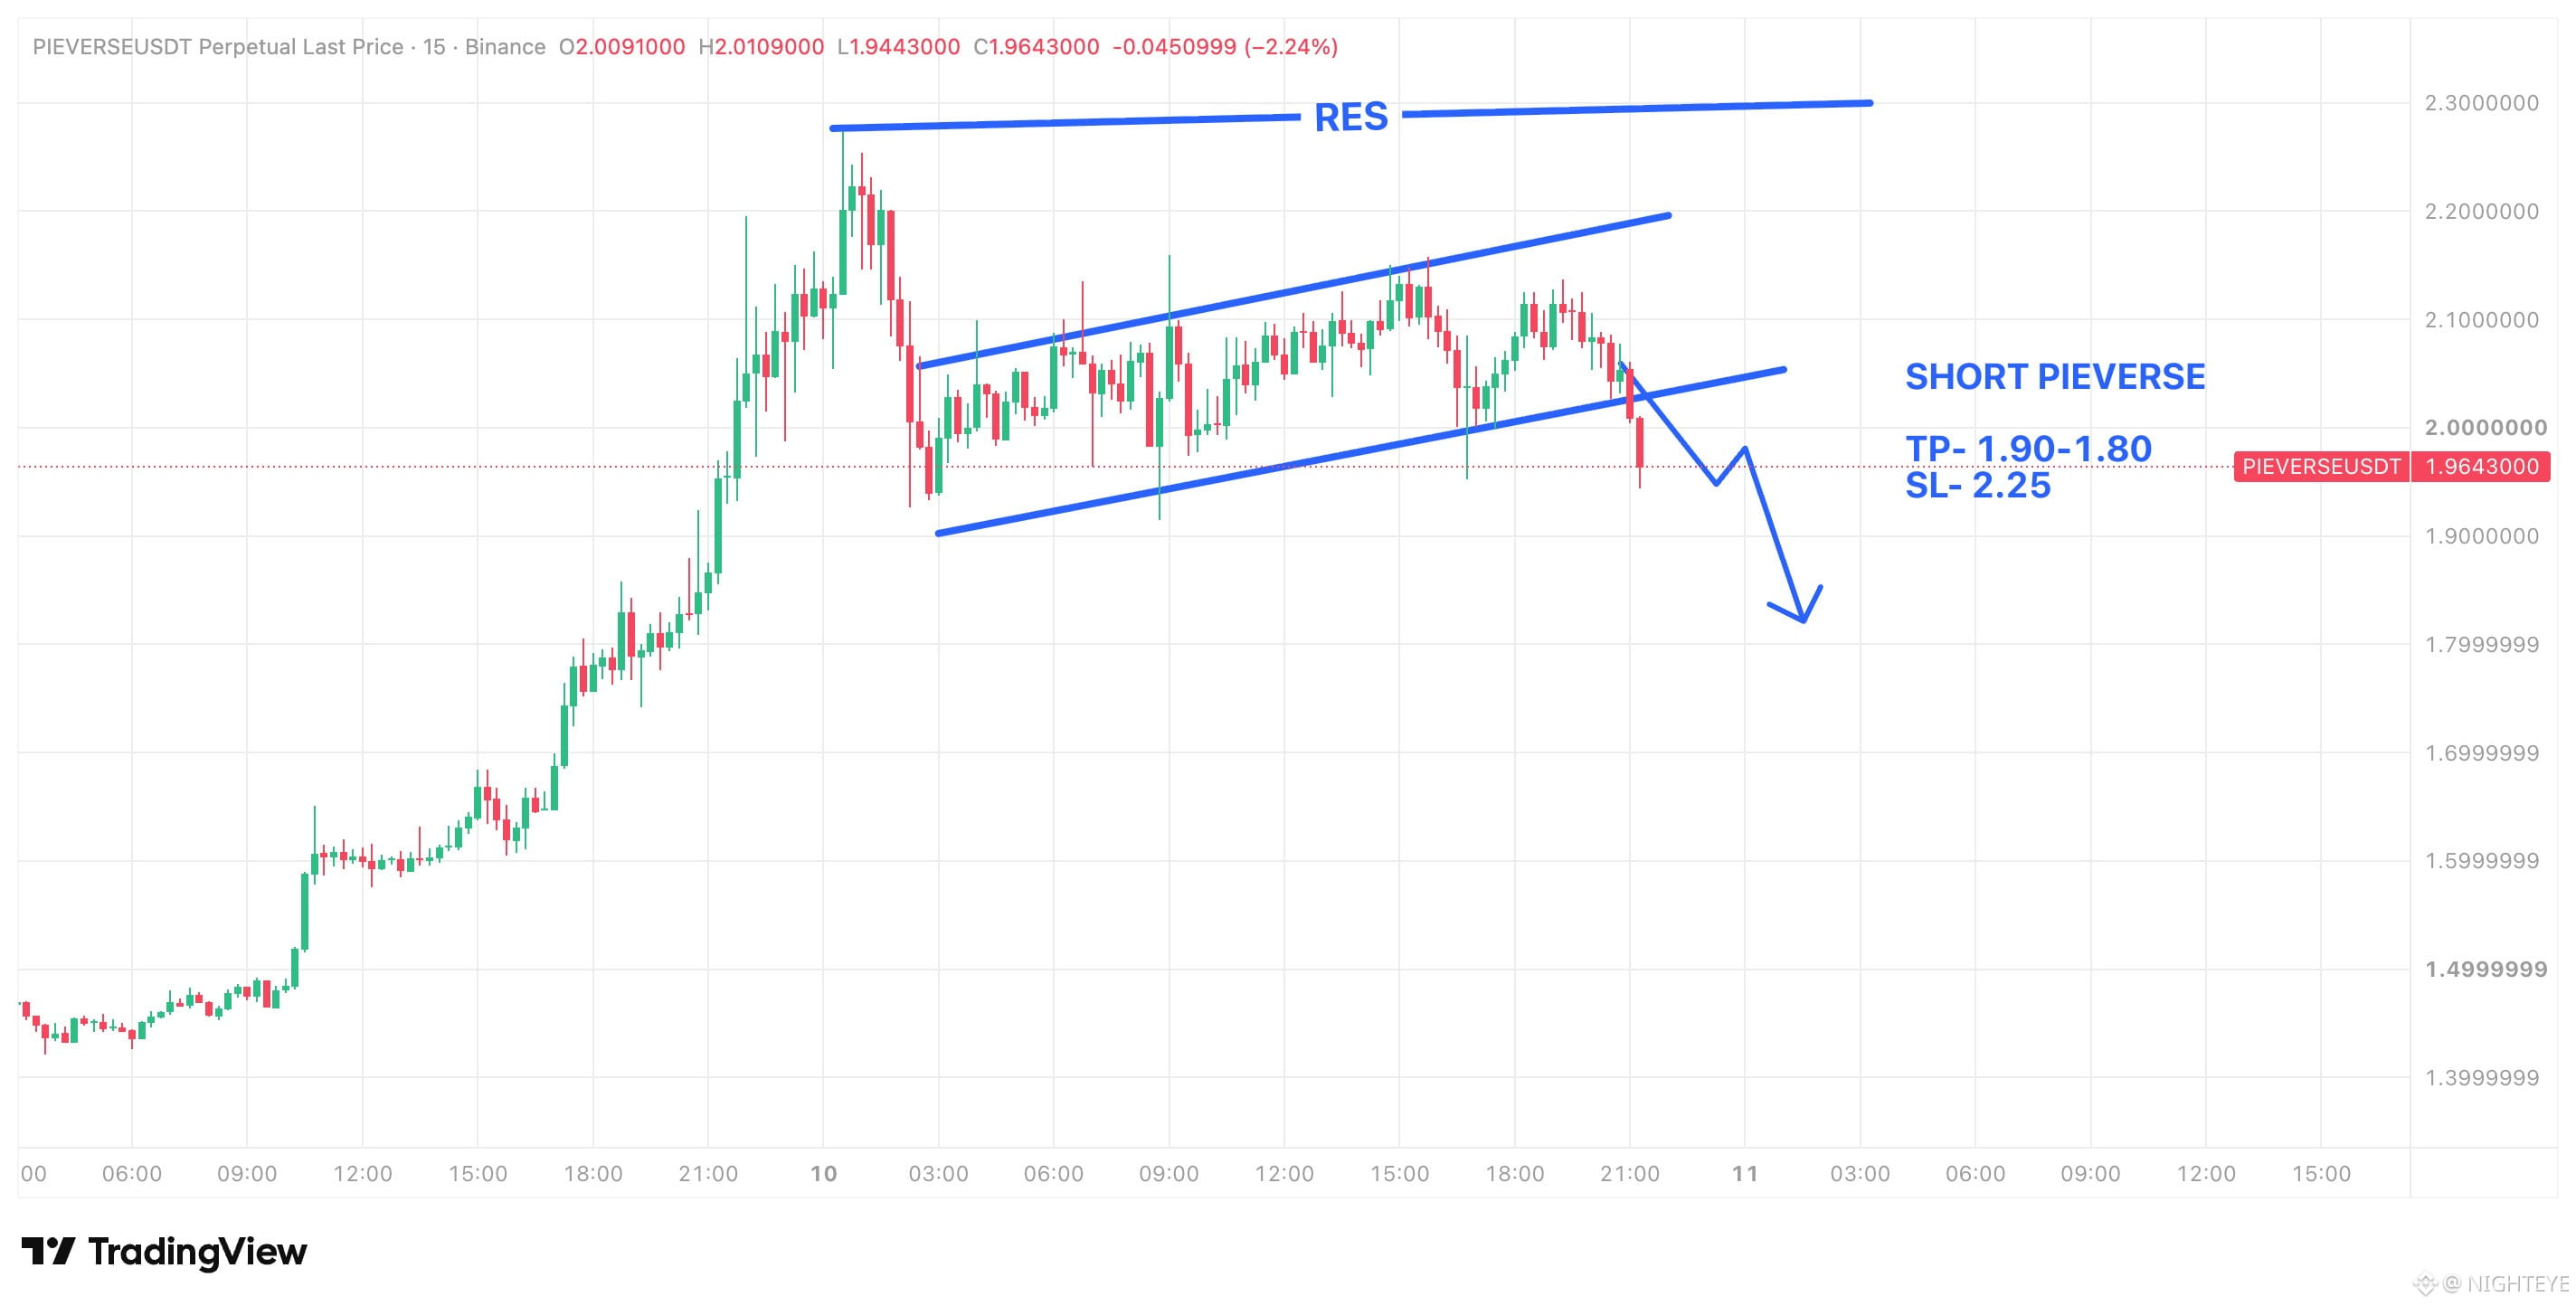
$PIEVERSE just broke below the rising channel it had been building since the sharp drop off the 2.27 high.
The bounces inside that channel were slow, with each push stalling under the upper trendline near 2.10 and never getting back toward the highs. That looks more like a bear flag than a base. The lower trendline gave way around 2.00 on a strong red candle, and the last two closes are sitting under it. The first real support is the 1.90 area where the channel started, and below that there's very little structure until 1.80.
If price stays under 2.00 and the channel line turns into resistance on a retest, I'd expect 1.90 first and then a push toward 1.80. If it reclaims 2.10 and holds, the breakdown was a fakeout, and the 2.25 resistance comes back into play.
$PIEVERSE just broke below the rising channel it had been building since the sharp drop off the 2.27 high.
The bounces inside that channel were slow, with each push stalling under the upper trendline near 2.10 and never getting back toward the highs. That looks more like a bear flag than a base. The lower trendline gave way around 2.00 on a strong red candle, and the last two closes are sitting under it. The first real support is the 1.90 area where the channel started, and below that there's very little structure until 1.80.
If price stays under 2.00 and the channel line turns into resistance on a retest, I'd expect 1.90 first and then a push toward 1.80. If it reclaims 2.10 and holds, the breakdown was a fakeout, and the 2.25 resistance comes back into play.
The bounces inside that channel were slow, with each push stalling under the upper trendline near 2.10 and never getting back toward the highs. That looks more like a bear flag than a base. The lower trendline gave way around 2.00 on a strong red candle, and the last two closes are sitting under it. The first real support is the 1.90 area where the channel started, and below that there's very little structure until 1.80.
If price stays under 2.00 and the channel line turns into resistance on a retest, I'd expect 1.90 first and then a push toward 1.80. If it reclaims 2.10 and holds, the breakdown was a fakeout, and the 2.25 resistance comes back into play.
290
·
--
弱気相場
翻訳参照
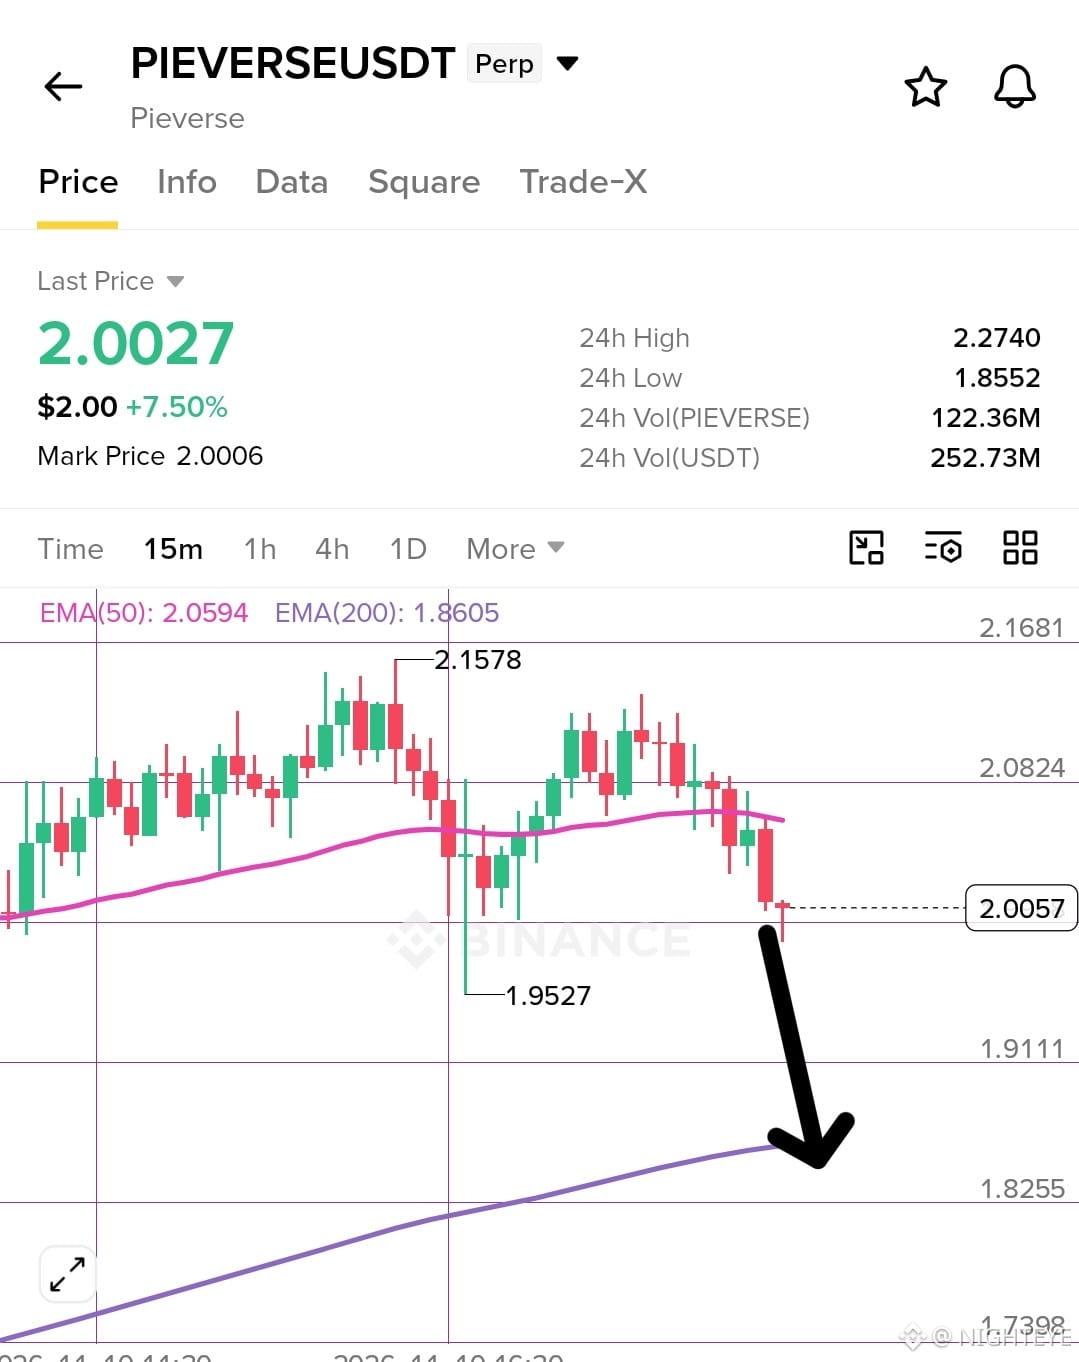
$PIEVERSE is showing weakness here and i expect some break down soon so open a short here 🔴
Entry- 2.0-2.10
SL- 2.30
TP - 1.90-1.80
{future}(PIEVERSEUSDT)
$PIEVERSE is showing weakness here and i expect some break down soon so open a short here 🔴
Entry- 2.0-2.10
SL- 2.30
TP - 1.90-1.80
Entry- 2.0-2.10
SL- 2.30
TP - 1.90-1.80
1
2
298
·
--
ブリッシュ
翻訳参照
$SNDK Big bounce from bottom and smashed first target 🚀
We are just getting started on this don't miss trade here 👇
{future}(SNDKUSDT)
$SNDK Big bounce from bottom and smashed first target 🚀
We are just getting started on this don't miss trade here 👇
We are just getting started on this don't miss trade here 👇
NIGHTEYE
·
--
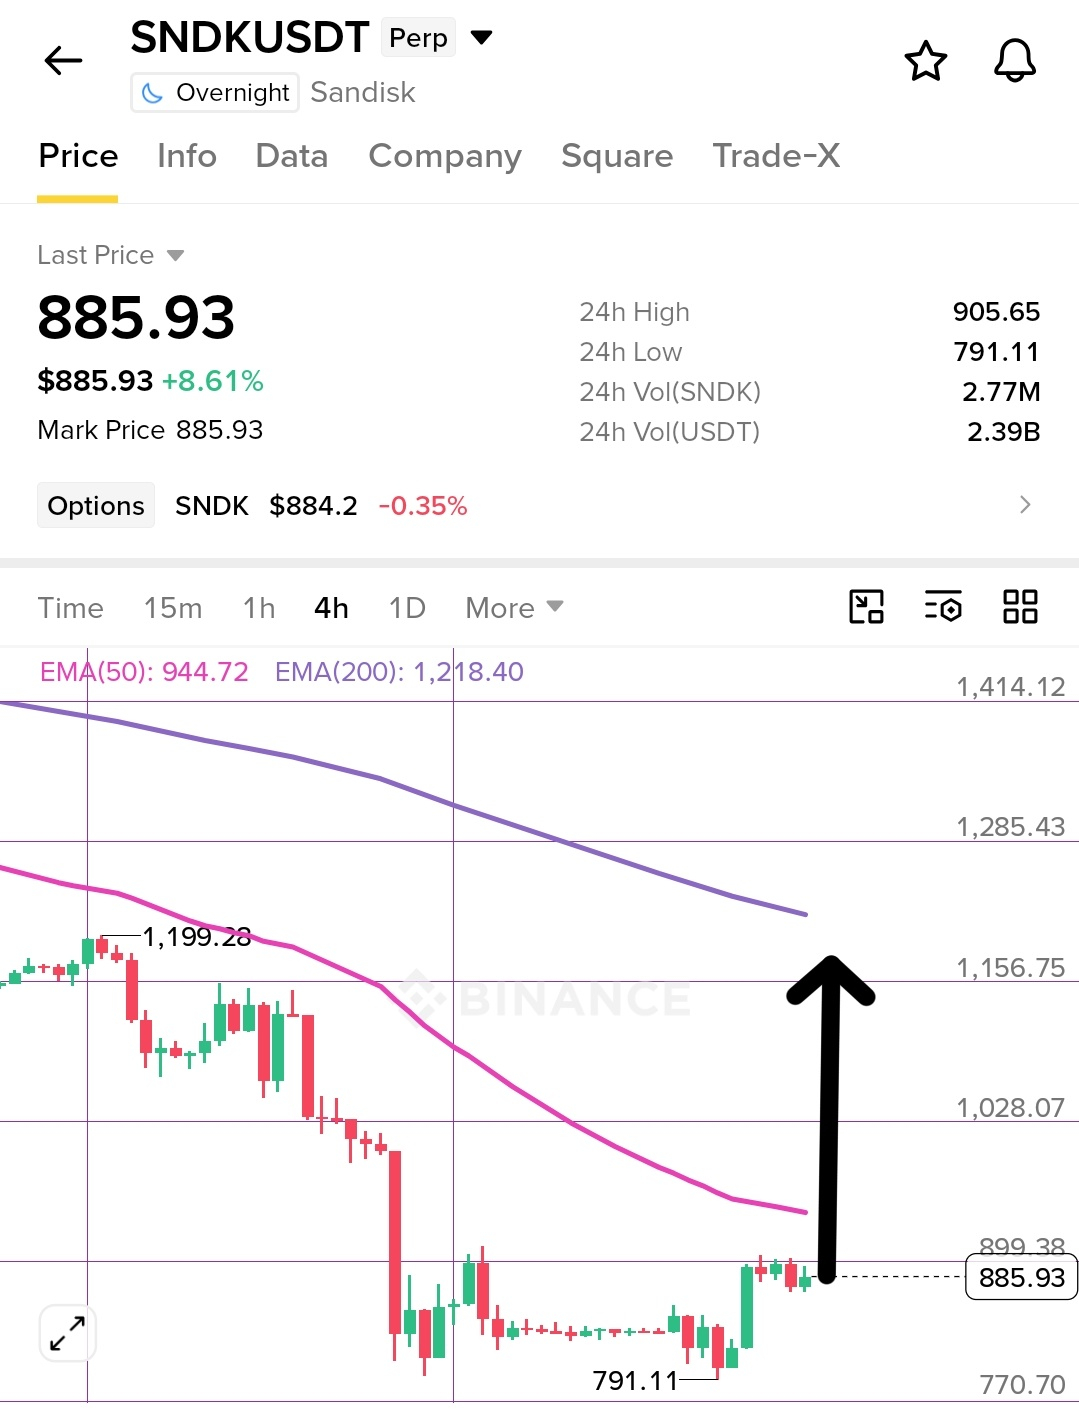
ブリッシュLong on $SNDK here stock market showing some strength so this is going give some pump 🟢
Entry- 840-880
SL- 780
TP - 900-930-950
Entry- 840-880
SL- 780
TP - 900-930-950
476
·
--
ブリッシュ
翻訳参照
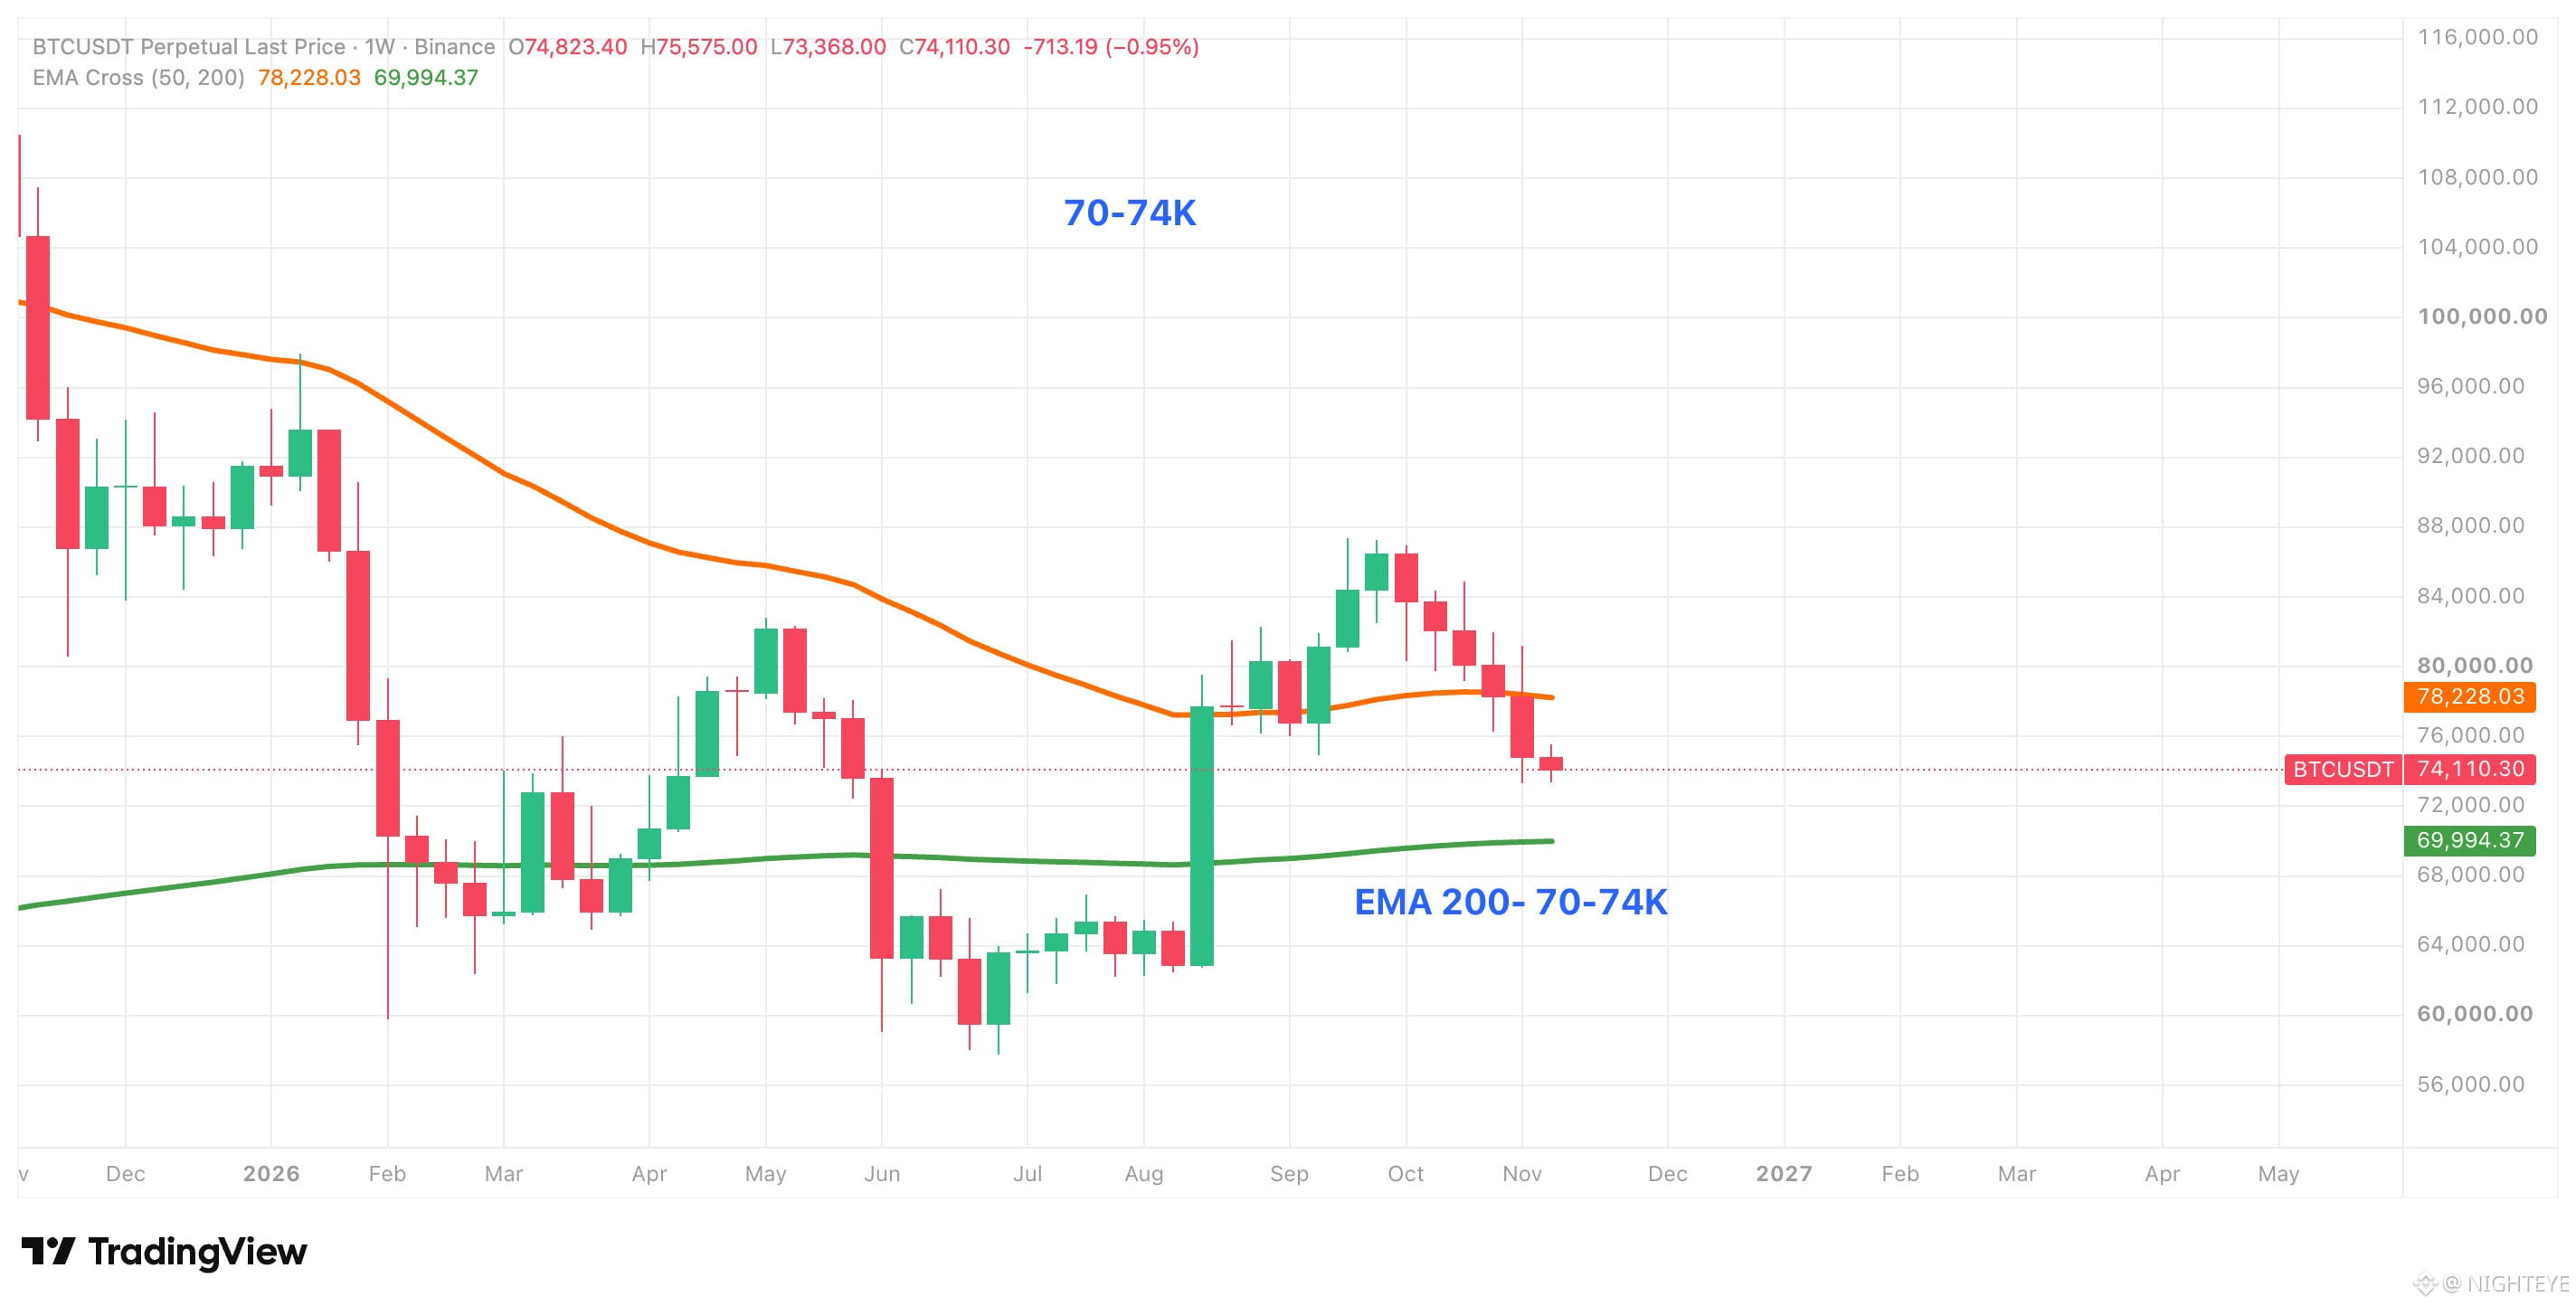
$BTC lost the weekly 50 EMA and is now sitting right above the 200 EMA, with the 70-74K zone as the next real test.
The rejection near 87K turned into five red weekly candles in a row, and the last one closed under the 50 EMA around 78.2K.
What I like about the 70-74K zone is that it stacks the 200 EMA near 70K with the area where the big weekly breakout candle started, so buyers have a reason to show up there. I'm not treating it as a guaranteed bounce, though. Momentum is still pointing down, and the 50 EMA is now overhead resistance.
If price holds 70-74K and reclaims 78.2K, the pullback was just a retest and the trend stays intact. If BTC closes a weekly candle below 70K, the 200 EMA is gone as support, and the next area on the chart is the 60K lows.
{future}(BTCUSDT)
$BTC lost the weekly 50 EMA and is now sitting right above the 200 EMA, with the 70-74K zone as the next real test.
The rejection near 87K turned into five red weekly candles in a row, and the last one closed under the 50 EMA around 78.2K.
What I like about the 70-74K zone is that it stacks the 200 EMA near 70K with the area where the big weekly breakout candle started, so buyers have a reason to show up there. I'm not treating it as a guaranteed bounce, though. Momentum is still pointing down, and the 50 EMA is now overhead resistance.
If price holds 70-74K and reclaims 78.2K, the pullback was just a retest and the trend stays intact. If BTC closes a weekly candle below 70K, the 200 EMA is gone as support, and the next area on the chart is the 60K lows.
The rejection near 87K turned into five red weekly candles in a row, and the last one closed under the 50 EMA around 78.2K.
What I like about the 70-74K zone is that it stacks the 200 EMA near 70K with the area where the big weekly breakout candle started, so buyers have a reason to show up there. I'm not treating it as a guaranteed bounce, though. Momentum is still pointing down, and the 50 EMA is now overhead resistance.
If price holds 70-74K and reclaims 78.2K, the pullback was just a retest and the trend stays intact. If BTC closes a weekly candle below 70K, the 200 EMA is gone as support, and the next area on the chart is the 60K lows.
71
·
--
弱気相場
翻訳参照
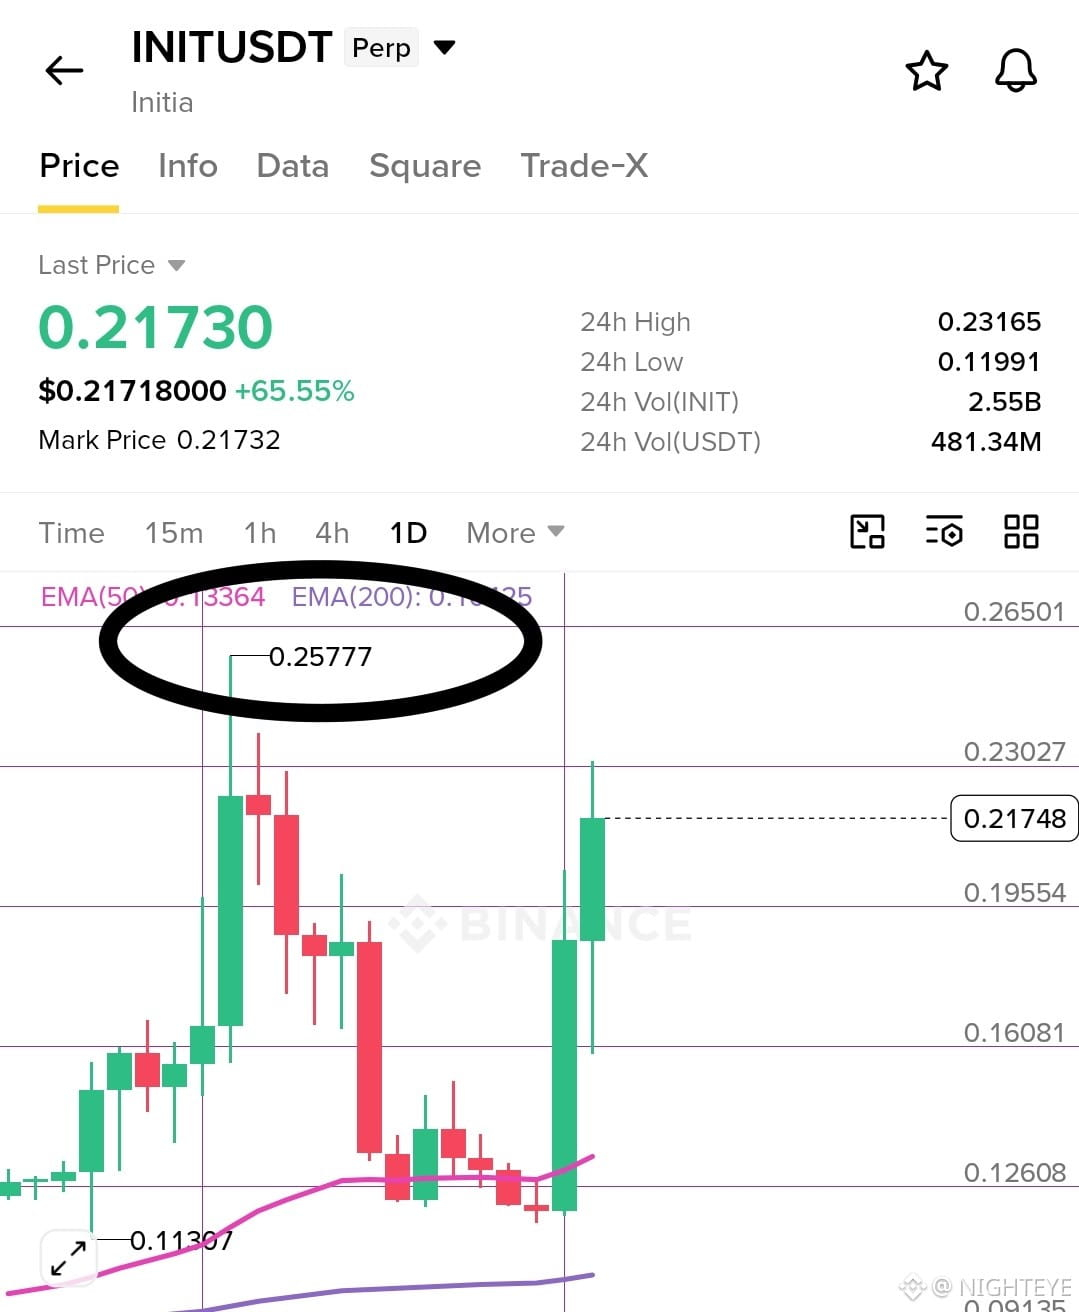
Today i am watching $INIT price action is good but there is a resistance above 0.25$ area. This resistance remains active for now and a rejection from this level will trigger a break down here in $INIT
So keep an eye on this for now 👀
{future}(INITUSDT)
Today i am watching $INIT price action is good but there is a resistance above 0.25$ area. This resistance remains active for now and a rejection from this level will trigger a break down here in $INIT
So keep an eye on this for now 👀
So keep an eye on this for now 👀
256
·
--
弱気相場
翻訳参照
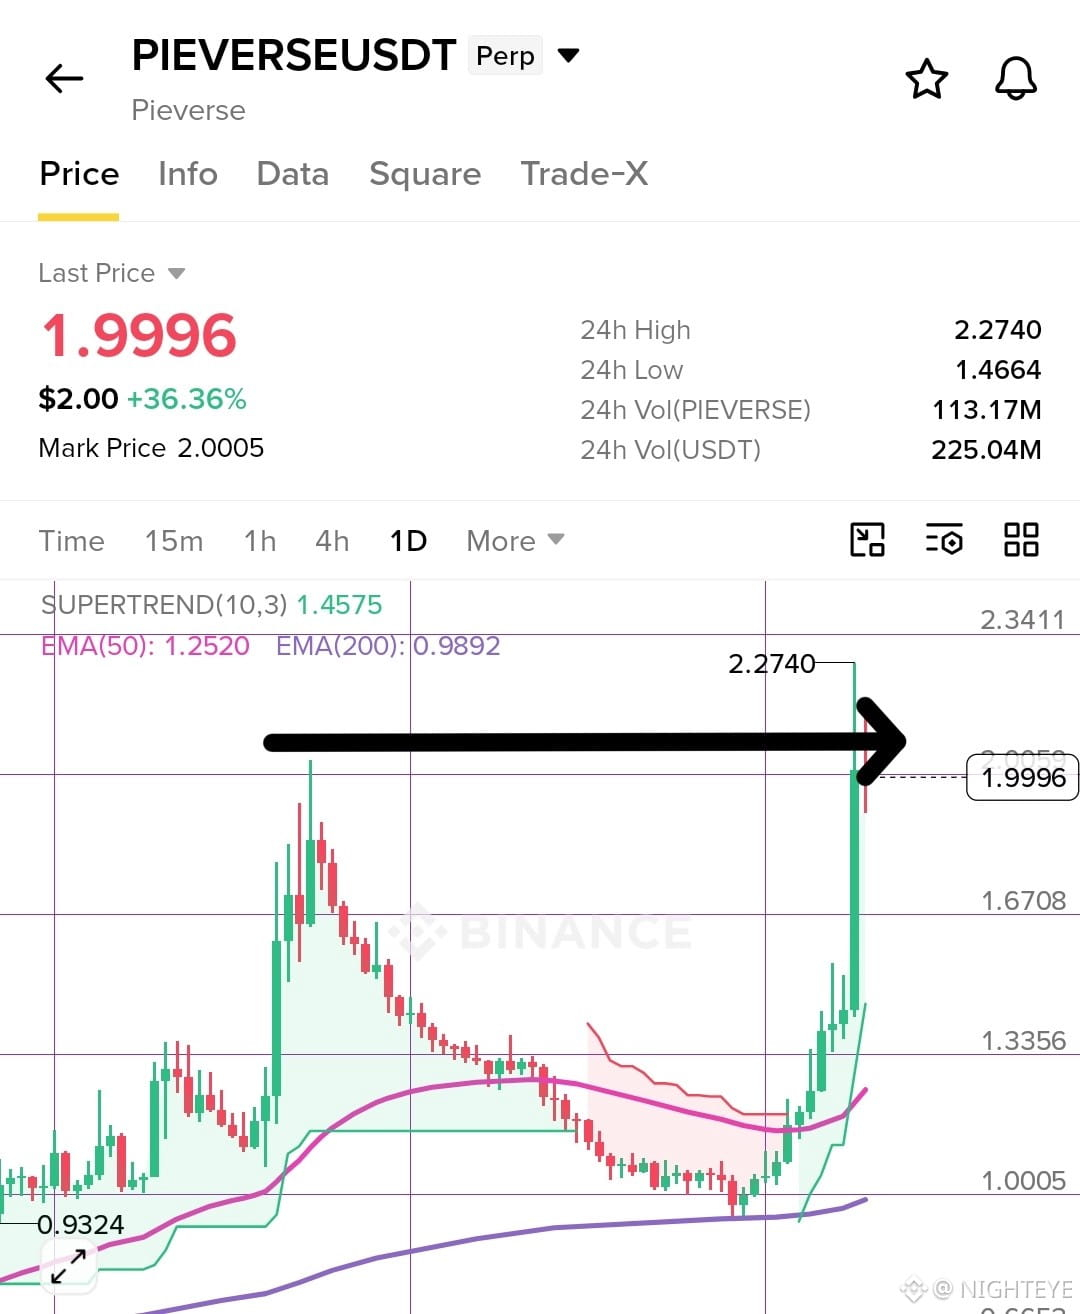
Earlier in the live stream i talked about $PIEVERSE . As i mention about the only resistance in 2$ area. Today it has break the resistance and punped again
towards 2.5$ area. Now we need to wait for how this movement will unfold.
we can see some break down very soon.
{future}(PIEVERSEUSDT)
Earlier in the live stream i talked about $PIEVERSE . As i mention about the only resistance in 2$ area. Today it has break the resistance and punped again
towards 2.5$ area. Now we need to wait for how this movement will unfold.
we can see some break down very soon.
towards 2.5$ area. Now we need to wait for how this movement will unfold.
we can see some break down very soon.
332
·
--
弱気相場
翻訳参照
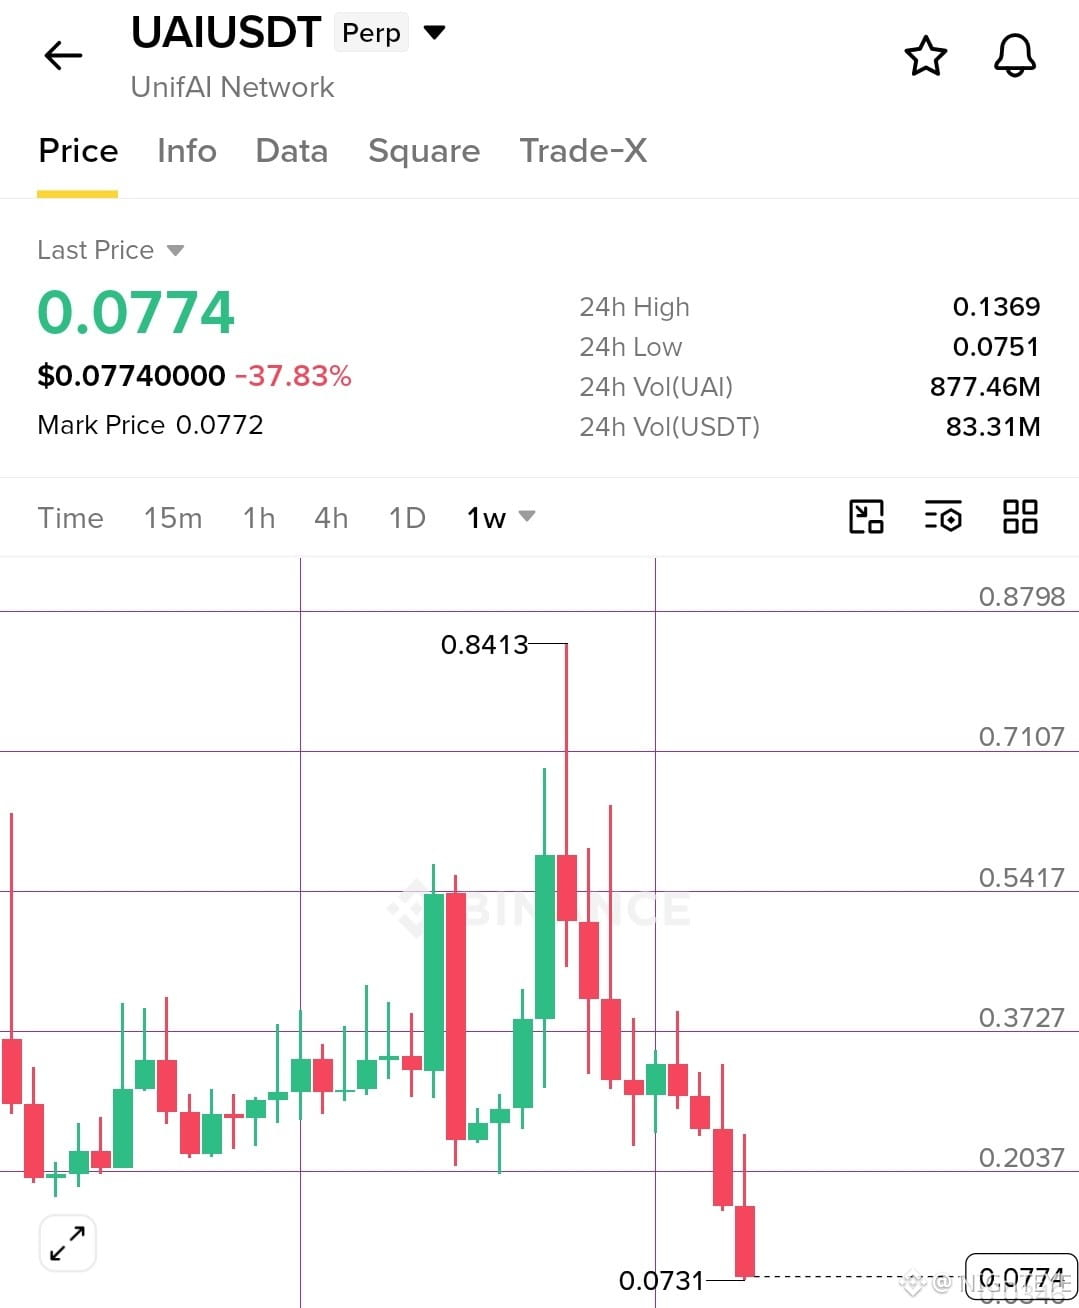
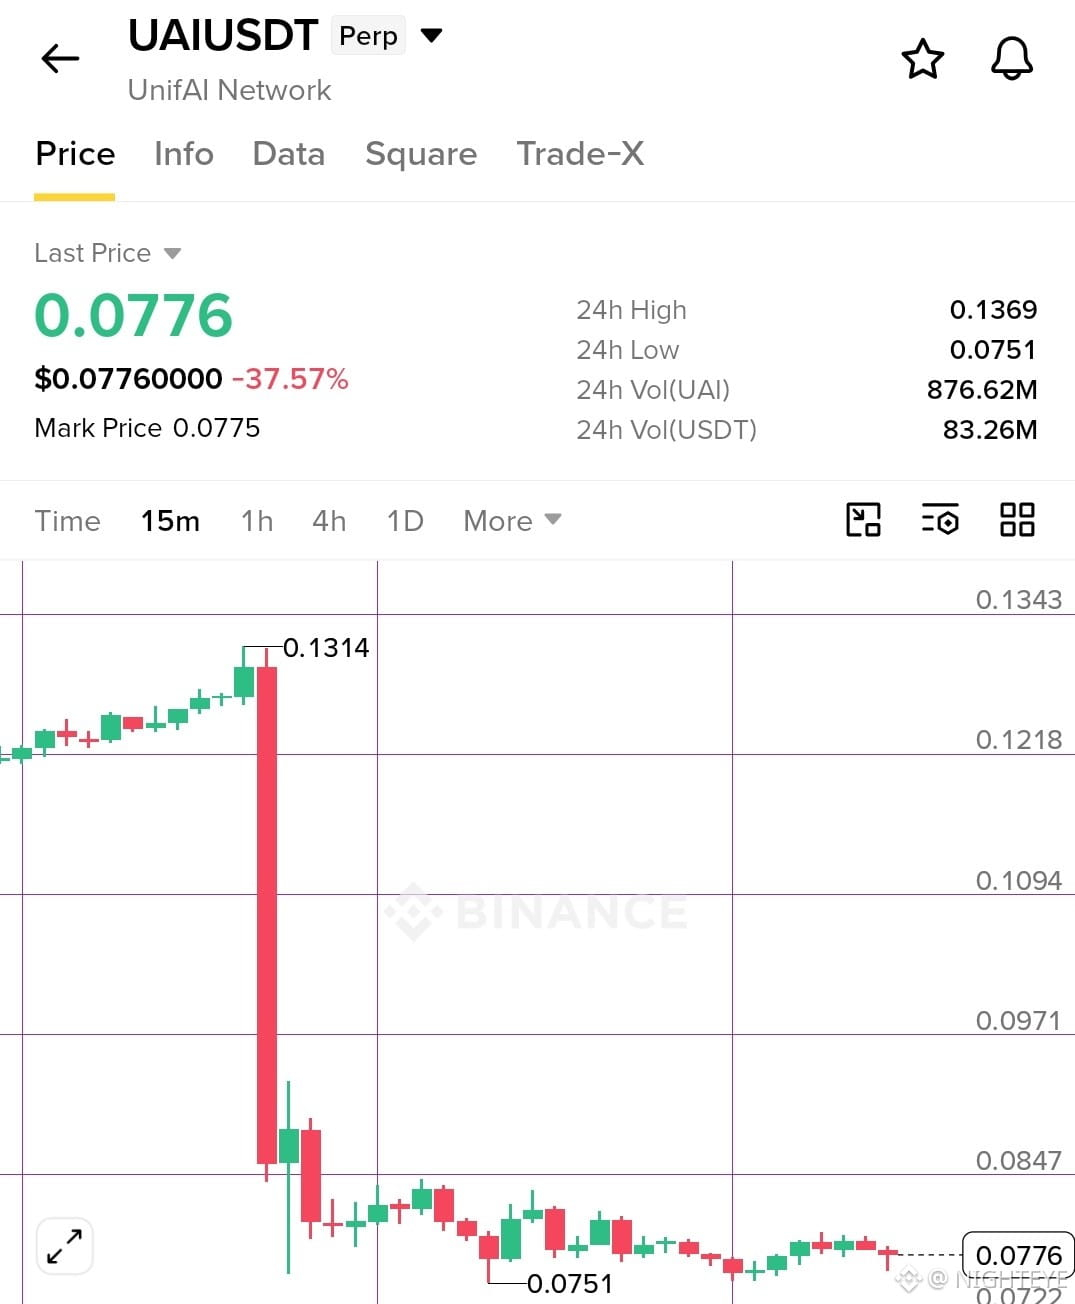
Another common movement in these scam coin here.
$UAI i have shared short setup on this token multipile times on top.
This week it started dropping from the top. while some traders may think it was going to pump again like before but the reality is different once again for this token.
If you look closely on the weekly candle there is nothing or any hope for a good support zone it was bearish since the beginning.
Now before the weekly candle close it has dropped below 0.10$ once again which i mention mutipile times 👀
{future}(UAIUSDT)
Another common movement in these scam coin here.
$UAI i have shared short setup on this token multipile times on top.
This week it started dropping from the top. while some traders may think it was going to pump again like before but the reality is different once again for this token.
If you look closely on the weekly candle there is nothing or any hope for a good support zone it was bearish since the beginning.
Now before the weekly candle close it has dropped below 0.10$ once again which i mention mutipile times 👀
$UAI i have shared short setup on this token multipile times on top.
This week it started dropping from the top. while some traders may think it was going to pump again like before but the reality is different once again for this token.
If you look closely on the weekly candle there is nothing or any hope for a good support zone it was bearish since the beginning.
Now before the weekly candle close it has dropped below 0.10$ once again which i mention mutipile times 👀
1.3k
·
--
弱気相場
翻訳参照
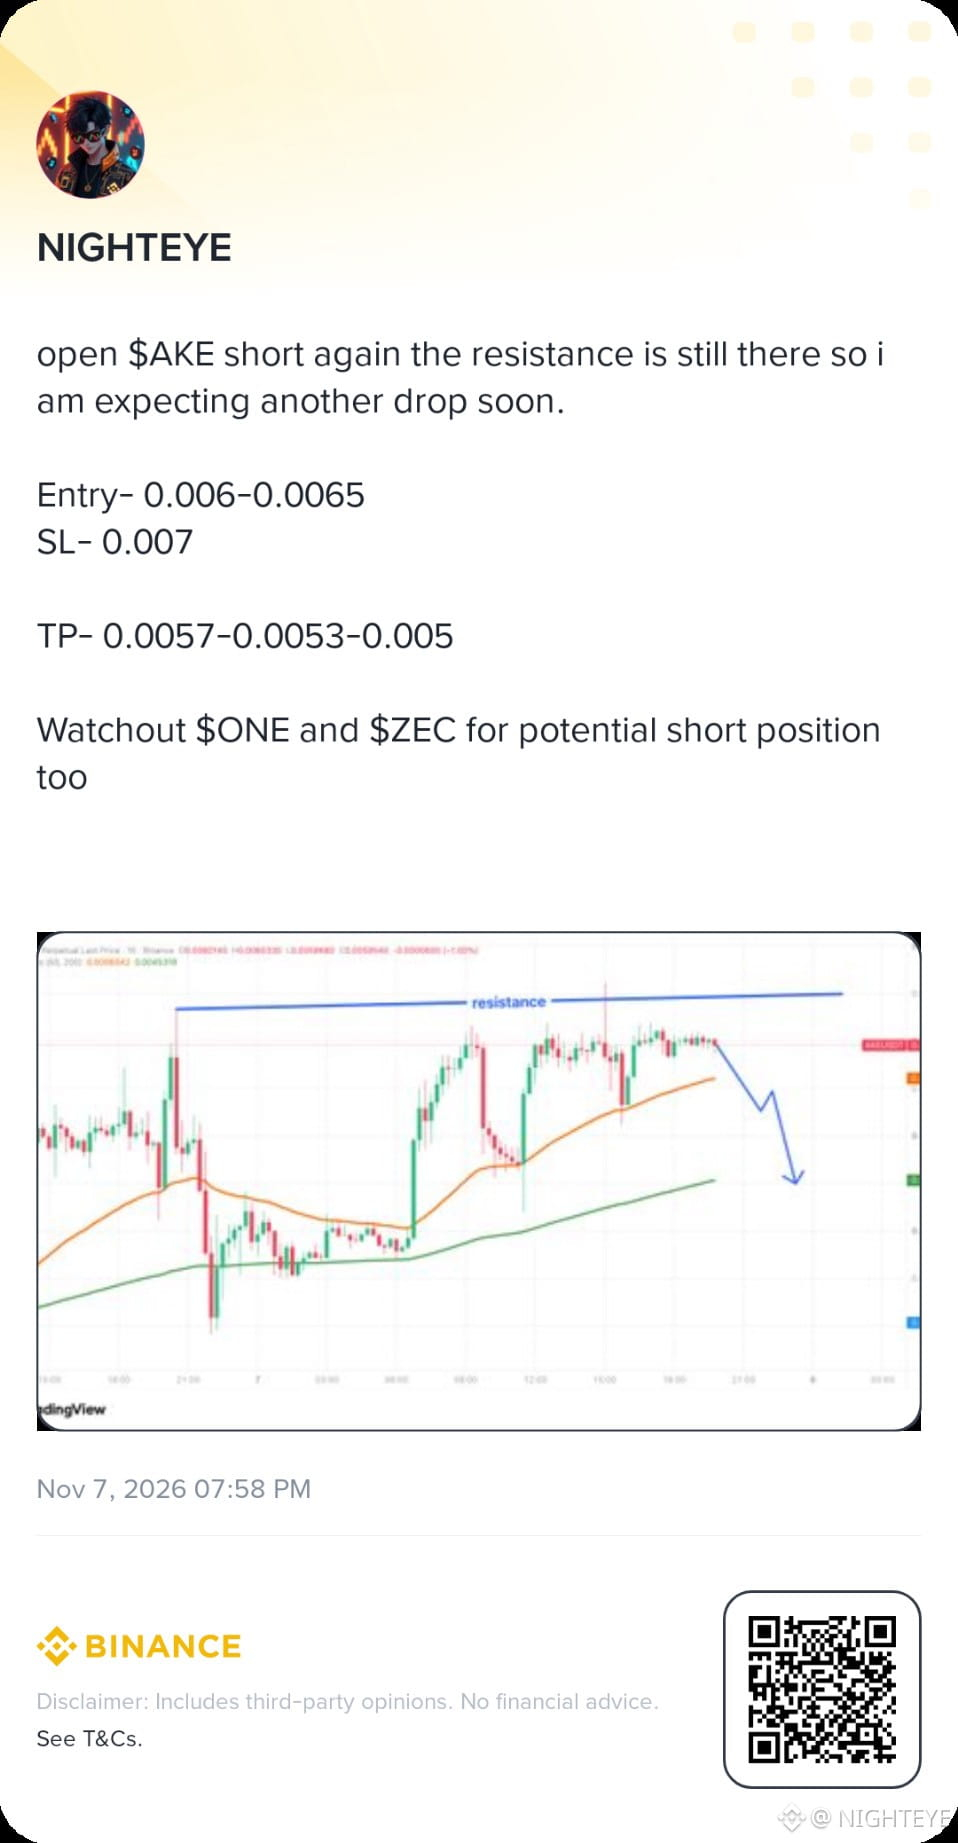
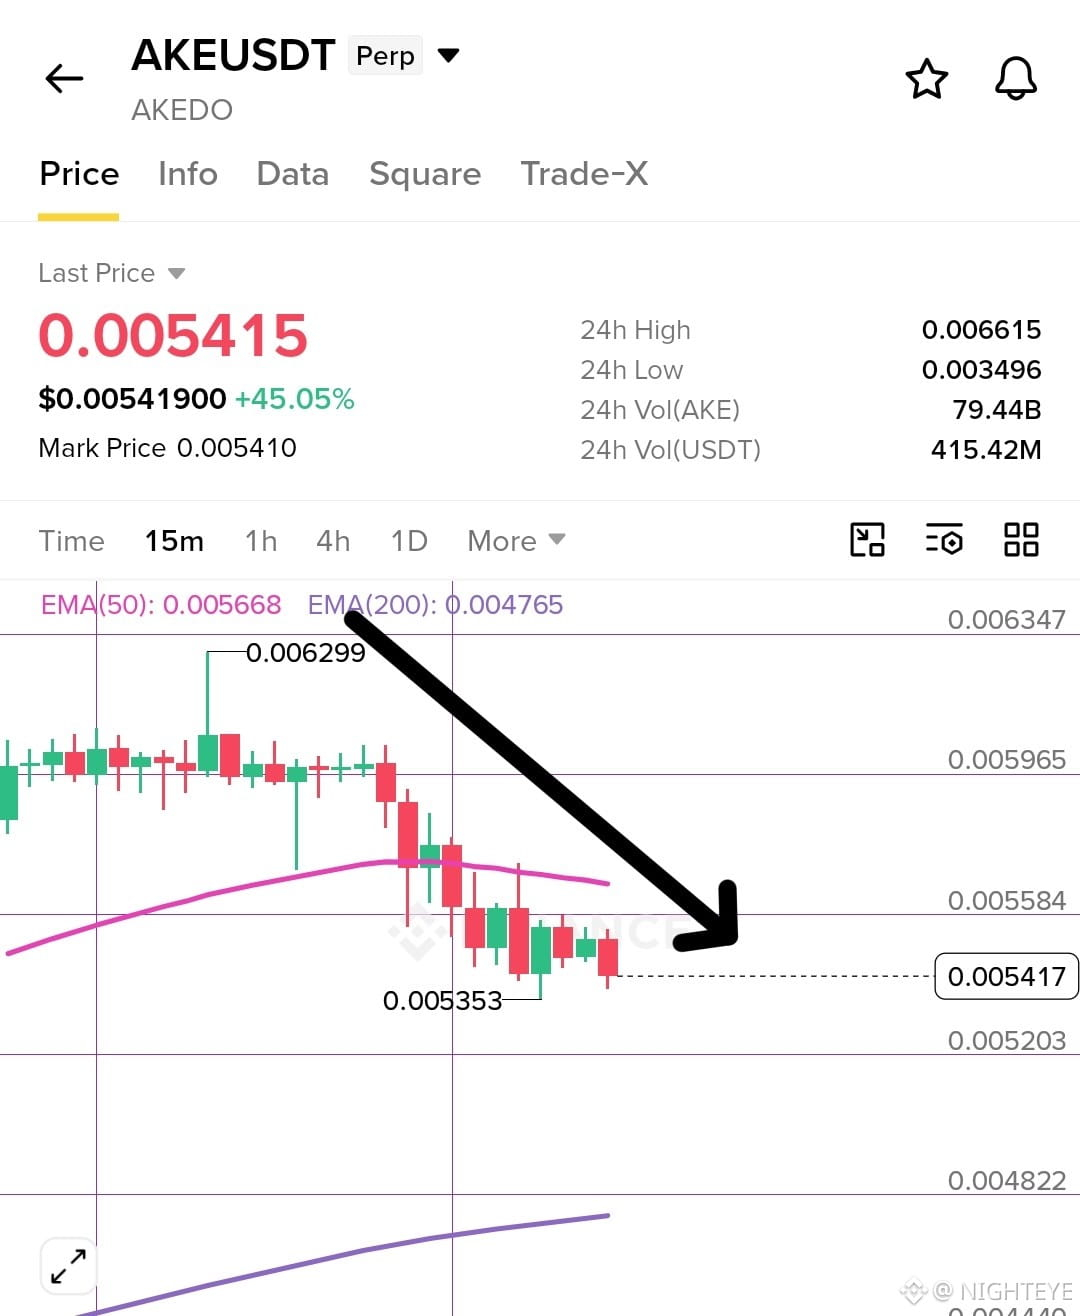
$AKE just hit the target yet again and from the same range that i was telling you to short 😃😃
Despite big attempts for a break out it failed every time and now AKE has dropped again and Hit the 1st and 2nd target 👀
{future}(AKEUSDT)
now watchout for $ONE and $IDOL
{future}(IDOLUSDT)
{future}(ONEUSDT)
$AKE just hit the target yet again and from the same range that i was telling you to short 😃😃
Despite big attempts for a break out it failed every time and now AKE has dropped again and Hit the 1st and 2nd target 👀
now watchout for $ONE and $IDOL
Despite big attempts for a break out it failed every time and now AKE has dropped again and Hit the 1st and 2nd target 👀
now watchout for $ONE and $IDOL
759
·
--
弱気相場
翻訳参照
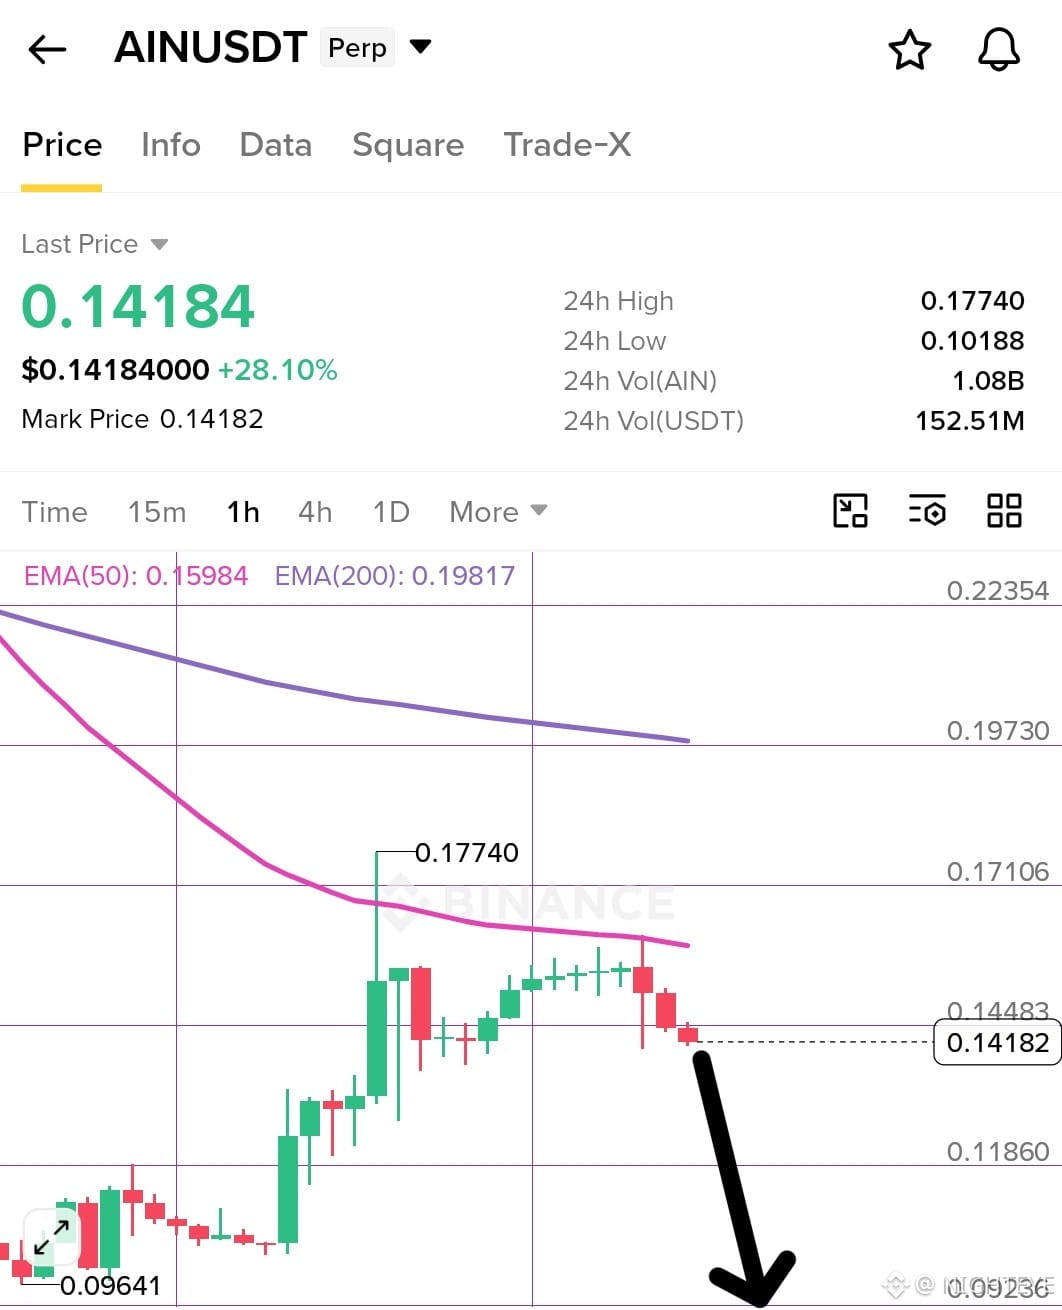
$AIN Got rejected in 1 hour timeframe Ema 50 range now i am waiting for a big break down should come soon 👀
$AIN Got rejected in 1 hour timeframe Ema 50 range now i am waiting for a big break down should come soon 👀
161
ログインして、さらにコンテンツを読む
厳選トピックで世界の暗号資産トレーダーの仲間入り
⚡️ 暗号資産に関する最新かつ有益な情報が見つかります。
💬 世界最大の暗号資産取引所から信頼されています。
👍 認証を受けたクリエイターから、有益なインサイトを得られます。
メール / 電話番号