
MrKhan17877
74 投稿

MrKhan17877
報告
ユーザーをブロック
1 フォロー
26 フォロワー
56 いいね
投稿
すべて
引用
PINNED
·
--
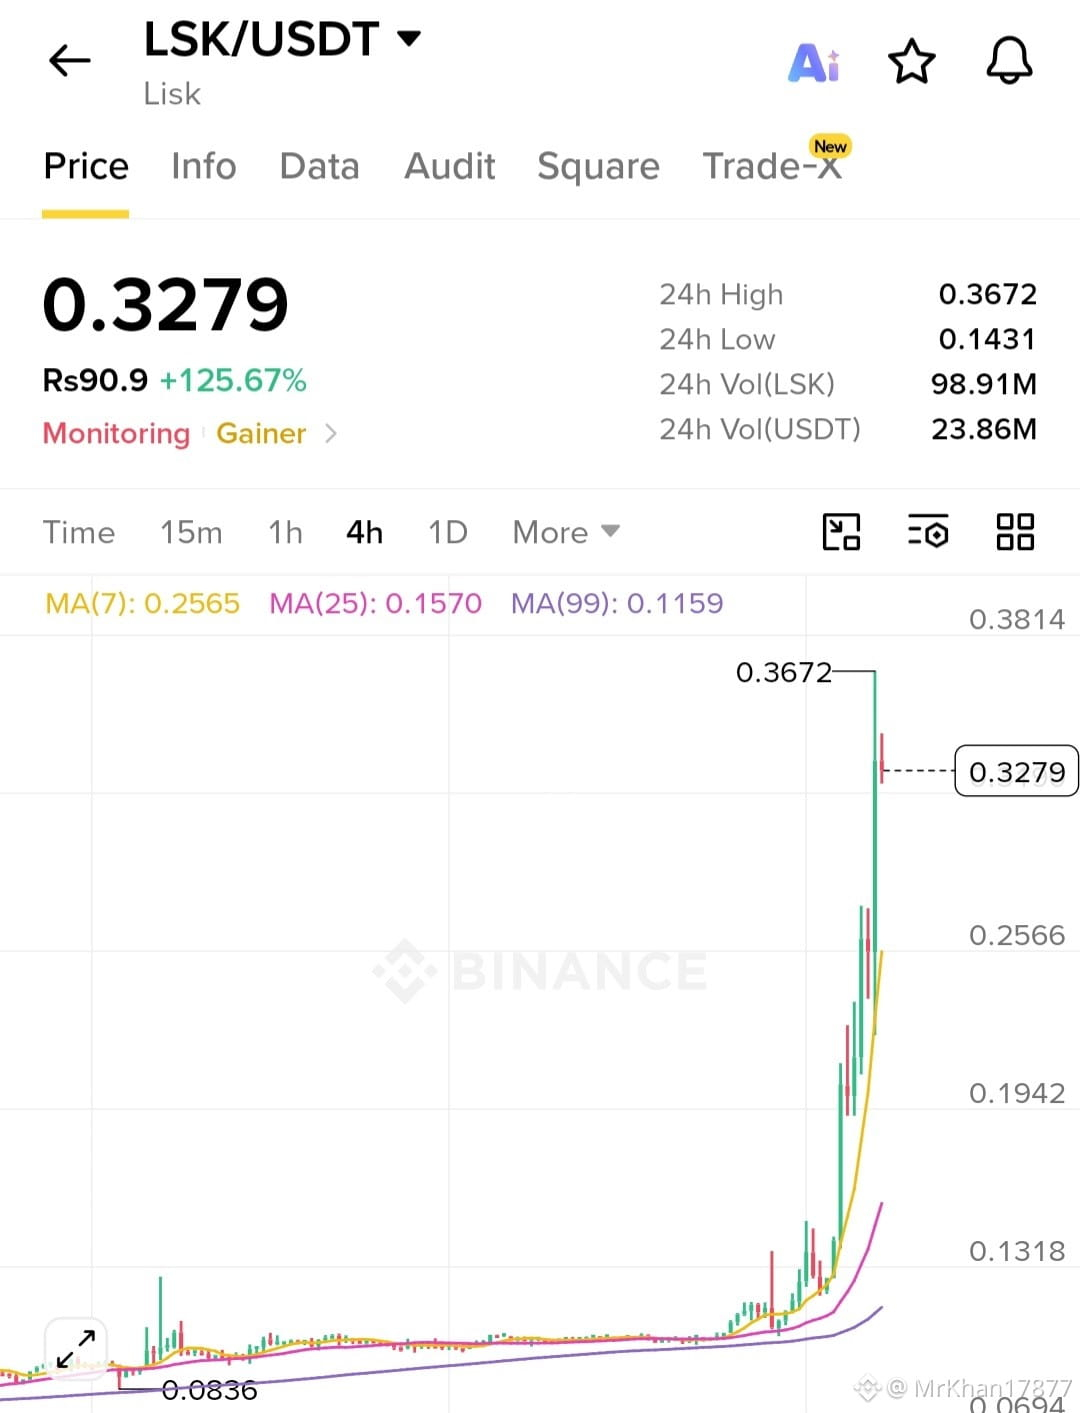
$LSK LSKコインは今の買い場であるスポットで購入しやすい位置にあるので、見逃さないでください。
$LSK LSKコインは今の買い場であるスポットで購入しやすい位置にあるので、見逃さないでください。
1
2
744
·
--
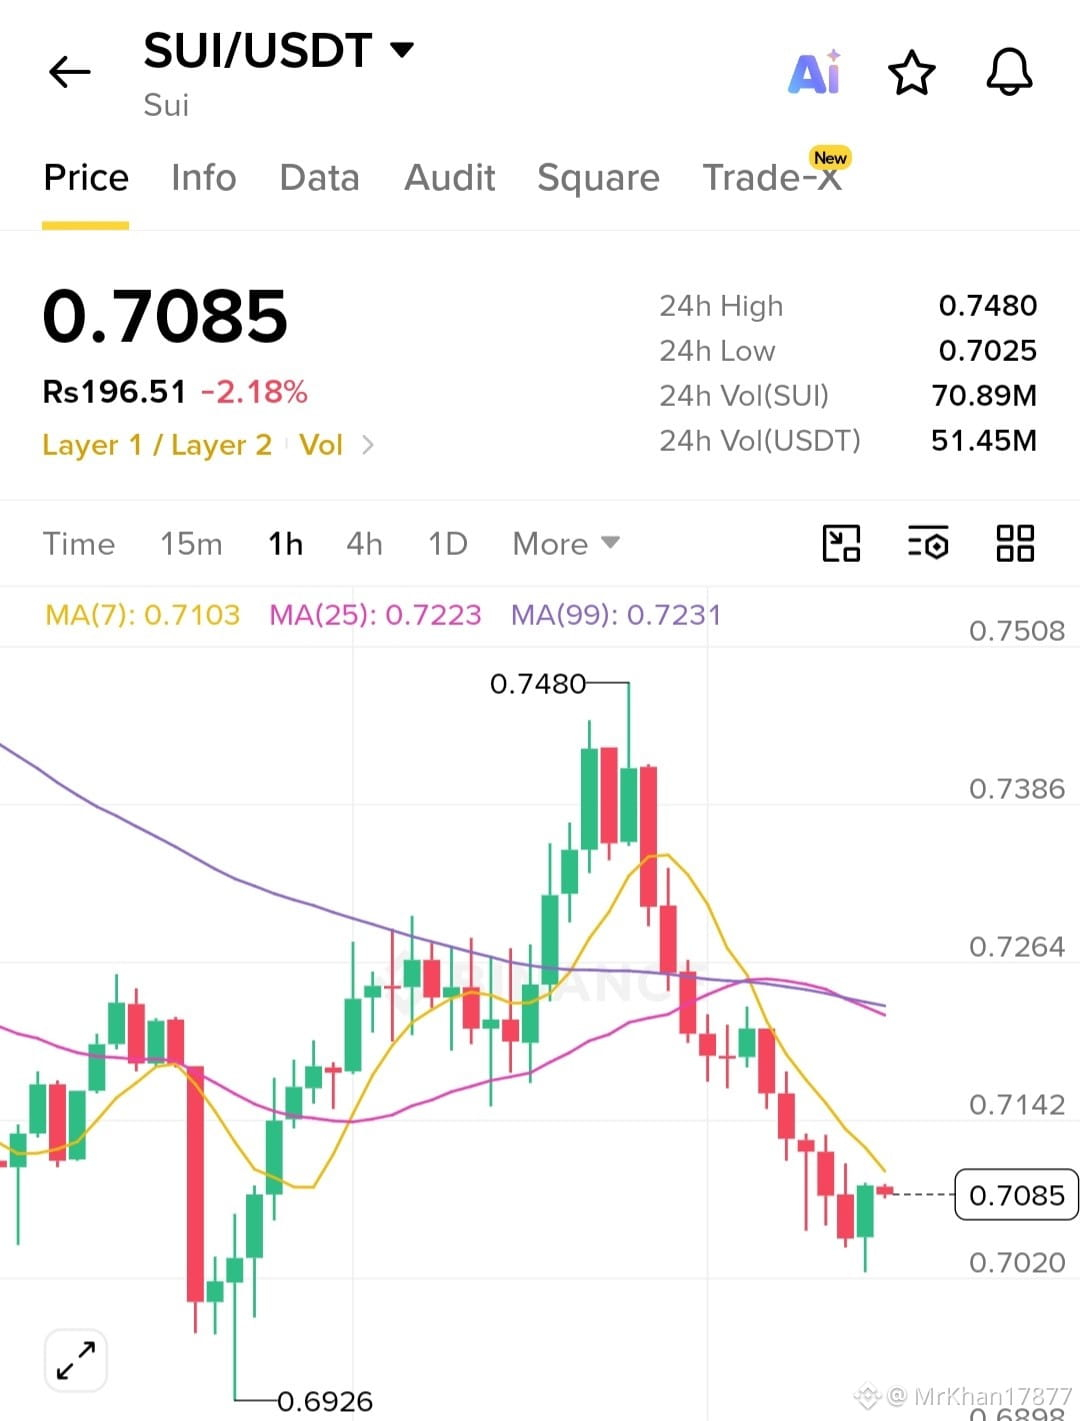
$SUI SUIは現在$0.72〜$0.73付近で取引されています。
主要なテクニカル・サポート・レベル
一次サポート($0.70〜$0.73):SUIは$0.70〜$0.73の範囲にある重要な直近サポートの下限をテストしています。この水準を防衛することは、短期的な構造を維持するうえで重要です。
二次サポート($0.63〜$0.67):$0.70の境界が割れた場合、次の強い需要/サポート・ゾーンはおおよそ$0.67および$0.63〜$0.64です。
主要な基盤($0.60):$0.63を下回るブレイクが起きると、SUIは約$0.60の複数年ベースラインに向けて下落するリスクがあります。
主要なレジスタンス・レベル
$0.74〜$0.75:リクレイム(奪還)に向けた直近の短期レジスタンス。
$0.78〜$0.85:より広範な強気の反転に向けて必要となる主要レジスタンス・ゾーン。$1.00への反転を目指すために重要です。
$SUI SUIは現在$0.72〜$0.73付近で取引されています。
主要なテクニカル・サポート・レベル
一次サポート($0.70〜$0.73):SUIは$0.70〜$0.73の範囲にある重要な直近サポートの下限をテストしています。この水準を防衛することは、短期的な構造を維持するうえで重要です。
二次サポート($0.63〜$0.67):$0.70の境界が割れた場合、次の強い需要/サポート・ゾーンはおおよそ$0.67および$0.63〜$0.64です。
主要な基盤($0.60):$0.63を下回るブレイクが起きると、SUIは約$0.60の複数年ベースラインに向けて下落するリスクがあります。
主要なレジスタンス・レベル
$0.74〜$0.75:リクレイム(奪還)に向けた直近の短期レジスタンス。
$0.78〜$0.85:より広範な強気の反転に向けて必要となる主要レジスタンス・ゾーン。$1.00への反転を目指すために重要です。
主要なテクニカル・サポート・レベル
一次サポート($0.70〜$0.73):SUIは$0.70〜$0.73の範囲にある重要な直近サポートの下限をテストしています。この水準を防衛することは、短期的な構造を維持するうえで重要です。
二次サポート($0.63〜$0.67):$0.70の境界が割れた場合、次の強い需要/サポート・ゾーンはおおよそ$0.67および$0.63〜$0.64です。
主要な基盤($0.60):$0.63を下回るブレイクが起きると、SUIは約$0.60の複数年ベースラインに向けて下落するリスクがあります。
主要なレジスタンス・レベル
$0.74〜$0.75:リクレイム(奪還)に向けた直近の短期レジスタンス。
$0.78〜$0.85:より広範な強気の反転に向けて必要となる主要レジスタンス・ゾーン。$1.00への反転を目指すために重要です。
1
128
·
--
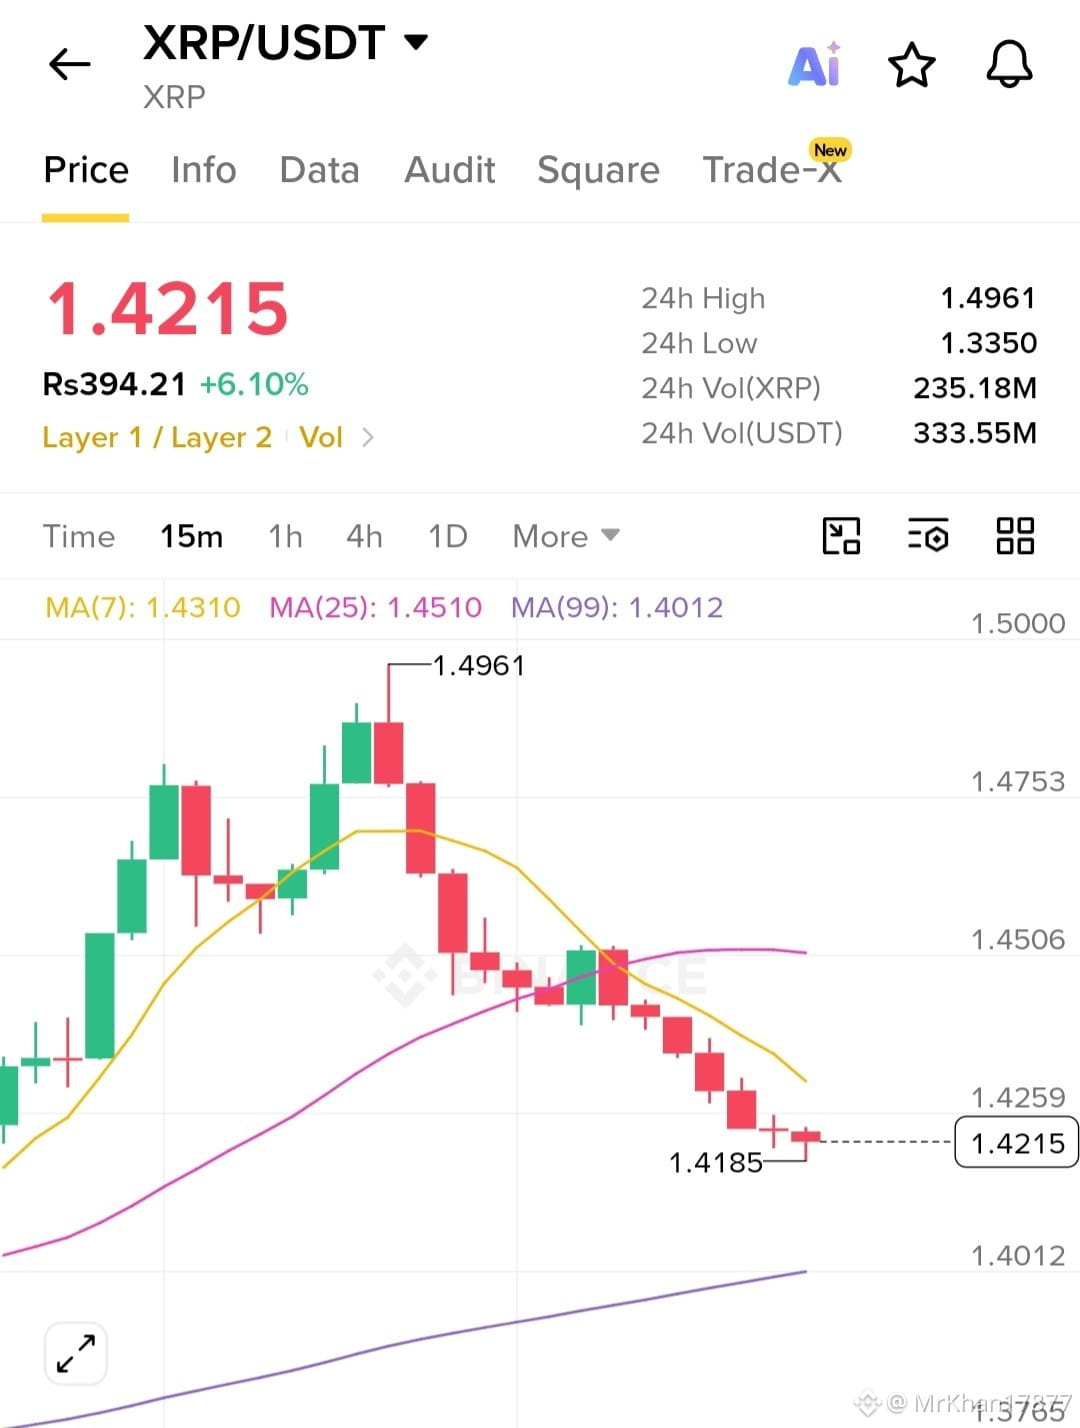
$XRP テクニカルサポート&レジスタンス水準
XRPは現在約$1.35~$1.45で取引されています。主要なテクニカルチャートでは、トレーダーは以下の水準を監視しています:
主要サポート:$1.30~$1.34(20日間の指数移動平均と重要な需要ゾーン付近)。
第二次サポート:$1.21~$1.25(50日間の移動平均と、過去の重要なブレイクアウトゾーンの一致)。
主要サポートの下限:$0.98~$1.10(サイクル安値および長期移動平均の下支え)。
直近のレジスタンス:$1.42~$1.47。
主要レジスタンス:$1.70~$1.74。
$XRP テクニカルサポート&レジスタンス水準
XRPは現在約$1.35~$1.45で取引されています。主要なテクニカルチャートでは、トレーダーは以下の水準を監視しています:
主要サポート:$1.30~$1.34(20日間の指数移動平均と重要な需要ゾーン付近)。
第二次サポート:$1.21~$1.25(50日間の移動平均と、過去の重要なブレイクアウトゾーンの一致)。
主要サポートの下限:$0.98~$1.10(サイクル安値および長期移動平均の下支え)。
直近のレジスタンス:$1.42~$1.47。
主要レジスタンス:$1.70~$1.74。
XRPは現在約$1.35~$1.45で取引されています。主要なテクニカルチャートでは、トレーダーは以下の水準を監視しています:
主要サポート:$1.30~$1.34(20日間の指数移動平均と重要な需要ゾーン付近)。
第二次サポート:$1.21~$1.25(50日間の移動平均と、過去の重要なブレイクアウトゾーンの一致)。
主要サポートの下限:$0.98~$1.10(サイクル安値および長期移動平均の下支え)。
直近のレジスタンス:$1.42~$1.47。
主要レジスタンス:$1.70~$1.74。
1
27
·
--
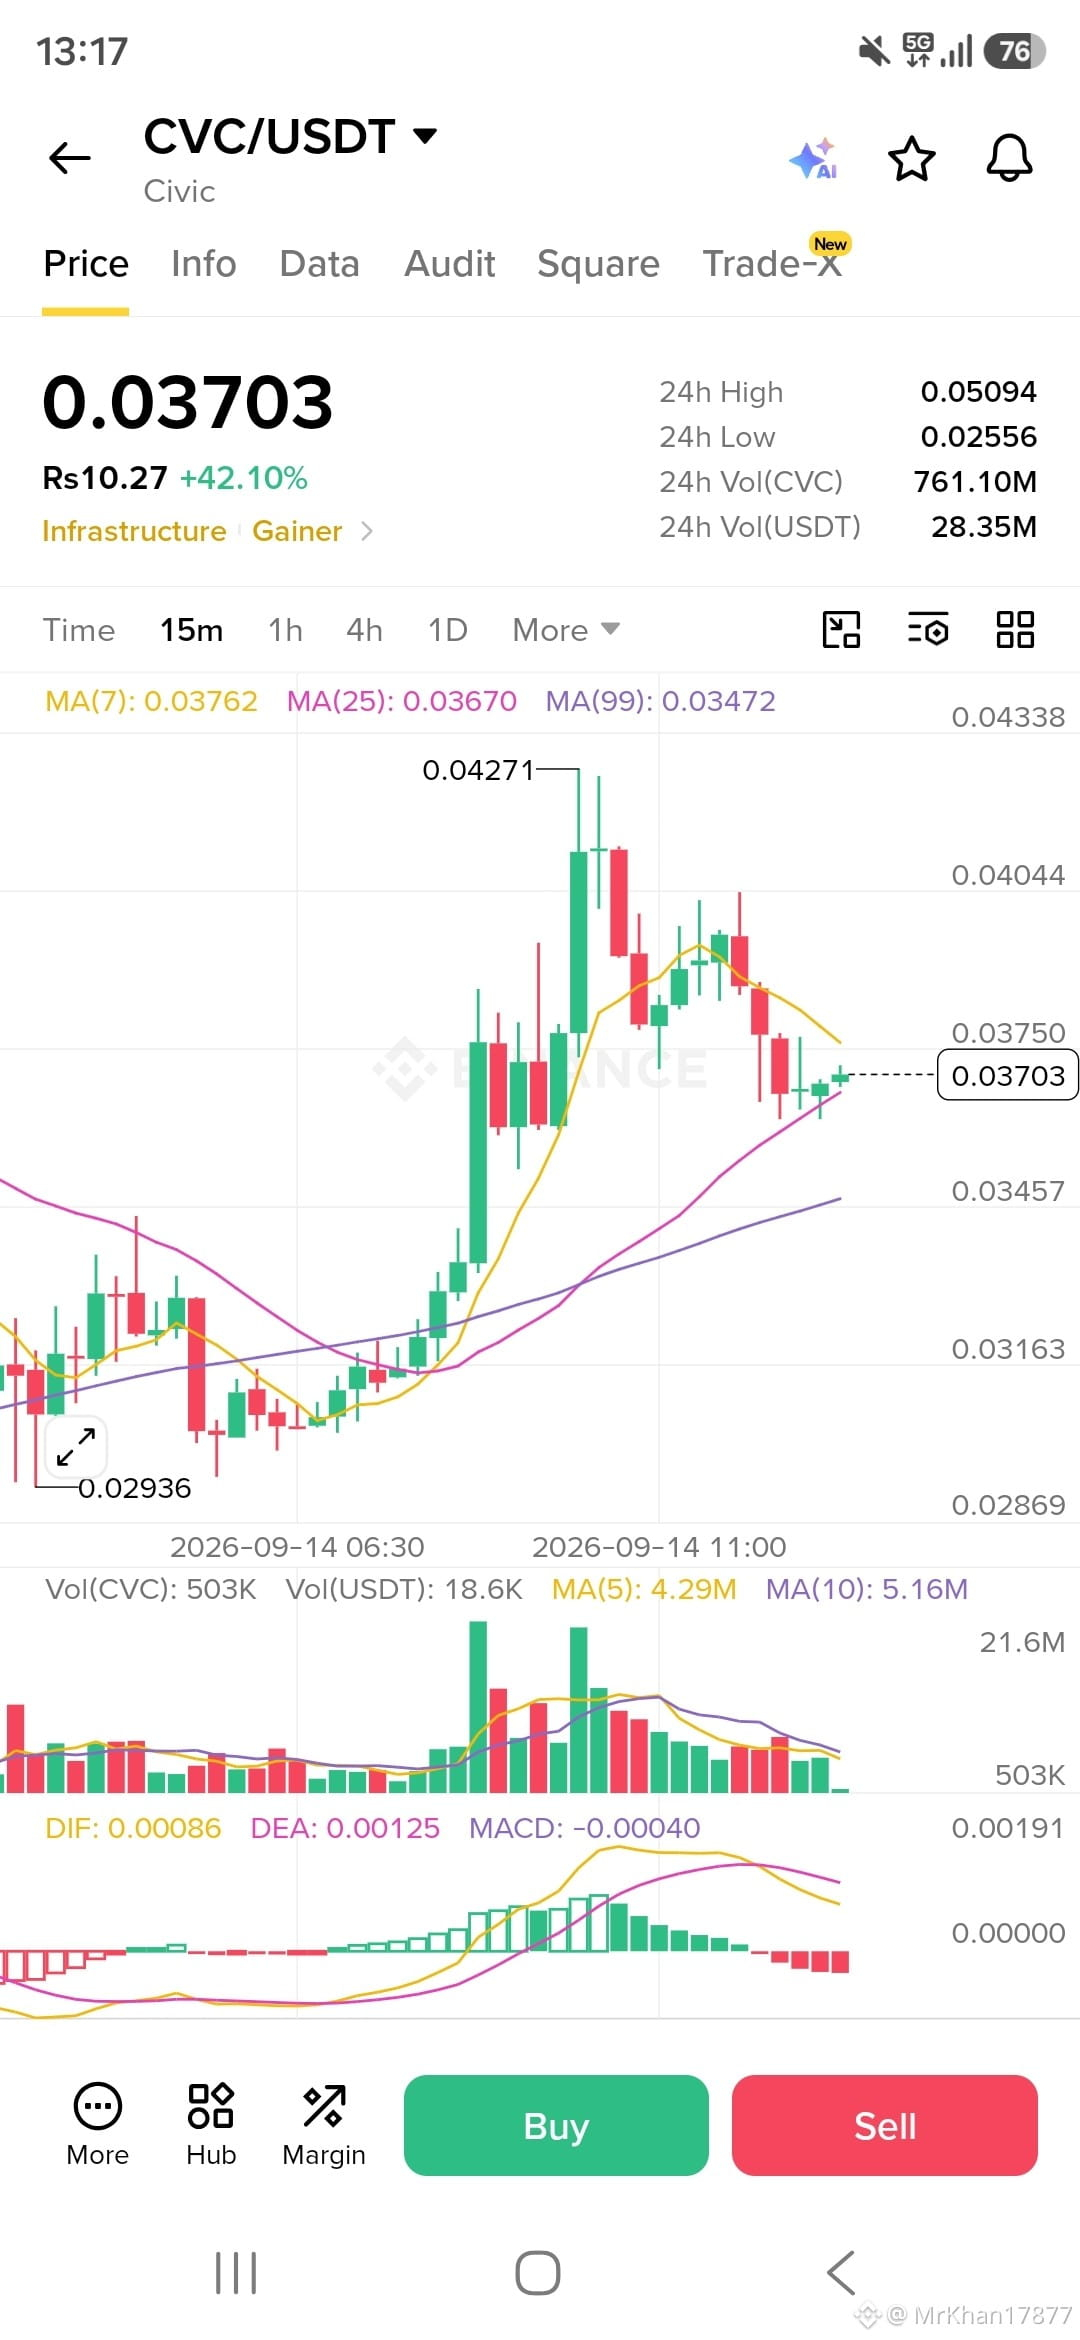
$CVC Civic(CVC)は取引活動の急激な増加を経験し、価格は$0.036〜$0.041の範囲へ上昇しています。
主要なレジスタンス・レベル
$0.0385〜$0.0400:直近の構造的レジスタンス。このゾーン付近では、最近の時間足スパイクの際に強い売り圧力がかかりました。
$0.0450:主要な上方レジスタンス(24時間高値レベル)。日足の終値が$0.045を上回れば、明確なブレイクアウトとなり、$0.055へ向けた目標が開ける可能性があります。
主要なサポート・レベル
$0.0350:直近のローカル・サポート。短期の強気モメンタムを維持するには、この境界線を上回って保つ必要があります。
$0.0215〜$0.0220:主要なベースライン・サポート。このゾーンを下回る下落は、直近の投機的な出来高が失速したことを示し、CVCはそれまでのレンジ(コンソリデーション帯)へ戻るサインです。
$0.0195:重要なマクロ・サポート(フィボナッチ・リトレースメント38.2%)。
要点
CVCは現在、明確なニュースのきっかけではなく出来高の増加によって押し上げられたレジスタンス水準をテストしています。強気の継続には、日足が$0.040を上抜けるのを注視してください。あるいは、利確が加速した場合は$0.022付近までのリトレースメントに注意です。
$CVC Civic(CVC)は取引活動の急激な増加を経験し、価格は$0.036〜$0.041の範囲へ上昇しています。
主要なレジスタンス・レベル
$0.0385〜$0.0400:直近の構造的レジスタンス。このゾーン付近では、最近の時間足スパイクの際に強い売り圧力がかかりました。
$0.0450:主要な上方レジスタンス(24時間高値レベル)。日足の終値が$0.045を上回れば、明確なブレイクアウトとなり、$0.055へ向けた目標が開ける可能性があります。
主要なサポート・レベル
$0.0350:直近のローカル・サポート。短期の強気モメンタムを維持するには、この境界線を上回って保つ必要があります。
$0.0215〜$0.0220:主要なベースライン・サポート。このゾーンを下回る下落は、直近の投機的な出来高が失速したことを示し、CVCはそれまでのレンジ(コンソリデーション帯)へ戻るサインです。
$0.0195:重要なマクロ・サポート(フィボナッチ・リトレースメント38.2%)。
要点
CVCは現在、明確なニュースのきっかけではなく出来高の増加によって押し上げられたレジスタンス水準をテストしています。強気の継続には、日足が$0.040を上抜けるのを注視してください。あるいは、利確が加速した場合は$0.022付近までのリトレースメントに注意です。
主要なレジスタンス・レベル
$0.0385〜$0.0400:直近の構造的レジスタンス。このゾーン付近では、最近の時間足スパイクの際に強い売り圧力がかかりました。
$0.0450:主要な上方レジスタンス(24時間高値レベル)。日足の終値が$0.045を上回れば、明確なブレイクアウトとなり、$0.055へ向けた目標が開ける可能性があります。
主要なサポート・レベル
$0.0350:直近のローカル・サポート。短期の強気モメンタムを維持するには、この境界線を上回って保つ必要があります。
$0.0215〜$0.0220:主要なベースライン・サポート。このゾーンを下回る下落は、直近の投機的な出来高が失速したことを示し、CVCはそれまでのレンジ(コンソリデーション帯)へ戻るサインです。
$0.0195:重要なマクロ・サポート(フィボナッチ・リトレースメント38.2%)。
要点
CVCは現在、明確なニュースのきっかけではなく出来高の増加によって押し上げられたレジスタンス水準をテストしています。強気の継続には、日足が$0.040を上抜けるのを注視してください。あるいは、利確が加速した場合は$0.022付近までのリトレースメントに注意です。
1
121
·
--
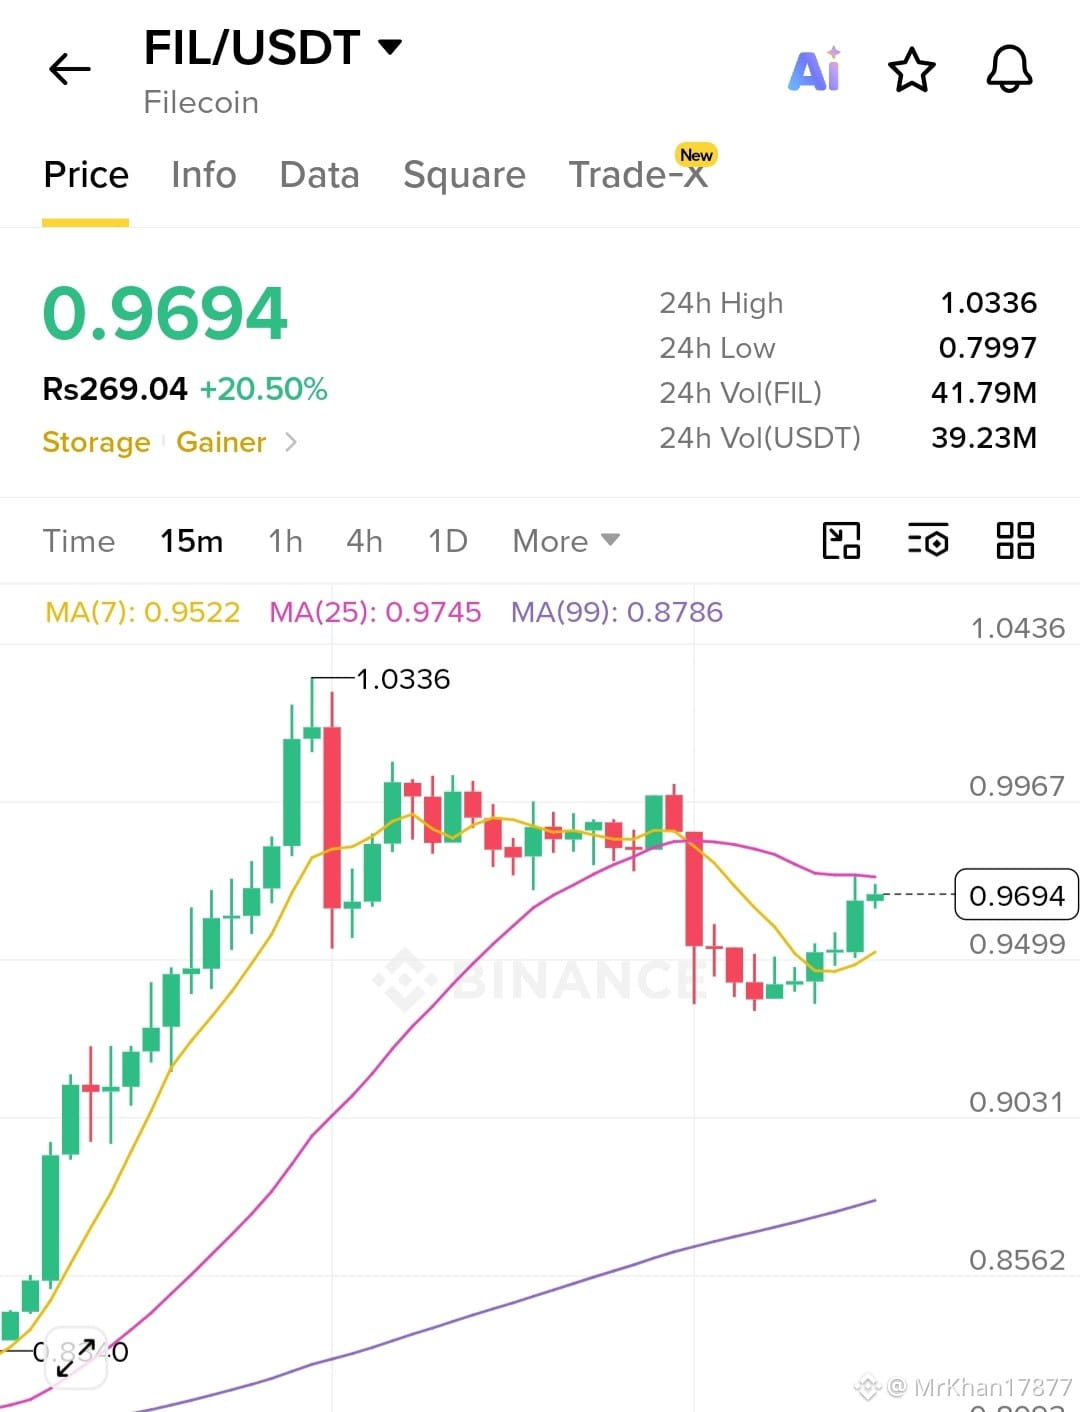
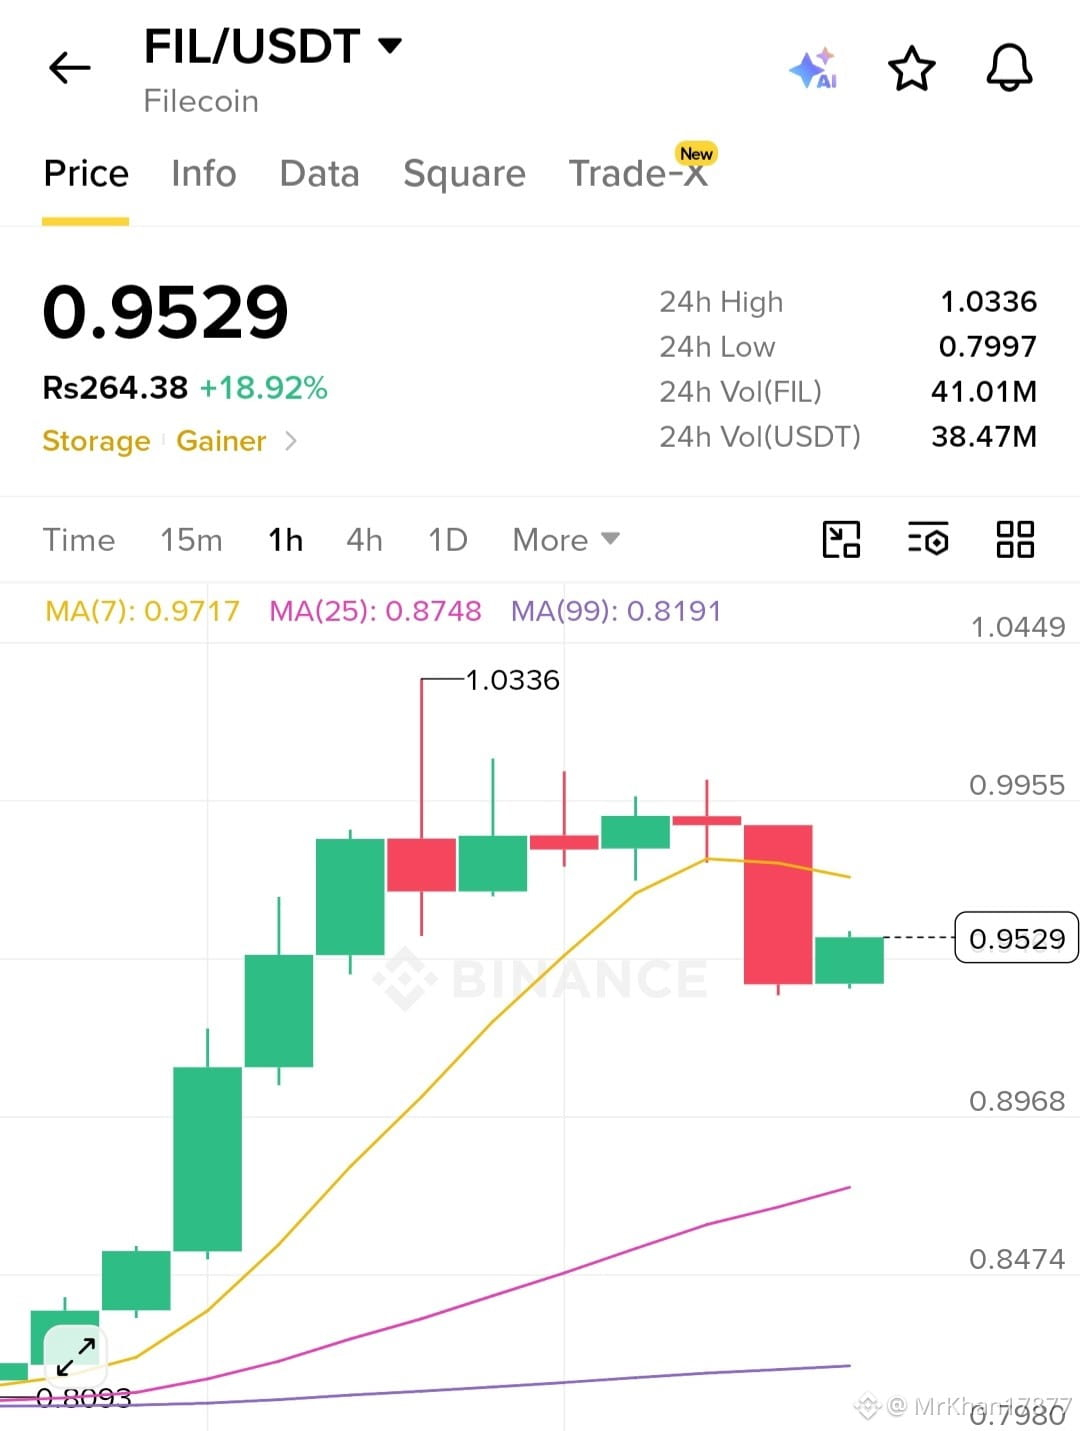
$FIL ウォレットにドルがあるなら、フィルコインに投資してください。彼らは良いコインで、より多くの利益を与えます。もうすぐ1ドルになるとも言っています。
$FIL ウォレットにドルがあるなら、フィルコインに投資してください。彼らは良いコインで、より多くの利益を与えます。もうすぐ1ドルになるとも言っています。
1
677
·
--
翻訳参照
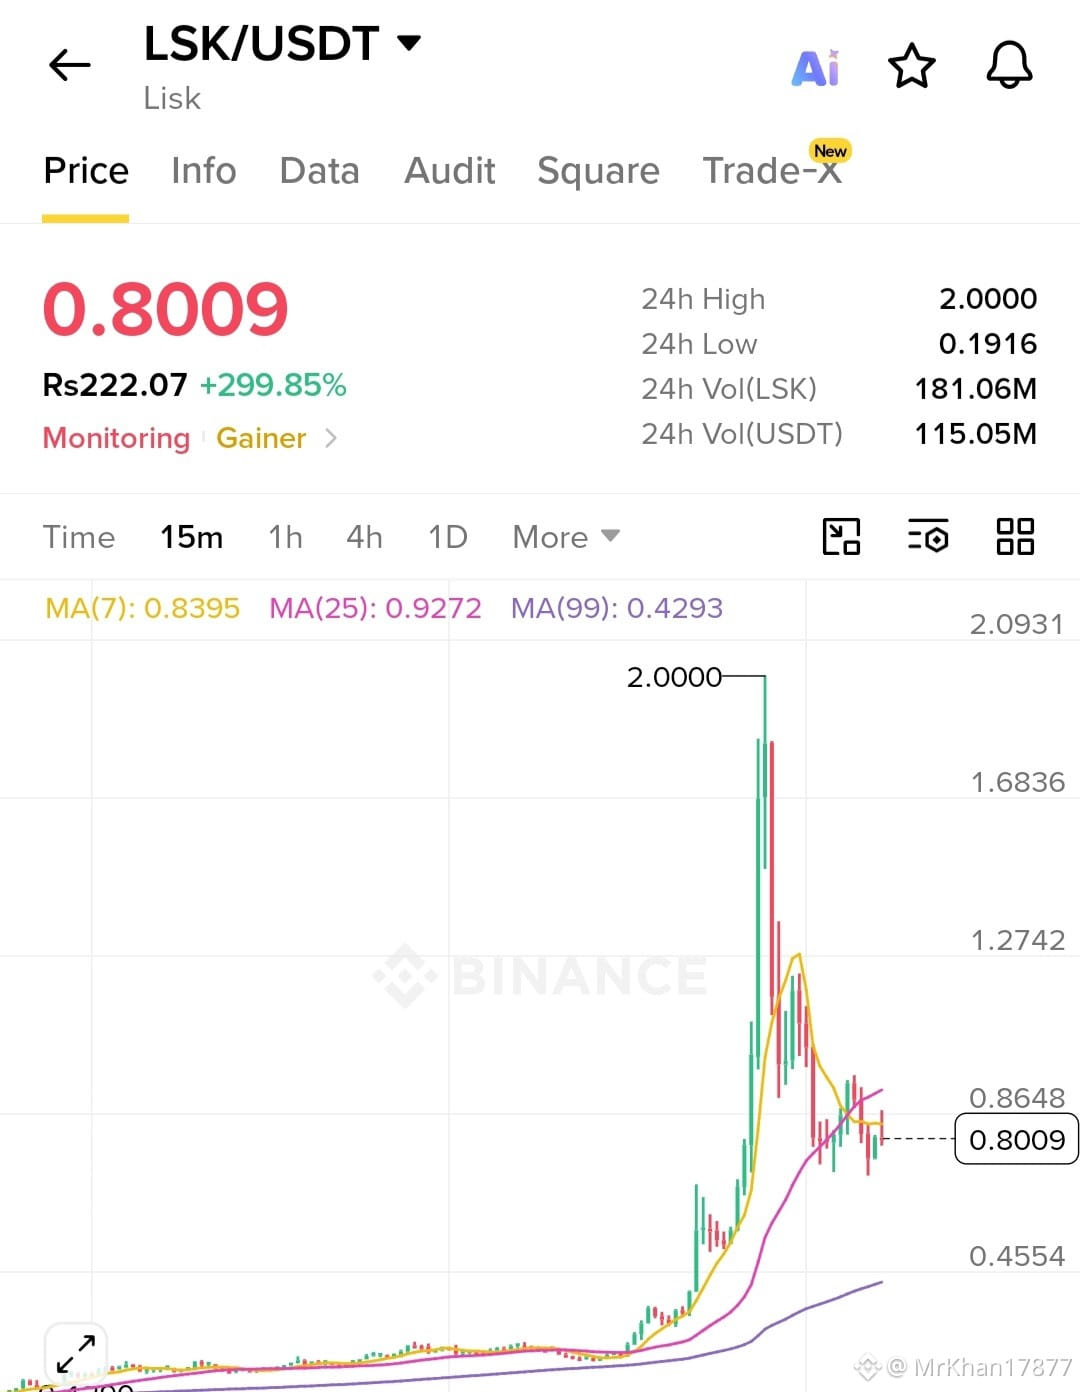
$LSK Last Night i tell about LSK Coin the price was 0.34 right 0.80 and they hit 2+
$LSK Last Night i tell about LSK Coin the price was 0.34 right 0.80 and they hit 2+
1
191
·
--
$DOGE 強気シナリオ:$0.098を日足で終値ベースにて継続的に上回ると、$0.114〜$0.122の再テストへの道が開かれます。
弱気シナリオ:$0.076を下抜けると短期の構造が無効となり、DOGEは主要なマクロのベースである約$0.068〜$0.075に向かって下落します。
$DOGE 強気シナリオ:$0.098を日足で終値ベースにて継続的に上回ると、$0.114〜$0.122の再テストへの道が開かれます。
弱気シナリオ:$0.076を下抜けると短期の構造が無効となり、DOGEは主要なマクロのベースである約$0.068〜$0.075に向かって下落します。
弱気シナリオ:$0.076を下抜けると短期の構造が無効となり、DOGEは主要なマクロのベースである約$0.068〜$0.075に向かって下落します。

1
245
·
--
$ADA Cardano(ADA)主要サポート&レジスタンスゾーン
現在の状況(約$0.208)
ADAは$0.20〜$0.21付近で推移し、短期の移動平均の間に収まっています。
直近のサポート($0.195〜$0.200):50日・100日EMAと主要フィボナッチ・リトレースメントが一致している領域です。このレンジを維持することで、短期のモメンタムは中立に保たれます。
第2のサポート($0.166〜$0.173):活発な統合ゾーンです。$0.195を下抜けると、このフロア(下値)へ向けた再テストが起こり得ます。
主要サポート/ベースライン($0.130〜$0.162):主要な数か月にわたる需要ゾーンであり、循環的な底値の土台となるエリアです。
直近のレジスタンス($0.213〜$0.231):50%および61.8%フィボナッチ・リトレースメントの水準付近にある最初の上値の壁です。
主要レジスタンス($0.236〜$0.245):200日EMAを含む強力なレジスタンスの塊です。このゾーンを取り戻すことが、マクロのトレンド転換を確認するために必要です。
マクロの供給目標($0.359〜$0.465):過去に売り手の集中が大幅に増える、分布(レンジ)の履歴領域です。
$ADA Cardano(ADA)主要サポート&レジスタンスゾーン
現在の状況(約$0.208)
ADAは$0.20〜$0.21付近で推移し、短期の移動平均の間に収まっています。
直近のサポート($0.195〜$0.200):50日・100日EMAと主要フィボナッチ・リトレースメントが一致している領域です。このレンジを維持することで、短期のモメンタムは中立に保たれます。
第2のサポート($0.166〜$0.173):活発な統合ゾーンです。$0.195を下抜けると、このフロア(下値)へ向けた再テストが起こり得ます。
主要サポート/ベースライン($0.130〜$0.162):主要な数か月にわたる需要ゾーンであり、循環的な底値の土台となるエリアです。
直近のレジスタンス($0.213〜$0.231):50%および61.8%フィボナッチ・リトレースメントの水準付近にある最初の上値の壁です。
主要レジスタンス($0.236〜$0.245):200日EMAを含む強力なレジスタンスの塊です。このゾーンを取り戻すことが、マクロのトレンド転換を確認するために必要です。
マクロの供給目標($0.359〜$0.465):過去に売り手の集中が大幅に増える、分布(レンジ)の履歴領域です。
現在の状況(約$0.208)
ADAは$0.20〜$0.21付近で推移し、短期の移動平均の間に収まっています。
直近のサポート($0.195〜$0.200):50日・100日EMAと主要フィボナッチ・リトレースメントが一致している領域です。このレンジを維持することで、短期のモメンタムは中立に保たれます。
第2のサポート($0.166〜$0.173):活発な統合ゾーンです。$0.195を下抜けると、このフロア(下値)へ向けた再テストが起こり得ます。
主要サポート/ベースライン($0.130〜$0.162):主要な数か月にわたる需要ゾーンであり、循環的な底値の土台となるエリアです。
直近のレジスタンス($0.213〜$0.231):50%および61.8%フィボナッチ・リトレースメントの水準付近にある最初の上値の壁です。
主要レジスタンス($0.236〜$0.245):200日EMAを含む強力なレジスタンスの塊です。このゾーンを取り戻すことが、マクロのトレンド転換を確認するために必要です。
マクロの供給目標($0.359〜$0.465):過去に売り手の集中が大幅に増える、分布(レンジ)の履歴領域です。

1
93
·
--
$SUI Sui(SUI)は、$0.73から$0.81の狭いレンジでトレードが行われています。テクニカルアナリストは、いくつかの重要な短期およびマクロのサポート/レジスタンス水準を追跡しています:
レジスタンス
直近のレジスタンス($0.78〜$0.80):ここが最初のハードルです。このレンジを上抜けて明確な短期ブレイクアウトが必要で、強気の勢いを築くことになります。
第2のレジスタンス($0.83〜$0.85):重要な供給ゾーンです。この範囲を突破すると、中間水準に向けた上方向のモメンタムが開かれます。
主要なブレイクアウト水準($1.10):より広い下降トレンドラインと一致する主要な長期の水平レジスタンスです。$1.10を上回る週足終値は、マクロのトレンド反転を確認し、目標は$1.50および$1.86へ広がります。
サポート
直近のサポート($0.70〜$0.72):現在の値動きに対する直近の安全圏として機能します。
第2のサポート($0.66〜$0.68):直近のコンソリデーション構造の下限です。押し目の際、買い手がここに頻繁に入ってきます。
マクロの需要ゾーン($0.50〜$0.56):深い長期の構造的サポート水準です。$0.66のゾーンを失うと、この主要な蓄積のベースを試すためにトークンが下落するリスクがあります。
$SUI Sui(SUI)は、$0.73から$0.81の狭いレンジでトレードが行われています。テクニカルアナリストは、いくつかの重要な短期およびマクロのサポート/レジスタンス水準を追跡しています:
レジスタンス
直近のレジスタンス($0.78〜$0.80):ここが最初のハードルです。このレンジを上抜けて明確な短期ブレイクアウトが必要で、強気の勢いを築くことになります。
第2のレジスタンス($0.83〜$0.85):重要な供給ゾーンです。この範囲を突破すると、中間水準に向けた上方向のモメンタムが開かれます。
主要なブレイクアウト水準($1.10):より広い下降トレンドラインと一致する主要な長期の水平レジスタンスです。$1.10を上回る週足終値は、マクロのトレンド反転を確認し、目標は$1.50および$1.86へ広がります。
サポート
直近のサポート($0.70〜$0.72):現在の値動きに対する直近の安全圏として機能します。
第2のサポート($0.66〜$0.68):直近のコンソリデーション構造の下限です。押し目の際、買い手がここに頻繁に入ってきます。
マクロの需要ゾーン($0.50〜$0.56):深い長期の構造的サポート水準です。$0.66のゾーンを失うと、この主要な蓄積のベースを試すためにトークンが下落するリスクがあります。
レジスタンス
直近のレジスタンス($0.78〜$0.80):ここが最初のハードルです。このレンジを上抜けて明確な短期ブレイクアウトが必要で、強気の勢いを築くことになります。
第2のレジスタンス($0.83〜$0.85):重要な供給ゾーンです。この範囲を突破すると、中間水準に向けた上方向のモメンタムが開かれます。
主要なブレイクアウト水準($1.10):より広い下降トレンドラインと一致する主要な長期の水平レジスタンスです。$1.10を上回る週足終値は、マクロのトレンド反転を確認し、目標は$1.50および$1.86へ広がります。
サポート
直近のサポート($0.70〜$0.72):現在の値動きに対する直近の安全圏として機能します。
第2のサポート($0.66〜$0.68):直近のコンソリデーション構造の下限です。押し目の際、買い手がここに頻繁に入ってきます。
マクロの需要ゾーン($0.50〜$0.56):深い長期の構造的サポート水準です。$0.66のゾーンを失うと、この主要な蓄積のベースを試すためにトークンが下落するリスクがあります。

1
185
·
--
$BNB BNBは現在$710〜$720のレンジ付近で取引されています。複数の時間軸における主要なテクニカル・サポート/レジスタンスは以下の通りです:
レジスタンス・レベル(価格の天井)
直近のレジスタンス($725〜$730):最近のローカルな供給ゾーンおよび短期のリジェクション(反発)水準。
主要レジスタンス($750〜$780):強い心理的・テクニカルなバリア。ここを上抜けると、過去の高値方向への道が開けます。
マクロ・レジスタンス($800〜$835):強気継続に向けた主要な上位時間軸のターゲット・ゾーン。
サポート・レベル(価格の床)
直近のサポート($690〜$702):現在のレンジを支えている最も近いテクニカルな需要ゾーン。
重要サポート($660〜$675):直近のレンジ形成における安値と整合する強い中期サポート領域。
主要ベース($580〜$605):極めて重要なマクロ構造レベル。これを上回った状態を維持することで、長期の強気トレンドが保たれます。
$BNB BNBは現在$710〜$720のレンジ付近で取引されています。複数の時間軸における主要なテクニカル・サポート/レジスタンスは以下の通りです:
レジスタンス・レベル(価格の天井)
直近のレジスタンス($725〜$730):最近のローカルな供給ゾーンおよび短期のリジェクション(反発)水準。
主要レジスタンス($750〜$780):強い心理的・テクニカルなバリア。ここを上抜けると、過去の高値方向への道が開けます。
マクロ・レジスタンス($800〜$835):強気継続に向けた主要な上位時間軸のターゲット・ゾーン。
サポート・レベル(価格の床)
直近のサポート($690〜$702):現在のレンジを支えている最も近いテクニカルな需要ゾーン。
重要サポート($660〜$675):直近のレンジ形成における安値と整合する強い中期サポート領域。
主要ベース($580〜$605):極めて重要なマクロ構造レベル。これを上回った状態を維持することで、長期の強気トレンドが保たれます。
レジスタンス・レベル(価格の天井)
直近のレジスタンス($725〜$730):最近のローカルな供給ゾーンおよび短期のリジェクション(反発)水準。
主要レジスタンス($750〜$780):強い心理的・テクニカルなバリア。ここを上抜けると、過去の高値方向への道が開けます。
マクロ・レジスタンス($800〜$835):強気継続に向けた主要な上位時間軸のターゲット・ゾーン。
サポート・レベル(価格の床)
直近のサポート($690〜$702):現在のレンジを支えている最も近いテクニカルな需要ゾーン。
重要サポート($660〜$675):直近のレンジ形成における安値と整合する強い中期サポート領域。
主要ベース($580〜$605):極めて重要なマクロ構造レベル。これを上回った状態を維持することで、長期の強気トレンドが保たれます。

1
38
·
--
$SOL Solana(SOL)は現在約103.50米ドルで取引されています。
下のインタラクティブなローソク足チャートでは、指標、時間軸、パラメータを調整して価格動向を分析できます。
現在のテクニカル・レベル
直近のレジスタンス:104.50~106.80米ドル
主要サポート:102.50米ドル(4HにおけるEMA55サポート・ゾーン)
大きなサポート:100.40米ドル
$SOL Solana(SOL)は現在約103.50米ドルで取引されています。
下のインタラクティブなローソク足チャートでは、指標、時間軸、パラメータを調整して価格動向を分析できます。
現在のテクニカル・レベル
直近のレジスタンス:104.50~106.80米ドル
主要サポート:102.50米ドル(4HにおけるEMA55サポート・ゾーン)
大きなサポート:100.40米ドル
下のインタラクティブなローソク足チャートでは、指標、時間軸、パラメータを調整して価格動向を分析できます。
現在のテクニカル・レベル
直近のレジスタンス:104.50~106.80米ドル
主要サポート:102.50米ドル(4HにおけるEMA55サポート・ゾーン)
大きなサポート:100.40米ドル

1
67
·
--
翻訳参照
XRP is currently hovering around $1.41, consolidating within a narrow trading channel. The immediate trajectory depends on whether buyers can clear nearby overhead resistance or if sellers push it back down to retest key exponential moving averages (EMAs).
Key Technical Levels
Immediate Resistance ($1.45 - $1.52): XRP must reclaim and hold above $1.45 to build upside momentum. A decisive breakout above $1.52 opens the path toward the $1.70 - $2.00 zone.
Crucial Support ($1.30 - $1.34): The $1.34 zone acts as immediate short-term support. Below that, the 50-day EMA (~$1.30) and 200-day EMA (~$1.285) form a strong structural floor.
Bearish Trigger: A drop below $1.28 on heavy volume would invalidate the current macro bullish setup and risk a retest of $1.00.
Primary Drivers & Catalysts
Institutional Inflows: Spot ETF momentum and institutional investment products continue to record positive net flows into XRP funds.
Indicator Health: The Relative Strength Index (RSI) sits near 54 on the daily chart—out of overbought territory—giving price room to expand in either direction without immediate exhaustion.
Key Takeaway: If XRP breaks above $1.52, expect a continuation move toward $1.70+. If $1.34 fails, look for buyers to defend the $1.28–$1.30 moving average cluster.
XRP is currently hovering around $1.41, consolidating within a narrow trading channel. The immediate trajectory depends on whether buyers can clear nearby overhead resistance or if sellers push it back down to retest key exponential moving averages (EMAs).
Key Technical Levels
Immediate Resistance ($1.45 - $1.52): XRP must reclaim and hold above $1.45 to build upside momentum. A decisive breakout above $1.52 opens the path toward the $1.70 - $2.00 zone.
Crucial Support ($1.30 - $1.34): The $1.34 zone acts as immediate short-term support. Below that, the 50-day EMA (~$1.30) and 200-day EMA (~$1.285) form a strong structural floor.
Bearish Trigger: A drop below $1.28 on heavy volume would invalidate the current macro bullish setup and risk a retest of $1.00.
Primary Drivers & Catalysts
Institutional Inflows: Spot ETF momentum and institutional investment products continue to record positive net flows into XRP funds.
Indicator Health: The Relative Strength Index (RSI) sits near 54 on the daily chart—out of overbought territory—giving price room to expand in either direction without immediate exhaustion.
Key Takeaway: If XRP breaks above $1.52, expect a continuation move toward $1.70+. If $1.34 fails, look for buyers to defend the $1.28–$1.30 moving average cluster.
Key Technical Levels
Immediate Resistance ($1.45 - $1.52): XRP must reclaim and hold above $1.45 to build upside momentum. A decisive breakout above $1.52 opens the path toward the $1.70 - $2.00 zone.
Crucial Support ($1.30 - $1.34): The $1.34 zone acts as immediate short-term support. Below that, the 50-day EMA (~$1.30) and 200-day EMA (~$1.285) form a strong structural floor.
Bearish Trigger: A drop below $1.28 on heavy volume would invalidate the current macro bullish setup and risk a retest of $1.00.
Primary Drivers & Catalysts
Institutional Inflows: Spot ETF momentum and institutional investment products continue to record positive net flows into XRP funds.
Indicator Health: The Relative Strength Index (RSI) sits near 54 on the daily chart—out of overbought territory—giving price room to expand in either direction without immediate exhaustion.
Key Takeaway: If XRP breaks above $1.52, expect a continuation move toward $1.70+. If $1.34 fails, look for buyers to defend the $1.28–$1.30 moving average cluster.
1
58
·
--
翻訳参照
Current Range: Bitcoin is hovering between key support near $77,000 and immediate overhead resistance around $80,000 – $81,800.
Trend Structure: The broader daily chart maintains a structurally bullish stance above major Exponential Moving Averages (EMA 20 at ~$77,130; EMA 50 at ~$72,759).
Momentum: Indicators like MACD show momentum softening slightly following recent tests above $80,000, pointing toward a short-term consolidation phase.
Current Range: Bitcoin is hovering between key support near $77,000 and immediate overhead resistance around $80,000 – $81,800.
Trend Structure: The broader daily chart maintains a structurally bullish stance above major Exponential Moving Averages (EMA 20 at ~$77,130; EMA 50 at ~$72,759).
Momentum: Indicators like MACD show momentum softening slightly following recent tests above $80,000, pointing toward a short-term consolidation phase.
Trend Structure: The broader daily chart maintains a structurally bullish stance above major Exponential Moving Averages (EMA 20 at ~$77,130; EMA 50 at ~$72,759).
Momentum: Indicators like MACD show momentum softening slightly following recent tests above $80,000, pointing toward a short-term consolidation phase.
1
55
·
--
翻訳参照
Predicting Bitcoin's next major price movement ("bull run") depends on historical market cycles, macroeconomic shifts, and key technical factors.
Typical Timeline for the Next Bull Run
Historically, Bitcoin follows a four-year halving cycle.
2026 Phase (Consolidation/Bear Phase): Following the October 2025 peak near $126,000, Bitcoin has been in a macro correction and consolidation range. Standard historical patterns suggest late 2026 may serve as the potential cycle bottom or accumulation phase before a sustained trend reversal.
2027–2028 (Pre-Halving Expansion): Historically, post-bottom recovery and structural accumulation occur through 2027, with momentum accelerating heading into the fifth Bitcoin Halving expected in early 2028.
2028–2029 (Peak Expansion Window): The strongest parabolic legs of major bull runs typically manifest 12 to 18 months after a halving event, positioning the mid-to-late 2028 through 2029 window as the historical target for new peak highs.
Key Catalysts Behind the Next Run
The 2028 Halving: Programmatically slashes block rewards from 3.125 BTC to 1.5625 BTC, constricting supply.
Global Liquidity & Monetary Policy:
Predicting Bitcoin's next major price movement ("bull run") depends on historical market cycles, macroeconomic shifts, and key technical factors.
Typical Timeline for the Next Bull Run
Historically, Bitcoin follows a four-year halving cycle.
2026 Phase (Consolidation/Bear Phase): Following the October 2025 peak near $126,000, Bitcoin has been in a macro correction and consolidation range. Standard historical patterns suggest late 2026 may serve as the potential cycle bottom or accumulation phase before a sustained trend reversal.
2027–2028 (Pre-Halving Expansion): Historically, post-bottom recovery and structural accumulation occur through 2027, with momentum accelerating heading into the fifth Bitcoin Halving expected in early 2028.
2028–2029 (Peak Expansion Window): The strongest parabolic legs of major bull runs typically manifest 12 to 18 months after a halving event, positioning the mid-to-late 2028 through 2029 window as the historical target for new peak highs.
Key Catalysts Behind the Next Run
The 2028 Halving: Programmatically slashes block rewards from 3.125 BTC to 1.5625 BTC, constricting supply.
Global Liquidity & Monetary Policy:
Typical Timeline for the Next Bull Run
Historically, Bitcoin follows a four-year halving cycle.
2026 Phase (Consolidation/Bear Phase): Following the October 2025 peak near $126,000, Bitcoin has been in a macro correction and consolidation range. Standard historical patterns suggest late 2026 may serve as the potential cycle bottom or accumulation phase before a sustained trend reversal.
2027–2028 (Pre-Halving Expansion): Historically, post-bottom recovery and structural accumulation occur through 2027, with momentum accelerating heading into the fifth Bitcoin Halving expected in early 2028.
2028–2029 (Peak Expansion Window): The strongest parabolic legs of major bull runs typically manifest 12 to 18 months after a halving event, positioning the mid-to-late 2028 through 2029 window as the historical target for new peak highs.
Key Catalysts Behind the Next Run
The 2028 Halving: Programmatically slashes block rewards from 3.125 BTC to 1.5625 BTC, constricting supply.
Global Liquidity & Monetary Policy:
1
79
·
--
$SOL #USGovShutdownEnd? #BinanceHODLerALLO #WriteToEarnUpgrade こんにちは皆さん、今は暗号通貨に投資する良い時期です。これらの5つのコインに投資すれば、未来の億万長者になれる5つのコインをお教えします。1. ソラナ、2. BNB、3. XRP、4. DOGE、5. Dot。これらのコインに投資するのを遅れないでください。
$SOL #USGovShutdownEnd? #BinanceHODLerALLO #WriteToEarnUpgrade こんにちは皆さん、今は暗号通貨に投資する良い時期です。これらの5つのコインに投資すれば、未来の億万長者になれる5つのコインをお教えします。1. ソラナ、2. BNB、3. XRP、4. DOGE、5. Dot。これらのコインに投資するのを遅れないでください。

3
142
·
--
$BTC #USGovShutdownEnd? #StrategyBTCPurchase #CryptoScamSurge ビットコインは現在106,127ドルで取引されています。
最近100,000ドルを下回りましたが、反発し、そのゾーンでの強い買い意欲を示しています。
📊 テクニカル & マーケット分析
サポートとレジスタンス
主要な短期サポートゾーンは100,000ドル付近にあります。BTCは反発する前に約98,944ドル付近を再テストしました。
次の主要なレジスタンスは、約110,000ドルの200日EMA付近です。
マーケット構造 & センチメント
テクニカル構造は、低い高値と深い修正のリスクを伴う弱気のシフトの兆候を示しています。
しかし、センチメントもレジリエンスを示しています:99Kゾーンからの反発はブルが存在することを示唆しています。
機関投資家やマクロドライバーが広範な動きに影響を与えています:規制のシグナル、米国の政治的安定性、機関の財務行動がすべて重要です。
🧭 何が動きを促進しているのか
最近の約99,000ドルの再テストは、心理的および技術的なリセットとして機能しました。反発はサポートと新たな関心を示しています。
広範な暗号通貨とリスク資産のセンチメントは、最近米国の政治的リスクがやや緩和されたため改善し、BTCの穏やかな上昇を助けました。
一方で、一部の大きなエンティティ(暗号通貨の財務企業)は、BTCではなくより投機的なトークンにシフトしており、ビットコインの増加需要を減少させる可能性があります。
🎯 短期 & 中期の見通し
短期(数週間):ビットコインが100Kドルのサポートを上回って保持する限り、110Kドルから115Kドルへの回復が可能です。サポートを失うと、94Kドルまたはそれ以下に滑り込む可能性があります。
中期(年末まで):いくつかの強気の予測は、BTCがモメンタムが戻れば120,000ドルから150,000ドルに達する可能性があると示唆しています。
しかし、注意点があります:多くの予測モデルは、このラリーが過去のサイクルよりも控えめである可能性がある(上昇が少なく、より多くの統合)と言っています。
⚠️ 注視すべき主要リスク
約100Kドルのサポートを下回ると、90Kドルまたはそれ以下への深い修正を引き起こす可能性があります。
従来の市場(株式)が急激に修正されると、BTCはリスク資産との相関が増加するため、追随する可能性があります。
$BTC #USGovShutdownEnd? #StrategyBTCPurchase #CryptoScamSurge ビットコインは現在106,127ドルで取引されています。
最近100,000ドルを下回りましたが、反発し、そのゾーンでの強い買い意欲を示しています。
📊 テクニカル & マーケット分析
サポートとレジスタンス
主要な短期サポートゾーンは100,000ドル付近にあります。BTCは反発する前に約98,944ドル付近を再テストしました。
次の主要なレジスタンスは、約110,000ドルの200日EMA付近です。
マーケット構造 & センチメント
テクニカル構造は、低い高値と深い修正のリスクを伴う弱気のシフトの兆候を示しています。
しかし、センチメントもレジリエンスを示しています:99Kゾーンからの反発はブルが存在することを示唆しています。
機関投資家やマクロドライバーが広範な動きに影響を与えています:規制のシグナル、米国の政治的安定性、機関の財務行動がすべて重要です。
🧭 何が動きを促進しているのか
最近の約99,000ドルの再テストは、心理的および技術的なリセットとして機能しました。反発はサポートと新たな関心を示しています。
広範な暗号通貨とリスク資産のセンチメントは、最近米国の政治的リスクがやや緩和されたため改善し、BTCの穏やかな上昇を助けました。
一方で、一部の大きなエンティティ(暗号通貨の財務企業)は、BTCではなくより投機的なトークンにシフトしており、ビットコインの増加需要を減少させる可能性があります。
🎯 短期 & 中期の見通し
短期(数週間):ビットコインが100Kドルのサポートを上回って保持する限り、110Kドルから115Kドルへの回復が可能です。サポートを失うと、94Kドルまたはそれ以下に滑り込む可能性があります。
中期(年末まで):いくつかの強気の予測は、BTCがモメンタムが戻れば120,000ドルから150,000ドルに達する可能性があると示唆しています。
しかし、注意点があります:多くの予測モデルは、このラリーが過去のサイクルよりも控えめである可能性がある(上昇が少なく、より多くの統合)と言っています。
⚠️ 注視すべき主要リスク
約100Kドルのサポートを下回ると、90Kドルまたはそれ以下への深い修正を引き起こす可能性があります。
従来の市場(株式)が急激に修正されると、BTCはリスク資産との相関が増加するため、追随する可能性があります。
最近100,000ドルを下回りましたが、反発し、そのゾーンでの強い買い意欲を示しています。
📊 テクニカル & マーケット分析
サポートとレジスタンス
主要な短期サポートゾーンは100,000ドル付近にあります。BTCは反発する前に約98,944ドル付近を再テストしました。
次の主要なレジスタンスは、約110,000ドルの200日EMA付近です。
マーケット構造 & センチメント
テクニカル構造は、低い高値と深い修正のリスクを伴う弱気のシフトの兆候を示しています。
しかし、センチメントもレジリエンスを示しています:99Kゾーンからの反発はブルが存在することを示唆しています。
機関投資家やマクロドライバーが広範な動きに影響を与えています:規制のシグナル、米国の政治的安定性、機関の財務行動がすべて重要です。
🧭 何が動きを促進しているのか
最近の約99,000ドルの再テストは、心理的および技術的なリセットとして機能しました。反発はサポートと新たな関心を示しています。
広範な暗号通貨とリスク資産のセンチメントは、最近米国の政治的リスクがやや緩和されたため改善し、BTCの穏やかな上昇を助けました。
一方で、一部の大きなエンティティ(暗号通貨の財務企業)は、BTCではなくより投機的なトークンにシフトしており、ビットコインの増加需要を減少させる可能性があります。
🎯 短期 & 中期の見通し
短期(数週間):ビットコインが100Kドルのサポートを上回って保持する限り、110Kドルから115Kドルへの回復が可能です。サポートを失うと、94Kドルまたはそれ以下に滑り込む可能性があります。
中期(年末まで):いくつかの強気の予測は、BTCがモメンタムが戻れば120,000ドルから150,000ドルに達する可能性があると示唆しています。
しかし、注意点があります:多くの予測モデルは、このラリーが過去のサイクルよりも控えめである可能性がある(上昇が少なく、より多くの統合)と言っています。
⚠️ 注視すべき主要リスク
約100Kドルのサポートを下回ると、90Kドルまたはそれ以下への深い修正を引き起こす可能性があります。
従来の市場(株式)が急激に修正されると、BTCはリスク資産との相関が増加するため、追随する可能性があります。

1
3
·
--
$BTC #USGovShutdownEnd? #StrategyBTCPurchase #CryptoMarket4T ビットコイン
現在、$106,127 USD付近で取引されています。
最近、$100,000を下回りましたが、回復し、そのゾーンでの強い買い興味を示しています。
📊 テクニカル & マーケット分析
サポートとレジスタンス
主要な短期サポートゾーンは$100,000付近にあります。 BTCは約$98,944付近で再テストし、その後反発しました。
次の重要なレジスタンスは、$110,000付近の200日EMAです。
マーケット構造 & センチメント
テクニカル構造は、下落する高値と深い修正のリスクを伴う弱気のシフトの兆候を示しています。
しかし、センチメントも回復力を示しています:$99Kゾーンからの反発は、ブルが存在し続けることを示唆しています。
機関投資家やマクロドライバーが広範な動きに影響を与えています:規制のシグナル、米国の政治的安定性、そして機関の財務行動はすべて重要です。
🧭 動きの要因
最近の約$99,000の再テストは、心理的およびテクニカルなリセットとして機能しました。 反発はサポートと新たな興味を示しています。
広範な暗号およびリスク資産のセンチメントは、最近米国の政治リスクがやや緩和されたため改善し、BTCの穏やかな上昇を助けました。
その一方で、一部の大規模なエンティティ(暗号財務会社)がBTCではなく、より投機的なトークンにシフトしているため、ビットコインの増分需要が減少する可能性があります。
🎯 短期 & 中期の見通し
短期(数週間):ビットコインが$100Kサポートを上回っている限り、$110K-$115Kに向けた回復が可能です。 サポートの喪失は、$94Kまたはそれ以下へのスライドを開く可能性があります。
中期(年末まで):いくつかの強気の予測は、モメンタムが戻ればBTCが$120,000-$150,000に達する可能性があることを示唆しています。
⚠️ 注意すべき主要リスク
$100Kサポートを下回ると、$90Kまたはそれ以下への深い修正が引き起こされる可能性があります。
伝統的な市場(株式)が急激に修正される場合、BTCはリスク資産との相関が高まる中で追随する可能性があります。
規制のサプライズや、機関がビットコインから他の資産にシフトすることは、上昇の潜在能力を減少させる可能性があります。
$BTC #USGovShutdownEnd? #StrategyBTCPurchase #CryptoMarket4T ビットコイン
現在、$106,127 USD付近で取引されています。
最近、$100,000を下回りましたが、回復し、そのゾーンでの強い買い興味を示しています。
📊 テクニカル & マーケット分析
サポートとレジスタンス
主要な短期サポートゾーンは$100,000付近にあります。 BTCは約$98,944付近で再テストし、その後反発しました。
次の重要なレジスタンスは、$110,000付近の200日EMAです。
マーケット構造 & センチメント
テクニカル構造は、下落する高値と深い修正のリスクを伴う弱気のシフトの兆候を示しています。
しかし、センチメントも回復力を示しています:$99Kゾーンからの反発は、ブルが存在し続けることを示唆しています。
機関投資家やマクロドライバーが広範な動きに影響を与えています:規制のシグナル、米国の政治的安定性、そして機関の財務行動はすべて重要です。
🧭 動きの要因
最近の約$99,000の再テストは、心理的およびテクニカルなリセットとして機能しました。 反発はサポートと新たな興味を示しています。
広範な暗号およびリスク資産のセンチメントは、最近米国の政治リスクがやや緩和されたため改善し、BTCの穏やかな上昇を助けました。
その一方で、一部の大規模なエンティティ(暗号財務会社)がBTCではなく、より投機的なトークンにシフトしているため、ビットコインの増分需要が減少する可能性があります。
🎯 短期 & 中期の見通し
短期(数週間):ビットコインが$100Kサポートを上回っている限り、$110K-$115Kに向けた回復が可能です。 サポートの喪失は、$94Kまたはそれ以下へのスライドを開く可能性があります。
中期(年末まで):いくつかの強気の予測は、モメンタムが戻ればBTCが$120,000-$150,000に達する可能性があることを示唆しています。
⚠️ 注意すべき主要リスク
$100Kサポートを下回ると、$90Kまたはそれ以下への深い修正が引き起こされる可能性があります。
伝統的な市場(株式)が急激に修正される場合、BTCはリスク資産との相関が高まる中で追随する可能性があります。
規制のサプライズや、機関がビットコインから他の資産にシフトすることは、上昇の潜在能力を減少させる可能性があります。
現在、$106,127 USD付近で取引されています。
最近、$100,000を下回りましたが、回復し、そのゾーンでの強い買い興味を示しています。
📊 テクニカル & マーケット分析
サポートとレジスタンス
主要な短期サポートゾーンは$100,000付近にあります。 BTCは約$98,944付近で再テストし、その後反発しました。
次の重要なレジスタンスは、$110,000付近の200日EMAです。
マーケット構造 & センチメント
テクニカル構造は、下落する高値と深い修正のリスクを伴う弱気のシフトの兆候を示しています。
しかし、センチメントも回復力を示しています:$99Kゾーンからの反発は、ブルが存在し続けることを示唆しています。
機関投資家やマクロドライバーが広範な動きに影響を与えています:規制のシグナル、米国の政治的安定性、そして機関の財務行動はすべて重要です。
🧭 動きの要因
最近の約$99,000の再テストは、心理的およびテクニカルなリセットとして機能しました。 反発はサポートと新たな興味を示しています。
広範な暗号およびリスク資産のセンチメントは、最近米国の政治リスクがやや緩和されたため改善し、BTCの穏やかな上昇を助けました。
その一方で、一部の大規模なエンティティ(暗号財務会社)がBTCではなく、より投機的なトークンにシフトしているため、ビットコインの増分需要が減少する可能性があります。
🎯 短期 & 中期の見通し
短期(数週間):ビットコインが$100Kサポートを上回っている限り、$110K-$115Kに向けた回復が可能です。 サポートの喪失は、$94Kまたはそれ以下へのスライドを開く可能性があります。
中期(年末まで):いくつかの強気の予測は、モメンタムが戻ればBTCが$120,000-$150,000に達する可能性があることを示唆しています。
⚠️ 注意すべき主要リスク
$100Kサポートを下回ると、$90Kまたはそれ以下への深い修正が引き起こされる可能性があります。
伝統的な市場(株式)が急激に修正される場合、BTCはリスク資産との相関が高まる中で追随する可能性があります。
規制のサプライズや、機関がビットコインから他の資産にシフトすることは、上昇の潜在能力を減少させる可能性があります。

2
·
--
$XRP 無料ポイントの収集を逃したとき、もう逃さないでください。そうすれば、簡単にUsdcコインに変換できます。
$XRP 無料ポイントの収集を逃したとき、もう逃さないでください。そうすれば、簡単にUsdcコインに変換できます。
88
ログインして、さらにコンテンツを読む
厳選トピックで世界の暗号資産トレーダーの仲間入り
⚡️ 暗号資産に関する最新かつ有益な情報が見つかります。
💬 世界最大の暗号資産取引所から信頼されています。
👍 認証を受けたクリエイターから、有益なインサイトを得られます。
メール / 電話番号
トレンドトピック
FedRateWatch
閲覧回数 79,426
465人が討論中
トレンドハッシュタグキャンペーンで「シェア&ウィン」交通(トラフィック)報酬を獲得しよう
✨トピック:FOMC 9月、「次のFRBの一手」は?
👉参加方法:
ハッシュタグ #FedRateWatch を付けて短い投稿または記事を投稿してください
以下の観点に基づいてコンテンツを作成してください:
- 8月のコアCPIは前月比0.3%上昇し、今週の25bp利上げの確率は現在約90%です。今週、利上げはあると思いますか?それは一時的なものですか、それともより長い利上げサイクルの始まりでしょうか?
- 利上げが実施された場合、BTC、テック株、ゴールドはどのように動きますか?強気(ブル)か弱気(ベア)か?
- 次の取引はどう計画していますか?取引共有ウィジェットを使って、BTC、株、またはゴールドの取引/保有を共有してください。
⏰キャンペーン期間:
- 2026-09-15 11:00 - 2026-09-17 3:00 UTC
🎁報酬:
- 上記のガイドラインを満たし、かつ100語を超える適格な投稿は審査され、抽選で500〜3,000ビューのランダムなトラフィック増加が付与される場合があります。投稿が選ばれた場合、フィードの事務局から通知が届きます。
- 記事がBinance Square Officialで特集されるチャンス
投稿のアイデアが必要ですか?トピックページ #FedRateWatch へアクセスするか、 Square Guide on How to Post for Better Reach をご覧ください。
Binance Square Official
·いいね:118件
·閲覧回数 202.2k
BitcoinReboundsTo$79K
閲覧回数 38,238
303人が討論中
US30YTreasuryYieldTops5.40%
閲覧回数 0
0人が討論中