
MOBIN CRYPTOX
926 投稿

MOBIN CRYPTOX
報告
ユーザーをブロック
Crypto and Gold Market Analysis Bitcoin ETH XAUUSD Technical Analysis Market Research
取引を発注
高頻度トレーダー
1.1年
30 フォロー
777 フォロワー
337 いいね
投稿
ポートフォリオ
すべて
引用
·
--
弱気相場
翻訳参照
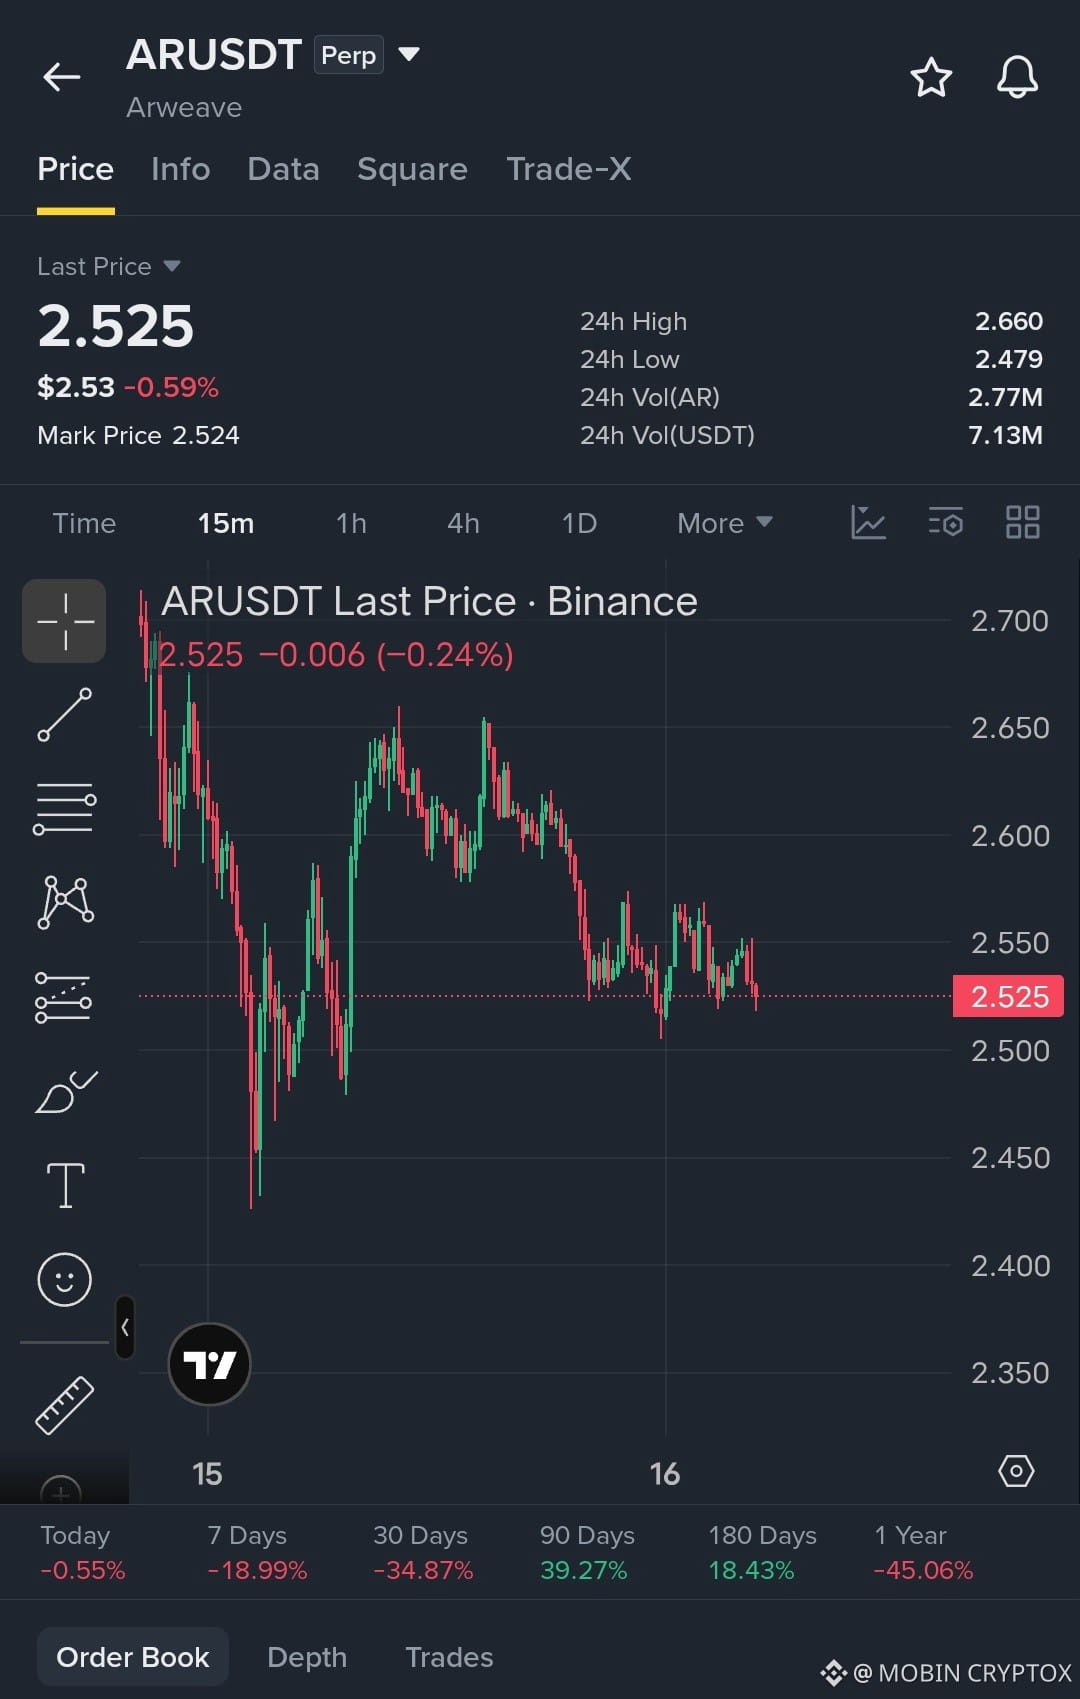
$AR ARWEAVE (AR) AT $2.52 — BREAKDOWN OR RECOVERY AHEAD
{future}(ARUSDT)
Arweave is showing short-term weakness after a prolonged decline. Buyers are attempting to stabilize the price around $2.52, but selling pressure remains visible.
📊 Key Levels 🟢 Support: $2.50 – $2.48 🔴 Resistance: $2.55 – $2.60
📈 Bullish Scenario: A confirmed breakout above $2.55 could open the way toward $2.60.
📉 Bearish Scenario: A breakdown below $2.48 could increase downside pressure.
🔍 What's Next? The market needs stronger buying volume before a recovery can be trusted. No confirmed reversal yet.
💬 Your Opinion: Will AR recover above $2.60, or will sellers push it lower?
#AR #Arweave #CryptoAnalysis #Altcoins #BinanceSquare
Educational market analysis, not financial advice. DYOR.
$AR
$AR ARWEAVE (AR) AT $2.52 — BREAKDOWN OR RECOVERY AHEAD
Arweave is showing short-term weakness after a prolonged decline. Buyers are attempting to stabilize the price around $2.52, but selling pressure remains visible.
📊 Key Levels 🟢 Support: $2.50 – $2.48 🔴 Resistance: $2.55 – $2.60
📈 Bullish Scenario: A confirmed breakout above $2.55 could open the way toward $2.60.
📉 Bearish Scenario: A breakdown below $2.48 could increase downside pressure.
🔍 What's Next? The market needs stronger buying volume before a recovery can be trusted. No confirmed reversal yet.
💬 Your Opinion: Will AR recover above $2.60, or will sellers push it lower?
#AR #Arweave #CryptoAnalysis #Altcoins #BinanceSquare
Educational market analysis, not financial advice. DYOR.
$AR
Arweave is showing short-term weakness after a prolonged decline. Buyers are attempting to stabilize the price around $2.52, but selling pressure remains visible.
📊 Key Levels 🟢 Support: $2.50 – $2.48 🔴 Resistance: $2.55 – $2.60
📈 Bullish Scenario: A confirmed breakout above $2.55 could open the way toward $2.60.
📉 Bearish Scenario: A breakdown below $2.48 could increase downside pressure.
🔍 What's Next? The market needs stronger buying volume before a recovery can be trusted. No confirmed reversal yet.
💬 Your Opinion: Will AR recover above $2.60, or will sellers push it lower?
#AR #Arweave #CryptoAnalysis #Altcoins #BinanceSquare
Educational market analysis, not financial advice. DYOR.
$AR
113

記事
金に下押し圧力!今は買いの好機か、それとも本格的な調整の始まりか$XAU 金は常に安全資産と見なされてきました。しかし、金でさえ強力な市場の力には無縁ではありません。
このところ貴金属である金は急落しており、重要な疑問が浮上しています。投資家は金への信頼を失いつつあるのでしょうか。それとも、市場が新たな経済の現実に適応しているだけなのでしょうか?
$XAU 📊 金市場で何が起きているのか?
ロイター通信によると、2026年11月13日、現物金は1オンスあたり約3,879.71ドルで取引されていました。この週に約4.5%下落した後のことです。
金価格は木曜日の売りに押され、一時3,852ドル近辺まで下落しました。
金に下押し圧力!今は買いの好機か、それとも本格的な調整の始まりか
$XAU 金は常に安全資産と見なされてきました。しかし、金でさえ強力な市場の力には無縁ではありません。
このところ貴金属である金は急落しており、重要な疑問が浮上しています。投資家は金への信頼を失いつつあるのでしょうか。それとも、市場が新たな経済の現実に適応しているだけなのでしょうか?
$XAU 📊 金市場で何が起きているのか?
ロイター通信によると、2026年11月13日、現物金は1オンスあたり約3,879.71ドルで取引されていました。この週に約4.5%下落した後のことです。
金価格は木曜日の売りに押され、一時3,852ドル近辺まで下落しました。
このところ貴金属である金は急落しており、重要な疑問が浮上しています。投資家は金への信頼を失いつつあるのでしょうか。それとも、市場が新たな経済の現実に適応しているだけなのでしょうか?
$XAU 📊 金市場で何が起きているのか?
ロイター通信によると、2026年11月13日、現物金は1オンスあたり約3,879.71ドルで取引されていました。この週に約4.5%下落した後のことです。
金価格は木曜日の売りに押され、一時3,852ドル近辺まで下落しました。
415
翻訳参照
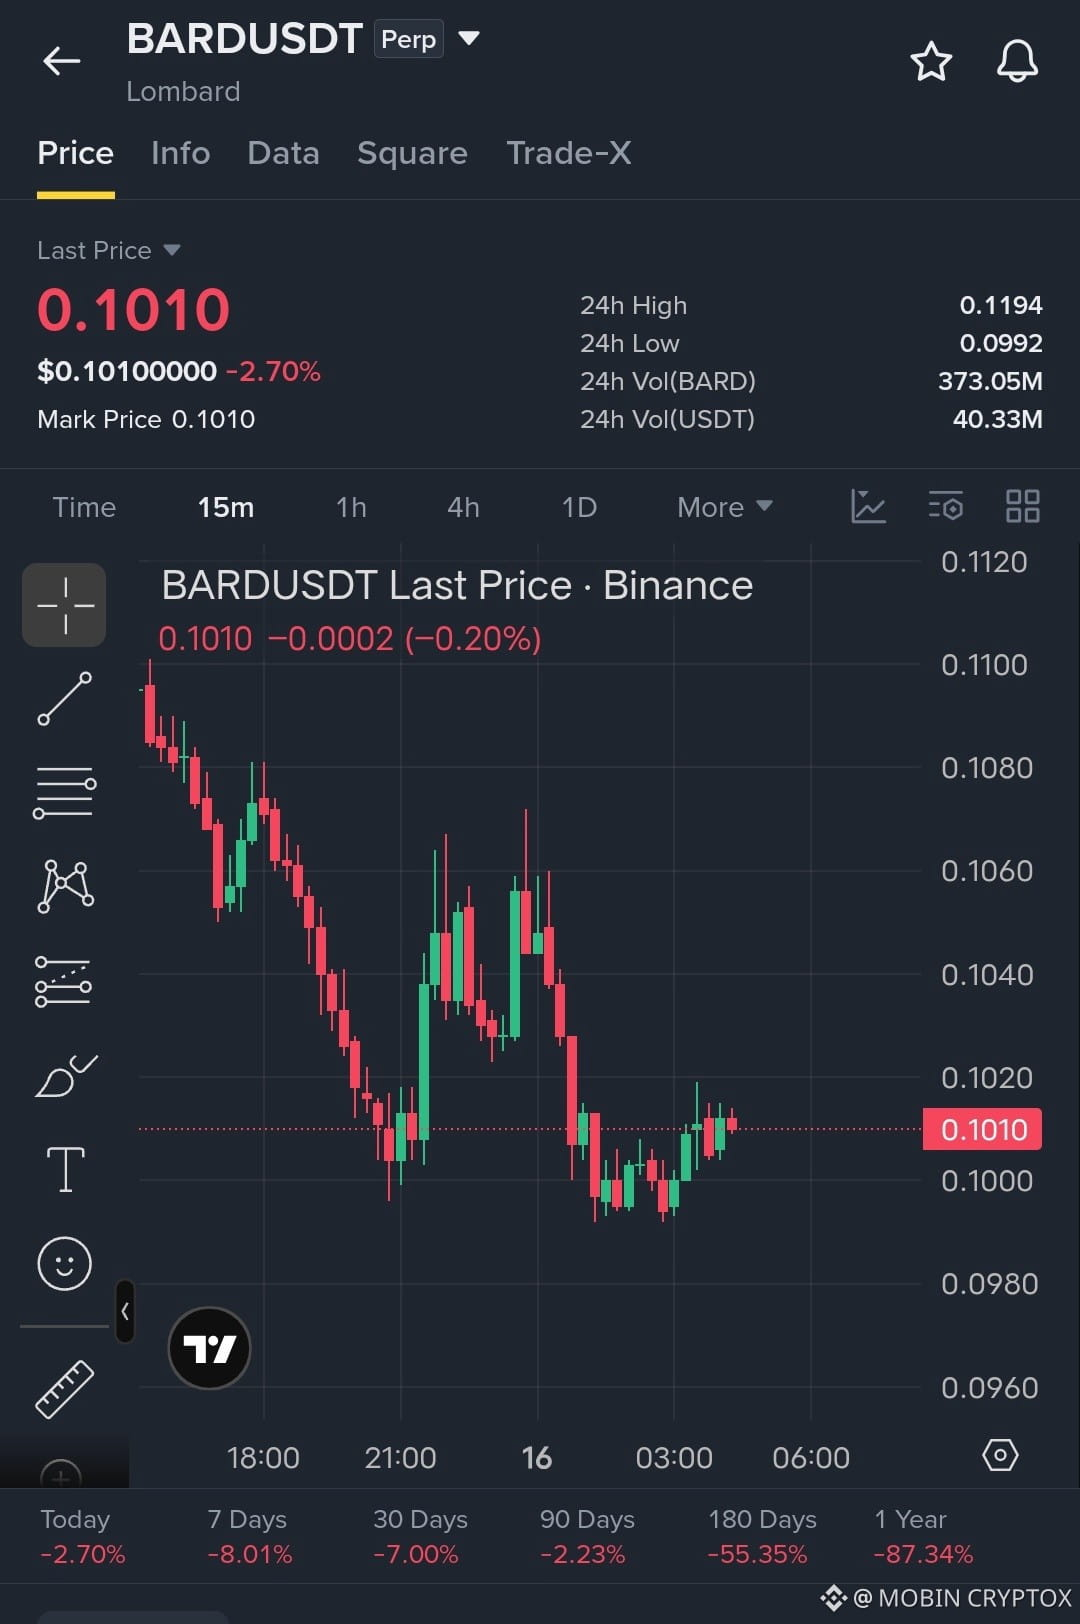
$BARD BARDUSDT: Is a Recovery Coming or More Downside Ahead?
{future}(BARDUSDT)
BARD is showing weakness after a prolonged decline. The latest candles indicate a small recovery, but buyers have not confirmed a trend reversal.
📊 Market Overview
Price: $0.1010
24H Change: -2.70%
24H High: $0.1194
24H Low: $0.0992
🔍 Key Technical Levels 🟢 Support: $0.1000–$0.0990 🔴 Resistance: $0.1020–$0.1040
📈 My Analysis: BARD is attempting to stabilize near $0.1010. A breakout above $0.1040 could improve short-term momentum.
However, a breakdown below $0.0990 could bring further selling pressure.
What do you think? Can BARD recover, or will sellers take control again?
#BARD #BARDUSDT #CryptoAnalysis #Altcoins #BinanceSquare
Educational analysis based on the supplied 15-minute chart. Not financial advice.
$BARD
$BARD BARDUSDT: Is a Recovery Coming or More Downside Ahead?
BARD is showing weakness after a prolonged decline. The latest candles indicate a small recovery, but buyers have not confirmed a trend reversal.
📊 Market Overview
Price: $0.1010
24H Change: -2.70%
24H High: $0.1194
24H Low: $0.0992
🔍 Key Technical Levels 🟢 Support: $0.1000–$0.0990 🔴 Resistance: $0.1020–$0.1040
📈 My Analysis: BARD is attempting to stabilize near $0.1010. A breakout above $0.1040 could improve short-term momentum.
However, a breakdown below $0.0990 could bring further selling pressure.
What do you think? Can BARD recover, or will sellers take control again?
#BARD #BARDUSDT #CryptoAnalysis #Altcoins #BinanceSquare
Educational analysis based on the supplied 15-minute chart. Not financial advice.
$BARD
BARD is showing weakness after a prolonged decline. The latest candles indicate a small recovery, but buyers have not confirmed a trend reversal.
📊 Market Overview
Price: $0.1010
24H Change: -2.70%
24H High: $0.1194
24H Low: $0.0992
🔍 Key Technical Levels 🟢 Support: $0.1000–$0.0990 🔴 Resistance: $0.1020–$0.1040
📈 My Analysis: BARD is attempting to stabilize near $0.1010. A breakout above $0.1040 could improve short-term momentum.
However, a breakdown below $0.0990 could bring further selling pressure.
What do you think? Can BARD recover, or will sellers take control again?
#BARD #BARDUSDT #CryptoAnalysis #Altcoins #BinanceSquare
Educational analysis based on the supplied 15-minute chart. Not financial advice.
$BARD
145
記事
翻訳参照
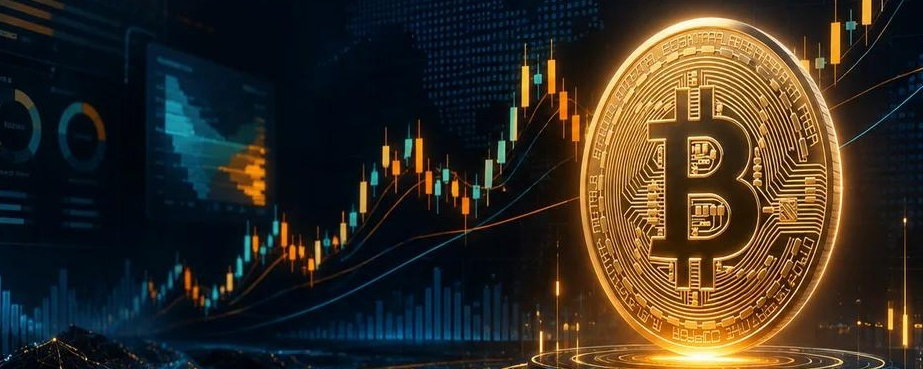
BITCOIN: The Calm Before the Next Big Move? What Are Smart Investors Watching?Bitcoin is more than just a cryptocurrency. It is a market driven by psychology, liquidity, institutional money and investor confidence.
But here's an important question:
When Bitcoin suddenly drops, is it the end of the rally—or an opportunity for a new beginning?
Let's explore 5 things every Bitcoin investor should understand.
📊 1. The Battle Between Buyers and Sellers
Every Bitcoin price movement tells a story.
When buyers become stronger, prices can move higher. When sellers dominate, downward pressure increases.
The important thing isn't simply watching green and red candles. It's understanding WHY the price is moving.
🐋 2. What Are Bitcoin Whales Doing?
Large Bitcoin holders can influence market liquidity and sentiment.
Investors often monitor:$BTC
Large wallet transactions.Exchange inflows and outflows.Institutional Bitcoin purchases.Changes in long-term holder behaviour.
However, a large transaction doesn't automatically mean buying or selling pressure.
📉 3. Why Market Corrections Matter
Many investors become emotional when Bitcoin falls.
But corrections are part of volatile financial markets.
Instead of immediately assuming a recovery, examine:
Important support levels.Resistance zones.Trading volume.Market momentum
A recovery needs confirmation, not just hope.
🏦 4. Institutional Money Changes the Conversation
Bitcoin ETFs and institutional participation have created additional ways for traditional investors to gain exposure to Bitcoin.
But institutional interest doesn't guarantee higher prices.
Liquidity, economic conditions and investor sentiment still matter.
🔥 5. The Most Important Thing: Risk Management
You don't need to predict every Bitcoin movement to become a better investor.
Understand your risk.
Avoid emotional decisions.
Be careful with leverage.
Never invest money you cannot afford to lose.
💭 My Final Thought
Bitcoin's next major move will create opportunities and risks.
The real question isn't whether Bitcoin will go up or down tomorrow.
The real question is: Are you prepared for both possibilities?
👇 Let's discuss!
What do you think will drive Bitcoin's next major move?
1️⃣ Institutional investment
2️⃣ Bitcoin supply and demand
3️⃣ Global economic conditions
4️⃣ Market psychology
Share your opinion in the comments!
#bitcoin #BTC走势分析 #CryptoMarket #BitcoinAnalysis #Binance $BTC $BTC
BITCOIN: The Calm Before the Next Big Move? What Are Smart Investors Watching?
Bitcoin is more than just a cryptocurrency. It is a market driven by psychology, liquidity, institutional money and investor confidence.
But here's an important question:
When Bitcoin suddenly drops, is it the end of the rally—or an opportunity for a new beginning?
Let's explore 5 things every Bitcoin investor should understand.
📊 1. The Battle Between Buyers and Sellers
Every Bitcoin price movement tells a story.
When buyers become stronger, prices can move higher. When sellers dominate, downward pressure increases.
The important thing isn't simply watching green and red candles. It's understanding WHY the price is moving.
🐋 2. What Are Bitcoin Whales Doing?
Large Bitcoin holders can influence market liquidity and sentiment.
Investors often monitor:$BTC
Large wallet transactions.Exchange inflows and outflows.Institutional Bitcoin purchases.Changes in long-term holder behaviour.
However, a large transaction doesn't automatically mean buying or selling pressure.
📉 3. Why Market Corrections Matter
Many investors become emotional when Bitcoin falls.
But corrections are part of volatile financial markets.
Instead of immediately assuming a recovery, examine:
Important support levels.Resistance zones.Trading volume.Market momentum
A recovery needs confirmation, not just hope.
🏦 4. Institutional Money Changes the Conversation
Bitcoin ETFs and institutional participation have created additional ways for traditional investors to gain exposure to Bitcoin.
But institutional interest doesn't guarantee higher prices.
Liquidity, economic conditions and investor sentiment still matter.
🔥 5. The Most Important Thing: Risk Management
You don't need to predict every Bitcoin movement to become a better investor.
Understand your risk.
Avoid emotional decisions.
Be careful with leverage.
Never invest money you cannot afford to lose.
💭 My Final Thought
Bitcoin's next major move will create opportunities and risks.
The real question isn't whether Bitcoin will go up or down tomorrow.
The real question is: Are you prepared for both possibilities?
👇 Let's discuss!
What do you think will drive Bitcoin's next major move?
1️⃣ Institutional investment
2️⃣ Bitcoin supply and demand
3️⃣ Global economic conditions
4️⃣ Market psychology
Share your opinion in the comments!
#bitcoin #BTC走势分析 #CryptoMarket #BitcoinAnalysis #Binance $BTC $BTC
But here's an important question:
When Bitcoin suddenly drops, is it the end of the rally—or an opportunity for a new beginning?
Let's explore 5 things every Bitcoin investor should understand.
📊 1. The Battle Between Buyers and Sellers
Every Bitcoin price movement tells a story.
When buyers become stronger, prices can move higher. When sellers dominate, downward pressure increases.
The important thing isn't simply watching green and red candles. It's understanding WHY the price is moving.
🐋 2. What Are Bitcoin Whales Doing?
Large Bitcoin holders can influence market liquidity and sentiment.
Investors often monitor:$BTC
Large wallet transactions.Exchange inflows and outflows.Institutional Bitcoin purchases.Changes in long-term holder behaviour.
However, a large transaction doesn't automatically mean buying or selling pressure.
📉 3. Why Market Corrections Matter
Many investors become emotional when Bitcoin falls.
But corrections are part of volatile financial markets.
Instead of immediately assuming a recovery, examine:
Important support levels.Resistance zones.Trading volume.Market momentum
A recovery needs confirmation, not just hope.
🏦 4. Institutional Money Changes the Conversation
Bitcoin ETFs and institutional participation have created additional ways for traditional investors to gain exposure to Bitcoin.
But institutional interest doesn't guarantee higher prices.
Liquidity, economic conditions and investor sentiment still matter.
🔥 5. The Most Important Thing: Risk Management
You don't need to predict every Bitcoin movement to become a better investor.
Understand your risk.
Avoid emotional decisions.
Be careful with leverage.
Never invest money you cannot afford to lose.
💭 My Final Thought
Bitcoin's next major move will create opportunities and risks.
The real question isn't whether Bitcoin will go up or down tomorrow.
The real question is: Are you prepared for both possibilities?
👇 Let's discuss!
What do you think will drive Bitcoin's next major move?
1️⃣ Institutional investment
2️⃣ Bitcoin supply and demand
3️⃣ Global economic conditions
4️⃣ Market psychology
Share your opinion in the comments!
#bitcoin #BTC走势分析 #CryptoMarket #BitcoinAnalysis #Binance $BTC $BTC
90
·
--
弱気相場
翻訳参照
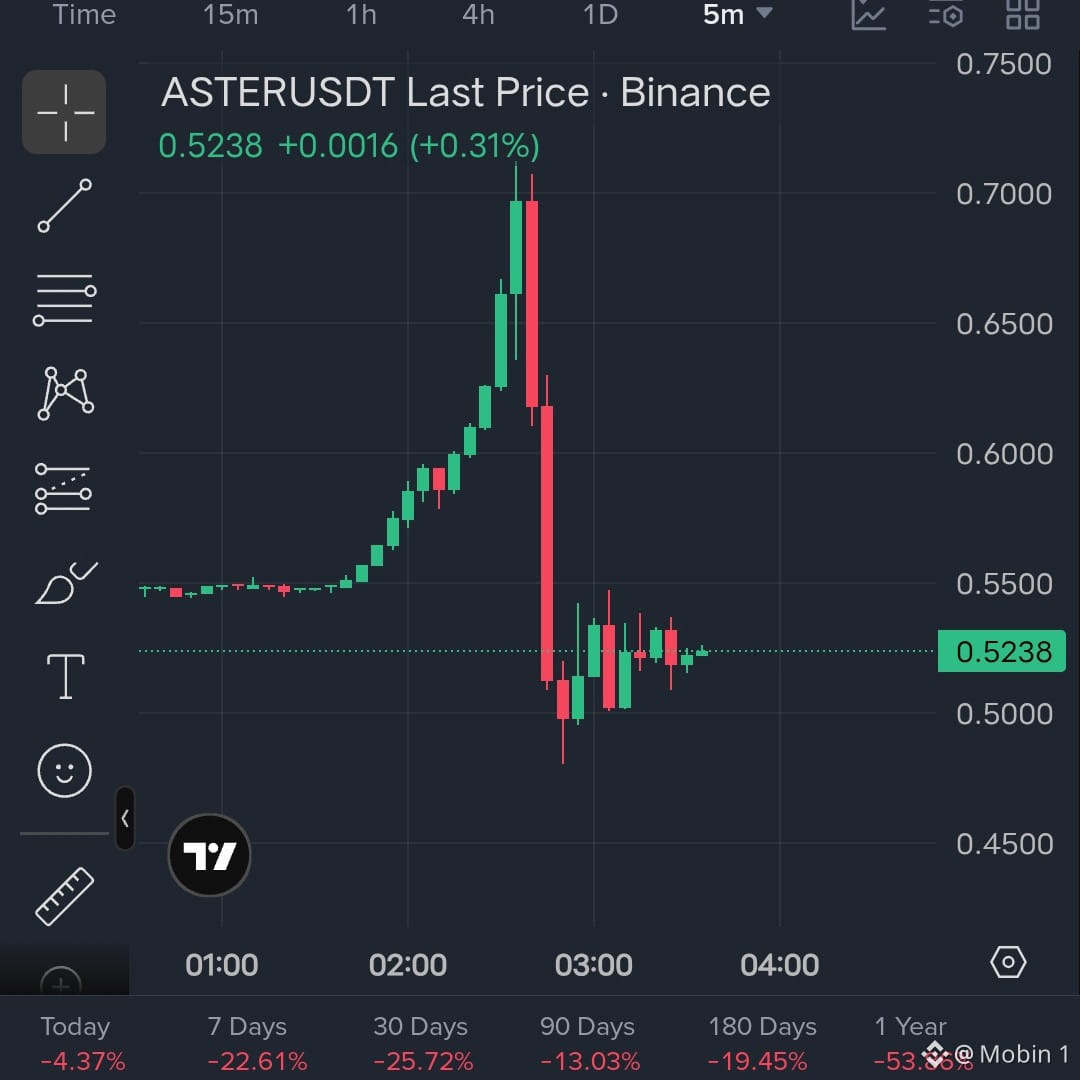
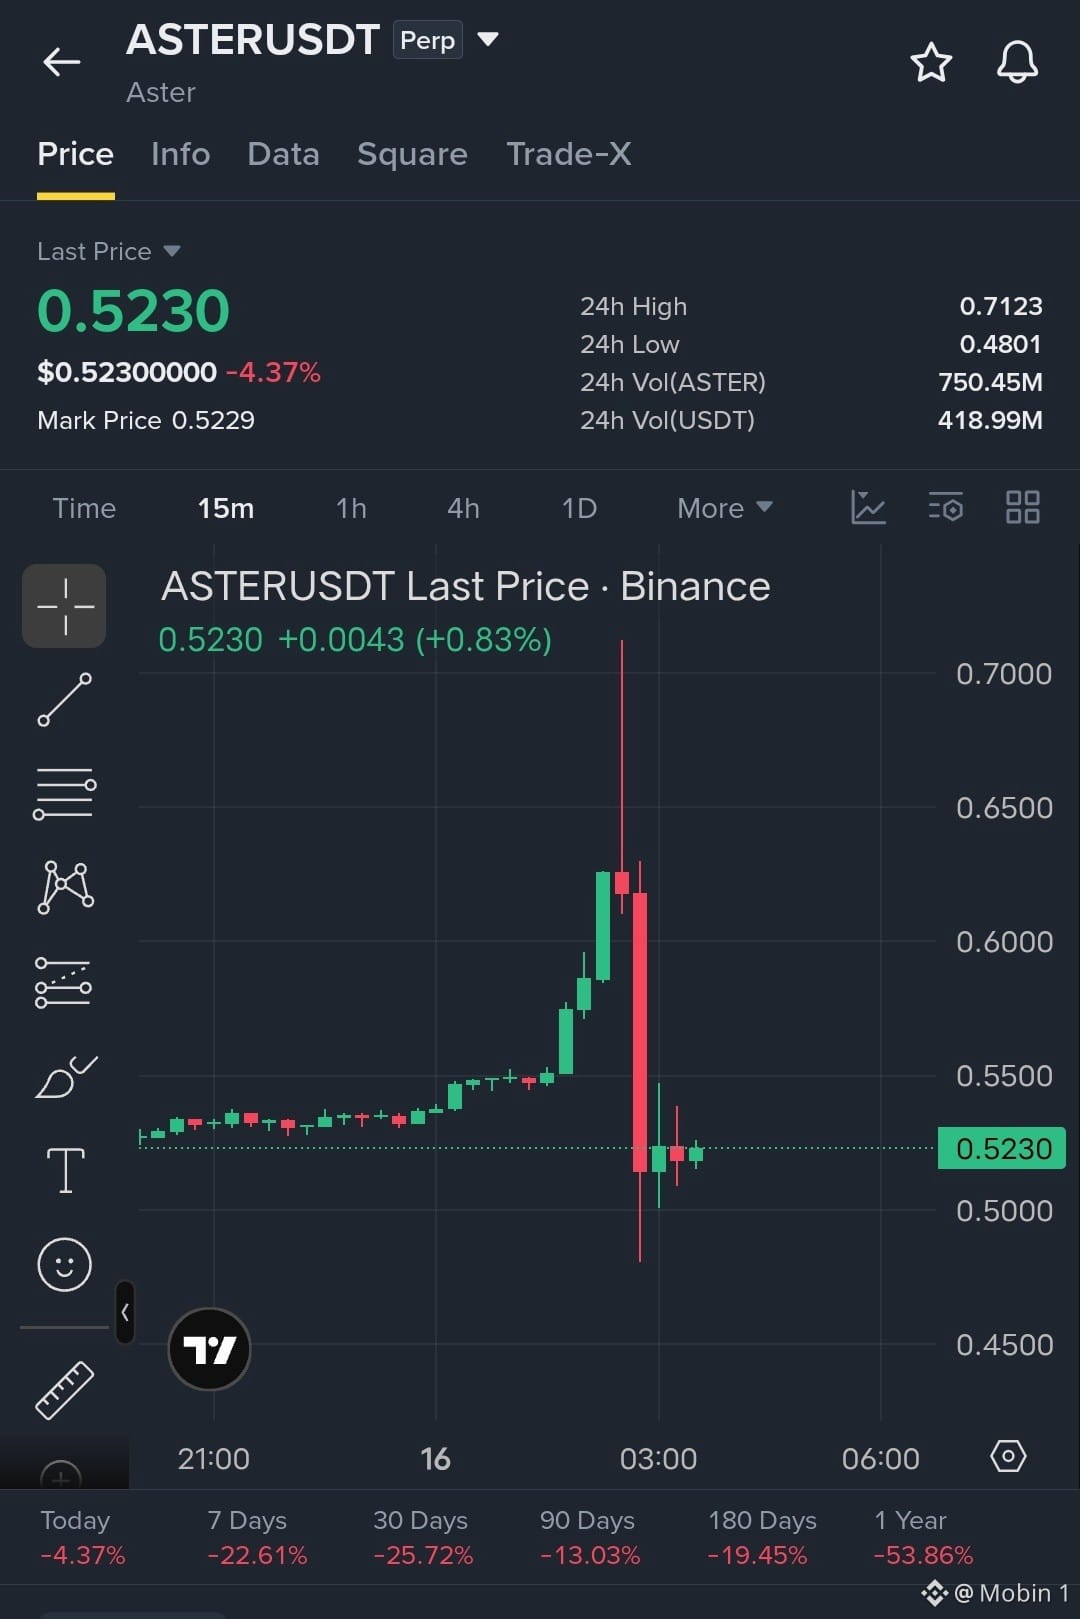
$ASTER 📉 ASTER/USDT: Sharp Rejection After Massive Rally!
ASTER surged to $0.7123 before experiencing a sharp sell-off to $0.4801.
Market Overview
Current price: $0.5230
24h change: -4.37%
24h high: $0.7123
24h low: $0.4801
Technical Analysis 🔴 Resistance: $0.5500–$0.6000
🟢 Support: $0.5000 and $0.4800
My View: ASTER is consolidating around $0.52 after a strong correction. Buyers need to regain momentum to challenge resistance.
A break below $0.50 could increase downside pressure.
What do you think? Will ASTER recover or drop further?
#ASTER #ASTERUSDT #CryptoAnalysis #BinanceSquare
Educational analysis based on the supplied chart. Not financial advice.
$ASTER $BTC
{future}(ASTERUSDT)
$ASTER 📉 ASTER/USDT: Sharp Rejection After Massive Rally!
ASTER surged to $0.7123 before experiencing a sharp sell-off to $0.4801.
Market Overview
Current price: $0.5230
24h change: -4.37%
24h high: $0.7123
24h low: $0.4801
Technical Analysis 🔴 Resistance: $0.5500–$0.6000
🟢 Support: $0.5000 and $0.4800
My View: ASTER is consolidating around $0.52 after a strong correction. Buyers need to regain momentum to challenge resistance.
A break below $0.50 could increase downside pressure.
What do you think? Will ASTER recover or drop further?
#ASTER #ASTERUSDT #CryptoAnalysis #BinanceSquare
Educational analysis based on the supplied chart. Not financial advice.
$ASTER $BTC
ASTER surged to $0.7123 before experiencing a sharp sell-off to $0.4801.
Market Overview
Current price: $0.5230
24h change: -4.37%
24h high: $0.7123
24h low: $0.4801
Technical Analysis 🔴 Resistance: $0.5500–$0.6000
🟢 Support: $0.5000 and $0.4800
My View: ASTER is consolidating around $0.52 after a strong correction. Buyers need to regain momentum to challenge resistance.
A break below $0.50 could increase downside pressure.
What do you think? Will ASTER recover or drop further?
#ASTER #ASTERUSDT #CryptoAnalysis #BinanceSquare
Educational analysis based on the supplied chart. Not financial advice.
$ASTER $BTC
531
翻訳参照
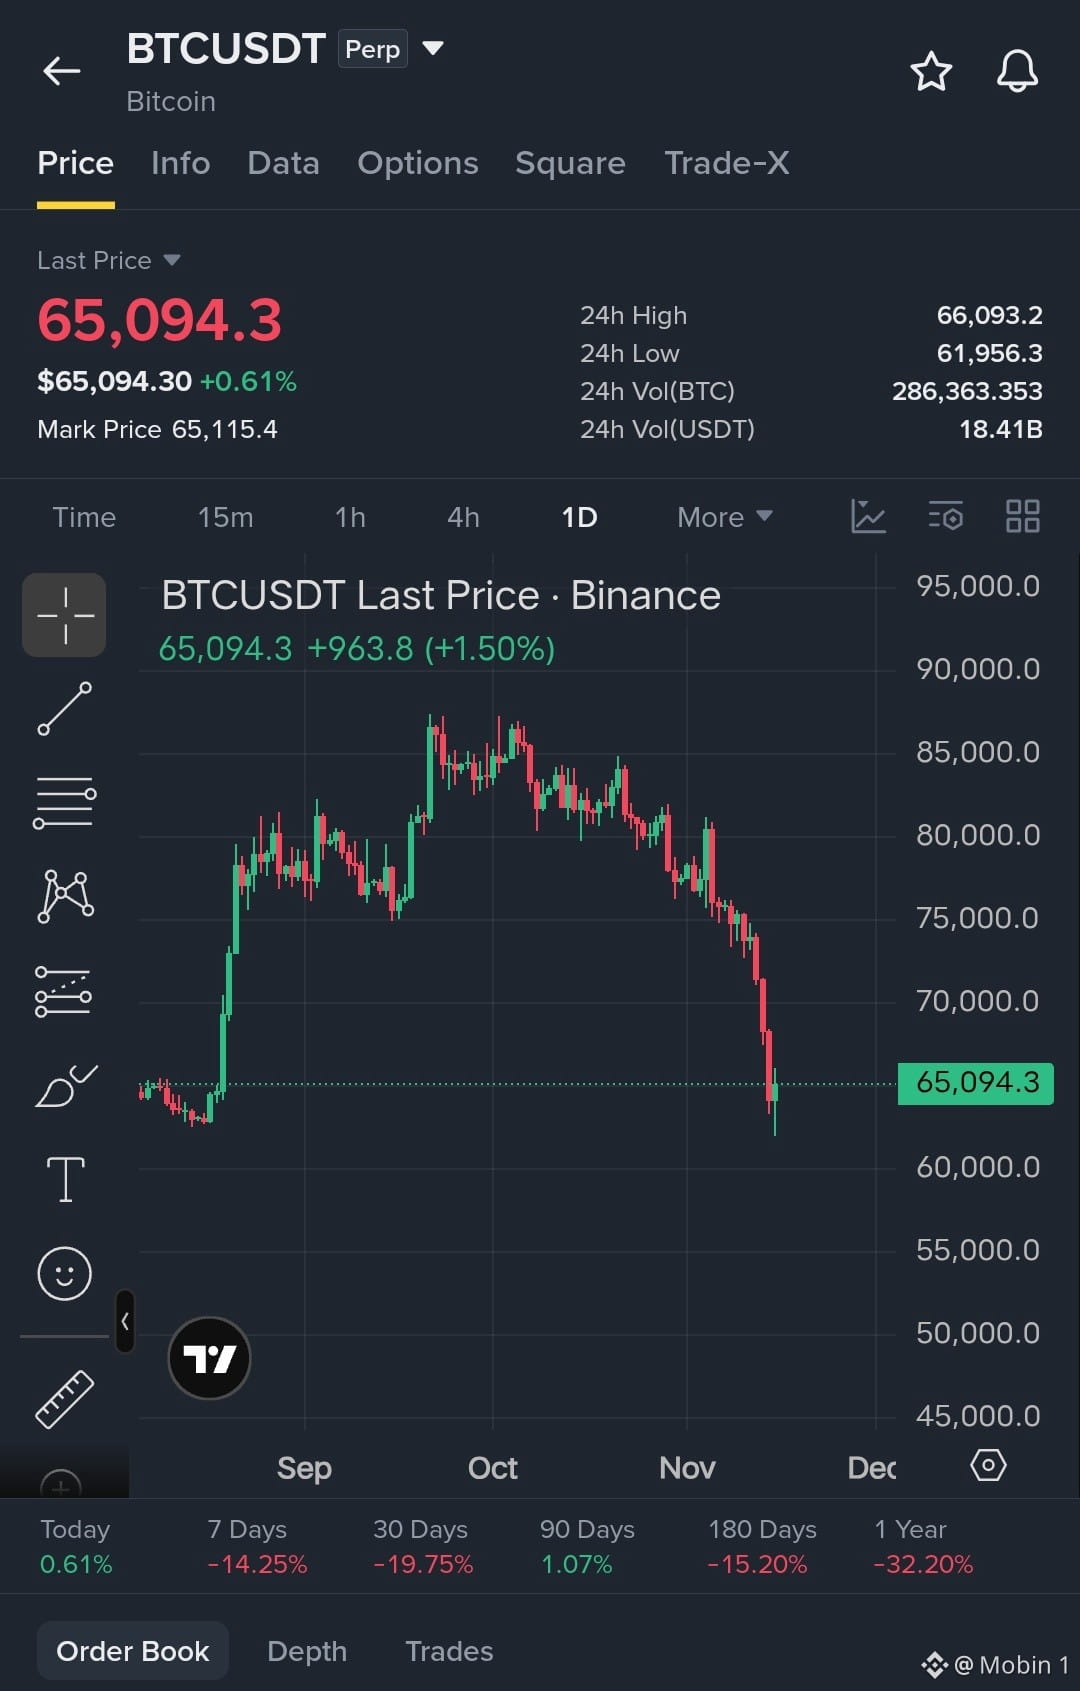
$BTC 📉 BITCOIN MARKET ANALYSIS: Is This a Real Recovery or Just a Temporary Bounce?
Bitcoin is showing a small recovery after a sharp decline. However, the bigger picture still deserves attention.
1 Overall Trend
Bitcoin has formed lower highs and lower lows on the visible daily chart. This suggests that sellers have maintained control over the broader trend.
2. Important Support
The $61,950–$62,000 area is an important level to monitor because the recent decline reached this region before bouncing.
If price breaks below this area and fails to recover, further downside pressure could develop.
3. Important Resistance
The $66,000–$66,100 region is the first level I would watch.
A daily close above this area, followed by a successful retest, could indicate improving buying strength.
📈 Two Possible Scenarios
🟢 Bullish Scenario: Bitcoin reclaims $66,100 and starts forming higher highs. This could create an opportunity for a stronger recovery.
🔴 Bearish Scenario: Bitcoin gets rejected near resistance and loses the $61,950 support area. This could indicate that sellers remain in control.
💭 My Personal View
I would avoid calling this a confirmed trend reversal based on one rebound.
I want to see stronger buying participation, a confirmed daily breakout and a successful retest before becoming more confident about a recovery.
Risk management matters more than predicting the exact bottom.
❓ What Do You Think?
Is Bitcoin preparing for a recovery, or could another correction be coming?
Share your analysis in the comments.
Follow me for more educational BTC market analysis.
#Bitcoin #BTC #BTCUSDT #CryptoAnalysis #TechnicalAnalysis #BinanceSquare
Disclaimer: Educational analysis based on the supplied chart. Not financial advice. Prices and market conditions may change.
{future}(BTCUSDT)
$BTC 📉 BITCOIN MARKET ANALYSIS: Is This a Real Recovery or Just a Temporary Bounce?
Bitcoin is showing a small recovery after a sharp decline. However, the bigger picture still deserves attention.
1 Overall Trend
Bitcoin has formed lower highs and lower lows on the visible daily chart. This suggests that sellers have maintained control over the broader trend.
2. Important Support
The $61,950–$62,000 area is an important level to monitor because the recent decline reached this region before bouncing.
If price breaks below this area and fails to recover, further downside pressure could develop.
3. Important Resistance
The $66,000–$66,100 region is the first level I would watch.
A daily close above this area, followed by a successful retest, could indicate improving buying strength.
📈 Two Possible Scenarios
🟢 Bullish Scenario: Bitcoin reclaims $66,100 and starts forming higher highs. This could create an opportunity for a stronger recovery.
🔴 Bearish Scenario: Bitcoin gets rejected near resistance and loses the $61,950 support area. This could indicate that sellers remain in control.
💭 My Personal View
I would avoid calling this a confirmed trend reversal based on one rebound.
I want to see stronger buying participation, a confirmed daily breakout and a successful retest before becoming more confident about a recovery.
Risk management matters more than predicting the exact bottom.
❓ What Do You Think?
Is Bitcoin preparing for a recovery, or could another correction be coming?
Share your analysis in the comments.
Follow me for more educational BTC market analysis.
#Bitcoin #BTC #BTCUSDT #CryptoAnalysis #TechnicalAnalysis #BinanceSquare
Disclaimer: Educational analysis based on the supplied chart. Not financial advice. Prices and market conditions may change.
Bitcoin is showing a small recovery after a sharp decline. However, the bigger picture still deserves attention.
1 Overall Trend
Bitcoin has formed lower highs and lower lows on the visible daily chart. This suggests that sellers have maintained control over the broader trend.
2. Important Support
The $61,950–$62,000 area is an important level to monitor because the recent decline reached this region before bouncing.
If price breaks below this area and fails to recover, further downside pressure could develop.
3. Important Resistance
The $66,000–$66,100 region is the first level I would watch.
A daily close above this area, followed by a successful retest, could indicate improving buying strength.
📈 Two Possible Scenarios
🟢 Bullish Scenario: Bitcoin reclaims $66,100 and starts forming higher highs. This could create an opportunity for a stronger recovery.
🔴 Bearish Scenario: Bitcoin gets rejected near resistance and loses the $61,950 support area. This could indicate that sellers remain in control.
💭 My Personal View
I would avoid calling this a confirmed trend reversal based on one rebound.
I want to see stronger buying participation, a confirmed daily breakout and a successful retest before becoming more confident about a recovery.
Risk management matters more than predicting the exact bottom.
❓ What Do You Think?
Is Bitcoin preparing for a recovery, or could another correction be coming?
Share your analysis in the comments.
Follow me for more educational BTC market analysis.
#Bitcoin #BTC #BTCUSDT #CryptoAnalysis #TechnicalAnalysis #BinanceSquare
Disclaimer: Educational analysis based on the supplied chart. Not financial advice. Prices and market conditions may change.
70
·
--
ブリッシュ
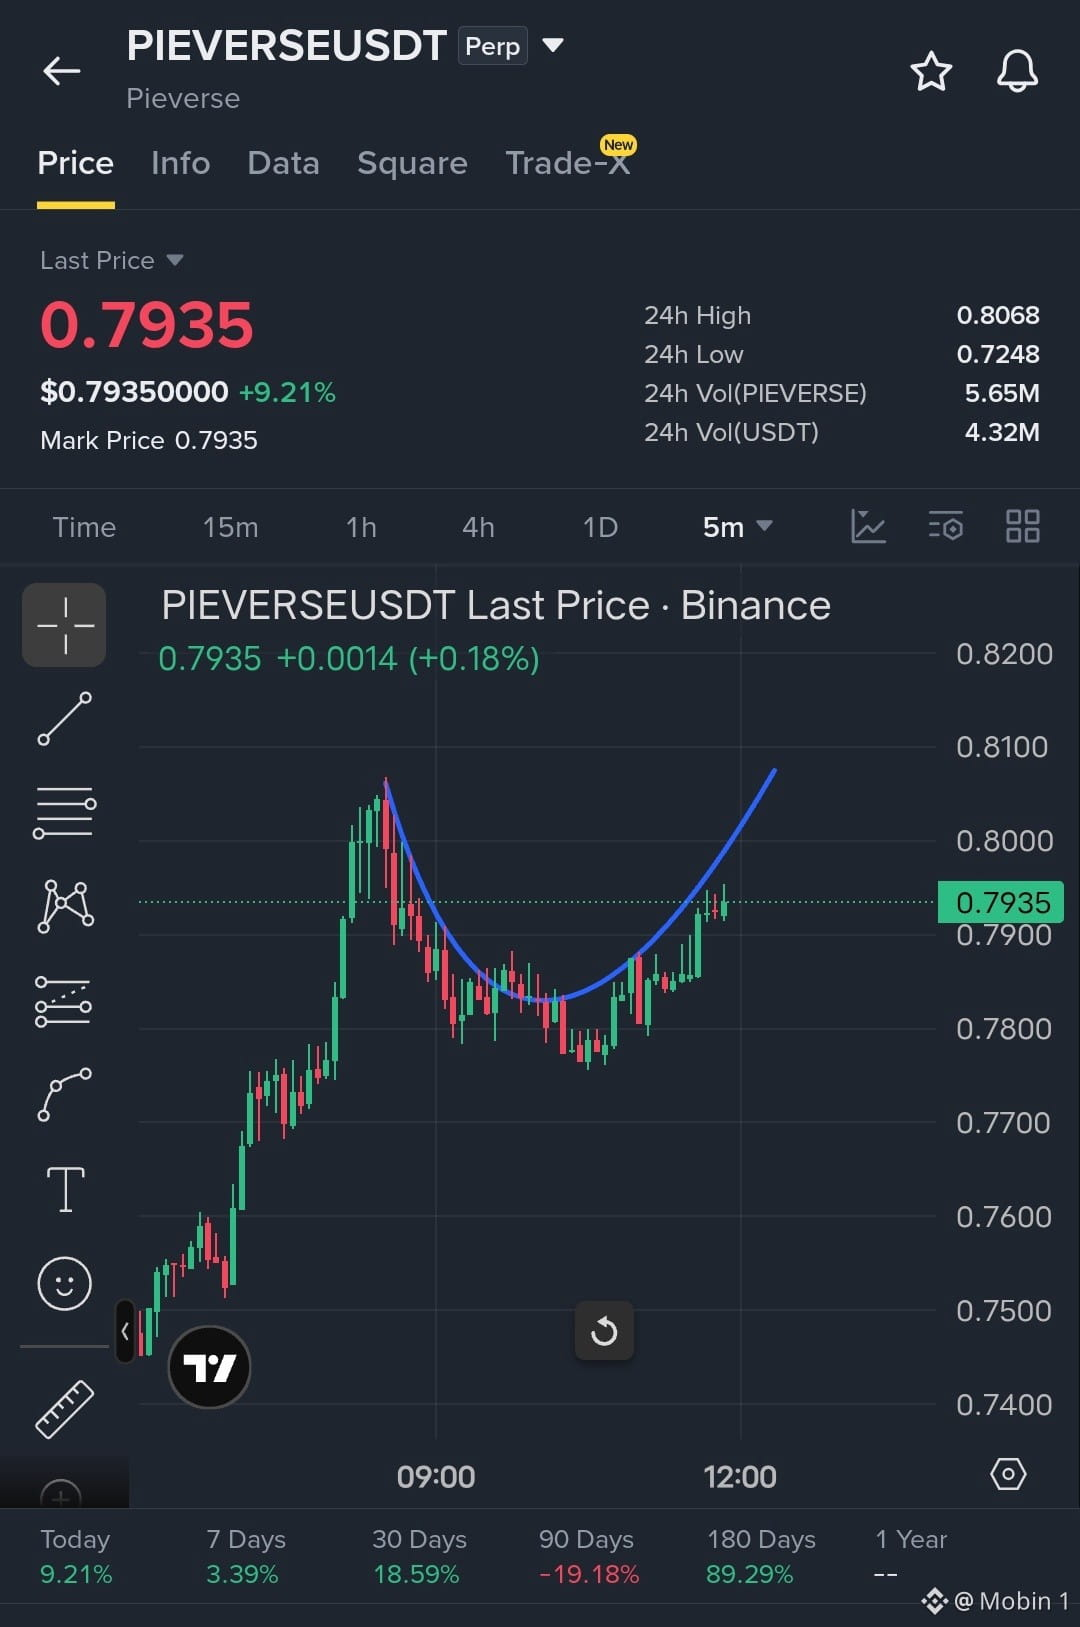
$PIEVERSE 強気の取引ですがリスクあり
エントリーの安全:
目標 🎯: $0.8100
損切り : 0.7840
{future}(PIEVERSEUSDT)
$PIEVERSE 強気の取引ですがリスクあり
エントリーの安全:
目標 🎯: $0.8100
損切り : 0.7840
エントリーの安全:
目標 🎯: $0.8100
損切り : 0.7840
86
·
--
ブリッシュ
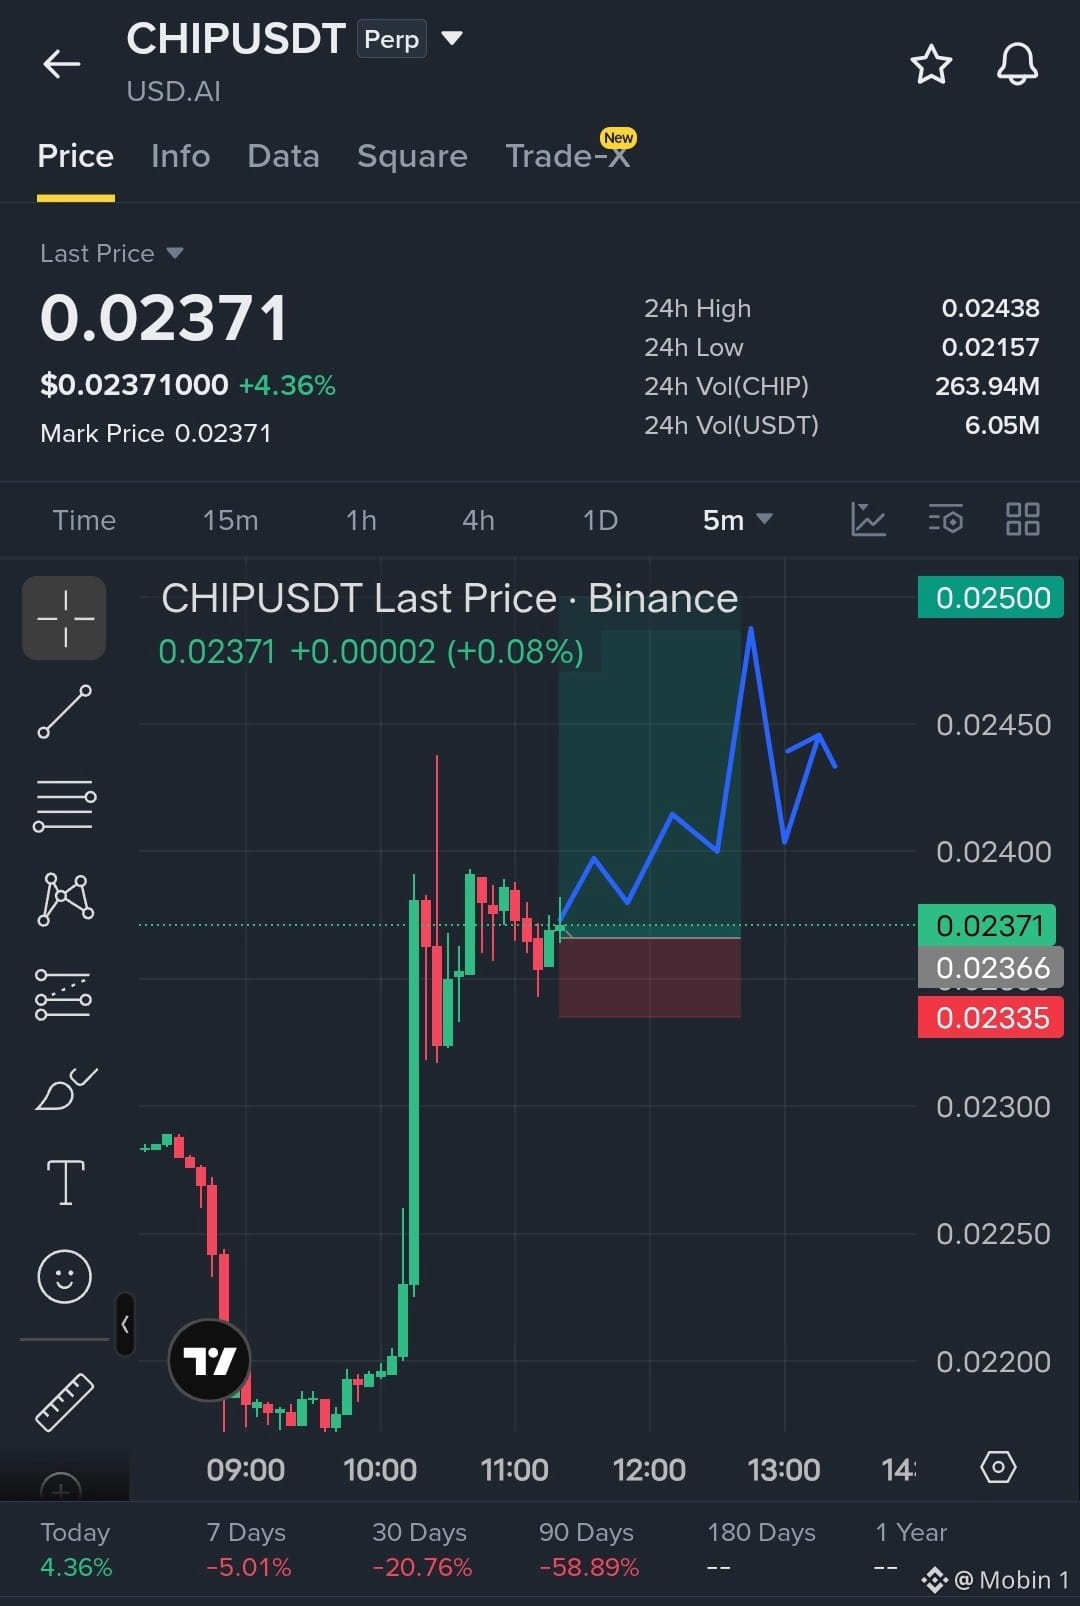
$CHIP 強気の取引
エントリー買い:$0.02366 -- $0.02371
目標 🎯: $0.02450
目標 🎯: $0.02500
損切り:$0.02335
{future}(CHIPUSDT)
$CHIP 強気の取引
エントリー買い:$0.02366 -- $0.02371
目標 🎯: $0.02450
目標 🎯: $0.02500
損切り:$0.02335
エントリー買い:$0.02366 -- $0.02371
目標 🎯: $0.02450
目標 🎯: $0.02500
損切り:$0.02335
1
319
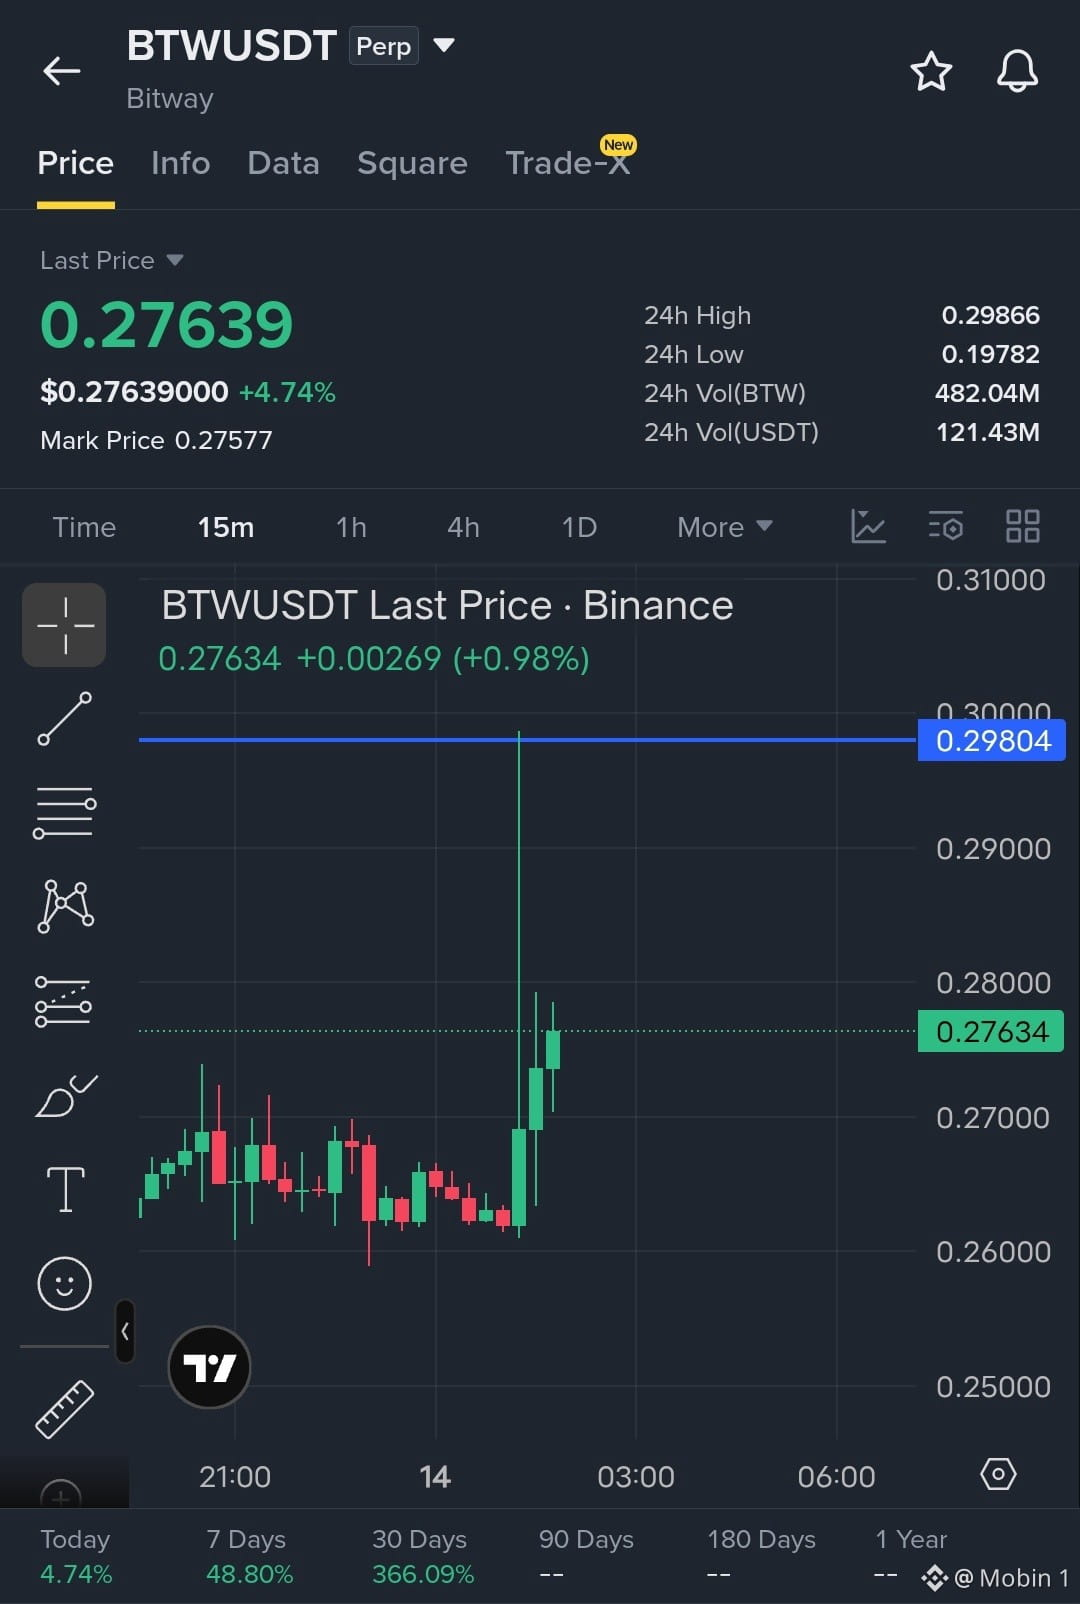
$BTW 強い強気パターン
安全なエントリー買い:
目標 🎯:0.29804
損切り:0.27000
{future}(BTWUSDT)
$BTW 強い強気パターン
安全なエントリー買い:
目標 🎯:0.29804
損切り:0.27000
安全なエントリー買い:
目標 🎯:0.29804
損切り:0.27000
277
·
--
ブリッシュ
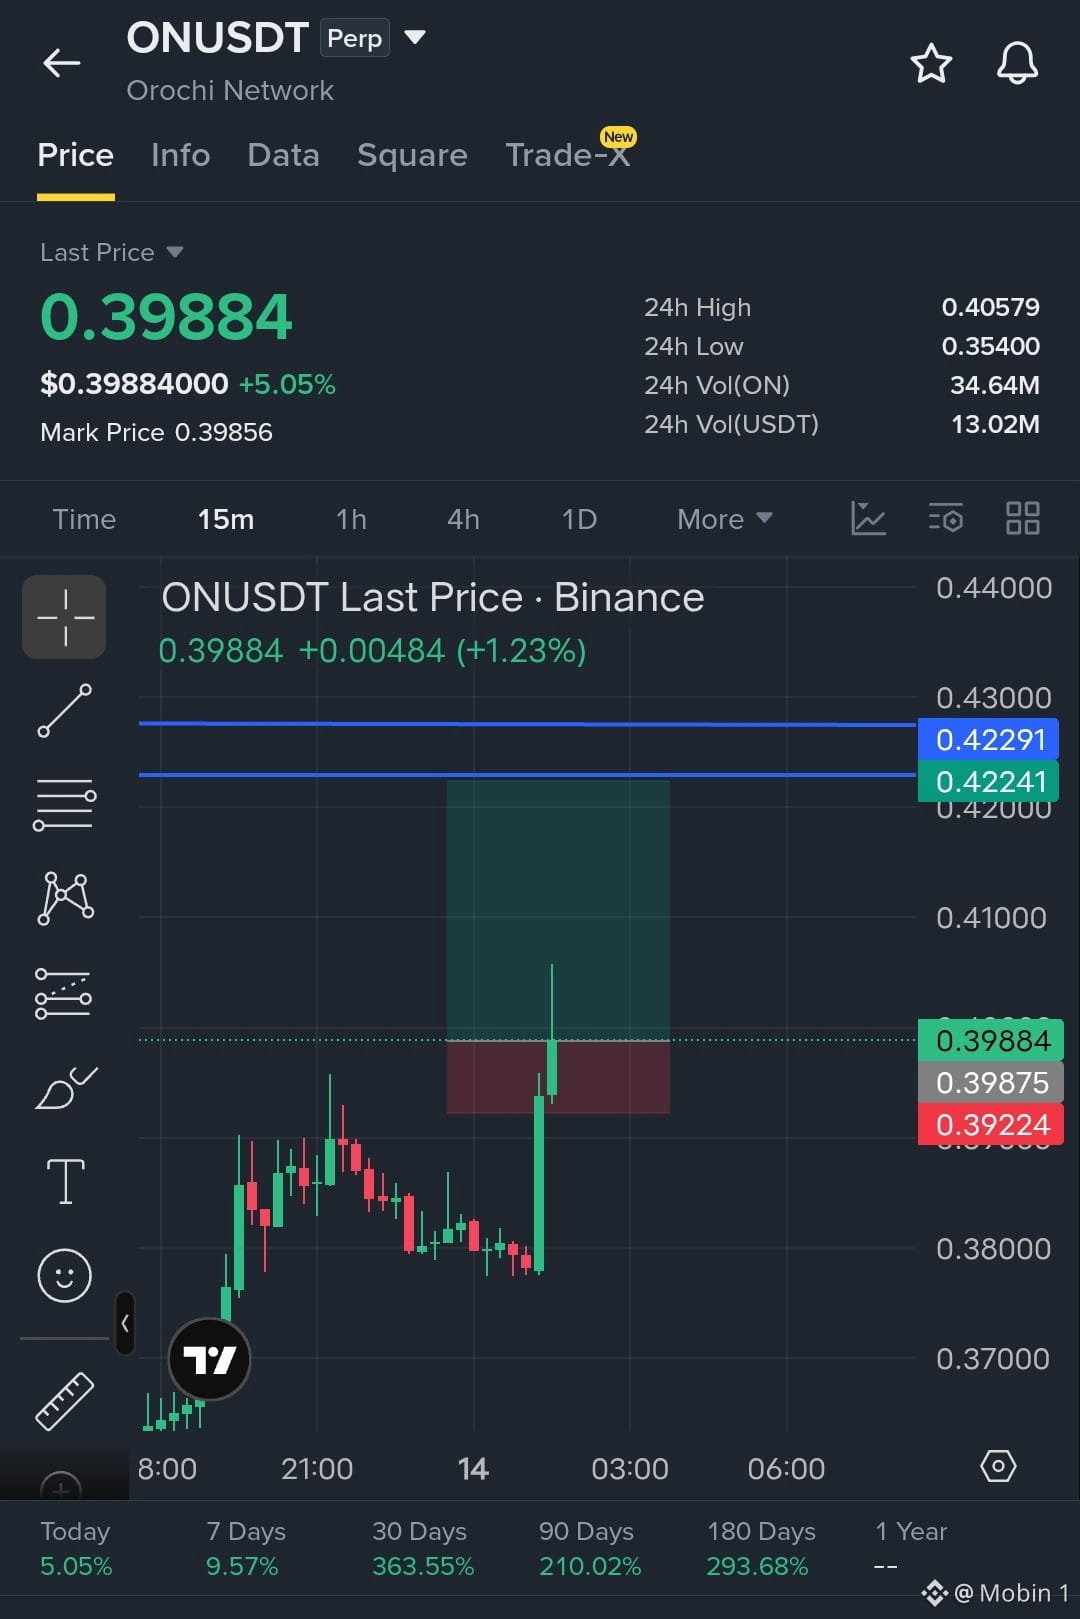
$ON 強気の取引
買いエントリー:
目標: 0.42241
ストップロス: 39224
{future}(ONUSDT)
$ON 強気の取引
買いエントリー:
目標: 0.42241
ストップロス: 39224
買いエントリー:
目標: 0.42241
ストップロス: 39224
1
232
·
--
弱気相場
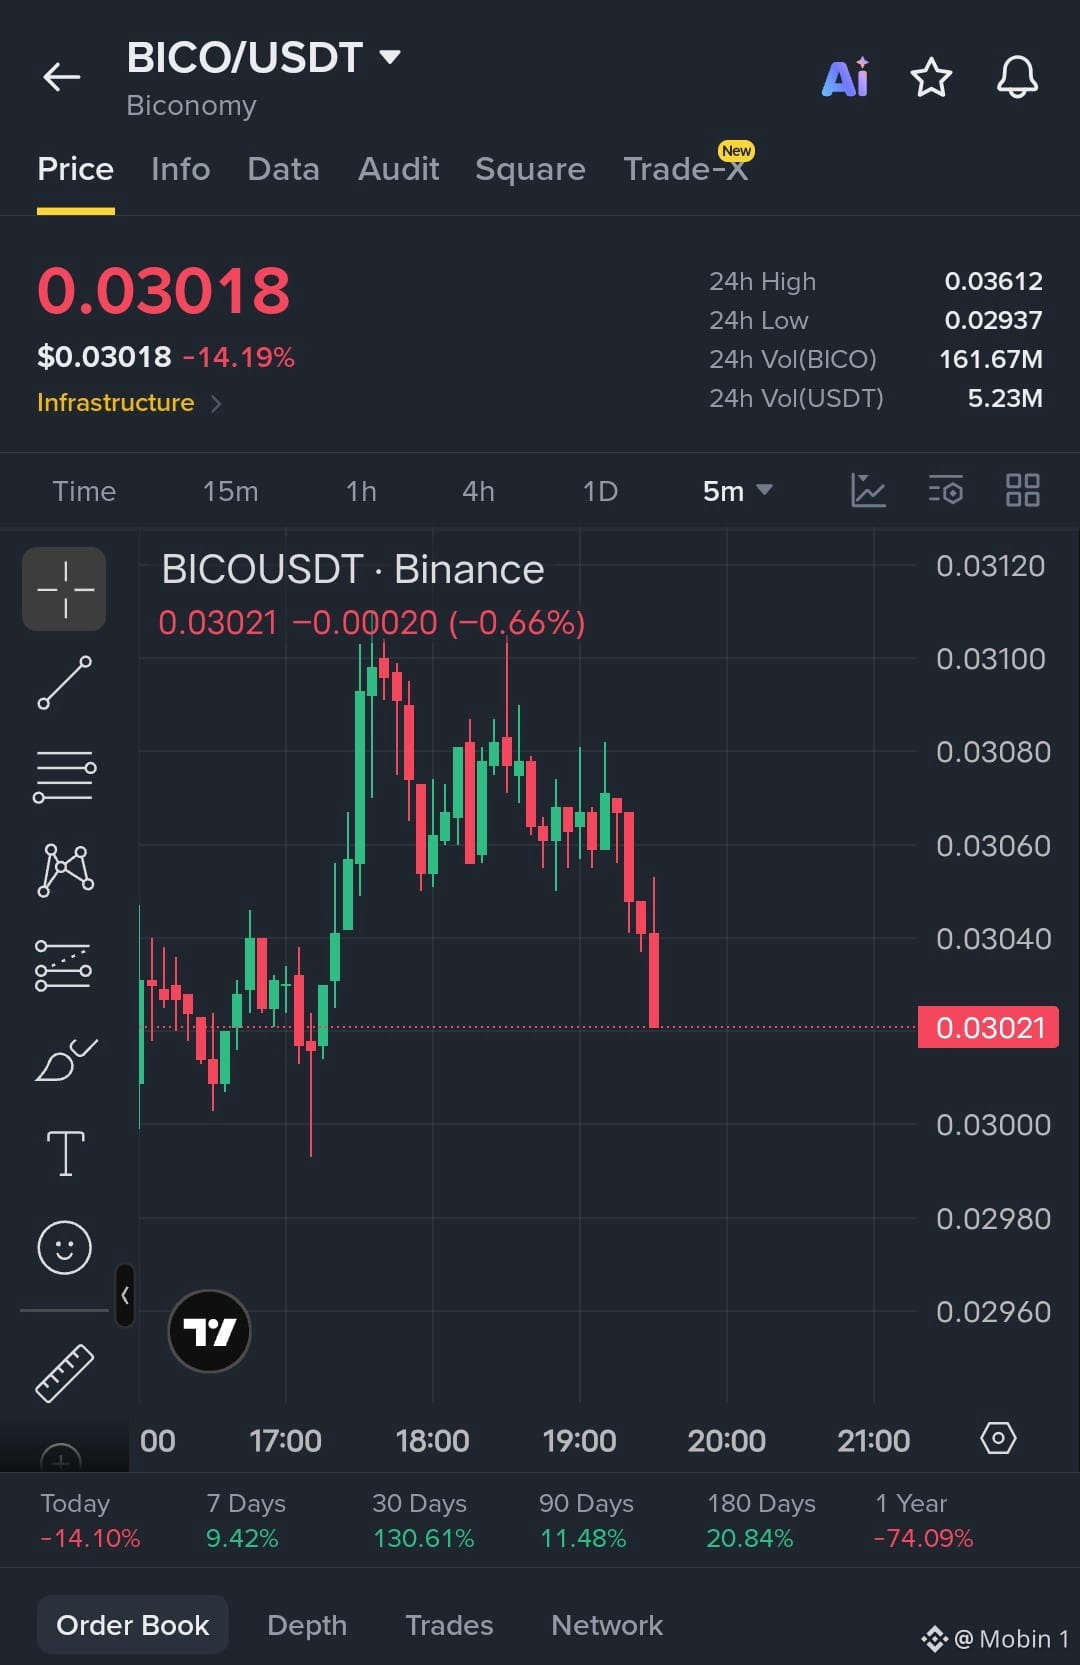
$BICO Strong Selling
この取引をショート
エントリー:0.03040
ターゲット:0.02960
{future}(BICOUSDT)
$BICO Strong Selling
この取引をショート
エントリー:0.03040
ターゲット:0.02960
この取引をショート
エントリー:0.03040
ターゲット:0.02960
81
·
--
ブリッシュ
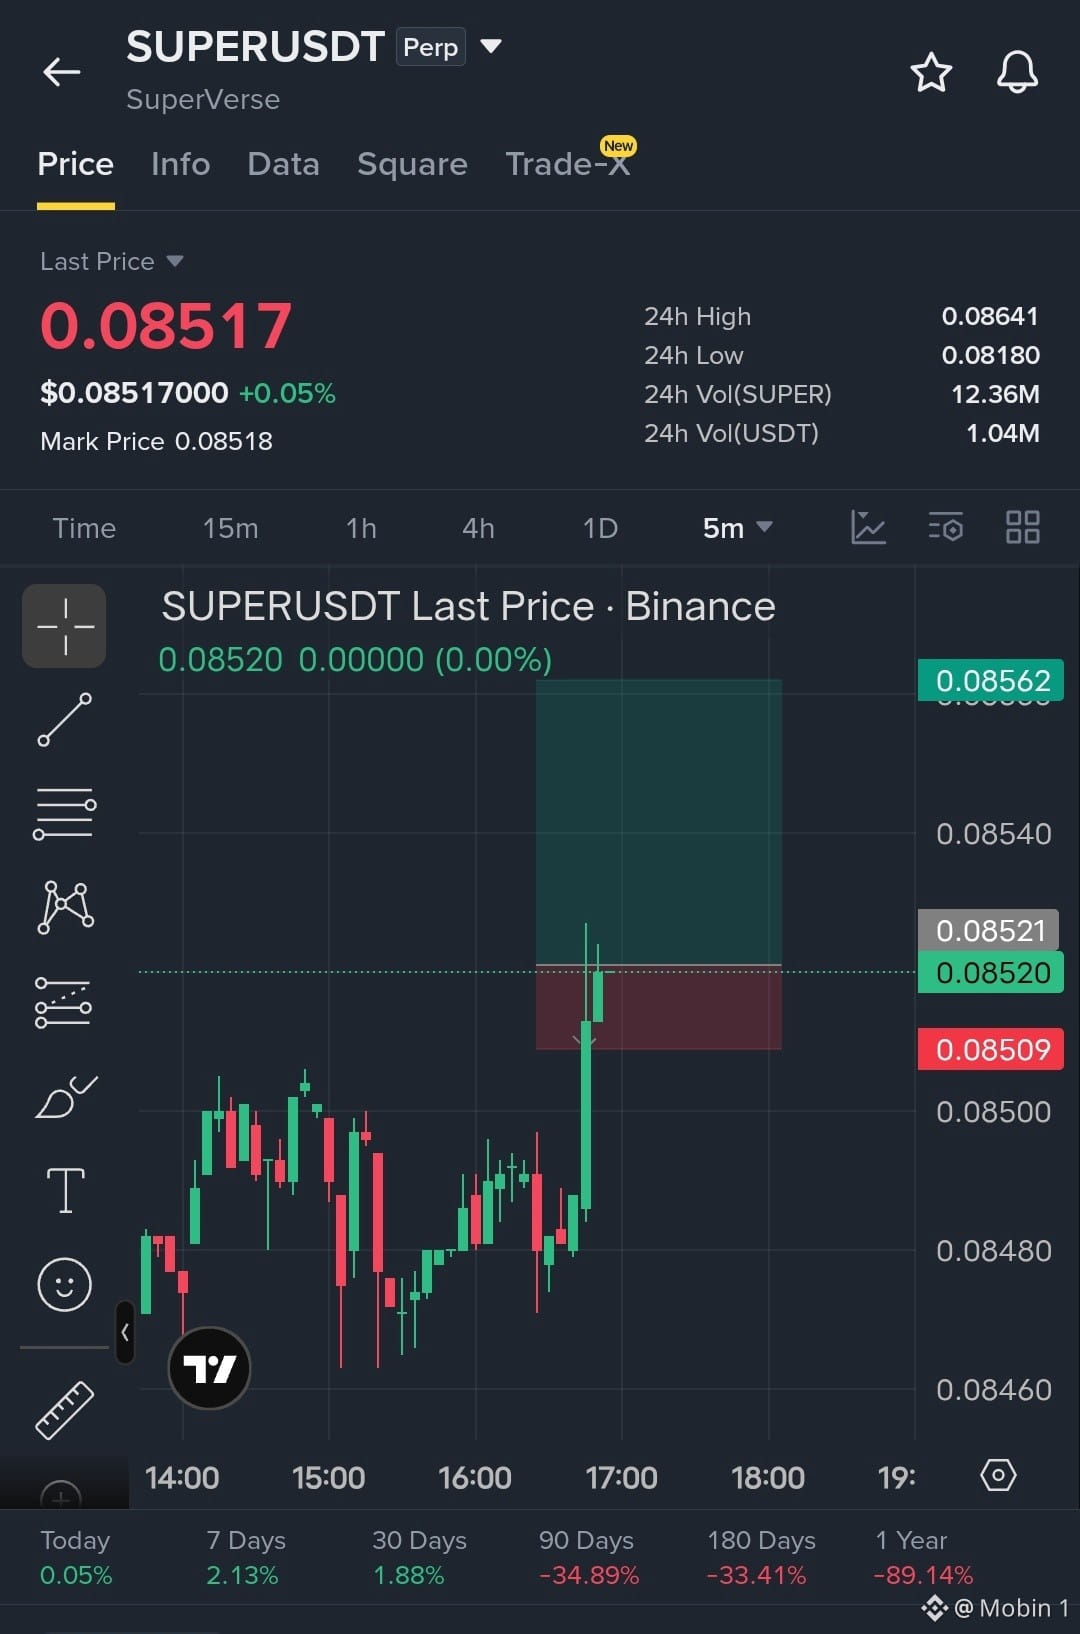
$SUPER 強気シグナルを購入
エントリー:0.08520 - 0.08525
目標:0.08560
目標:0.08570
目標:0.08580
損切り:0.08510
{future}(SUPERUSDT)
$SUPER 強気シグナルを購入
エントリー:0.08520 - 0.08525
目標:0.08560
目標:0.08570
目標:0.08580
損切り:0.08510
エントリー:0.08520 - 0.08525
目標:0.08560
目標:0.08570
目標:0.08580
損切り:0.08510
80
ログインして、さらにコンテンツを読む
厳選トピックで世界の暗号資産トレーダーの仲間入り
⚡️ 暗号資産に関する最新かつ有益な情報が見つかります。
💬 世界最大の暗号資産取引所から信頼されています。
👍 認証を受けたクリエイターから、有益なインサイトを得られます。
メール / 電話番号