
MF Crypto Insights
38 投稿

MF Crypto Insights
報告
ユーザーをブロック
📊 Crypto Market Insights | 📈 Daily Price Updates & Technical Analysis | 🔎 Market Trends & Coin Analysis | 🧠 Research-Based Insights | DYOR
取引を発注
1.2か月
0 フォロー
0 フォロワー
0 いいね
投稿
ポートフォリオ
翻訳参照
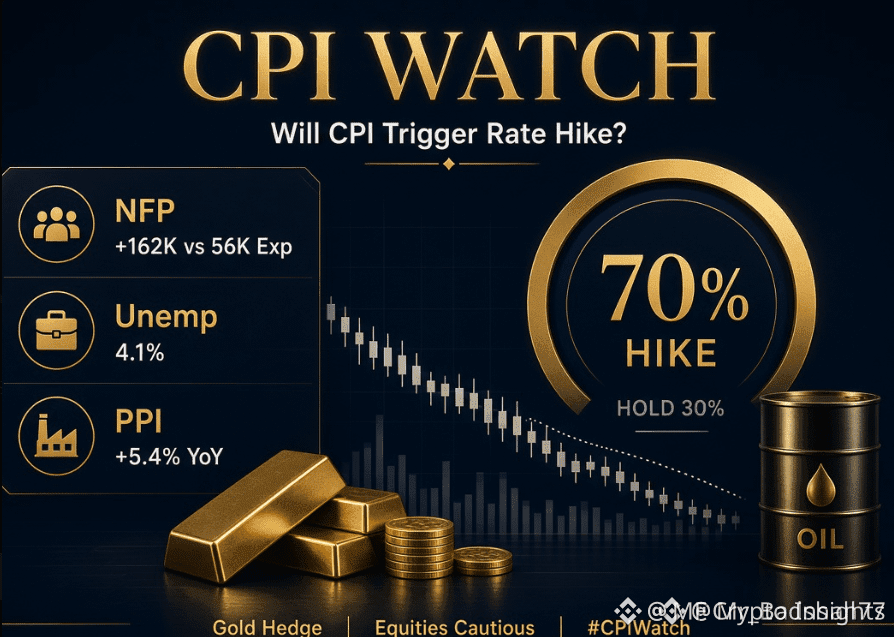
#cpiwatch CPI drops today and this print will decide hike or hold. August nonfarm payrolls came in at 162,000 against expectations of around 56,000. Unemployment stayed at 4.1% and prior months were revised higher. The labor market is not weakening. Yesterday’s PPI added more pressure: +0.4% month-over-month and +5.4% year-over-year, with diesel jumping 24%. Oil is hovering near $100 on supply disruptions. Markets have now priced roughly a 70% chance of a 25 bp hike at the September 15-16 FOMC meeting. Today’s August CPI is the last major data point before that meeting. Consensus is looking for headline +0.4% m/m and 3.4% y/y, with core around +0.2%. Energy will likely lift the headline. The real test is whether core stays contained or starts to broaden.My view is the Fed hikes. Chair Warsh has already said inflation is not moving toward2% at a sufficient speed. A resilient jobs market gives the Committee cover to respond to the energy shock instead of waiting. If core prints 0.3% or hotter, the hike is almost locked in. A cooler core (0.1% or less) could keep a hold on the table, but the bar is now high. I am holding gold as a hedge. A confirmed hike and stronger dollar could pressure gold in the near term around the $4,350–4,380 area, but ongoing inflation and geopolitical risk still support keeping the position rather than chasing the latest move. I am not adding to broad equity indices until we see both the CPI reaction and the Fed statement. Energy-related names look relatively better supported if this impulse continues. Higher-for-longer rates remain a headwind for high-growth valuations.I will decide the next adjustment after today’s number. Follow for the CPI reaction and the updated view after the Fed meeting. #CPIWatch #badshah #CryptoSectorsFallSecondDay $MET T $哈基米 $牛来
#cpiwatch CPI drops today and this print will decide hike or hold. August nonfarm payrolls came in at 162,000 against expectations of around 56,000. Unemployment stayed at 4.1% and prior months were revised higher. The labor market is not weakening. Yesterday’s PPI added more pressure: +0.4% month-over-month and +5.4% year-over-year, with diesel jumping 24%. Oil is hovering near $100 on supply disruptions. Markets have now priced roughly a 70% chance of a 25 bp hike at the September 15-16 FOMC meeting. Today’s August CPI is the last major data point before that meeting. Consensus is looking for headline +0.4% m/m and 3.4% y/y, with core around +0.2%. Energy will likely lift the headline. The real test is whether core stays contained or starts to broaden.My view is the Fed hikes. Chair Warsh has already said inflation is not moving toward2% at a sufficient speed. A resilient jobs market gives the Committee cover to respond to the energy shock instead of waiting. If core prints 0.3% or hotter, the hike is almost locked in. A cooler core (0.1% or less) could keep a hold on the table, but the bar is now high. I am holding gold as a hedge. A confirmed hike and stronger dollar could pressure gold in the near term around the $4,350–4,380 area, but ongoing inflation and geopolitical risk still support keeping the position rather than chasing the latest move. I am not adding to broad equity indices until we see both the CPI reaction and the Fed statement. Energy-related names look relatively better supported if this impulse continues. Higher-for-longer rates remain a headwind for high-growth valuations.I will decide the next adjustment after today’s number. Follow for the CPI reaction and the updated view after the Fed meeting. #CPIWatch #badshah #CryptoSectorsFallSecondDay $MET T $哈基米 $牛来
60
翻訳参照
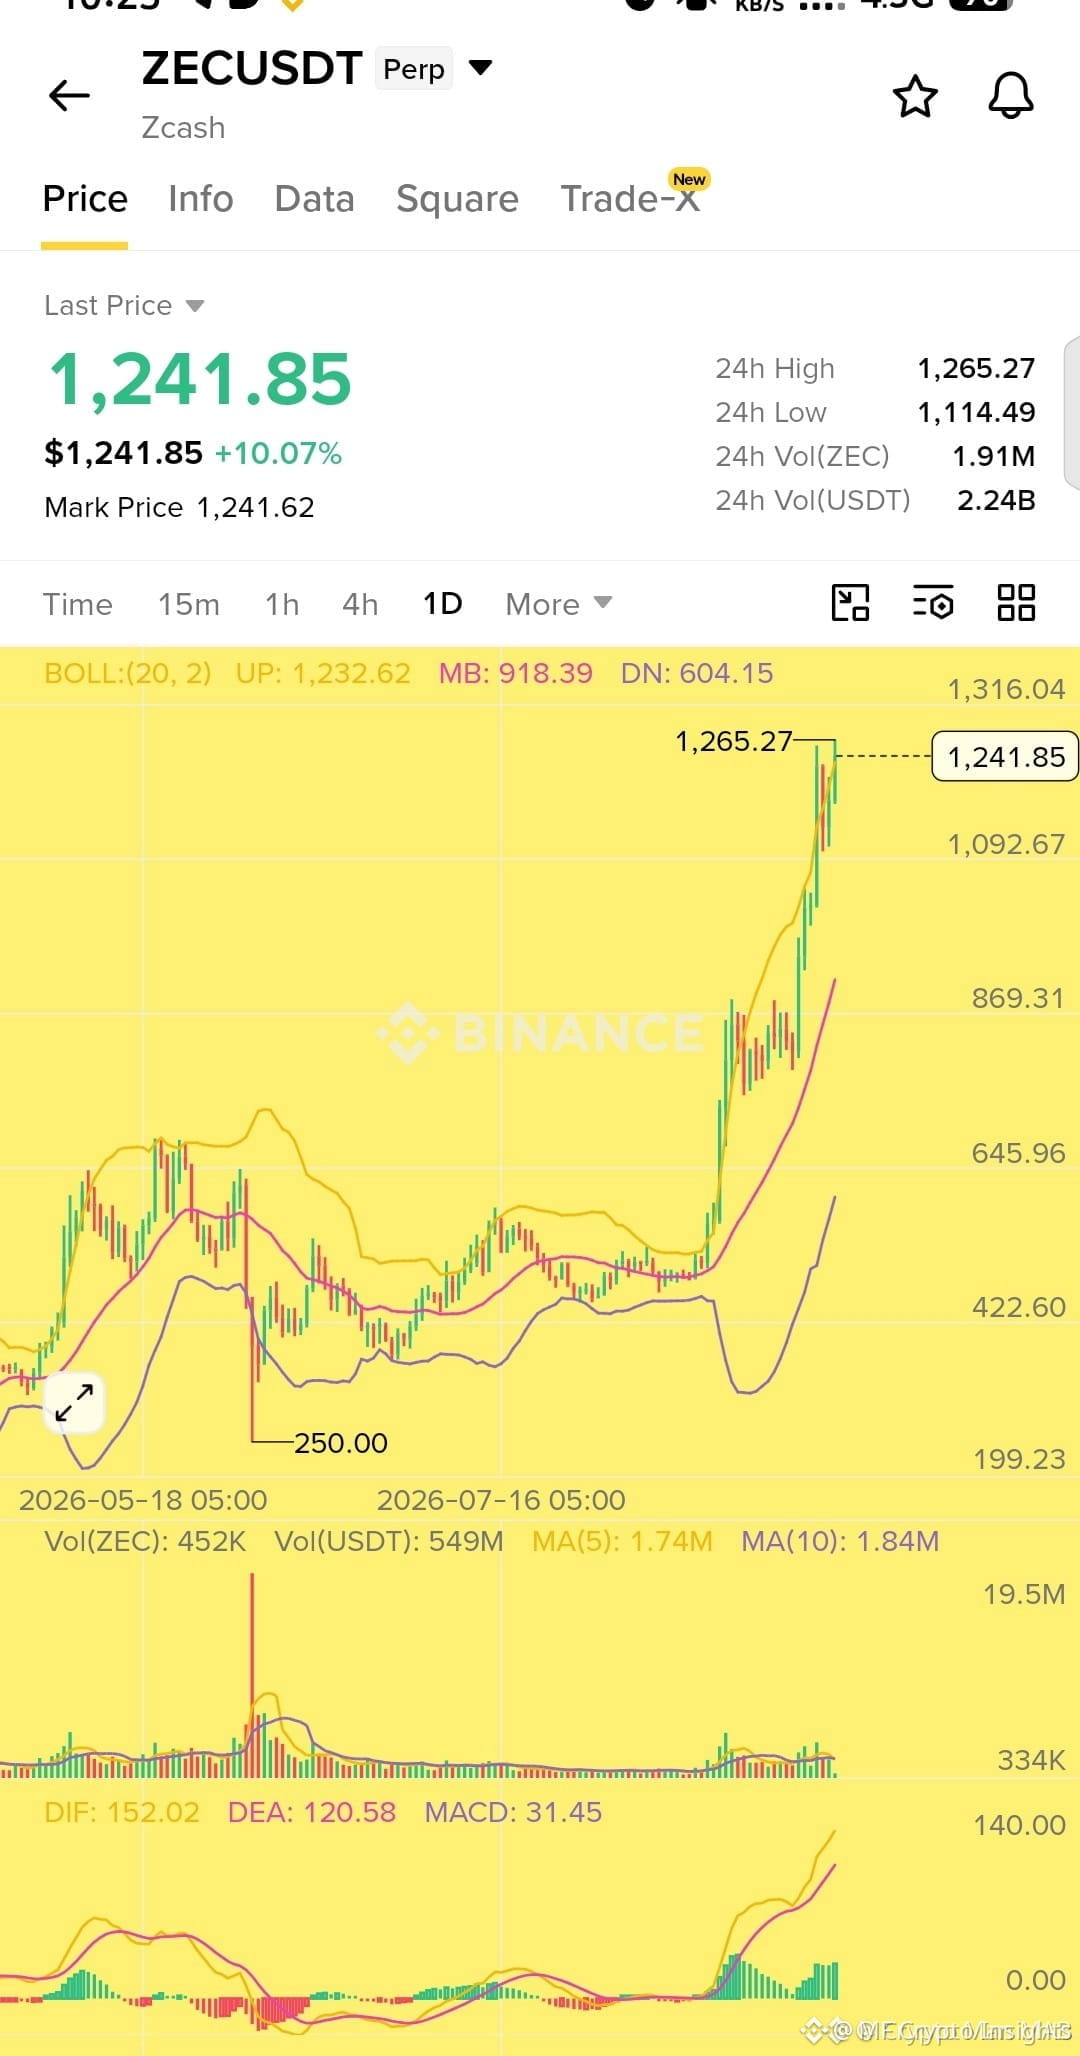
After breaking above $1,200 $ZEC EC is holding near the highs with strong momentum. The move from $1,000 to $1,200 happened quickly, and if this momentum continues, the next leg toward $1,500 and eventually $2,000 could come much faster.
{future}(ZECUSDT)
It’s never too late to catch a strong trend, but risk management is key.
Long Setup
Entry: $1,220 – $1,240
TP1: $1,260
TP2: $1,280
TP3: $1,300
TP4: $1,500
TP5: $2,000
SL: $1,180
Watch the $1,200 area closely. Holding above it keeps the bullish structure intact.
DYOR and manage your risk.
#zec #Zcash
After breaking above $1,200 $ZEC EC is holding near the highs with strong momentum. The move from $1,000 to $1,200 happened quickly, and if this momentum continues, the next leg toward $1,500 and eventually $2,000 could come much faster.
It’s never too late to catch a strong trend, but risk management is key.
Long Setup
Entry: $1,220 – $1,240
TP1: $1,260
TP2: $1,280
TP3: $1,300
TP4: $1,500
TP5: $2,000
SL: $1,180
Watch the $1,200 area closely. Holding above it keeps the bullish structure intact.
DYOR and manage your risk.
#zec #Zcash
It’s never too late to catch a strong trend, but risk management is key.
Long Setup
Entry: $1,220 – $1,240
TP1: $1,260
TP2: $1,280
TP3: $1,300
TP4: $1,500
TP5: $2,000
SL: $1,180
Watch the $1,200 area closely. Holding above it keeps the bullish structure intact.
DYOR and manage your risk.
#zec #Zcash
46
翻訳参照
Me patiently waiting for:
$ZEC to $2,500 😁
$DASH to $200 🤑
$ARB to$1 🔥
You may laugh about those prices but... we all can't ignore the fact that, Zcash is currently above $1220 with +20% in last 24h... went from $800 to $1200+ in just 2 days.And DASH currently at $71 went from $45 to $78 in just 24 hours 😁
So if you have been one watching from the side lines and still waiting for confirmation...
There is still time to ACCUMULATE more DASH and ZEC..
I am going to BUY more, because i don't want to miss DASH just like i missed ZEC earlier 💪🏻
🎯 My LONG TERM TARGET : DASH $95+
🎯 ZEC Target : $1,500+
Zcash has ETF from Grayscale, and DASH has the Privacy narrative and the money rotation into privacy coins, DASH will definitely gain traction
{spot}(ZECUSDT)
{spot}(DASHUSDT)
{future}(ARBUSDT)
#ZEC'sMarketCapSurpassedDOGE
#ZECHitsANewAllTimeHigh
#USAugustJobGrowthNearlyTriplesForecast
Not financial advice, Do your own research .
Me patiently waiting for:
$ZEC to $2,500 😁
$DASH to $200 🤑
$ARB to$1 🔥
You may laugh about those prices but... we all can't ignore the fact that, Zcash is currently above $1220 with +20% in last 24h... went from $800 to $1200+ in just 2 days.And DASH currently at $71 went from $45 to $78 in just 24 hours 😁
So if you have been one watching from the side lines and still waiting for confirmation...
There is still time to ACCUMULATE more DASH and ZEC..
I am going to BUY more, because i don't want to miss DASH just like i missed ZEC earlier 💪🏻
🎯 My LONG TERM TARGET : DASH $95+
🎯 ZEC Target : $1,500+
Zcash has ETF from Grayscale, and DASH has the Privacy narrative and the money rotation into privacy coins, DASH will definitely gain traction
#ZEC'sMarketCapSurpassedDOGE
#ZECHitsANewAllTimeHigh
#USAugustJobGrowthNearlyTriplesForecast
Not financial advice, Do your own research .
$ZEC to $2,500 😁
$DASH to $200 🤑
$ARB to$1 🔥
You may laugh about those prices but... we all can't ignore the fact that, Zcash is currently above $1220 with +20% in last 24h... went from $800 to $1200+ in just 2 days.And DASH currently at $71 went from $45 to $78 in just 24 hours 😁
So if you have been one watching from the side lines and still waiting for confirmation...
There is still time to ACCUMULATE more DASH and ZEC..
I am going to BUY more, because i don't want to miss DASH just like i missed ZEC earlier 💪🏻
🎯 My LONG TERM TARGET : DASH $95+
🎯 ZEC Target : $1,500+
Zcash has ETF from Grayscale, and DASH has the Privacy narrative and the money rotation into privacy coins, DASH will definitely gain traction
#ZEC'sMarketCapSurpassedDOGE
#ZECHitsANewAllTimeHigh
#USAugustJobGrowthNearlyTriplesForecast
Not financial advice, Do your own research .
87
翻訳参照
🌟 206K ISN'T THE STORY — WHAT COMES NEXT IS
Initial jobless claims increased to 206,000, up 2,000 from the previous week's revised figure. The four-week average also moved higher to 207,250.
The labor market hasn't suddenly broken down, but traders are increasingly focused on whether future reports confirm a meaningful cooling trend.
For traders, the key is simple:
Don't make a major decision from one data point.
Track the trend, watch market reaction, and let $BTC , $ETH and $BNB confirm the sentiment.
#usweeklyinitialjoblessclaimsriseto206000
🌟 206K ISN'T THE STORY — WHAT COMES NEXT IS
Initial jobless claims increased to 206,000, up 2,000 from the previous week's revised figure. The four-week average also moved higher to 207,250.
The labor market hasn't suddenly broken down, but traders are increasingly focused on whether future reports confirm a meaningful cooling trend.
For traders, the key is simple:
Don't make a major decision from one data point.
Track the trend, watch market reaction, and let $BTC , $ETH and $BNB confirm the sentiment.
#usweeklyinitialjoblessclaimsriseto206000
Initial jobless claims increased to 206,000, up 2,000 from the previous week's revised figure. The four-week average also moved higher to 207,250.
The labor market hasn't suddenly broken down, but traders are increasingly focused on whether future reports confirm a meaningful cooling trend.
For traders, the key is simple:
Don't make a major decision from one data point.
Track the trend, watch market reaction, and let $BTC , $ETH and $BNB confirm the sentiment.
#usweeklyinitialjoblessclaimsriseto206000
70
記事
ビットコイン(BTC)価格分析:$82,793ブレイクアウトか、それとももう一度の押し戻しか?
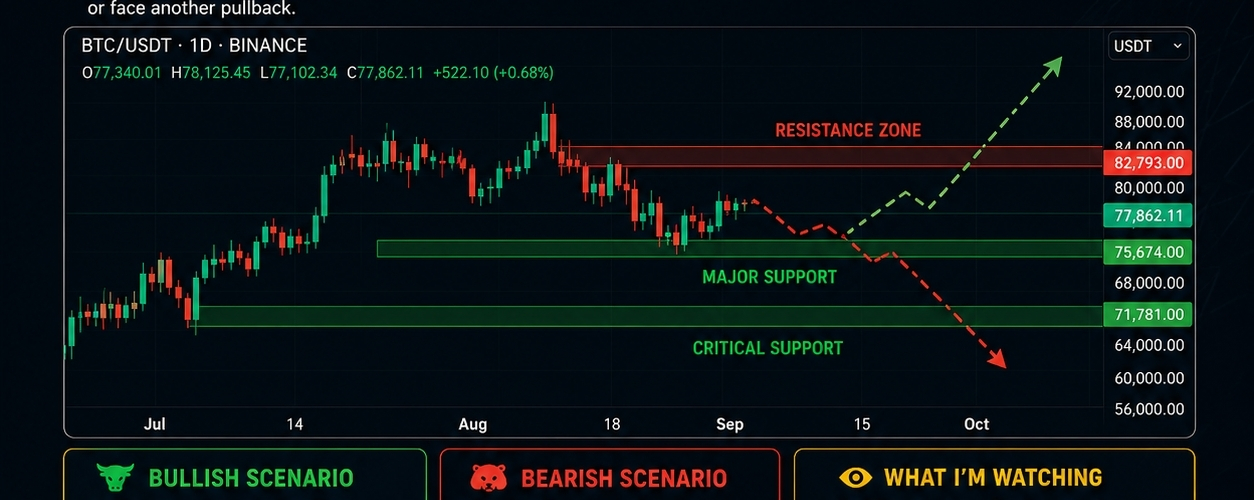
ビットコインは、最近の力強い上昇の後、$77K〜$78K付近で取引されています。市場は現在、重要な判断ゾーンに近づいており、トレーダーは #BTC走势分析 が強気の勢いを継続できるのか、あるいはもう一度押し戻されるのかを見ています。
📊 注目すべき主要BTCレベル
レジスタンス:$82,793
主要サポート:$75,674
重要なサポート:$71,781
$82,793を上回る継続的な動きは、強気の構造を強化し、$90,000の領域へ向かう道を開く可能性があります。
一方で、ビットコインが$75,674を失い、特に$71,781を割り込む場合、強気の勢いは弱まり、市場は別の調整局面に入るかもしれません。
ビットコイン(BTC)価格分析:$82,793
ブレイクアウトか、それとももう一度の押し戻しか?
ビットコインは、最近の力強い上昇の後、$77K〜$78K付近で取引されています。市場は現在、重要な判断ゾーンに近づいており、トレーダーは #BTC走势分析 が強気の勢いを継続できるのか、あるいはもう一度押し戻されるのかを見ています。
📊 注目すべき主要BTCレベル
レジスタンス:$82,793
主要サポート:$75,674
重要なサポート:$71,781
$82,793を上回る継続的な動きは、強気の構造を強化し、$90,000の領域へ向かう道を開く可能性があります。
一方で、ビットコインが$75,674を失い、特に$71,781を割り込む場合、強気の勢いは弱まり、市場は別の調整局面に入るかもしれません。
ビットコインは、最近の力強い上昇の後、$77K〜$78K付近で取引されています。市場は現在、重要な判断ゾーンに近づいており、トレーダーは #BTC走势分析 が強気の勢いを継続できるのか、あるいはもう一度押し戻されるのかを見ています。
📊 注目すべき主要BTCレベル
レジスタンス:$82,793
主要サポート:$75,674
重要なサポート:$71,781
$82,793を上回る継続的な動きは、強気の構造を強化し、$90,000の領域へ向かう道を開く可能性があります。
一方で、ビットコインが$75,674を失い、特に$71,781を割り込む場合、強気の勢いは弱まり、市場は別の調整局面に入るかもしれません。
54
#SolanaFallsOver3% ソラナが崩れ落ちてから3%
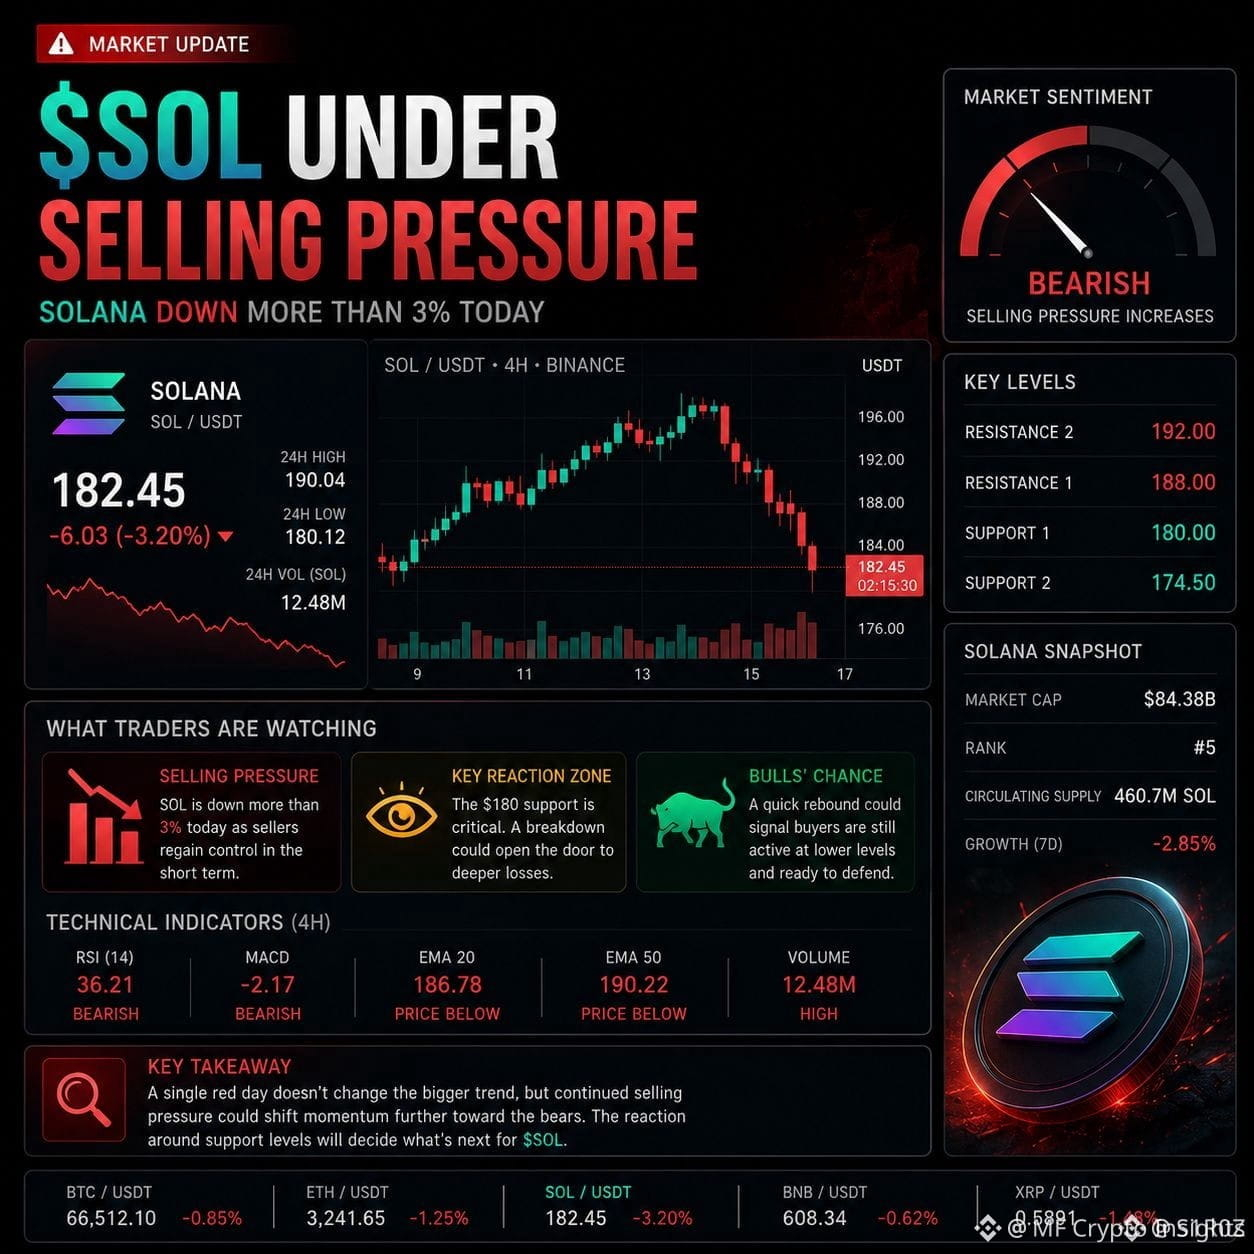
🚨 $SOL は再び売り圧力に直面しており、本日3%以上下落しています。
この動きにより、短期トレーダーは警戒モードに。直近の下落の後、ソラナは安定化する方法を探しているところです。
1日赤で終わっただけでは、より大きなトレンドが自動的に変わったとは限りません。ですが売り圧力がさらに高まり続けるなら、モメンタムがより弱気(ベア)側へ移る可能性があります。
一方で、素早い反発が見られれば、買い手が下値圏でまだ買いに入る意思があることを示唆します。
👀 今重要なのは反応です:$SOL は勢いを取り戻せるのか、それとも売り手が押し目をさらに深く押し下げるのか?
{spot}(SOLUSDT)
#sol #BinanceSquare #crypto
#SolanaFallsOver3% ソラナが崩れ落ちてから3%
🚨 $SOL は再び売り圧力に直面しており、本日3%以上下落しています。
この動きにより、短期トレーダーは警戒モードに。直近の下落の後、ソラナは安定化する方法を探しているところです。
1日赤で終わっただけでは、より大きなトレンドが自動的に変わったとは限りません。ですが売り圧力がさらに高まり続けるなら、モメンタムがより弱気(ベア)側へ移る可能性があります。
一方で、素早い反発が見られれば、買い手が下値圏でまだ買いに入る意思があることを示唆します。
👀 今重要なのは反応です:$SOL は勢いを取り戻せるのか、それとも売り手が押し目をさらに深く押し下げるのか?
#sol #BinanceSquare #crypto
🚨 $SOL は再び売り圧力に直面しており、本日3%以上下落しています。
この動きにより、短期トレーダーは警戒モードに。直近の下落の後、ソラナは安定化する方法を探しているところです。
1日赤で終わっただけでは、より大きなトレンドが自動的に変わったとは限りません。ですが売り圧力がさらに高まり続けるなら、モメンタムがより弱気(ベア)側へ移る可能性があります。
一方で、素早い反発が見られれば、買い手が下値圏でまだ買いに入る意思があることを示唆します。
👀 今重要なのは反応です:$SOL は勢いを取り戻せるのか、それとも売り手が押し目をさらに深く押し下げるのか?
#sol #BinanceSquare #crypto
69
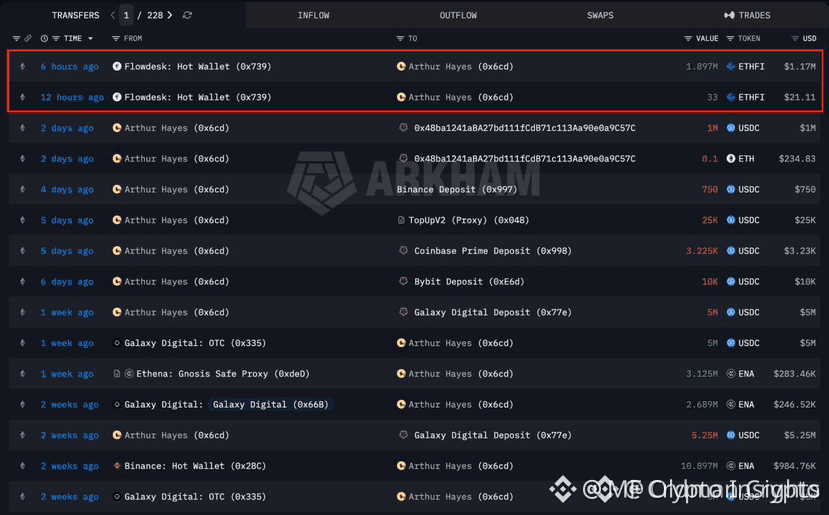
アーサー・ヘイズが#ETHFI iをまた買い戻しています。しかも小さな動きではありません。📊
このウォレットの実績:👇
4か月前:0.44ドルで265,461 $ETHFI ($118K)を購入。損切りに遭い、損失を確定させました。
現在:同じウォレットで、0.163ドルで1.897M $ETHFI ($1.17M)を積み上げ中。これは、63%安い価格での出来高が7倍です。
クジラが損失を出したあと、数か月後に同じコインへ戻ってきて、確信度は7倍、エントリー価格ははるかに良い——それは絶望的な損失平均ではなく、意図的なポジション調整です。
ヘイズはすべての取引で当てる必要はありません。でも、より高い価格でいったん損失を出した後に同じ銘柄を買い直し、より低い価格でこれだけ多くの資金を持ち帰ってきているなら、「テーゼ(見立て)が悪化した」ではなく「良くなった」と言っているのと同じです。
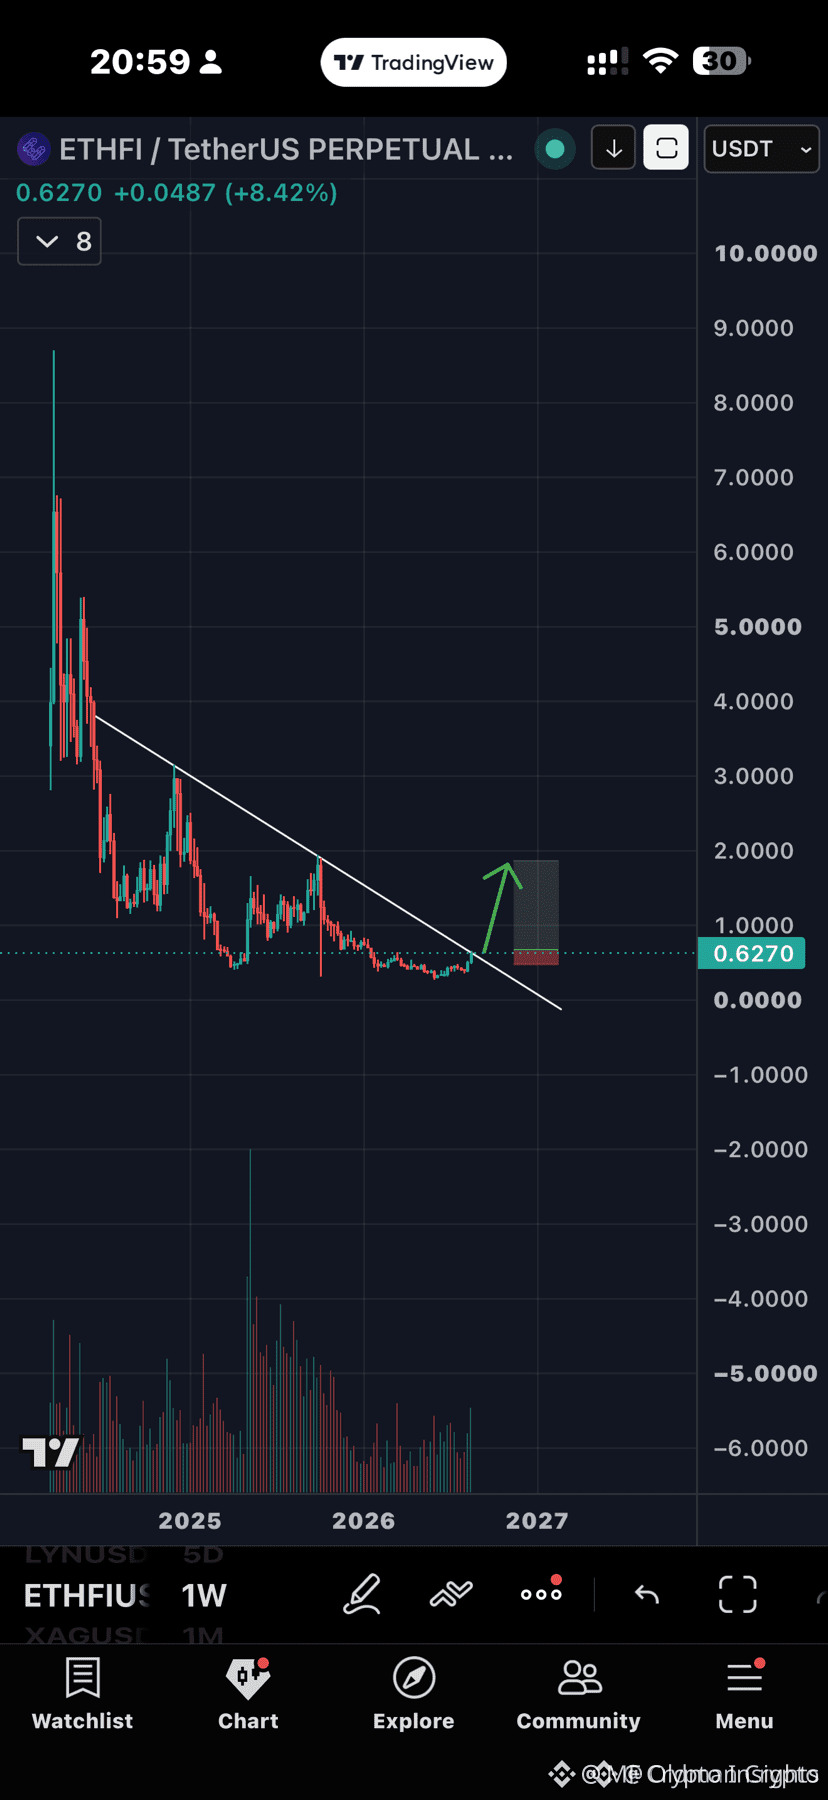
さらに、チャート上でいま見せている2年トレンドラインのブレイクアウトの仕掛け$ETHFI Iもあわせると、このクジラの動きは独立して起きているわけではありません。🎯
ETHFIUSDT
#crypto #ETHFİ
{future}(ETHFIUSDT)
アーサー・ヘイズが#ETHFI iをまた買い戻しています。しかも小さな動きではありません。📊
このウォレットの実績:👇
4か月前:0.44ドルで265,461 $ETHFI ($118K)を購入。損切りに遭い、損失を確定させました。
現在:同じウォレットで、0.163ドルで1.897M $ETHFI ($1.17M)を積み上げ中。これは、63%安い価格での出来高が7倍です。
クジラが損失を出したあと、数か月後に同じコインへ戻ってきて、確信度は7倍、エントリー価格ははるかに良い——それは絶望的な損失平均ではなく、意図的なポジション調整です。
ヘイズはすべての取引で当てる必要はありません。でも、より高い価格でいったん損失を出した後に同じ銘柄を買い直し、より低い価格でこれだけ多くの資金を持ち帰ってきているなら、「テーゼ(見立て)が悪化した」ではなく「良くなった」と言っているのと同じです。
さらに、チャート上でいま見せている2年トレンドラインのブレイクアウトの仕掛け$ETHFI Iもあわせると、このクジラの動きは独立して起きているわけではありません。🎯
ETHFIUSDT
#crypto #ETHFİ
このウォレットの実績:👇
4か月前:0.44ドルで265,461 $ETHFI ($118K)を購入。損切りに遭い、損失を確定させました。
現在:同じウォレットで、0.163ドルで1.897M $ETHFI ($1.17M)を積み上げ中。これは、63%安い価格での出来高が7倍です。
クジラが損失を出したあと、数か月後に同じコインへ戻ってきて、確信度は7倍、エントリー価格ははるかに良い——それは絶望的な損失平均ではなく、意図的なポジション調整です。
ヘイズはすべての取引で当てる必要はありません。でも、より高い価格でいったん損失を出した後に同じ銘柄を買い直し、より低い価格でこれだけ多くの資金を持ち帰ってきているなら、「テーゼ(見立て)が悪化した」ではなく「良くなった」と言っているのと同じです。
さらに、チャート上でいま見せている2年トレンドラインのブレイクアウトの仕掛け$ETHFI Iもあわせると、このクジラの動きは独立して起きているわけではありません。🎯
ETHFIUSDT
#crypto #ETHFİ
68
#BitcoinStrongestWeekSinceMarch2023 bitcoinstrongestweeksincemarch2026
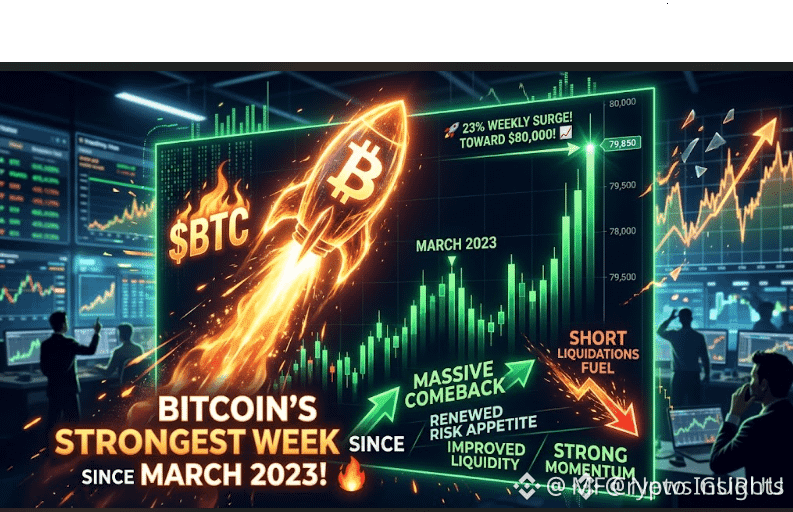
🚨 2023年3月以来のビットコイン最強の週が到来! 🔥
$BTC Cはわずか1週間で約23%急騰し、8万ドルの水準に迫り、2023年3月以来の最強の週次パフォーマンスを記録しました。 📈
リスク選好の再燃、流動性見通しの改善、そしてショートの清算(ショートリキディーション)が上昇を後押ししています。モメンタムは依然として強いものの、トレーダーはBTCがブレイク後の水準を維持できるか注視すべきです。
🎯 トレーディングビュー:買い 📈
BTCが重要なサポート以上を維持している限り、強気の流れが優勢です。
❓ 次はBTCが8万ドルを上抜けできるのでしょうか? "下の黄色いコインのタグをクリックして、希望する取引ページへ移動し、利益を得るために"$BTC
BTC
#BTC #cryptouniverseofficial
{spot}(BTCUSDT)
#BitcoinStrongestWeekSinceMarch2023 bitcoinstrongestweeksincemarch2026
🚨 2023年3月以来のビットコイン最強の週が到来! 🔥
$BTC Cはわずか1週間で約23%急騰し、8万ドルの水準に迫り、2023年3月以来の最強の週次パフォーマンスを記録しました。 📈
リスク選好の再燃、流動性見通しの改善、そしてショートの清算(ショートリキディーション)が上昇を後押ししています。モメンタムは依然として強いものの、トレーダーはBTCがブレイク後の水準を維持できるか注視すべきです。
🎯 トレーディングビュー:買い 📈
BTCが重要なサポート以上を維持している限り、強気の流れが優勢です。
❓ 次はBTCが8万ドルを上抜けできるのでしょうか? "下の黄色いコインのタグをクリックして、希望する取引ページへ移動し、利益を得るために"$BTC
BTC
#BTC #cryptouniverseofficial
🚨 2023年3月以来のビットコイン最強の週が到来! 🔥
$BTC Cはわずか1週間で約23%急騰し、8万ドルの水準に迫り、2023年3月以来の最強の週次パフォーマンスを記録しました。 📈
リスク選好の再燃、流動性見通しの改善、そしてショートの清算(ショートリキディーション)が上昇を後押ししています。モメンタムは依然として強いものの、トレーダーはBTCがブレイク後の水準を維持できるか注視すべきです。
🎯 トレーディングビュー:買い 📈
BTCが重要なサポート以上を維持している限り、強気の流れが優勢です。
❓ 次はBTCが8万ドルを上抜けできるのでしょうか? "下の黄色いコインのタグをクリックして、希望する取引ページへ移動し、利益を得るために"$BTC
BTC
#BTC #cryptouniverseofficial
74
🚨 $TRUMP /USDT: 約100%急騰 — 次に何が起きる?
公式トランプ(TRUMP)が、短期で大きな値動きを見せました。🔥
バイナンスのチャートによると、TRUMPはおよそ$1.74から$3.44まで急騰した後、$3.20〜$3.25のあたりへ押し戻されています。
このような縦の動きは、チャンスとリスクの両方を生みます。
📊 注目すべき主要レベル
🔴 レジスタンス:$3.44
🟡 直近のゾーン:$3.20〜$3.25
🟢 サポート:$2.75〜$2.80
🟢 主要サポート:$2.55〜$2.60
⚠️ さらに深いサポート:$2.00〜$2.05
🚀 強気シナリオ
TRUMPが強い出来高を伴って$3.44をブレイクし、さらにその上で維持できれば、次の心理的な節目は以下の可能性があります:
$3.60 → $3.80 → $4.00
確定したブレイクは、いまの急騰を追いかけるだけよりもはるかに強いシグナルになります。
🔻 調整シナリオ
これほど攻めたラリーの後は、利確によって急な押し戻しが起きることがあります。
$3.20が維持できない場合、トレーダーは$2.80と$2.60のあたりでサポートが形成されるかを注視すべきです。
🎯 私の見解
短期トレンド:強気(BULLISH)🟢
モメンタム:非常に強い(VERY STRONG)🔥
リスク:極めて高い(EXTREMELY HIGH)⚠️
今の重要な問いは「TRUMPはどこまで上がるのか?」ではなく、こんな強力な値動きの後に買い手が勢いを維持できるかどうかです。
FOMOしないでください。レベル、出来高、そして確認(コンファーム)を見ましょう。📊
みなさんはどう思いますか — まずTRUMPは$4へ行く?それとも大きな押し戻しが先?👇
#TRUMP
{future}(TRUMPUSDT)
#trumpusdt #crypto #Binance
🚨 $TRUMP /USDT: 約100%急騰 — 次に何が起きる?
公式トランプ(TRUMP)が、短期で大きな値動きを見せました。🔥
バイナンスのチャートによると、TRUMPはおよそ$1.74から$3.44まで急騰した後、$3.20〜$3.25のあたりへ押し戻されています。
このような縦の動きは、チャンスとリスクの両方を生みます。
📊 注目すべき主要レベル
🔴 レジスタンス:$3.44
🟡 直近のゾーン:$3.20〜$3.25
🟢 サポート:$2.75〜$2.80
🟢 主要サポート:$2.55〜$2.60
⚠️ さらに深いサポート:$2.00〜$2.05
🚀 強気シナリオ
TRUMPが強い出来高を伴って$3.44をブレイクし、さらにその上で維持できれば、次の心理的な節目は以下の可能性があります:
$3.60 → $3.80 → $4.00
確定したブレイクは、いまの急騰を追いかけるだけよりもはるかに強いシグナルになります。
🔻 調整シナリオ
これほど攻めたラリーの後は、利確によって急な押し戻しが起きることがあります。
$3.20が維持できない場合、トレーダーは$2.80と$2.60のあたりでサポートが形成されるかを注視すべきです。
🎯 私の見解
短期トレンド:強気(BULLISH)🟢
モメンタム:非常に強い(VERY STRONG)🔥
リスク:極めて高い(EXTREMELY HIGH)⚠️
今の重要な問いは「TRUMPはどこまで上がるのか?」ではなく、こんな強力な値動きの後に買い手が勢いを維持できるかどうかです。
FOMOしないでください。レベル、出来高、そして確認(コンファーム)を見ましょう。📊
みなさんはどう思いますか — まずTRUMPは$4へ行く?それとも大きな押し戻しが先?👇
#TRUMP
#trumpusdt #crypto #Binance
公式トランプ(TRUMP)が、短期で大きな値動きを見せました。🔥
バイナンスのチャートによると、TRUMPはおよそ$1.74から$3.44まで急騰した後、$3.20〜$3.25のあたりへ押し戻されています。
このような縦の動きは、チャンスとリスクの両方を生みます。
📊 注目すべき主要レベル
🔴 レジスタンス:$3.44
🟡 直近のゾーン:$3.20〜$3.25
🟢 サポート:$2.75〜$2.80
🟢 主要サポート:$2.55〜$2.60
⚠️ さらに深いサポート:$2.00〜$2.05
🚀 強気シナリオ
TRUMPが強い出来高を伴って$3.44をブレイクし、さらにその上で維持できれば、次の心理的な節目は以下の可能性があります:
$3.60 → $3.80 → $4.00
確定したブレイクは、いまの急騰を追いかけるだけよりもはるかに強いシグナルになります。
🔻 調整シナリオ
これほど攻めたラリーの後は、利確によって急な押し戻しが起きることがあります。
$3.20が維持できない場合、トレーダーは$2.80と$2.60のあたりでサポートが形成されるかを注視すべきです。
🎯 私の見解
短期トレンド:強気(BULLISH)🟢
モメンタム:非常に強い(VERY STRONG)🔥
リスク:極めて高い(EXTREMELY HIGH)⚠️
今の重要な問いは「TRUMPはどこまで上がるのか?」ではなく、こんな強力な値動きの後に買い手が勢いを維持できるかどうかです。
FOMOしないでください。レベル、出来高、そして確認(コンファーム)を見ましょう。📊
みなさんはどう思いますか — まずTRUMPは$4へ行く?それとも大きな押し戻しが先?👇
#TRUMP
#trumpusdt #crypto #Binance

122
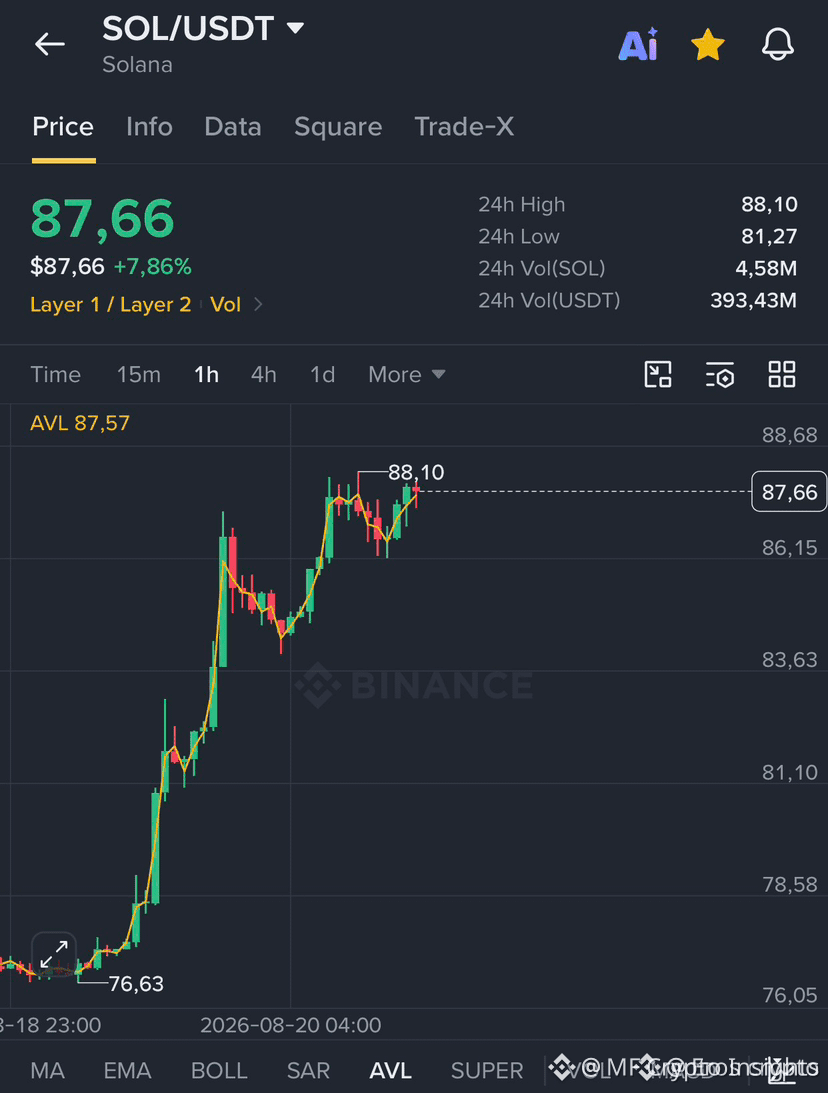
PumpFunはさらに143,524 $SOL Lを販売し、約1,252万ドル相当です。
これまでにPumpFunは合計4,977,989 SOLを販売しており、約8億2,055万ドル相当で、1 SOLあたり平均164.80ドルです。
つまり、これらの人たちがSOLの爆発を食い止めていたということです
#crypto
#binanacesquarenews #Binanace
{spot}(SOLUSDT)
PumpFunはさらに143,524 $SOL Lを販売し、約1,252万ドル相当です。
これまでにPumpFunは合計4,977,989 SOLを販売しており、約8億2,055万ドル相当で、1 SOLあたり平均164.80ドルです。
つまり、これらの人たちがSOLの爆発を食い止めていたということです
#crypto
#binanacesquarenews #Binanace
これまでにPumpFunは合計4,977,989 SOLを販売しており、約8億2,055万ドル相当で、1 SOLあたり平均164.80ドルです。
つまり、これらの人たちがSOLの爆発を食い止めていたということです
#crypto
#binanacesquarenews #Binanace
56
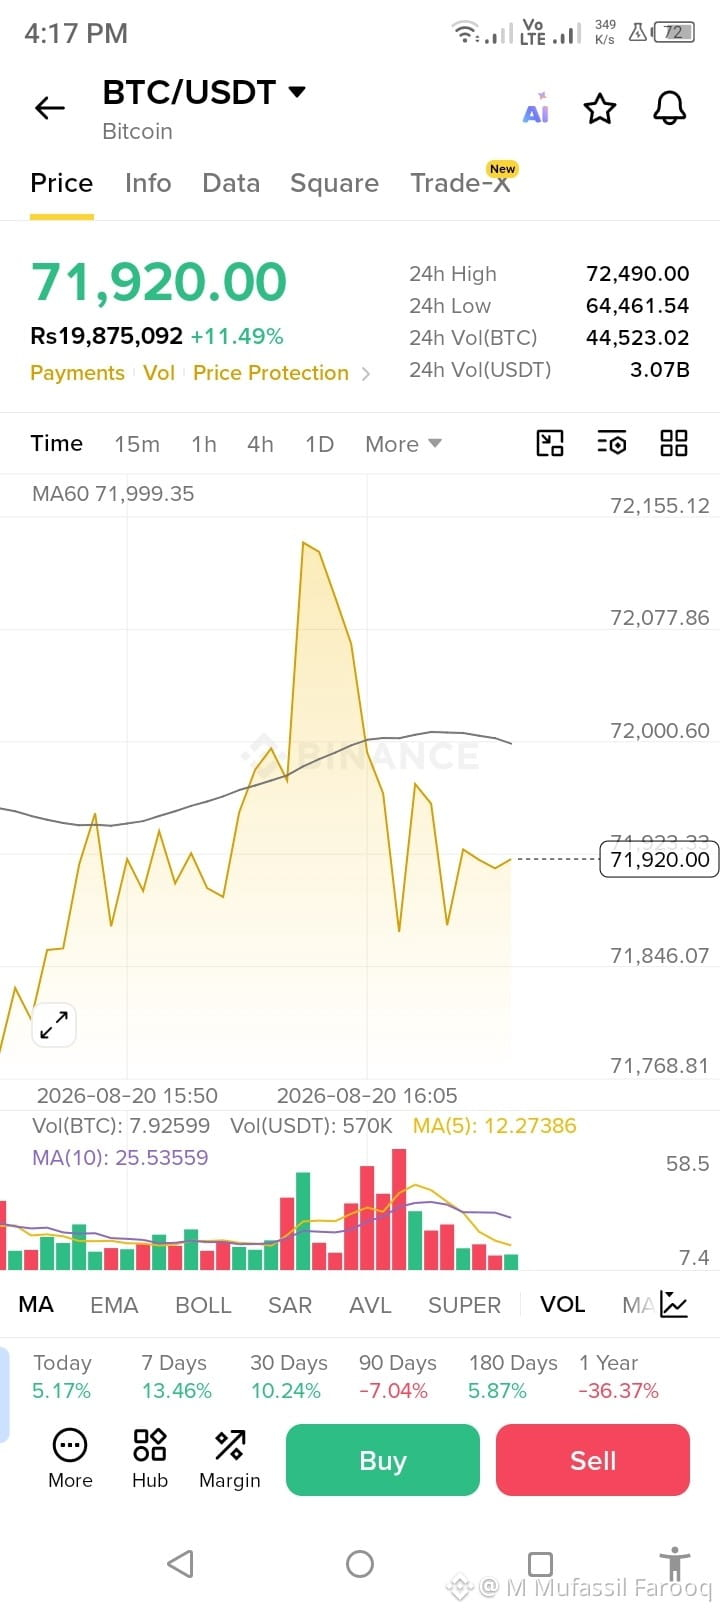
ビットコイン($BTC )テクニカル分析 — 強気派は重要なレジスタンスゾーンに直面 📊
BTC/USDT: $71,920
ビットコインは現在、約+11.49%の強い日中の値動きの後、$71.9K付近で取引されています。短期チャートでは、BTCが今まさに重要な判断ポイントのゾーンに入っていることが示されています。
🔎 注目のテクニカル水準
レジスタンス:
• $72,000 — 直近の心理的レジスタンス
• $72,155–$72,490 — 短期レジスタンス/24H高値ゾーン
サポート:
• $71,846 — 直近の日中サポート
• $71,768 — 短期の下側サポート
• $71,500–$71,600 — さらなる下げの可能性がある押し目ゾーン
📈 市場構造
BTCは現在、15分足の時間軸でMA60(約$71,999)よりわずかに下で推移しています。これにより、$72Kのエリアが特に重要になります。
もしビットコインが$72,000を上抜けし、その水準を維持するなら、強気の勢いが$72,155–$72,490ゾーンへ強まる可能性があります。
一方で、BTCが繰り返し$72Kを取り返せず、$71,846のサポートを失う場合は、次の上方向への再トライの前に短期的な押しが発生するかもしれません。
🎯 私が注目していること
🟢 強気シナリオ:
15Mで$72Kをしっかり上回って終値(クローズ)+出来高の増加 → $72.5K、さらに上への継続の可能性。
🔴 弱気シナリオ:
$72K付近での拒否(リジェクト)+売りの出来高が増加 → $71.85K/$71.77Kのサポートへの再テストの可能性。
⚠️ このように強い値動きの後は、ボラティリティが非常に高いままになることがあります。上昇を追いかけるよりも、値動き+出来高による確認が重要です。
注目の重要水準:$72,000。
あなたはどう思いますか — BTCは$72Kを突破するのか、それとも拒否されるのか? 👇
#bitcoin #BTC #BTCUSDT #crypto #BTCanalysis
これは教育目的の市場分析であり、金融アドバイスではありません
{spot}(BTCUSDT)
。
ビットコイン($BTC )テクニカル分析 — 強気派は重要なレジスタンスゾーンに直面 📊
BTC/USDT: $71,920
ビットコインは現在、約+11.49%の強い日中の値動きの後、$71.9K付近で取引されています。短期チャートでは、BTCが今まさに重要な判断ポイントのゾーンに入っていることが示されています。
🔎 注目のテクニカル水準
レジスタンス:
• $72,000 — 直近の心理的レジスタンス
• $72,155–$72,490 — 短期レジスタンス/24H高値ゾーン
サポート:
• $71,846 — 直近の日中サポート
• $71,768 — 短期の下側サポート
• $71,500–$71,600 — さらなる下げの可能性がある押し目ゾーン
📈 市場構造
BTCは現在、15分足の時間軸でMA60(約$71,999)よりわずかに下で推移しています。これにより、$72Kのエリアが特に重要になります。
もしビットコインが$72,000を上抜けし、その水準を維持するなら、強気の勢いが$72,155–$72,490ゾーンへ強まる可能性があります。
一方で、BTCが繰り返し$72Kを取り返せず、$71,846のサポートを失う場合は、次の上方向への再トライの前に短期的な押しが発生するかもしれません。
🎯 私が注目していること
🟢 強気シナリオ:
15Mで$72Kをしっかり上回って終値(クローズ)+出来高の増加 → $72.5K、さらに上への継続の可能性。
🔴 弱気シナリオ:
$72K付近での拒否(リジェクト)+売りの出来高が増加 → $71.85K/$71.77Kのサポートへの再テストの可能性。
⚠️ このように強い値動きの後は、ボラティリティが非常に高いままになることがあります。上昇を追いかけるよりも、値動き+出来高による確認が重要です。
注目の重要水準:$72,000。
あなたはどう思いますか — BTCは$72Kを突破するのか、それとも拒否されるのか? 👇
#bitcoin #BTC #BTCUSDT #crypto #BTCanalysis
これは教育目的の市場分析であり、金融アドバイスではありません
。
BTC/USDT: $71,920
ビットコインは現在、約+11.49%の強い日中の値動きの後、$71.9K付近で取引されています。短期チャートでは、BTCが今まさに重要な判断ポイントのゾーンに入っていることが示されています。
🔎 注目のテクニカル水準
レジスタンス:
• $72,000 — 直近の心理的レジスタンス
• $72,155–$72,490 — 短期レジスタンス/24H高値ゾーン
サポート:
• $71,846 — 直近の日中サポート
• $71,768 — 短期の下側サポート
• $71,500–$71,600 — さらなる下げの可能性がある押し目ゾーン
📈 市場構造
BTCは現在、15分足の時間軸でMA60(約$71,999)よりわずかに下で推移しています。これにより、$72Kのエリアが特に重要になります。
もしビットコインが$72,000を上抜けし、その水準を維持するなら、強気の勢いが$72,155–$72,490ゾーンへ強まる可能性があります。
一方で、BTCが繰り返し$72Kを取り返せず、$71,846のサポートを失う場合は、次の上方向への再トライの前に短期的な押しが発生するかもしれません。
🎯 私が注目していること
🟢 強気シナリオ:
15Mで$72Kをしっかり上回って終値(クローズ)+出来高の増加 → $72.5K、さらに上への継続の可能性。
🔴 弱気シナリオ:
$72K付近での拒否(リジェクト)+売りの出来高が増加 → $71.85K/$71.77Kのサポートへの再テストの可能性。
⚠️ このように強い値動きの後は、ボラティリティが非常に高いままになることがあります。上昇を追いかけるよりも、値動き+出来高による確認が重要です。
注目の重要水準:$72,000。
あなたはどう思いますか — BTCは$72Kを突破するのか、それとも拒否されるのか? 👇
#bitcoin #BTC #BTCUSDT #crypto #BTCanalysis
これは教育目的の市場分析であり、金融アドバイスではありません
。
72
翻訳参照
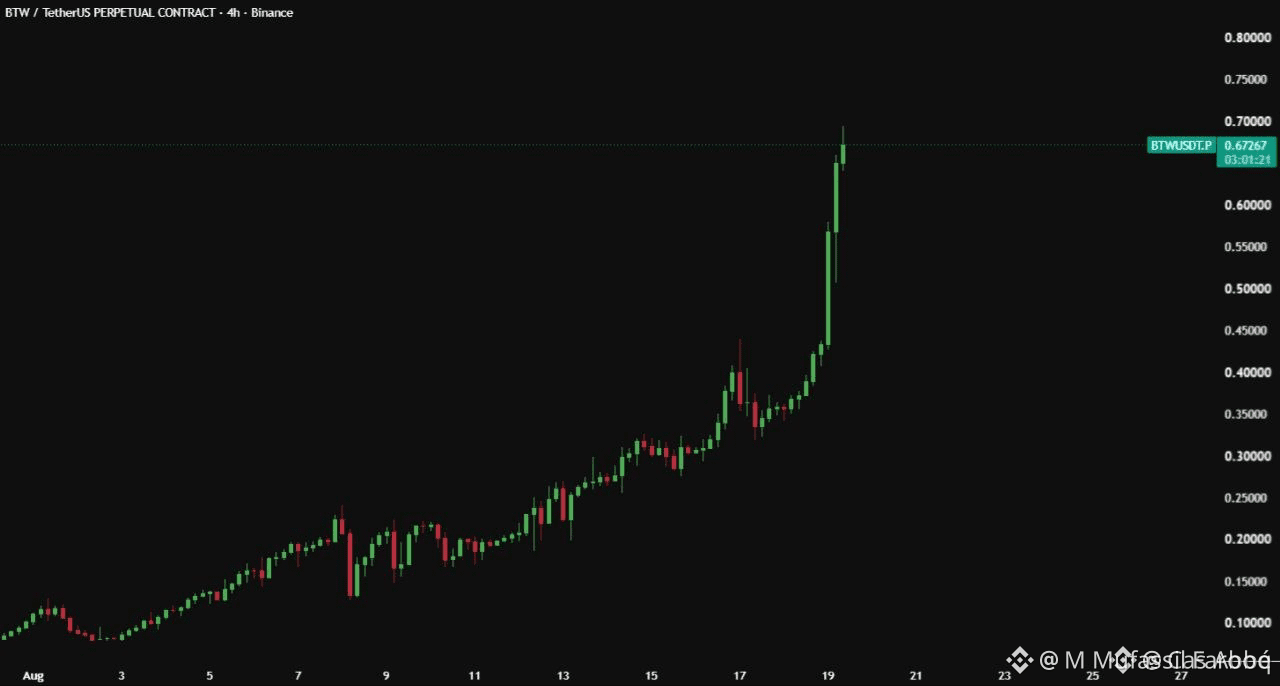
$BTW just went vertical.
The 4H chart shows a powerful breakout, with price climbing from around $0.40 to $0.67+ in a short period.
Now the important part isn’t chasing the candle.
{alpha}(560x444045b0ee1ee319a660a5e3d604ca0ffa35acaa)
$0.60 is the key area to watch. Holding above it keeps the bullish structure intact, while a clean break above $0.70 could open the door for another expansion.
After a move this strong, volatility can be extreme. Let the chart confirm the next move instead of FOMOing into the top.
$BTW is definitely one to watch.
#crypto #binanacesquarenews #dailyearnings
$BTW just went vertical.
The 4H chart shows a powerful breakout, with price climbing from around $0.40 to $0.67+ in a short period.
Now the important part isn’t chasing the candle.
$0.60 is the key area to watch. Holding above it keeps the bullish structure intact, while a clean break above $0.70 could open the door for another expansion.
After a move this strong, volatility can be extreme. Let the chart confirm the next move instead of FOMOing into the top.
$BTW is definitely one to watch.
#crypto #binanacesquarenews #dailyearnings
The 4H chart shows a powerful breakout, with price climbing from around $0.40 to $0.67+ in a short period.
Now the important part isn’t chasing the candle.
$0.60 is the key area to watch. Holding above it keeps the bullish structure intact, while a clean break above $0.70 could open the door for another expansion.
After a move this strong, volatility can be extreme. Let the chart confirm the next move instead of FOMOing into the top.
$BTW is definitely one to watch.
#crypto #binanacesquarenews #dailyearnings
73
記事
翻訳参照
Bitcoin Around $63K: Key Levels and Market Signals to Watch This Week 📊
Market Update | August 17, 📊
Market Update | August 17, 2026
Bitcoin $BTC is starting the new week near the $63,000–$63,600 area, with traders closely watching whether the market can stabilize above this zone or face another downside move. Recent market data shows BTC around $63.6K, while the weekly trend remains under pressure.
🔎 Bitcoin Market Snapshot
- BTC price: approximately $63.6K
- BTC market cap: approximately $1.33 trillion
- Key support area: around $63,000
- Additional downside reference: around $62,000
- Important resistance: around $65,000
- ETH: approximately $1.9K
Bitcoin remains by far the largest cryptocurrency by market capitalization, with Ethereum in second place at roughly $233 billion.
📉 Why Is Bitcoin Struggling?
One important factor is the recent weakness in institutional ETF flows. U.S.-listed spot Bitcoin ETFs reportedly experienced approximately $389.7 million of net outflows during the week of August 10, after strong inflows the previous week. Persistent ETF outflows can reduce an important source of demand and contribute to cautious market sentiment.
At the same time, Bitcoin has been affected by broader macroeconomic uncertainty. Markets are watching expectations around U.S. Federal Reserve policy, upcoming FOMC minutes and the broader interest-rate outlook.
Geopolitical uncertainty is another factor keeping risk appetite under pressure, particularly developments involving the Middle East and oil markets.
📊 The Levels Traders Are Watching
The $63,000 region has become an important short-term area to monitor. If BTC can maintain stability around this zone, market participants may look toward the $65,000 area as the next significant resistance.
On the other hand, a sustained move below $63,000 could bring greater attention to the $62,000 area and potentially increase short-term volatility.
These are market reference levels—not guaranteed price targets.
🟣 Ethereum Also Remains in Focus
Ethereum (ETH) is trading around the $1,900 area. Current market commentary is watching whether ETH can hold this level and challenge the $1,920 region, with $2,000 representing another psychologically important level.
Because BTC remains the dominant asset by market capitalization, significant Bitcoin moves can also influence sentiment across major altcoins.
🧠 What Could Move the Market Next?
Several catalysts deserve attention this week:
1. Federal Reserve signals 🇺🇸
The upcoming FOMC minutes could provide additional clues about future U.S. monetary policy.
2. ETF flows 💰
Investors will be watching whether Bitcoin ETF outflows continue or reverse.
3. Macroeconomic data 📈
Inflation, employment and interest-rate expectations can influence demand for risk assets such as cryptocurrencies.
4. Geopolitical developments 🌍
Changes in oil prices and geopolitical tensions could affect broader risk sentiment.
5. Bitcoin's $63K–$65K range 📊
A decisive move outside this range could provide a clearer indication of short-term momentum.
⚠️ Final Takeaway
Bitcoin's current market structure remains cautious rather than decisively bullish. BTC is holding around the $63K region, but recent ETF outflows, macroeconomic uncertainty and the loss of important longer-term technical levels mean volatility could remain elevated.
For market observers, the key question this week is simple:
Can Bitcoin regain momentum above $65K, or will sellers push BTC below the $63K support area?
The answer may depend heavily on ETF flows, Federal Reserve expectations and broader risk sentiment.
This article is for educational and informational purposes only. It is not financial advice. Cryptocurrency markets are highly volatile, and past performance does not guarantee future results.
#bitcoin #BTC走势分析 #Crypto #Ethereum #BinanceSquare
Bitcoin Around $63K: Key Levels and Market Signals to Watch This Week 📊 Market Update | August 17,
📊
Market Update | August 17, 2026
Bitcoin $BTC is starting the new week near the $63,000–$63,600 area, with traders closely watching whether the market can stabilize above this zone or face another downside move. Recent market data shows BTC around $63.6K, while the weekly trend remains under pressure.
🔎 Bitcoin Market Snapshot
- BTC price: approximately $63.6K
- BTC market cap: approximately $1.33 trillion
- Key support area: around $63,000
- Additional downside reference: around $62,000
- Important resistance: around $65,000
- ETH: approximately $1.9K
Bitcoin remains by far the largest cryptocurrency by market capitalization, with Ethereum in second place at roughly $233 billion.
📉 Why Is Bitcoin Struggling?
One important factor is the recent weakness in institutional ETF flows. U.S.-listed spot Bitcoin ETFs reportedly experienced approximately $389.7 million of net outflows during the week of August 10, after strong inflows the previous week. Persistent ETF outflows can reduce an important source of demand and contribute to cautious market sentiment.
At the same time, Bitcoin has been affected by broader macroeconomic uncertainty. Markets are watching expectations around U.S. Federal Reserve policy, upcoming FOMC minutes and the broader interest-rate outlook.
Geopolitical uncertainty is another factor keeping risk appetite under pressure, particularly developments involving the Middle East and oil markets.
📊 The Levels Traders Are Watching
The $63,000 region has become an important short-term area to monitor. If BTC can maintain stability around this zone, market participants may look toward the $65,000 area as the next significant resistance.
On the other hand, a sustained move below $63,000 could bring greater attention to the $62,000 area and potentially increase short-term volatility.
These are market reference levels—not guaranteed price targets.
🟣 Ethereum Also Remains in Focus
Ethereum (ETH) is trading around the $1,900 area. Current market commentary is watching whether ETH can hold this level and challenge the $1,920 region, with $2,000 representing another psychologically important level.
Because BTC remains the dominant asset by market capitalization, significant Bitcoin moves can also influence sentiment across major altcoins.
🧠 What Could Move the Market Next?
Several catalysts deserve attention this week:
1. Federal Reserve signals 🇺🇸
The upcoming FOMC minutes could provide additional clues about future U.S. monetary policy.
2. ETF flows 💰
Investors will be watching whether Bitcoin ETF outflows continue or reverse.
3. Macroeconomic data 📈
Inflation, employment and interest-rate expectations can influence demand for risk assets such as cryptocurrencies.
4. Geopolitical developments 🌍
Changes in oil prices and geopolitical tensions could affect broader risk sentiment.
5. Bitcoin's $63K–$65K range 📊
A decisive move outside this range could provide a clearer indication of short-term momentum.
⚠️ Final Takeaway
Bitcoin's current market structure remains cautious rather than decisively bullish. BTC is holding around the $63K region, but recent ETF outflows, macroeconomic uncertainty and the loss of important longer-term technical levels mean volatility could remain elevated.
For market observers, the key question this week is simple:
Can Bitcoin regain momentum above $65K, or will sellers push BTC below the $63K support area?
The answer may depend heavily on ETF flows, Federal Reserve expectations and broader risk sentiment.
This article is for educational and informational purposes only. It is not financial advice. Cryptocurrency markets are highly volatile, and past performance does not guarantee future results.
#bitcoin #BTC走势分析 #Crypto #Ethereum #BinanceSquare
Market Update | August 17, 2026
Bitcoin $BTC is starting the new week near the $63,000–$63,600 area, with traders closely watching whether the market can stabilize above this zone or face another downside move. Recent market data shows BTC around $63.6K, while the weekly trend remains under pressure.
🔎 Bitcoin Market Snapshot
- BTC price: approximately $63.6K
- BTC market cap: approximately $1.33 trillion
- Key support area: around $63,000
- Additional downside reference: around $62,000
- Important resistance: around $65,000
- ETH: approximately $1.9K
Bitcoin remains by far the largest cryptocurrency by market capitalization, with Ethereum in second place at roughly $233 billion.
📉 Why Is Bitcoin Struggling?
One important factor is the recent weakness in institutional ETF flows. U.S.-listed spot Bitcoin ETFs reportedly experienced approximately $389.7 million of net outflows during the week of August 10, after strong inflows the previous week. Persistent ETF outflows can reduce an important source of demand and contribute to cautious market sentiment.
At the same time, Bitcoin has been affected by broader macroeconomic uncertainty. Markets are watching expectations around U.S. Federal Reserve policy, upcoming FOMC minutes and the broader interest-rate outlook.
Geopolitical uncertainty is another factor keeping risk appetite under pressure, particularly developments involving the Middle East and oil markets.
📊 The Levels Traders Are Watching
The $63,000 region has become an important short-term area to monitor. If BTC can maintain stability around this zone, market participants may look toward the $65,000 area as the next significant resistance.
On the other hand, a sustained move below $63,000 could bring greater attention to the $62,000 area and potentially increase short-term volatility.
These are market reference levels—not guaranteed price targets.
🟣 Ethereum Also Remains in Focus
Ethereum (ETH) is trading around the $1,900 area. Current market commentary is watching whether ETH can hold this level and challenge the $1,920 region, with $2,000 representing another psychologically important level.
Because BTC remains the dominant asset by market capitalization, significant Bitcoin moves can also influence sentiment across major altcoins.
🧠 What Could Move the Market Next?
Several catalysts deserve attention this week:
1. Federal Reserve signals 🇺🇸
The upcoming FOMC minutes could provide additional clues about future U.S. monetary policy.
2. ETF flows 💰
Investors will be watching whether Bitcoin ETF outflows continue or reverse.
3. Macroeconomic data 📈
Inflation, employment and interest-rate expectations can influence demand for risk assets such as cryptocurrencies.
4. Geopolitical developments 🌍
Changes in oil prices and geopolitical tensions could affect broader risk sentiment.
5. Bitcoin's $63K–$65K range 📊
A decisive move outside this range could provide a clearer indication of short-term momentum.
⚠️ Final Takeaway
Bitcoin's current market structure remains cautious rather than decisively bullish. BTC is holding around the $63K region, but recent ETF outflows, macroeconomic uncertainty and the loss of important longer-term technical levels mean volatility could remain elevated.
For market observers, the key question this week is simple:
Can Bitcoin regain momentum above $65K, or will sellers push BTC below the $63K support area?
The answer may depend heavily on ETF flows, Federal Reserve expectations and broader risk sentiment.
This article is for educational and informational purposes only. It is not financial advice. Cryptocurrency markets are highly volatile, and past performance does not guarantee future results.
#bitcoin #BTC走势分析 #Crypto #Ethereum #BinanceSquare
81
翻訳参照
$BNB BNB/USDT — BULLISH TRADE SIGNAL
Bias: 🟢 LONG
Entry Zone: $612.80 – $614.50 (after 4H breakout confirmation)
TP1: $618.00
TP2: $620.50
TP3: $626.00
Stop Loss: $607.50
$BNB #USAugust1YInflationExpectations4.3%
{spot}(BNBUSDT)
$BNB BNB/USDT — BULLISH TRADE SIGNAL
Bias: 🟢 LONG
Entry Zone: $612.80 – $614.50 (after 4H breakout confirmation)
TP1: $618.00
TP2: $620.50
TP3: $626.00
Stop Loss: $607.50
$BNB #USAugust1YInflationExpectations4.3%
Bias: 🟢 LONG
Entry Zone: $612.80 – $614.50 (after 4H breakout confirmation)
TP1: $618.00
TP2: $620.50
TP3: $626.00
Stop Loss: $607.50
$BNB #USAugust1YInflationExpectations4.3%
57
翻訳参照
Bitcoin Daily 📈
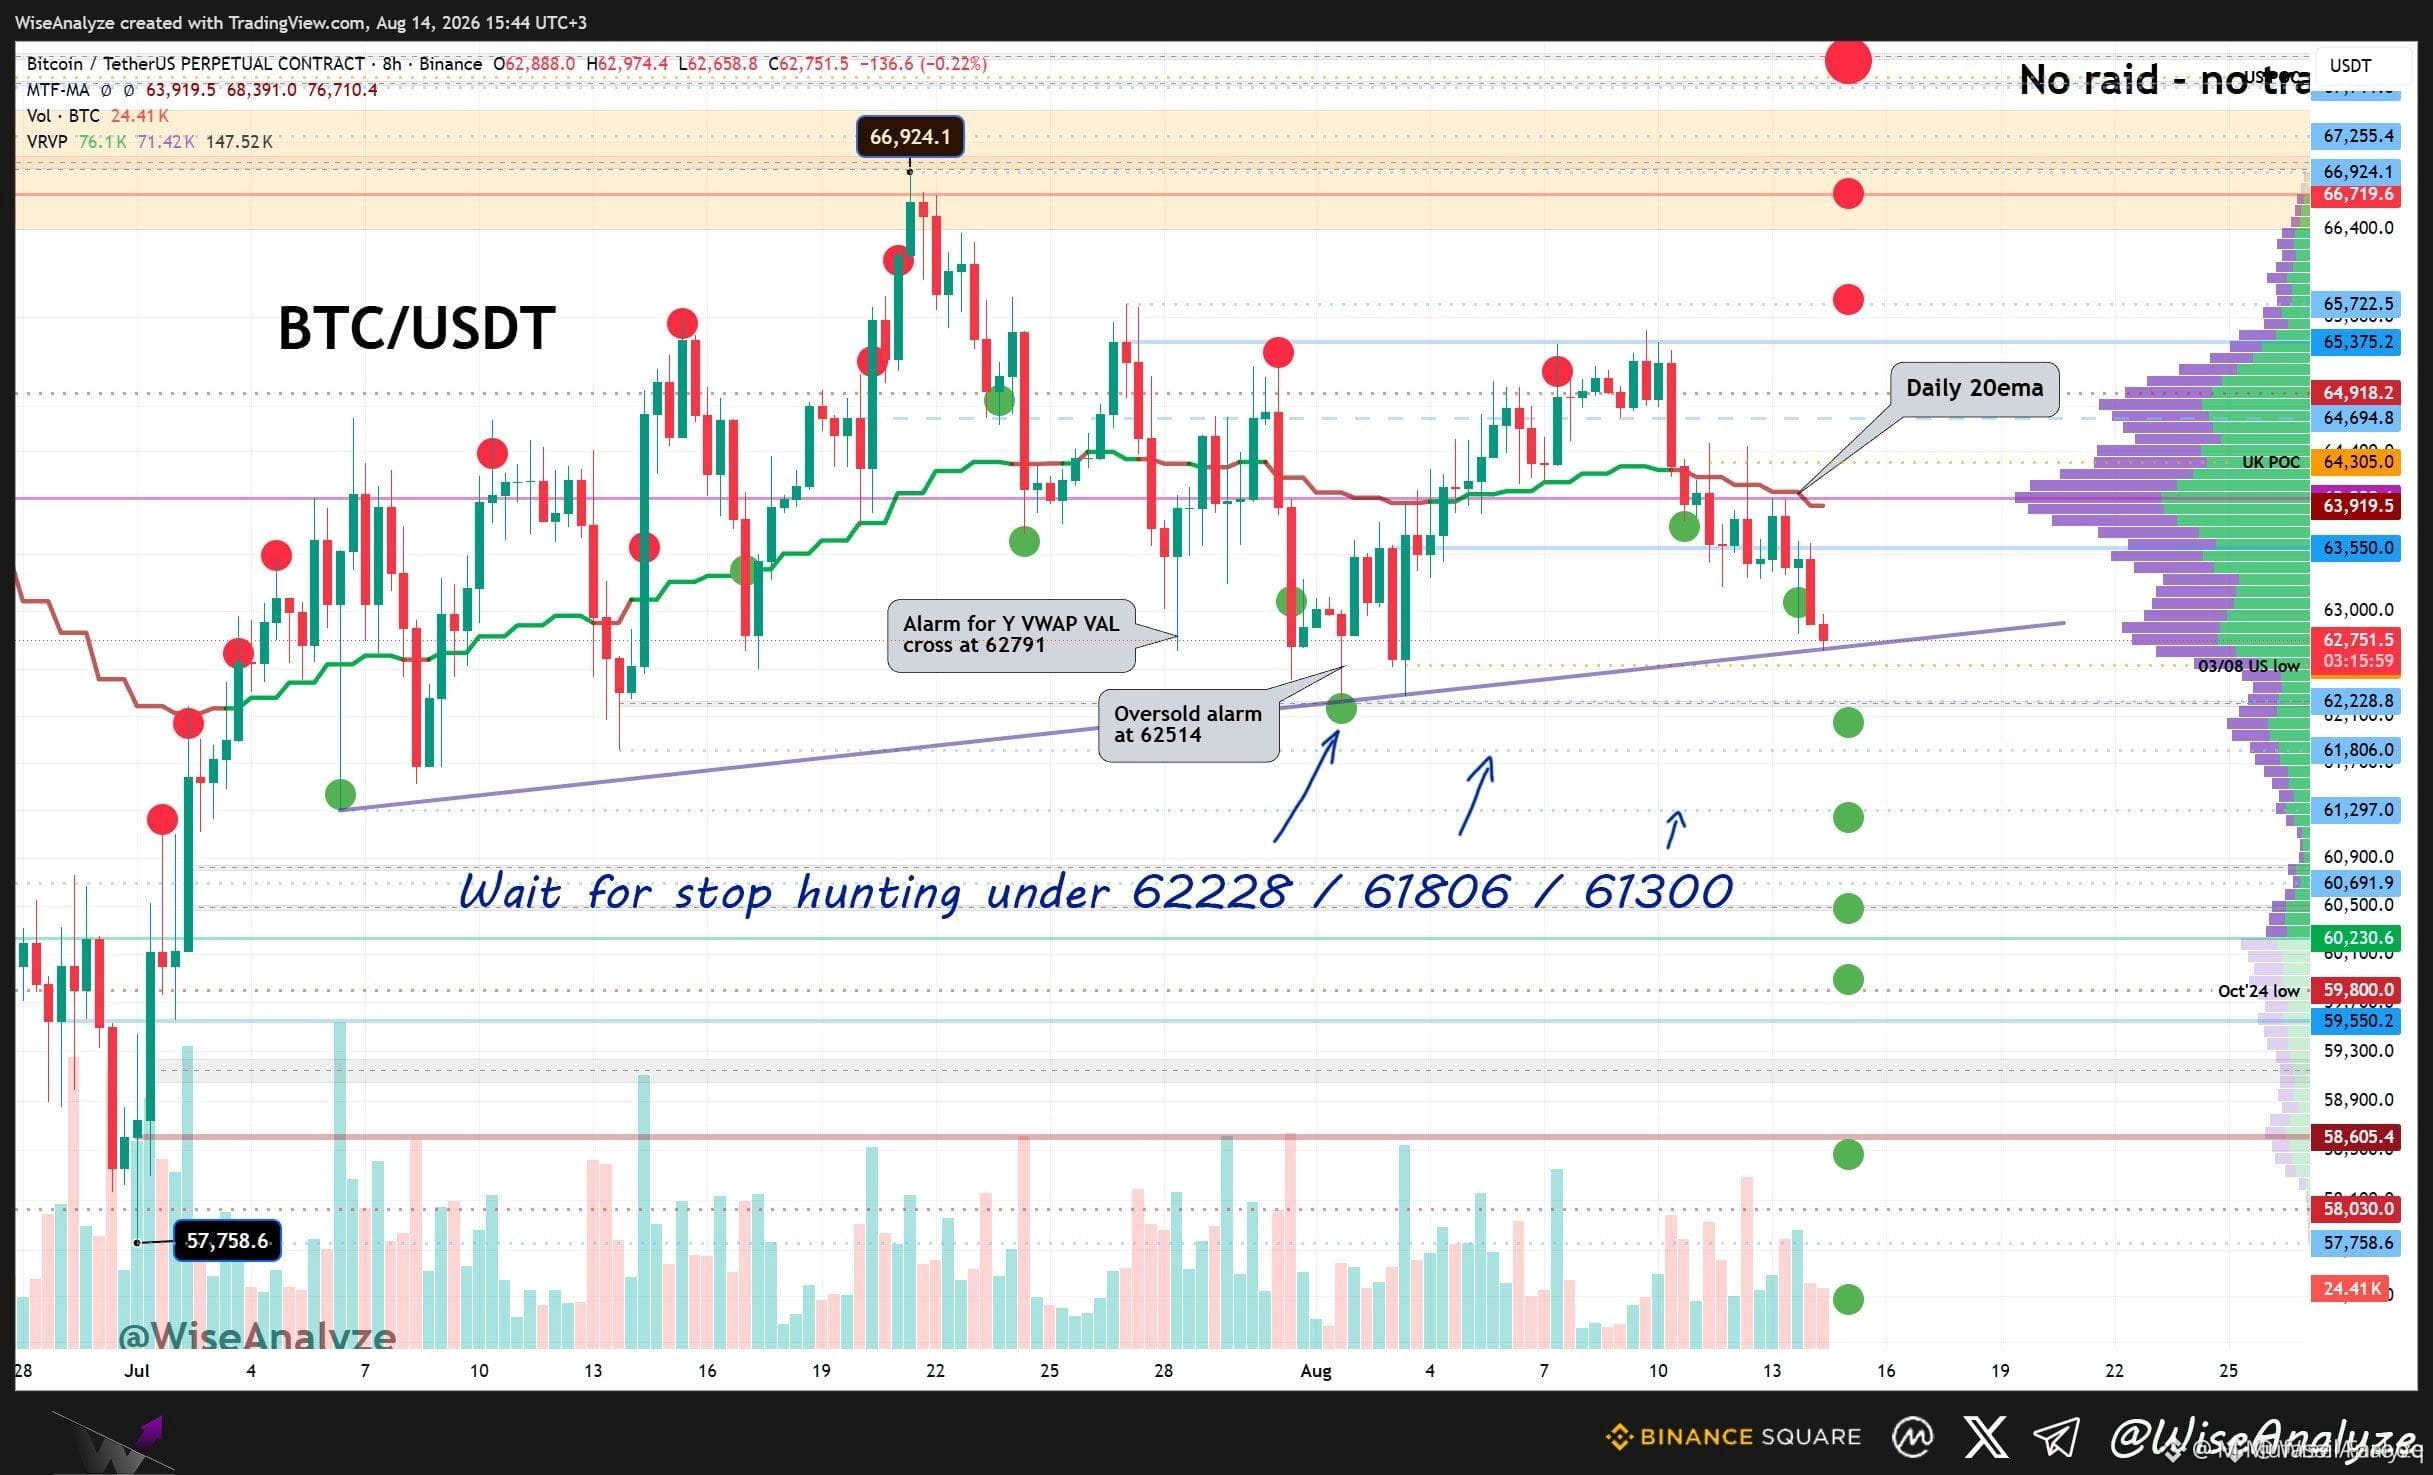
$BTC losing the week open at 63550. Dip under the trendline looks inevitable. Most probably it’ll hunt for stops under 62228, maybe even cover 61806 on the same move. The rest is unpredictable.
Frankly, on the Daily and Weekly this chart looks very dumpy. But the market rarely does the most obvious move - or at least not without some fake moves and manipulations. I’ve been pointing at ~60.8k since July 3rd, and that level still acts as a magnet. The difference now is that if it had dipped there back then, the chances of a bounce would’ve been much higher. These days it looks more probable that it’ll just skip it and dump straight to 44-48k
🎯 Nearest Key Levels
Above: 63500 / 64000 / 64700
Below: 62228 / 61806 / 61300
{spot}(BTCUSDT)
Bitcoin Daily 📈
$BTC losing the week open at 63550. Dip under the trendline looks inevitable. Most probably it’ll hunt for stops under 62228, maybe even cover 61806 on the same move. The rest is unpredictable.
Frankly, on the Daily and Weekly this chart looks very dumpy. But the market rarely does the most obvious move - or at least not without some fake moves and manipulations. I’ve been pointing at ~60.8k since July 3rd, and that level still acts as a magnet. The difference now is that if it had dipped there back then, the chances of a bounce would’ve been much higher. These days it looks more probable that it’ll just skip it and dump straight to 44-48k
🎯 Nearest Key Levels
Above: 63500 / 64000 / 64700
Below: 62228 / 61806 / 61300
$BTC losing the week open at 63550. Dip under the trendline looks inevitable. Most probably it’ll hunt for stops under 62228, maybe even cover 61806 on the same move. The rest is unpredictable.
Frankly, on the Daily and Weekly this chart looks very dumpy. But the market rarely does the most obvious move - or at least not without some fake moves and manipulations. I’ve been pointing at ~60.8k since July 3rd, and that level still acts as a magnet. The difference now is that if it had dipped there back then, the chances of a bounce would’ve been much higher. These days it looks more probable that it’ll just skip it and dump straight to 44-48k
🎯 Nearest Key Levels
Above: 63500 / 64000 / 64700
Below: 62228 / 61806 / 61300
43
翻訳参照
$XRP LONG
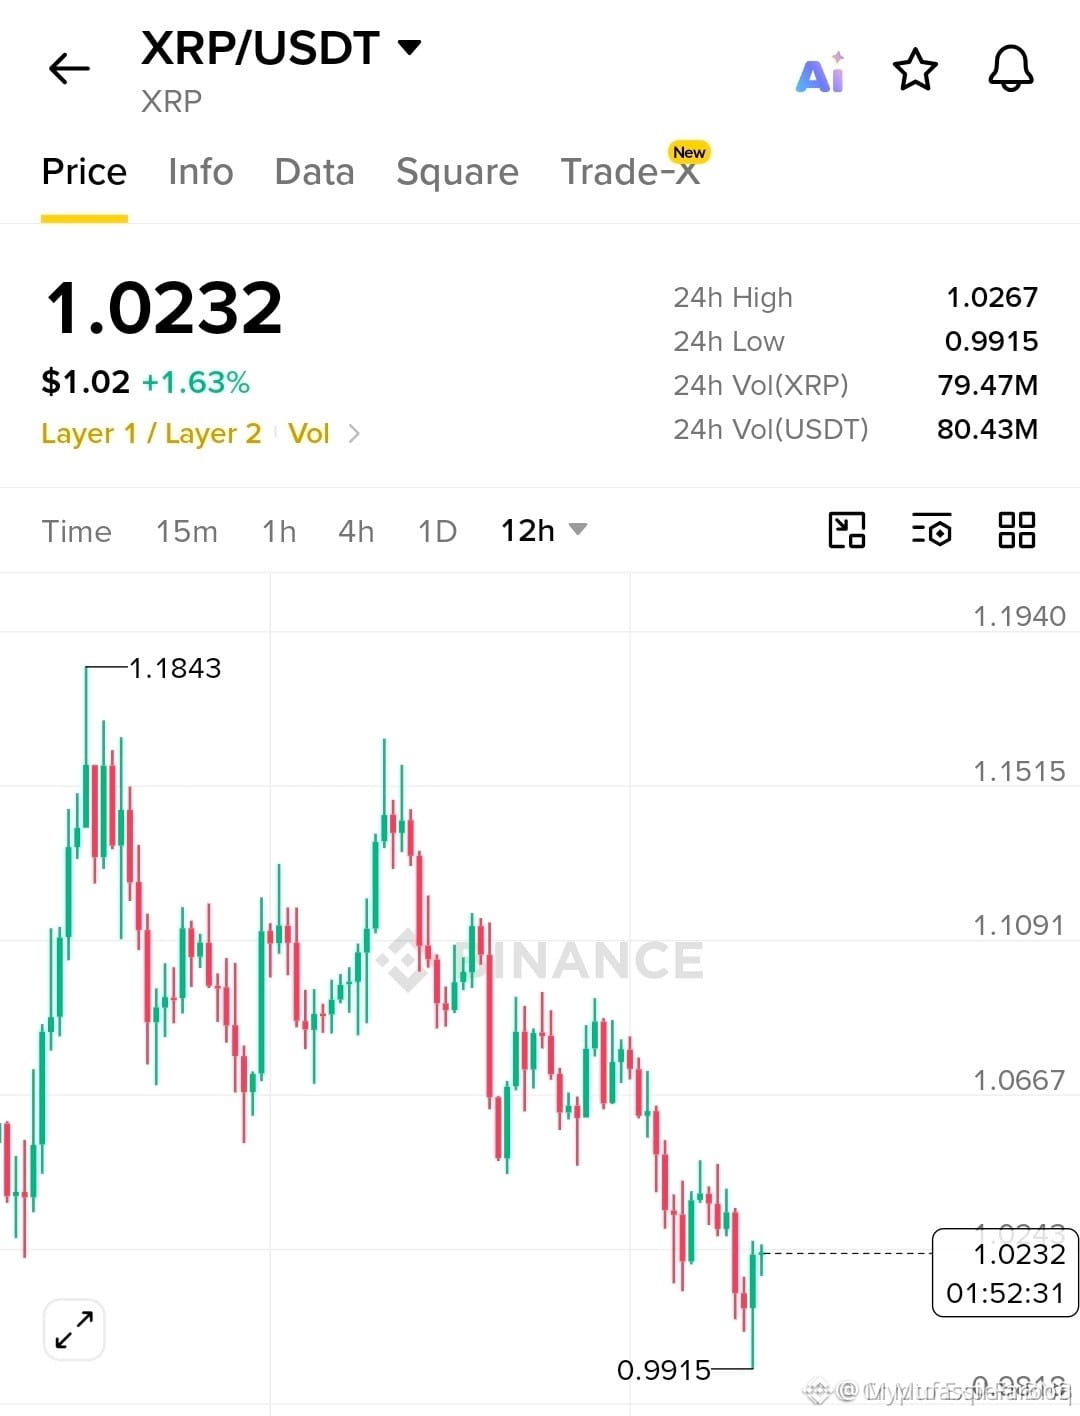
Are you ready xrp skyrocket soon big bullish momuntium on the way buy in spot , if you buy in future then use 5x to 10x maximum , market Pump upto $1.10 or above but DYOR before investment $XRP #SenateDelaysCLARITYActVoteToSeptember
{future}(XRPUSDT)
$XRP LONG
Are you ready xrp skyrocket soon big bullish momuntium on the way buy in spot , if you buy in future then use 5x to 10x maximum , market Pump upto $1.10 or above but DYOR before investment $XRP #SenateDelaysCLARITYActVoteToSeptember
Are you ready xrp skyrocket soon big bullish momuntium on the way buy in spot , if you buy in future then use 5x to 10x maximum , market Pump upto $1.10 or above but DYOR before investment $XRP #SenateDelaysCLARITYActVoteToSeptember
75
翻訳参照
$BTC
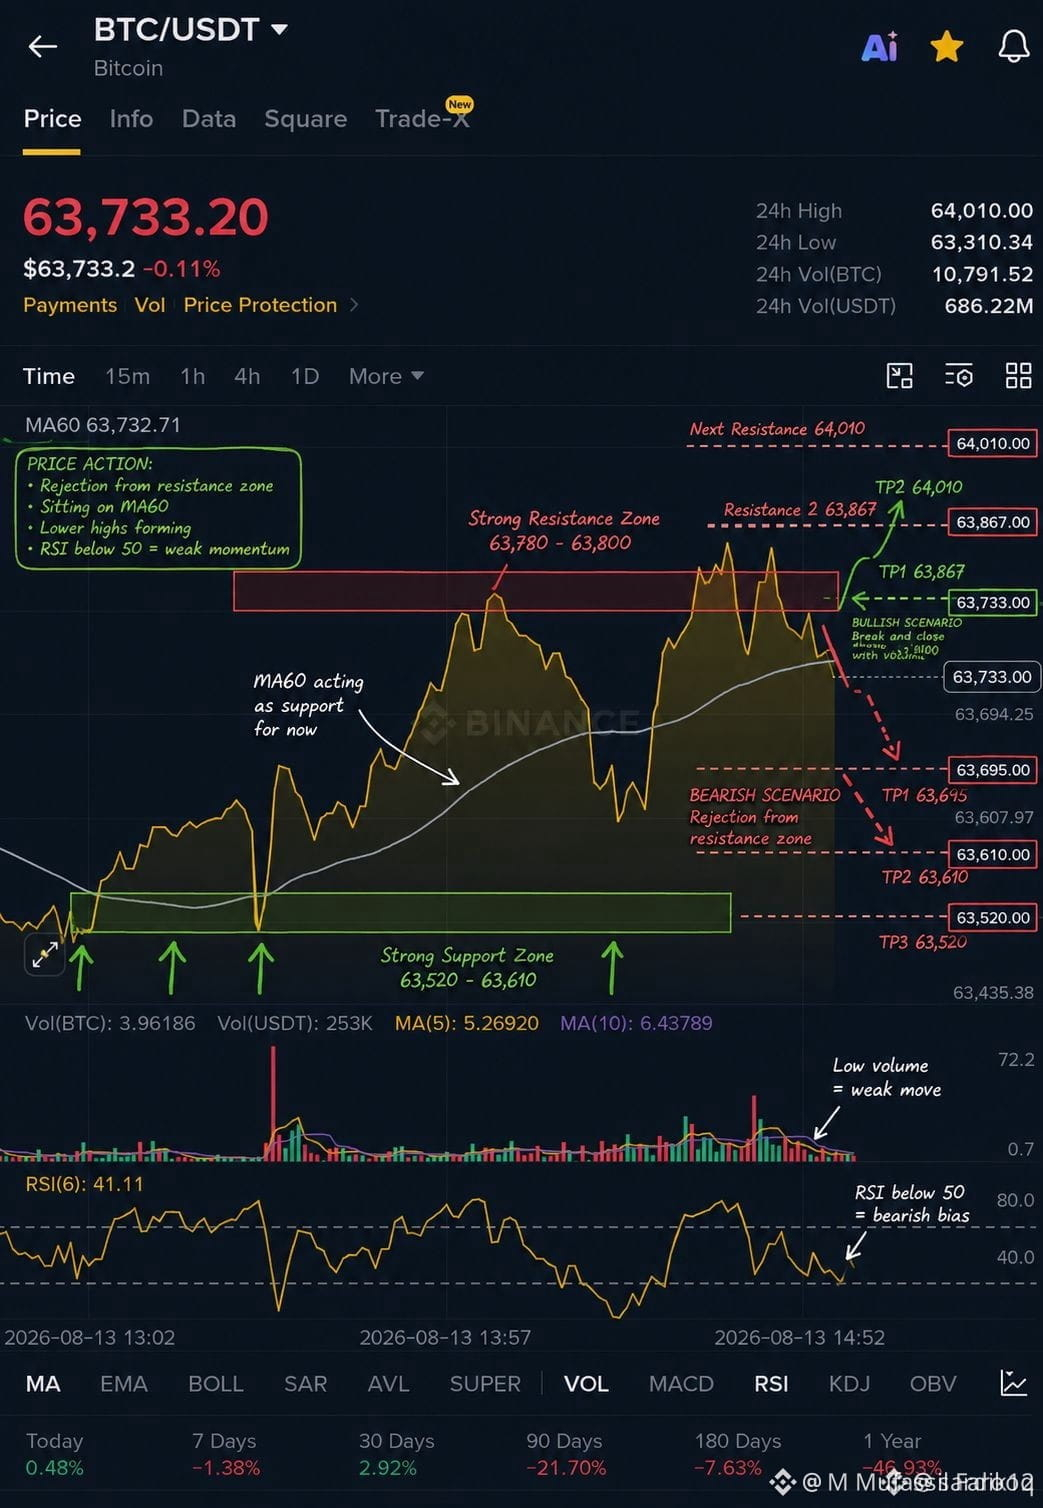
is sitting almost exactly on the MA60 at $63,733, so this is a key decision area.
RSI: 41 → bearish momentum, but not oversold.
Price is struggling below $63,780–$63,800 resistance.
Support: $63,695 → $63,610 → $63,520
Resistance: $63,780 → $63,867 → $64,010
Short setup:
Wait for rejection around $63,780–$63,800.
🎯 TP1: $63,695
🎯 TP2: $63,610
🛑 SL: above $63,870
Long setup:
Only consider a long if $BTC reclaims $63,800 with strong volume and holds above it.
🎯 TP1: $63,867
🎯 TP2: $64,010
🛑 SL: below $63,700
My bias: Slightly bearish while $BTC remains below $63,800. I’d rather wait for confirmation than chase the current price
{spot}(BTCUSDT)
$BTC
is sitting almost exactly on the MA60 at $63,733, so this is a key decision area.
RSI: 41 → bearish momentum, but not oversold.
Price is struggling below $63,780–$63,800 resistance.
Support: $63,695 → $63,610 → $63,520
Resistance: $63,780 → $63,867 → $64,010
Short setup:
Wait for rejection around $63,780–$63,800.
🎯 TP1: $63,695
🎯 TP2: $63,610
🛑 SL: above $63,870
Long setup:
Only consider a long if $BTC reclaims $63,800 with strong volume and holds above it.
🎯 TP1: $63,867
🎯 TP2: $64,010
🛑 SL: below $63,700
My bias: Slightly bearish while $BTC remains below $63,800. I’d rather wait for confirmation than chase the current price
is sitting almost exactly on the MA60 at $63,733, so this is a key decision area.
RSI: 41 → bearish momentum, but not oversold.
Price is struggling below $63,780–$63,800 resistance.
Support: $63,695 → $63,610 → $63,520
Resistance: $63,780 → $63,867 → $64,010
Short setup:
Wait for rejection around $63,780–$63,800.
🎯 TP1: $63,695
🎯 TP2: $63,610
🛑 SL: above $63,870
Long setup:
Only consider a long if $BTC reclaims $63,800 with strong volume and holds above it.
🎯 TP1: $63,867
🎯 TP2: $64,010
🛑 SL: below $63,700
My bias: Slightly bearish while $BTC remains below $63,800. I’d rather wait for confirmation than chase the current price
60
ログインして、さらにコンテンツを読む
厳選トピックで世界の暗号資産トレーダーの仲間入り
⚡️ 暗号資産に関する最新かつ有益な情報が見つかります。
💬 世界最大の暗号資産取引所から信頼されています。
👍 認証を受けたクリエイターから、有益なインサイトを得られます。
メール / 電話番号
トレンドトピック
FedSEPProjects2026RateAt4.1%
閲覧回数 430
45人が討論中
#FedSEPProjects2026RateAt4.1%
🚨 連邦準備制度(Fed)によるSEP下落:2026年の金利見通しは4.1% 🚨
Fedの最新の経済見通し(Summary of Economic Projections)が発表され、— 2026年末までにFRBの政策金利(フェデラル・ファンド金利)の中央値は4.1%と見られる。
まだ「より高い水準がより長く続く」ムードが残っている。
金利が高いほど=流動性は引き締まる。短期的にはリスク資産に圧力がかかるが、$BTC はこの大部分をすでに織り込み済みだ。長期的には、より高い金利が持続することで資本はハードアセット(実物資産)へ一層向かう。$BTC は究極のヘッジのままだ。ドット(政策金利見通しの点)の中でハト派方向への転換がないか注目しよう。忍耐強い保有者にとっては、集積(アキュムレーション)ゾーンがまだ開いている。📊
#Fed #InterestRates #Bitcoin #Crypto #BinanceSquare #マクロ
$BTC
A_K Crypto
·いいね:0件
·閲覧回数 22
USHouseAdvancesBitcoinReserveBill
閲覧回数 1,450
67人が討論中
AmazonGetsWarrantsToBuyGeneracStock
閲覧回数 1,930
100人が討論中