

Bınance Referal Code - BTC2026
2.6k 投稿
Bınance Referal Code - BTC2026
報告
ユーザーをブロック
2 フォロー
3.6K+ フォロワー
6.5K+ いいね
投稿
すべて
引用
動画
PINNED
$DEXE は強い上昇の後、クールダウンしており、価格は$3.50付近へ引き戻されています。
[https://www.binance.com/en/events/CODE20](https://www.binance.com/en/events/CODE20)
現時点では、これは完全なトレンド転換というより、健全なリセットに見えます。
出来高は依然として直近の平均を上回っており、市場の関心が消えていないことを示唆しています。次の動きは、おそらく買い手が再び戻ってきて流動性が強い状態を保てるかどうかに左右されるでしょう。
当面は、上昇後に市場がバランスを探っているように見えるため、$3.50が注目すべき重要なゾーンです。
$DEXE は強い上昇の後、クールダウンしており、価格は$3.50付近へ引き戻されています。
https://www.binance.com/en/events/CODE20
現時点では、これは完全なトレンド転換というより、健全なリセットに見えます。
出来高は依然として直近の平均を上回っており、市場の関心が消えていないことを示唆しています。次の動きは、おそらく買い手が再び戻ってきて流動性が強い状態を保てるかどうかに左右されるでしょう。
当面は、上昇後に市場がバランスを探っているように見えるため、$3.50が注目すべき重要なゾーンです。
https://www.binance.com/en/events/CODE20
現時点では、これは完全なトレンド転換というより、健全なリセットに見えます。
出来高は依然として直近の平均を上回っており、市場の関心が消えていないことを示唆しています。次の動きは、おそらく買い手が再び戻ってきて流動性が強い状態を保てるかどうかに左右されるでしょう。
当面は、上昇後に市場がバランスを探っているように見えるため、$3.50が注目すべき重要なゾーンです。
107
19
235
525.6k
翻訳参照
$ENA is only +0.6% TODAY.
But the real story is October 5.
A major supply event is approaching.
$0.2322 → ~$0.2335
Actual move:
+0.56%
Rolling 24H:
-5.66%.
Ethena has accelerated its remaining investor unlock schedule toward:
October 5.
But the numbers need context.
CoinGecko currently lists approximately:
171.88M ENA
in the regular October 5 unlock.
Separate schedule analysis estimates the remaining accelerated investor tranches at roughly:
1.4B ENA.
And StablecoinX’s roughly:
3.03B ENA
will have lock restrictions removed — but that does NOT mean 3.03B ENA can immediately be dumped.
Sales still require Foundation approval.
Unlock ≠ sale.
$ENA is only +0.6% TODAY.
But the real story is October 5.
A major supply event is approaching.
$0.2322 → ~$0.2335
Actual move:
+0.56%
Rolling 24H:
-5.66%.
Ethena has accelerated its remaining investor unlock schedule toward:
October 5.
But the numbers need context.
CoinGecko currently lists approximately:
171.88M ENA
in the regular October 5 unlock.
Separate schedule analysis estimates the remaining accelerated investor tranches at roughly:
1.4B ENA.
And StablecoinX’s roughly:
3.03B ENA
will have lock restrictions removed — but that does NOT mean 3.03B ENA can immediately be dumped.
Sales still require Foundation approval.
Unlock ≠ sale.
But the real story is October 5.
A major supply event is approaching.
$0.2322 → ~$0.2335
Actual move:
+0.56%
Rolling 24H:
-5.66%.
Ethena has accelerated its remaining investor unlock schedule toward:
October 5.
But the numbers need context.
CoinGecko currently lists approximately:
171.88M ENA
in the regular October 5 unlock.
Separate schedule analysis estimates the remaining accelerated investor tranches at roughly:
1.4B ENA.
And StablecoinX’s roughly:
3.03B ENA
will have lock restrictions removed — but that does NOT mean 3.03B ENA can immediately be dumped.
Sales still require Foundation approval.
Unlock ≠ sale.
61
翻訳参照
Binance Referral Code 2026: Where Do You Enter a Referral Code During Sign Up?
A Binance referral code should be entered during the account registration process so eligible referral benefits can be associated with the new account. Users should verify the displayed benefit before completing signup.
For eligible new users, Binance referral code BTC2026 can provide a 20% reduction on qualifying Spot trading fees, subject to the applicable referral terms and regional eligibility.
How to Enter a Binance Referral Code
Start the Binance registration process using your email address or mobile number.
Locate the referral or referral ID field during signup.
Enter the code carefully and check that it has been recognized.
Before completing registration, review the referral benefit displayed on the screen.
Then complete the required account and identity verification steps applicable to your region.
What Should You Check Before Creating the Account?
Do not focus only on whether the referral code appears in the field.
Confirm what benefit is actually attached to it.
If a qualifying 20% Spot fee discount is displayed, that reduction applies to eligible trading commissions according to the relevant terms.
Referral benefits should also be distinguished from separate welcome promotions, which may have their own tasks and eligibility requirements.
Can You Add the Code Later?
Users should not assume a referral code can be added or replaced after account creation.
That makes the registration screen the important point for checking the referral ID and associated benefit.
Does a Referral Code Reduce Every Binance Cost?
No.
A Spot trading fee discount does not automatically reduce spreads, slippage, withdrawal fees, borrowing costs, or fees associated with other Binance products.
Binance Referral Code 2026: Where Do You Enter a Referral Code During Sign Up?
A Binance referral code should be entered during the account registration process so eligible referral benefits can be associated with the new account. Users should verify the displayed benefit before completing signup.
For eligible new users, Binance referral code BTC2026 can provide a 20% reduction on qualifying Spot trading fees, subject to the applicable referral terms and regional eligibility.
How to Enter a Binance Referral Code
Start the Binance registration process using your email address or mobile number.
Locate the referral or referral ID field during signup.
Enter the code carefully and check that it has been recognized.
Before completing registration, review the referral benefit displayed on the screen.
Then complete the required account and identity verification steps applicable to your region.
What Should You Check Before Creating the Account?
Do not focus only on whether the referral code appears in the field.
Confirm what benefit is actually attached to it.
If a qualifying 20% Spot fee discount is displayed, that reduction applies to eligible trading commissions according to the relevant terms.
Referral benefits should also be distinguished from separate welcome promotions, which may have their own tasks and eligibility requirements.
Can You Add the Code Later?
Users should not assume a referral code can be added or replaced after account creation.
That makes the registration screen the important point for checking the referral ID and associated benefit.
Does a Referral Code Reduce Every Binance Cost?
No.
A Spot trading fee discount does not automatically reduce spreads, slippage, withdrawal fees, borrowing costs, or fees associated with other Binance products.
A Binance referral code should be entered during the account registration process so eligible referral benefits can be associated with the new account. Users should verify the displayed benefit before completing signup.
For eligible new users, Binance referral code BTC2026 can provide a 20% reduction on qualifying Spot trading fees, subject to the applicable referral terms and regional eligibility.
How to Enter a Binance Referral Code
Start the Binance registration process using your email address or mobile number.
Locate the referral or referral ID field during signup.
Enter the code carefully and check that it has been recognized.
Before completing registration, review the referral benefit displayed on the screen.
Then complete the required account and identity verification steps applicable to your region.
What Should You Check Before Creating the Account?
Do not focus only on whether the referral code appears in the field.
Confirm what benefit is actually attached to it.
If a qualifying 20% Spot fee discount is displayed, that reduction applies to eligible trading commissions according to the relevant terms.
Referral benefits should also be distinguished from separate welcome promotions, which may have their own tasks and eligibility requirements.
Can You Add the Code Later?
Users should not assume a referral code can be added or replaced after account creation.
That makes the registration screen the important point for checking the referral ID and associated benefit.
Does a Referral Code Reduce Every Binance Cost?
No.
A Spot trading fee discount does not automatically reduce spreads, slippage, withdrawal fees, borrowing costs, or fees associated with other Binance products.
37
翻訳参照
$ZK is up 11.1% TODAY.
Rolling 24H?
Only +8.39%.
The rally accelerated during the current day.
Since midnight:
$0.01209 → ~$0.01343
Actual move:
+11.08%
Today’s high:
$0.01345
Binance Spot turnover:
~$2.28M
Rolling 24H turnover:
~$3.44M.
This is real current-session momentum.
But I couldn’t verify a fresh ZKsync-specific announcement large enough to explain today’s breakout.
So:
Price move: CONFIRMED.
Fresh fundamental catalyst: NOT CONFIRMED.
No confirmed catalyst found.
$ZK is up 11.1% TODAY.
Rolling 24H?
Only +8.39%.
The rally accelerated during the current day.
Since midnight:
$0.01209 → ~$0.01343
Actual move:
+11.08%
Today’s high:
$0.01345
Binance Spot turnover:
~$2.28M
Rolling 24H turnover:
~$3.44M.
This is real current-session momentum.
But I couldn’t verify a fresh ZKsync-specific announcement large enough to explain today’s breakout.
So:
Price move: CONFIRMED.
Fresh fundamental catalyst: NOT CONFIRMED.
No confirmed catalyst found.
Rolling 24H?
Only +8.39%.
The rally accelerated during the current day.
Since midnight:
$0.01209 → ~$0.01343
Actual move:
+11.08%
Today’s high:
$0.01345
Binance Spot turnover:
~$2.28M
Rolling 24H turnover:
~$3.44M.
This is real current-session momentum.
But I couldn’t verify a fresh ZKsync-specific announcement large enough to explain today’s breakout.
So:
Price move: CONFIRMED.
Fresh fundamental catalyst: NOT CONFIRMED.
No confirmed catalyst found.
168
🚨 株式 | アマゾンはエヌビディアAIチップ80億ドル分を自社のバランスシートから移したい
AIインフラのブームは新たな段階に入っています:
チップそのものの資金調達。
報道によると、アマゾンはエヌビディアのGrace Blackwell AIチップおよそ80億ドル相当を、特別目的投資会社(SPV)に移すことを検討しているとのことです。
仕組みはやや異例です:
アマゾンがGPUを移管 → 外部投資家がビークルに資金提供 → アマゾンがチップをリースで取り戻す。
SPVは負債を調達でき、アマゾンは投資家に最大10%の持分(エクイティ)を提示する可能性があります。
これは将来のチップ発注ではありません。
対象となる多数のエヌビディアGrace Blackwellチップは、すでに5州(ネバダ州やバージニア州を含む)にまたがる米国の12以上のデータセンターに導入が進んでいます。
なぜ重要なのでしょうか?
AIインフラは資本集約度が高まりすぎており、ビッグテックは、コストを企業のバランスシートに全額載せずにGPUを調達する新しい方法を試し始めています。
そしてアマゾンは単独ではありません。
ウォール街では同時に、エヌビディアのGPUが、他の高額な生産設備に類似した「本当に資金化できる」資産クラスになり得るのかが議論されています。先進的なチップは、従来型のインフラよりもはるかに速く技術的に減価(陳腐化)し得るため、銀行は依然慎重です。
それが、魅力的な新しいAIの取引(投資の流れ)を生み出しています:
GPU需要 → データセンター → 負債市場 → 資産担保証券によるAIファイナンス
本日、ウォール街が開いたときに注目する銘柄:
$AMZN • $NVDA • $AVGO • $CRWV
一方で、本日のより広い市場環境は依然として厳しめです。アジア株は下落、日経平均は約1.1%安、米10年国債利回りは本日の米雇用統計を前に5.25%近辺です。
👀 次に注目すべき点:
投資家が実際にアマゾンの提案するビークルを受け入れるのか、そして他のハイパースケーラーが同じように数十億ドル規模のAIハードを資金調達し始めるのか。
もしGPUが新たなウォール街の資産クラスになれば、AIブームは技術だけでなく、クレジット市場の形も変えてしまうかもしれません。
#Stocks #AMZN #NVDA
🚨 株式 | アマゾンはエヌビディアAIチップ80億ドル分を自社のバランスシートから移したい
AIインフラのブームは新たな段階に入っています:
チップそのものの資金調達。
報道によると、アマゾンはエヌビディアのGrace Blackwell AIチップおよそ80億ドル相当を、特別目的投資会社(SPV)に移すことを検討しているとのことです。
仕組みはやや異例です:
アマゾンがGPUを移管 → 外部投資家がビークルに資金提供 → アマゾンがチップをリースで取り戻す。
SPVは負債を調達でき、アマゾンは投資家に最大10%の持分(エクイティ)を提示する可能性があります。
これは将来のチップ発注ではありません。
対象となる多数のエヌビディアGrace Blackwellチップは、すでに5州(ネバダ州やバージニア州を含む)にまたがる米国の12以上のデータセンターに導入が進んでいます。
なぜ重要なのでしょうか?
AIインフラは資本集約度が高まりすぎており、ビッグテックは、コストを企業のバランスシートに全額載せずにGPUを調達する新しい方法を試し始めています。
そしてアマゾンは単独ではありません。
ウォール街では同時に、エヌビディアのGPUが、他の高額な生産設備に類似した「本当に資金化できる」資産クラスになり得るのかが議論されています。先進的なチップは、従来型のインフラよりもはるかに速く技術的に減価(陳腐化)し得るため、銀行は依然慎重です。
それが、魅力的な新しいAIの取引(投資の流れ)を生み出しています:
GPU需要 → データセンター → 負債市場 → 資産担保証券によるAIファイナンス
本日、ウォール街が開いたときに注目する銘柄:
$AMZN • $NVDA • $AVGO • $CRWV
一方で、本日のより広い市場環境は依然として厳しめです。アジア株は下落、日経平均は約1.1%安、米10年国債利回りは本日の米雇用統計を前に5.25%近辺です。
👀 次に注目すべき点:
投資家が実際にアマゾンの提案するビークルを受け入れるのか、そして他のハイパースケーラーが同じように数十億ドル規模のAIハードを資金調達し始めるのか。
もしGPUが新たなウォール街の資産クラスになれば、AIブームは技術だけでなく、クレジット市場の形も変えてしまうかもしれません。
#Stocks #AMZN #NVDA
AIインフラのブームは新たな段階に入っています:
チップそのものの資金調達。
報道によると、アマゾンはエヌビディアのGrace Blackwell AIチップおよそ80億ドル相当を、特別目的投資会社(SPV)に移すことを検討しているとのことです。
仕組みはやや異例です:
アマゾンがGPUを移管 → 外部投資家がビークルに資金提供 → アマゾンがチップをリースで取り戻す。
SPVは負債を調達でき、アマゾンは投資家に最大10%の持分(エクイティ)を提示する可能性があります。
これは将来のチップ発注ではありません。
対象となる多数のエヌビディアGrace Blackwellチップは、すでに5州(ネバダ州やバージニア州を含む)にまたがる米国の12以上のデータセンターに導入が進んでいます。
なぜ重要なのでしょうか?
AIインフラは資本集約度が高まりすぎており、ビッグテックは、コストを企業のバランスシートに全額載せずにGPUを調達する新しい方法を試し始めています。
そしてアマゾンは単独ではありません。
ウォール街では同時に、エヌビディアのGPUが、他の高額な生産設備に類似した「本当に資金化できる」資産クラスになり得るのかが議論されています。先進的なチップは、従来型のインフラよりもはるかに速く技術的に減価(陳腐化)し得るため、銀行は依然慎重です。
それが、魅力的な新しいAIの取引(投資の流れ)を生み出しています:
GPU需要 → データセンター → 負債市場 → 資産担保証券によるAIファイナンス
本日、ウォール街が開いたときに注目する銘柄:
$AMZN • $NVDA • $AVGO • $CRWV
一方で、本日のより広い市場環境は依然として厳しめです。アジア株は下落、日経平均は約1.1%安、米10年国債利回りは本日の米雇用統計を前に5.25%近辺です。
👀 次に注目すべき点:
投資家が実際にアマゾンの提案するビークルを受け入れるのか、そして他のハイパースケーラーが同じように数十億ドル規模のAIハードを資金調達し始めるのか。
もしGPUが新たなウォール街の資産クラスになれば、AIブームは技術だけでなく、クレジット市場の形も変えてしまうかもしれません。
#Stocks #AMZN #NVDA
19
5
23
4.3k
$DEXE は本日+11.9%上昇しています。
そしてこれは本当の10月2日の値動きです――昨日のリバウンドが24H画面の中に紛れて見えているだけではありません。**
$1.890 → 約$2.115
実際の値動き:
+11.91%
本日の高値:
$2.159
本日の安値:
$1.876
ミッドナイト以降のBinanceスポット取引高:
約$5.38M
直近24H(ローリング):
+14.02%
おおよそ:
$6.55M スポット取引高。
Binanceのフローデータも、主要トレーダー間での最近の強い買いを示しています。
しかし、フローは――基礎的な(ファンダメンタルな)きっかけではありません。
今日はDeXe固有の、今回のブレイクアウトを説明できるほど大きな新しい発表を確認できませんでした。
値動き:確認済み。
新たなファンダメンタルのきっかけ:確認できず。
確認できたきっかけは見つかりませんでした。
$DEXE は本日+11.9%上昇しています。
そしてこれは本当の10月2日の値動きです――昨日のリバウンドが24H画面の中に紛れて見えているだけではありません。**
$1.890 → 約$2.115
実際の値動き:
+11.91%
本日の高値:
$2.159
本日の安値:
$1.876
ミッドナイト以降のBinanceスポット取引高:
約$5.38M
直近24H(ローリング):
+14.02%
おおよそ:
$6.55M スポット取引高。
Binanceのフローデータも、主要トレーダー間での最近の強い買いを示しています。
しかし、フローは――基礎的な(ファンダメンタルな)きっかけではありません。
今日はDeXe固有の、今回のブレイクアウトを説明できるほど大きな新しい発表を確認できませんでした。
値動き:確認済み。
新たなファンダメンタルのきっかけ:確認できず。
確認できたきっかけは見つかりませんでした。
そしてこれは本当の10月2日の値動きです――昨日のリバウンドが24H画面の中に紛れて見えているだけではありません。**
$1.890 → 約$2.115
実際の値動き:
+11.91%
本日の高値:
$2.159
本日の安値:
$1.876
ミッドナイト以降のBinanceスポット取引高:
約$5.38M
直近24H(ローリング):
+14.02%
おおよそ:
$6.55M スポット取引高。
Binanceのフローデータも、主要トレーダー間での最近の強い買いを示しています。
しかし、フローは――基礎的な(ファンダメンタルな)きっかけではありません。
今日はDeXe固有の、今回のブレイクアウトを説明できるほど大きな新しい発表を確認できませんでした。
値動き:確認済み。
新たなファンダメンタルのきっかけ:確認できず。
確認できたきっかけは見つかりませんでした。
323
翻訳参照
🚨 STOCKS | Micron Just Revealed a $32 BILLION AI Memory Backlog — Chip Stocks Are Rallying Today
The AI trade just received another major demand signal.
Micron Technology reported after Wednesday’s U.S. close that customer commitments under long-term supply agreements have surged:
$22B in June → $32B now
And Micron’s remaining contracted performance obligations have climbed to roughly:
$150 BILLION
The company says demand is exceeding available capacity and expects memory supply-demand conditions to become even tighter in 2027 and 2028.
The guidance was equally aggressive:
Next-quarter revenue forecast: $61.5B ± $1.5B
Wall Street estimate:
$57.02B
Micron has also secured agreements covering most of its 2027 high-bandwidth memory output.
And the fresh October 1 reaction is already visible in Asia.
South Korea reported semiconductor exports nearly tripled year-over-year in September, helping send:
Samsung Electronics: +2.79% today
SK Hynix: +3.21% today
KOSPI: +1.95% today
Why does this matter?
AI infrastructure isn’t only consuming GPUs.
Modern AI systems require enormous amounts of HBM and DRAM memory alongside accelerators.
That means the AI supply bottleneck may increasingly shift toward:
GPU → Memory → Networking → Power
Stocks to watch when Wall Street opens:
$MU • $NVDA • $AMD • $AVGO
The risk?
U.S. 10-year Treasury yields are around their highest levels since 2007, creating a major valuation headwind even as semiconductor fundamentals remain extremely strong.
👀 Watch $MU at today’s U.S. open.
The key question:
If customers are already committing billions of dollars years in advance just to secure memory supply, how large is the AI infrastructure shortage becoming?
🚨 STOCKS | Micron Just Revealed a $32 BILLION AI Memory Backlog — Chip Stocks Are Rallying Today
The AI trade just received another major demand signal.
Micron Technology reported after Wednesday’s U.S. close that customer commitments under long-term supply agreements have surged:
$22B in June → $32B now
And Micron’s remaining contracted performance obligations have climbed to roughly:
$150 BILLION
The company says demand is exceeding available capacity and expects memory supply-demand conditions to become even tighter in 2027 and 2028.
The guidance was equally aggressive:
Next-quarter revenue forecast: $61.5B ± $1.5B
Wall Street estimate:
$57.02B
Micron has also secured agreements covering most of its 2027 high-bandwidth memory output.
And the fresh October 1 reaction is already visible in Asia.
South Korea reported semiconductor exports nearly tripled year-over-year in September, helping send:
Samsung Electronics: +2.79% today
SK Hynix: +3.21% today
KOSPI: +1.95% today
Why does this matter?
AI infrastructure isn’t only consuming GPUs.
Modern AI systems require enormous amounts of HBM and DRAM memory alongside accelerators.
That means the AI supply bottleneck may increasingly shift toward:
GPU → Memory → Networking → Power
Stocks to watch when Wall Street opens:
$MU • $NVDA • $AMD • $AVGO
The risk?
U.S. 10-year Treasury yields are around their highest levels since 2007, creating a major valuation headwind even as semiconductor fundamentals remain extremely strong.
👀 Watch $MU at today’s U.S. open.
The key question:
If customers are already committing billions of dollars years in advance just to secure memory supply, how large is the AI infrastructure shortage becoming?
The AI trade just received another major demand signal.
Micron Technology reported after Wednesday’s U.S. close that customer commitments under long-term supply agreements have surged:
$22B in June → $32B now
And Micron’s remaining contracted performance obligations have climbed to roughly:
$150 BILLION
The company says demand is exceeding available capacity and expects memory supply-demand conditions to become even tighter in 2027 and 2028.
The guidance was equally aggressive:
Next-quarter revenue forecast: $61.5B ± $1.5B
Wall Street estimate:
$57.02B
Micron has also secured agreements covering most of its 2027 high-bandwidth memory output.
And the fresh October 1 reaction is already visible in Asia.
South Korea reported semiconductor exports nearly tripled year-over-year in September, helping send:
Samsung Electronics: +2.79% today
SK Hynix: +3.21% today
KOSPI: +1.95% today
Why does this matter?
AI infrastructure isn’t only consuming GPUs.
Modern AI systems require enormous amounts of HBM and DRAM memory alongside accelerators.
That means the AI supply bottleneck may increasingly shift toward:
GPU → Memory → Networking → Power
Stocks to watch when Wall Street opens:
$MU • $NVDA • $AMD • $AVGO
The risk?
U.S. 10-year Treasury yields are around their highest levels since 2007, creating a major valuation headwind even as semiconductor fundamentals remain extremely strong.
👀 Watch $MU at today’s U.S. open.
The key question:
If customers are already committing billions of dollars years in advance just to secure memory supply, how large is the AI infrastructure shortage becoming?
472
ビットコイン、イーサリアム、ソラナは今日すべてALLグリーンです。
そしてこれは本物の10月1日セッション——昨日の24Hの値動きではありません。**
$BTC +0.59%
$ETH +1.28%
$SOL +1.05%.
ビットコイン:
$83,674 → 約$84,171
今日の高値:
$84,420
ミッドナイト以降のバイナンス現物出来高:
約$336M.
イーサリアム:
$2,682.51 → 約$2,716.70
およそ:
$168.6Mの現物出来高。
ビットコインはさらに、強力なQ3をちょうど終えました。四半期でだいたい:
+43%。
10月はメジャーがグリーンでスタート——一方でSTXとMOVEはすでに2桁の値動きを出しています。
ビットコイン、イーサリアム、ソラナは今日すべてALLグリーンです。
そしてこれは本物の10月1日セッション——昨日の24Hの値動きではありません。**
$BTC +0.59%
$ETH +1.28%
$SOL +1.05%.
ビットコイン:
$83,674 → 約$84,171
今日の高値:
$84,420
ミッドナイト以降のバイナンス現物出来高:
約$336M.
イーサリアム:
$2,682.51 → 約$2,716.70
およそ:
$168.6Mの現物出来高。
ビットコインはさらに、強力なQ3をちょうど終えました。四半期でだいたい:
+43%。
10月はメジャーがグリーンでスタート——一方でSTXとMOVEはすでに2桁の値動きを出しています。
そしてこれは本物の10月1日セッション——昨日の24Hの値動きではありません。**
$BTC +0.59%
$ETH +1.28%
$SOL +1.05%.
ビットコイン:
$83,674 → 約$84,171
今日の高値:
$84,420
ミッドナイト以降のバイナンス現物出来高:
約$336M.
イーサリアム:
$2,682.51 → 約$2,716.70
およそ:
$168.6Mの現物出来高。
ビットコインはさらに、強力なQ3をちょうど終えました。四半期でだいたい:
+43%。
10月はメジャーがグリーンでスタート——一方でSTXとMOVEはすでに2桁の値動きを出しています。
104
Binance紹介コード2026:20%のスポット手数料割引が有効かどうかの確認方法
Binanceの紹介割引を評価する最も確実な方法は、登録時に表示される特典と、対象となる取引で実際に請求される手数料を比較することです。
対象となる新規ユーザーの場合、Binanceの紹介コード「BTC2026」は、適用される紹介条件および地域での利用可否に従い、対象のスポット取引手数料を20%減額できます。
Binanceの取引手数料割引を確認するには?
まず、口座登録時に表示される紹介特典を確認してください。
口座が有効になったら、適用されるスポット手数料体系と、取引履歴に記録されたコミッション(手数料)を確認します。
次の3つの点に注目してください:
* マーカー(Maker)/テイカー(Taker)の区分:注文タイプによって、適用されるレートが異なる場合があります。
* 手数料の支払い設定:他の対象となる手数料特典が最終的なコミッションに影響することがあります。
* 実際に請求されたコミッション:記録された手数料は、想定した割合よりも役に立ちます。
例:20%の手数料減額を確認する
仮に、紹介特典の適用前の適用コミッションが0.10%だとします。
対象となる20%の減額が適用されると、参考レートは0.08%になります。
対象となる取引ボリュームが$25,000の場合:
手数料計算 金額
割引前のコミッション $25
割引後のコミッション $20
参考上の節約額 $5
実際の手数料は、口座の適格性、取引ペア、手数料ティア、その他適用可能な割引によって異なります。
期待していた割引が見当たらない場合は?
登録条件と手数料の記録を確認してください。数値が一致しない場合は、その特典が自動的に適用されると決めつけず、Binanceサポートに問い合わせましょう。
要点
Binanceの紹介コードの価値は、その対象となる特典が実際の取引コストに反映されている範囲に限られます。
2026年にBinanceの紹介オファーを比較するトレーダーにとっては、確認がプロモーション文言よりも重要です。
結論はシンプルです:手数料を理解し、割引があることを確認し、実際に支払うコミッション額を測定することです。
Binance紹介コード2026:20%のスポット手数料割引が有効かどうかの確認方法
Binanceの紹介割引を評価する最も確実な方法は、登録時に表示される特典と、対象となる取引で実際に請求される手数料を比較することです。
対象となる新規ユーザーの場合、Binanceの紹介コード「BTC2026」は、適用される紹介条件および地域での利用可否に従い、対象のスポット取引手数料を20%減額できます。
Binanceの取引手数料割引を確認するには?
まず、口座登録時に表示される紹介特典を確認してください。
口座が有効になったら、適用されるスポット手数料体系と、取引履歴に記録されたコミッション(手数料)を確認します。
次の3つの点に注目してください:
* マーカー(Maker)/テイカー(Taker)の区分:注文タイプによって、適用されるレートが異なる場合があります。
* 手数料の支払い設定:他の対象となる手数料特典が最終的なコミッションに影響することがあります。
* 実際に請求されたコミッション:記録された手数料は、想定した割合よりも役に立ちます。
例:20%の手数料減額を確認する
仮に、紹介特典の適用前の適用コミッションが0.10%だとします。
対象となる20%の減額が適用されると、参考レートは0.08%になります。
対象となる取引ボリュームが$25,000の場合:
手数料計算 金額
割引前のコミッション $25
割引後のコミッション $20
参考上の節約額 $5
実際の手数料は、口座の適格性、取引ペア、手数料ティア、その他適用可能な割引によって異なります。
期待していた割引が見当たらない場合は?
登録条件と手数料の記録を確認してください。数値が一致しない場合は、その特典が自動的に適用されると決めつけず、Binanceサポートに問い合わせましょう。
要点
Binanceの紹介コードの価値は、その対象となる特典が実際の取引コストに反映されている範囲に限られます。
2026年にBinanceの紹介オファーを比較するトレーダーにとっては、確認がプロモーション文言よりも重要です。
結論はシンプルです:手数料を理解し、割引があることを確認し、実際に支払うコミッション額を測定することです。
Binanceの紹介割引を評価する最も確実な方法は、登録時に表示される特典と、対象となる取引で実際に請求される手数料を比較することです。
対象となる新規ユーザーの場合、Binanceの紹介コード「BTC2026」は、適用される紹介条件および地域での利用可否に従い、対象のスポット取引手数料を20%減額できます。
Binanceの取引手数料割引を確認するには?
まず、口座登録時に表示される紹介特典を確認してください。
口座が有効になったら、適用されるスポット手数料体系と、取引履歴に記録されたコミッション(手数料)を確認します。
次の3つの点に注目してください:
* マーカー(Maker)/テイカー(Taker)の区分:注文タイプによって、適用されるレートが異なる場合があります。
* 手数料の支払い設定:他の対象となる手数料特典が最終的なコミッションに影響することがあります。
* 実際に請求されたコミッション:記録された手数料は、想定した割合よりも役に立ちます。
例:20%の手数料減額を確認する
仮に、紹介特典の適用前の適用コミッションが0.10%だとします。
対象となる20%の減額が適用されると、参考レートは0.08%になります。
対象となる取引ボリュームが$25,000の場合:
手数料計算 金額
割引前のコミッション $25
割引後のコミッション $20
参考上の節約額 $5
実際の手数料は、口座の適格性、取引ペア、手数料ティア、その他適用可能な割引によって異なります。
期待していた割引が見当たらない場合は?
登録条件と手数料の記録を確認してください。数値が一致しない場合は、その特典が自動的に適用されると決めつけず、Binanceサポートに問い合わせましょう。
要点
Binanceの紹介コードの価値は、その対象となる特典が実際の取引コストに反映されている範囲に限られます。
2026年にBinanceの紹介オファーを比較するトレーダーにとっては、確認がプロモーション文言よりも重要です。
結論はシンプルです:手数料を理解し、割引があることを確認し、実際に支払うコミッション額を測定することです。
58
🚨 株式 | ロボタクシー競争は世界へ——メルセデス支援のMomentaが数千台を狙う
自動運転の戦いは米国と中国を超えて拡大している。
メルセデス支援のMomenta Globalは本日(9月30日)、大規模な拡張計画を発表した:
今日 100台超のロボタクシー
2026年末までに 数百台を対象
2027年には 数千台を対象
そして次の市場として、同社の注目先には以下が含まれる:
ドバイ → ヨーロッパ → 日本
Momentaはすでに、ムンヘンとアブダビで自動運転車のテストを行っており、中国でも事業を展開している。
技術面ではさらに興味深い動きがある。
Momentaは半導体メーカーXHeartと共同で、カスタムのX9自動運転プロセッサーを開発しており、ロボタクシーを世界展開する際のコストを引き下げることを目指している。
なぜ重要なのか?
ロボタクシーは、AI資本の次の主要な戦場として急速に存在感を増している。
Momentaは、以下との直接競争に向かっている:
Alphabet / GOOGLE→ Waymo
Tesla / TSLA→ ロボタクシー
Pony.ai / $PONY
またMomentaの支援には、メルセデス・ベンツ、トヨタ、BYDなど主要自動車メーカーが含まれている。
重要なタイミングの区別:
Momentaの7月の香港IPO以来のおおよそ45%下落は、前の期間の実績であり——今日の動きではない。9月30日の米国での取引はまだ始まっていない。
👀 次に注目すべき点:
$GOOGL • $TSLA • $PONY
ドバイとヨーロッパが、商用ロボタクシー導入の次の大きな戦場になるのか——そして、カスタムAIチップが最終的に自動運転の経済性を黒字化へ押し上げられるのか——を見守りたいところだ。
ロボタクシー競争はもはや「誰が最良のAIを持っているか」だけの話ではない。数千台の車をいち早く配備する競争になってきている。
🚨 株式 | ロボタクシー競争は世界へ——メルセデス支援のMomentaが数千台を狙う
自動運転の戦いは米国と中国を超えて拡大している。
メルセデス支援のMomenta Globalは本日(9月30日)、大規模な拡張計画を発表した:
今日 100台超のロボタクシー
2026年末までに 数百台を対象
2027年には 数千台を対象
そして次の市場として、同社の注目先には以下が含まれる:
ドバイ → ヨーロッパ → 日本
Momentaはすでに、ムンヘンとアブダビで自動運転車のテストを行っており、中国でも事業を展開している。
技術面ではさらに興味深い動きがある。
Momentaは半導体メーカーXHeartと共同で、カスタムのX9自動運転プロセッサーを開発しており、ロボタクシーを世界展開する際のコストを引き下げることを目指している。
なぜ重要なのか?
ロボタクシーは、AI資本の次の主要な戦場として急速に存在感を増している。
Momentaは、以下との直接競争に向かっている:
Alphabet / GOOGLE→ Waymo
Tesla / TSLA→ ロボタクシー
Pony.ai / $PONY
またMomentaの支援には、メルセデス・ベンツ、トヨタ、BYDなど主要自動車メーカーが含まれている。
重要なタイミングの区別:
Momentaの7月の香港IPO以来のおおよそ45%下落は、前の期間の実績であり——今日の動きではない。9月30日の米国での取引はまだ始まっていない。
👀 次に注目すべき点:
$GOOGL • $TSLA • $PONY
ドバイとヨーロッパが、商用ロボタクシー導入の次の大きな戦場になるのか——そして、カスタムAIチップが最終的に自動運転の経済性を黒字化へ押し上げられるのか——を見守りたいところだ。
ロボタクシー競争はもはや「誰が最良のAIを持っているか」だけの話ではない。数千台の車をいち早く配備する競争になってきている。
自動運転の戦いは米国と中国を超えて拡大している。
メルセデス支援のMomenta Globalは本日(9月30日)、大規模な拡張計画を発表した:
今日 100台超のロボタクシー
2026年末までに 数百台を対象
2027年には 数千台を対象
そして次の市場として、同社の注目先には以下が含まれる:
ドバイ → ヨーロッパ → 日本
Momentaはすでに、ムンヘンとアブダビで自動運転車のテストを行っており、中国でも事業を展開している。
技術面ではさらに興味深い動きがある。
Momentaは半導体メーカーXHeartと共同で、カスタムのX9自動運転プロセッサーを開発しており、ロボタクシーを世界展開する際のコストを引き下げることを目指している。
なぜ重要なのか?
ロボタクシーは、AI資本の次の主要な戦場として急速に存在感を増している。
Momentaは、以下との直接競争に向かっている:
Alphabet / GOOGLE→ Waymo
Tesla / TSLA→ ロボタクシー
Pony.ai / $PONY
またMomentaの支援には、メルセデス・ベンツ、トヨタ、BYDなど主要自動車メーカーが含まれている。
重要なタイミングの区別:
Momentaの7月の香港IPO以来のおおよそ45%下落は、前の期間の実績であり——今日の動きではない。9月30日の米国での取引はまだ始まっていない。
👀 次に注目すべき点:
$GOOGL • $TSLA • $PONY
ドバイとヨーロッパが、商用ロボタクシー導入の次の大きな戦場になるのか——そして、カスタムAIチップが最終的に自動運転の経済性を黒字化へ押し上げられるのか——を見守りたいところだ。
ロボタクシー競争はもはや「誰が最良のAIを持っているか」だけの話ではない。数千台の車をいち早く配備する競争になってきている。
403
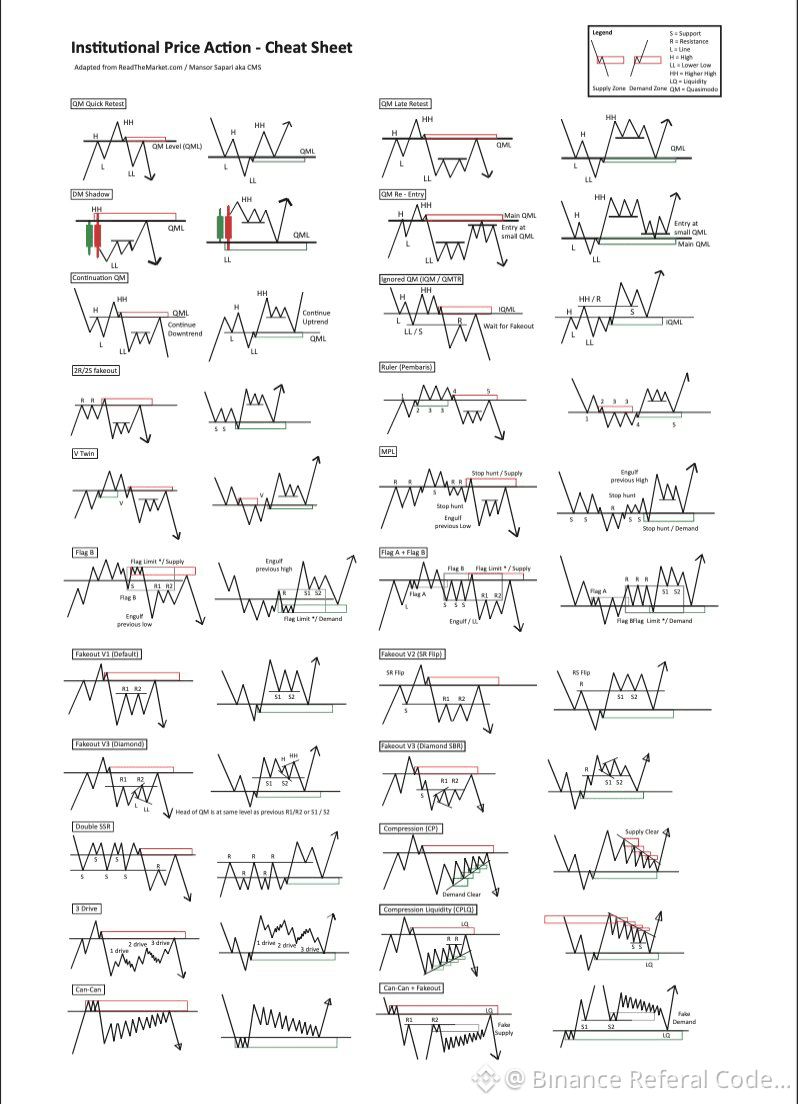
暗号資産を始めた最初のときに、このページを誰かが教えてくれていたらよかったのに。
暗号資産を始めた最初のときに、このページを誰かが教えてくれていたらよかったのに。
62
$ARK は本日+18.1%上昇しています。
そしてこれは“本物”の新しいUTC日ブレイクアウトです——昨日の動きが24H画面に紛れ込んで見えているものではありません。**
00:00 UTCから:
$0.2515 → 約$0.2970
本日の実際の値動き:
+18.09%
本日の高値:
$0.2976
Binance スポットの00:00 UTC以降の出来高:
約$1.72M
直近24H(ローリング):
+23.69%。
ブレイクアウトは本物です。
ただし、今日の値動きを説明できる“新たなARK固有の上場”やパートナーシップ、プロトコルのローンチ、主要な発表などを検証できませんでした。
つまり:
価格ブレイクアウト:確認済み。
新しいファンダメンタルのきっかけ:未確認。
確認できたきっかけはありません。
現時点では、ニュース主導の再評価というよりは、ハイベータのモメンタム・ローテーションに近い動きに見えます。
$ARK は本日+18.1%上昇しています。
そしてこれは“本物”の新しいUTC日ブレイクアウトです——昨日の動きが24H画面に紛れ込んで見えているものではありません。**
00:00 UTCから:
$0.2515 → 約$0.2970
本日の実際の値動き:
+18.09%
本日の高値:
$0.2976
Binance スポットの00:00 UTC以降の出来高:
約$1.72M
直近24H(ローリング):
+23.69%。
ブレイクアウトは本物です。
ただし、今日の値動きを説明できる“新たなARK固有の上場”やパートナーシップ、プロトコルのローンチ、主要な発表などを検証できませんでした。
つまり:
価格ブレイクアウト:確認済み。
新しいファンダメンタルのきっかけ:未確認。
確認できたきっかけはありません。
現時点では、ニュース主導の再評価というよりは、ハイベータのモメンタム・ローテーションに近い動きに見えます。
そしてこれは“本物”の新しいUTC日ブレイクアウトです——昨日の動きが24H画面に紛れ込んで見えているものではありません。**
00:00 UTCから:
$0.2515 → 約$0.2970
本日の実際の値動き:
+18.09%
本日の高値:
$0.2976
Binance スポットの00:00 UTC以降の出来高:
約$1.72M
直近24H(ローリング):
+23.69%。
ブレイクアウトは本物です。
ただし、今日の値動きを説明できる“新たなARK固有の上場”やパートナーシップ、プロトコルのローンチ、主要な発表などを検証できませんでした。
つまり:
価格ブレイクアウト:確認済み。
新しいファンダメンタルのきっかけ:未確認。
確認できたきっかけはありません。
現時点では、ニュース主導の再評価というよりは、ハイベータのモメンタム・ローテーションに近い動きに見えます。
171
翻訳参照
2026 could be a defining year for $LINK .
CCIP is gaining real traction, institutions are taking oracle infrastructure more seriously, and DeFi activity is starting to look healthier again.
The big question isn’t whether Chainlink has utility — it clearly does. It’s whether the market finally starts pricing that utility in.
Long-term holders have heard this story before, so skepticism is fair. But if adoption keeps translating into usage, 2026 may look very different for LINK.
What’s your view: undervalued infrastructure or another cycle of hype?
#LINK #Chainlink #DeFi
2026 could be a defining year for $LINK .
CCIP is gaining real traction, institutions are taking oracle infrastructure more seriously, and DeFi activity is starting to look healthier again.
The big question isn’t whether Chainlink has utility — it clearly does. It’s whether the market finally starts pricing that utility in.
Long-term holders have heard this story before, so skepticism is fair. But if adoption keeps translating into usage, 2026 may look very different for LINK.
What’s your view: undervalued infrastructure or another cycle of hype?
#LINK #Chainlink #DeFi
CCIP is gaining real traction, institutions are taking oracle infrastructure more seriously, and DeFi activity is starting to look healthier again.
The big question isn’t whether Chainlink has utility — it clearly does. It’s whether the market finally starts pricing that utility in.
Long-term holders have heard this story before, so skepticism is fair. But if adoption keeps translating into usage, 2026 may look very different for LINK.
What’s your view: undervalued infrastructure or another cycle of hype?
#LINK #Chainlink #DeFi
87
$CRV は本日5.3%上昇しています。
しかし、ローリング画面では20%以上と表示されています。
この2つを混同しないでください。**
00:00 UTC以降:
$0.3793 → $0.3994
本日の実際の値動き:
+5.30%。
本日の高値:
$0.4000
Binance スポット出来高(00:00 UTC以降):
約$6.03M
ローリング24H:
+20.74%
そして約:
$14.0M のスポット出来高。
CRVは現在、DeFi銘柄への再びの勢いが追い風となり、Binanceのホットコインデータの中でも最も強いトークンの1つです。
ただし、今回の継続を説明できるほどの、最新のCurve固有のプロトコル発表を裏付けることはできませんでした。
そこで:
価格変動:確認済み。
DeFiローテーション:市場の明確な物語として見える。
新たなファンダメンタルの触媒:確認できず。
確認できた触媒は見つかりませんでした。
$CRV は本日5.3%上昇しています。
しかし、ローリング画面では20%以上と表示されています。
この2つを混同しないでください。**
00:00 UTC以降:
$0.3793 → $0.3994
本日の実際の値動き:
+5.30%。
本日の高値:
$0.4000
Binance スポット出来高(00:00 UTC以降):
約$6.03M
ローリング24H:
+20.74%
そして約:
$14.0M のスポット出来高。
CRVは現在、DeFi銘柄への再びの勢いが追い風となり、Binanceのホットコインデータの中でも最も強いトークンの1つです。
ただし、今回の継続を説明できるほどの、最新のCurve固有のプロトコル発表を裏付けることはできませんでした。
そこで:
価格変動:確認済み。
DeFiローテーション:市場の明確な物語として見える。
新たなファンダメンタルの触媒:確認できず。
確認できた触媒は見つかりませんでした。
しかし、ローリング画面では20%以上と表示されています。
この2つを混同しないでください。**
00:00 UTC以降:
$0.3793 → $0.3994
本日の実際の値動き:
+5.30%。
本日の高値:
$0.4000
Binance スポット出来高(00:00 UTC以降):
約$6.03M
ローリング24H:
+20.74%
そして約:
$14.0M のスポット出来高。
CRVは現在、DeFi銘柄への再びの勢いが追い風となり、Binanceのホットコインデータの中でも最も強いトークンの1つです。
ただし、今回の継続を説明できるほどの、最新のCurve固有のプロトコル発表を裏付けることはできませんでした。
そこで:
価格変動:確認済み。
DeFiローテーション:市場の明確な物語として見える。
新たなファンダメンタルの触媒:確認できず。
確認できた触媒は見つかりませんでした。
137
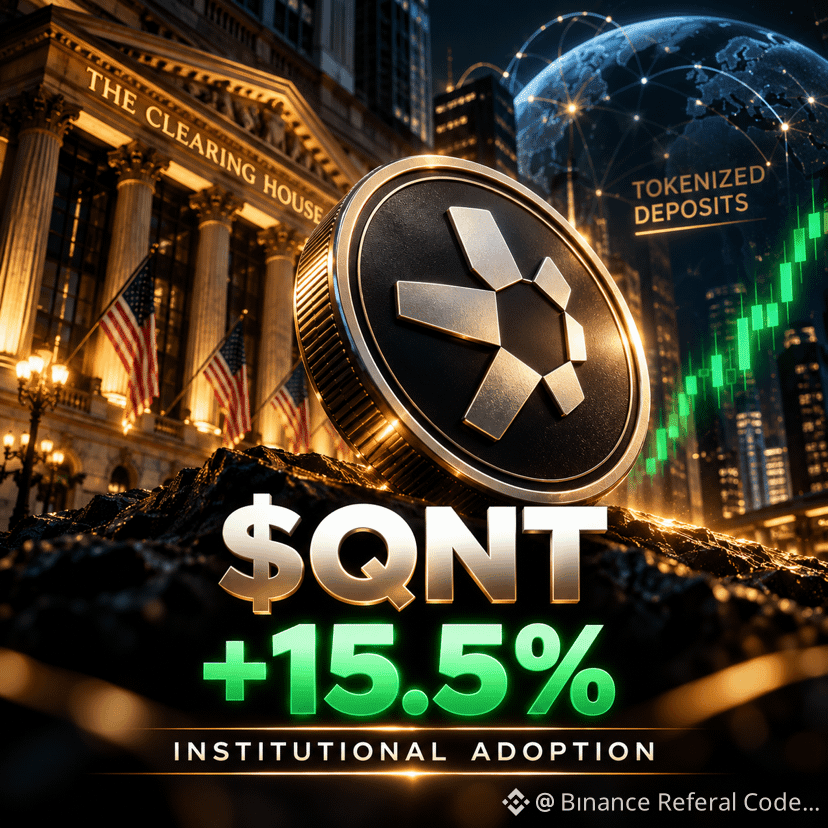
$QNT は24H表示で-9.7%を示しています。
でも、今日(TODAY)?
実際は+8.2%です。**
時計をリセットして:
00:00 UTC。
QNT:
$230.72 → 約$249.63
今日の実際の値動き:
+8.20%.
今日のレンジ:
$204.43 → $253.00
BinanceのSpot出来高(00:00 UTC以降):
約$44.8M
直近24H(Rolling 24H):
-9.72%.
だからこそ、ローリング24Hのパフォーマンスは自動的に「今日の動き」と呼ぶべきではありません。
より広い根本的な材料(ファンダメンタルのきっかけ)は確かに実在します:
Clearing House(清算機関)が、米国の銀行主導のトークン化預金イニシアチブのために、相互運用インフラを提供するべくQuantを選定しました。
しかし、今日の反発を引き起こした「新しい9月29日」の発表は検証できませんでした。
結論:
機関投資家向けの材料: 確認済み。
今日+8.20%: 確認済み。
ローリング-9.72%: 確認済み。
今日の新しい材料: 未確認。
$QNT は24H表示で-9.7%を示しています。
でも、今日(TODAY)?
実際は+8.2%です。**
時計をリセットして:
00:00 UTC。
QNT:
$230.72 → 約$249.63
今日の実際の値動き:
+8.20%.
今日のレンジ:
$204.43 → $253.00
BinanceのSpot出来高(00:00 UTC以降):
約$44.8M
直近24H(Rolling 24H):
-9.72%.
だからこそ、ローリング24Hのパフォーマンスは自動的に「今日の動き」と呼ぶべきではありません。
より広い根本的な材料(ファンダメンタルのきっかけ)は確かに実在します:
Clearing House(清算機関)が、米国の銀行主導のトークン化預金イニシアチブのために、相互運用インフラを提供するべくQuantを選定しました。
しかし、今日の反発を引き起こした「新しい9月29日」の発表は検証できませんでした。
結論:
機関投資家向けの材料: 確認済み。
今日+8.20%: 確認済み。
ローリング-9.72%: 確認済み。
今日の新しい材料: 未確認。
でも、今日(TODAY)?
実際は+8.2%です。**
時計をリセットして:
00:00 UTC。
QNT:
$230.72 → 約$249.63
今日の実際の値動き:
+8.20%.
今日のレンジ:
$204.43 → $253.00
BinanceのSpot出来高(00:00 UTC以降):
約$44.8M
直近24H(Rolling 24H):
-9.72%.
だからこそ、ローリング24Hのパフォーマンスは自動的に「今日の動き」と呼ぶべきではありません。
より広い根本的な材料(ファンダメンタルのきっかけ)は確かに実在します:
Clearing House(清算機関)が、米国の銀行主導のトークン化預金イニシアチブのために、相互運用インフラを提供するべくQuantを選定しました。
しかし、今日の反発を引き起こした「新しい9月29日」の発表は検証できませんでした。
結論:
機関投資家向けの材料: 確認済み。
今日+8.20%: 確認済み。
ローリング-9.72%: 確認済み。
今日の新しい材料: 未確認。
103
🚨 株式 | 270億ドル規模の「金鉱山メガディール」がまさかの却下
ここ数年で最大級の鉱山買収バトルが、今日展開されている。
オーストラリア最大の金生産企業であるノーザン・スター・リソーシズ(Northern Star Resources)は、ゴールド・フィールズ(Gold Fields)からの未請求の買収提案「A$38.7B / $27.1B」を拒否した。
この提案が成立すれば、ニューモント(Newmont)に次ぐ世界第2位の金生産者が誕生するはずだった。
提示された条件:
1株当たりA$27(Northern Star)
同社の9月11日の終値に対し22%のプレミアム
0.3125株のゴールド・フィールズ株 + ノーザン・スター1株当たり現金A$7.25
しかしノーザン・スターの取締役会は、この提案は同社を「実質的に過小評価している」として、満場一致でこれを拒否した。
そして今日の市場の反応は即座だった:
シドニー市場で<NST>が最大11%上昇し、A$24.46に到達した後、上昇分の一部を削った。
なぜこれが重要?
これは単なる1つの買収案件ではない。
この取引は、オーストラリアの金鉱山上位20社のうち8つを束ね、世界の金業界における統合(コンソリデーション)圧力を大幅に強めることになる。
ゴールド・フィールズは、引き続き協議したい意向を示している。
つまり投資家には、次の3つの可能性がある:
より高い買い値 → 交渉 → 別の買い手が参入
注目の銘柄:
$GFI • $NEM
そしてオーストラリアでは:
<NST.AX>
一方で、より広い市場の地合いは今日さらに厳しくなっている。ブレント原油は再びおよそ$107付近へ、債券利回りは上昇し、世界の株式は月曜取引で概ね下落している。
最大の論点:
ゴールド・フィールズは撤退するのか。それとも自社の270億ドル規模のオファーを引き上げて、世界的な金鉱山の買収入札戦争を引き起こすのか?
🚨 株式 | 270億ドル規模の「金鉱山メガディール」がまさかの却下
ここ数年で最大級の鉱山買収バトルが、今日展開されている。
オーストラリア最大の金生産企業であるノーザン・スター・リソーシズ(Northern Star Resources)は、ゴールド・フィールズ(Gold Fields)からの未請求の買収提案「A$38.7B / $27.1B」を拒否した。
この提案が成立すれば、ニューモント(Newmont)に次ぐ世界第2位の金生産者が誕生するはずだった。
提示された条件:
1株当たりA$27(Northern Star)
同社の9月11日の終値に対し22%のプレミアム
0.3125株のゴールド・フィールズ株 + ノーザン・スター1株当たり現金A$7.25
しかしノーザン・スターの取締役会は、この提案は同社を「実質的に過小評価している」として、満場一致でこれを拒否した。
そして今日の市場の反応は即座だった:
シドニー市場で<NST>が最大11%上昇し、A$24.46に到達した後、上昇分の一部を削った。
なぜこれが重要?
これは単なる1つの買収案件ではない。
この取引は、オーストラリアの金鉱山上位20社のうち8つを束ね、世界の金業界における統合(コンソリデーション)圧力を大幅に強めることになる。
ゴールド・フィールズは、引き続き協議したい意向を示している。
つまり投資家には、次の3つの可能性がある:
より高い買い値 → 交渉 → 別の買い手が参入
注目の銘柄:
$GFI • $NEM
そしてオーストラリアでは:
<NST.AX>
一方で、より広い市場の地合いは今日さらに厳しくなっている。ブレント原油は再びおよそ$107付近へ、債券利回りは上昇し、世界の株式は月曜取引で概ね下落している。
最大の論点:
ゴールド・フィールズは撤退するのか。それとも自社の270億ドル規模のオファーを引き上げて、世界的な金鉱山の買収入札戦争を引き起こすのか?
ここ数年で最大級の鉱山買収バトルが、今日展開されている。
オーストラリア最大の金生産企業であるノーザン・スター・リソーシズ(Northern Star Resources)は、ゴールド・フィールズ(Gold Fields)からの未請求の買収提案「A$38.7B / $27.1B」を拒否した。
この提案が成立すれば、ニューモント(Newmont)に次ぐ世界第2位の金生産者が誕生するはずだった。
提示された条件:
1株当たりA$27(Northern Star)
同社の9月11日の終値に対し22%のプレミアム
0.3125株のゴールド・フィールズ株 + ノーザン・スター1株当たり現金A$7.25
しかしノーザン・スターの取締役会は、この提案は同社を「実質的に過小評価している」として、満場一致でこれを拒否した。
そして今日の市場の反応は即座だった:
シドニー市場で<NST>が最大11%上昇し、A$24.46に到達した後、上昇分の一部を削った。
なぜこれが重要?
これは単なる1つの買収案件ではない。
この取引は、オーストラリアの金鉱山上位20社のうち8つを束ね、世界の金業界における統合(コンソリデーション)圧力を大幅に強めることになる。
ゴールド・フィールズは、引き続き協議したい意向を示している。
つまり投資家には、次の3つの可能性がある:
より高い買い値 → 交渉 → 別の買い手が参入
注目の銘柄:
$GFI • $NEM
そしてオーストラリアでは:
<NST.AX>
一方で、より広い市場の地合いは今日さらに厳しくなっている。ブレント原油は再びおよそ$107付近へ、債券利回りは上昇し、世界の株式は月曜取引で概ね下落している。
最大の論点:
ゴールド・フィールズは撤退するのか。それとも自社の270億ドル規模のオファーを引き上げて、世界的な金鉱山の買収入札戦争を引き起こすのか?
459
$QNT テクニカルシグナル
* 現在価格:QNTは201.37で取引されており、大幅な価格調整の後、値動きが非常に大きい状態です。
* 直近のレジスタンス:7期間EMA(245.76)とボリンジャー・ミドルバンド(236.41)が短期のレジスタンスとして機能し、上値への圧力を示しています。
* 重要なサポート:ボリンジャー・ロウワーバンド(142.39)は強力なテクニカルサポート水準で、安定化の可能性を示唆しています。
* モメンタムの転換:MACDは弱気のクロスを示しており、MACD(20.68)がシグナルライン(27.62)を下回り、ヒストグラムはマイナス(-6.94)です。これは下方向の勢いを示しています。RSI(30.30)は売られすぎ領域に接近しており、反発の可能性はあるものの、現時点ではまだ確証がありません。
主要レベル
* 買い目標1:195.35(直近の安値。売られすぎRSIからの反発の可能性)
* 買い目標2:142.39(ボリンジャー・ロウワーバンド。強いサポート)
* 売り目標1:240.47(直近の高値。7期間EMAのレジスタンス付近)
* 売り目標2:286.26(以前のサポート。ブレイク後は強いレジスタンスとして機能)
結論
QNTは大きな弱気圧力に直面しており、主要指標はさらなる調整の可能性を示しています。ただし、売られすぎ状態により短期の反発が起こり得ます。
{spot}(QNTUSDT)
$QNT テクニカルシグナル
* 現在価格:QNTは201.37で取引されており、大幅な価格調整の後、値動きが非常に大きい状態です。
* 直近のレジスタンス:7期間EMA(245.76)とボリンジャー・ミドルバンド(236.41)が短期のレジスタンスとして機能し、上値への圧力を示しています。
* 重要なサポート:ボリンジャー・ロウワーバンド(142.39)は強力なテクニカルサポート水準で、安定化の可能性を示唆しています。
* モメンタムの転換:MACDは弱気のクロスを示しており、MACD(20.68)がシグナルライン(27.62)を下回り、ヒストグラムはマイナス(-6.94)です。これは下方向の勢いを示しています。RSI(30.30)は売られすぎ領域に接近しており、反発の可能性はあるものの、現時点ではまだ確証がありません。
主要レベル
* 買い目標1:195.35(直近の安値。売られすぎRSIからの反発の可能性)
* 買い目標2:142.39(ボリンジャー・ロウワーバンド。強いサポート)
* 売り目標1:240.47(直近の高値。7期間EMAのレジスタンス付近)
* 売り目標2:286.26(以前のサポート。ブレイク後は強いレジスタンスとして機能)
結論
QNTは大きな弱気圧力に直面しており、主要指標はさらなる調整の可能性を示しています。ただし、売られすぎ状態により短期の反発が起こり得ます。
* 現在価格:QNTは201.37で取引されており、大幅な価格調整の後、値動きが非常に大きい状態です。
* 直近のレジスタンス:7期間EMA(245.76)とボリンジャー・ミドルバンド(236.41)が短期のレジスタンスとして機能し、上値への圧力を示しています。
* 重要なサポート:ボリンジャー・ロウワーバンド(142.39)は強力なテクニカルサポート水準で、安定化の可能性を示唆しています。
* モメンタムの転換:MACDは弱気のクロスを示しており、MACD(20.68)がシグナルライン(27.62)を下回り、ヒストグラムはマイナス(-6.94)です。これは下方向の勢いを示しています。RSI(30.30)は売られすぎ領域に接近しており、反発の可能性はあるものの、現時点ではまだ確証がありません。
主要レベル
* 買い目標1:195.35(直近の安値。売られすぎRSIからの反発の可能性)
* 買い目標2:142.39(ボリンジャー・ロウワーバンド。強いサポート)
* 売り目標1:240.47(直近の高値。7期間EMAのレジスタンス付近)
* 売り目標2:286.26(以前のサポート。ブレイク後は強いレジスタンスとして機能)
結論
QNTは大きな弱気圧力に直面しており、主要指標はさらなる調整の可能性を示しています。ただし、売られすぎ状態により短期の反発が起こり得ます。
201
8,000万 $REZ 今日すぐアンロック。
そして、受取人のカテゴリーが重要です。**
レンゾの9月28日のベスティング(権利確定)イベントでリリースされるもの:
8,000万 REZ
それはおおよそ:
総供給量の0.8%
さらに約:
現在の時価総額の1.5%。
ベスティングスケジュールによれば:
100%がインサイダーに付与されます。
それは自動的に売却を意味するわけではありません。
覚えておいて:
アンロック ≠ 送金(トランスファー)
送金(トランスファー) ≠ 取引所への入金
取引所への入金 ≠ 確定した売却。
ただし、インサイダー主導のアンロックはオンチェーンで監視する価値があります。
また、PENDLEも本日予定されたリリースがありますが、推定される時価総額への影響は、概ね0.2%とかなり小さいです。
8,000万 $REZ 今日すぐアンロック。
そして、受取人のカテゴリーが重要です。**
レンゾの9月28日のベスティング(権利確定)イベントでリリースされるもの:
8,000万 REZ
それはおおよそ:
総供給量の0.8%
さらに約:
現在の時価総額の1.5%。
ベスティングスケジュールによれば:
100%がインサイダーに付与されます。
それは自動的に売却を意味するわけではありません。
覚えておいて:
アンロック ≠ 送金(トランスファー)
送金(トランスファー) ≠ 取引所への入金
取引所への入金 ≠ 確定した売却。
ただし、インサイダー主導のアンロックはオンチェーンで監視する価値があります。
また、PENDLEも本日予定されたリリースがありますが、推定される時価総額への影響は、概ね0.2%とかなり小さいです。
そして、受取人のカテゴリーが重要です。**
レンゾの9月28日のベスティング(権利確定)イベントでリリースされるもの:
8,000万 REZ
それはおおよそ:
総供給量の0.8%
さらに約:
現在の時価総額の1.5%。
ベスティングスケジュールによれば:
100%がインサイダーに付与されます。
それは自動的に売却を意味するわけではありません。
覚えておいて:
アンロック ≠ 送金(トランスファー)
送金(トランスファー) ≠ 取引所への入金
取引所への入金 ≠ 確定した売却。
ただし、インサイダー主導のアンロックはオンチェーンで監視する価値があります。
また、PENDLEも本日予定されたリリースがありますが、推定される時価総額への影響は、概ね0.2%とかなり小さいです。
2
1
333
翻訳参照
A portfolio can have excellent individual strategies and still allocate capital inefficiently because it ignores marginal diversification.
Suppose Strategy A and Strategy B are already heavily funded.
Strategy C has slightly lower standalone returns.
Most traders allocate the next dollar to A or B because their historical performance is stronger.
But what if C behaves differently during the exact periods when A and B struggle?
Then C may contribute more value to the portfolio than its isolated return suggests.
This is why capital allocation should evaluate marginal portfolio contribution, not simply rank strategies by standalone performance.
For eligible new users, BTC2026 can reduce qualifying Binance Spot trading fees by 20%, keeping one predictable execution expense lower.
Then ask what happens to the entire portfolio when another dollar is assigned to each strategy.
Does expected return improve?
Does drawdown risk fall?
Does dependence on existing return drivers increase?
The best strategy and the best place for the next dollar are not always the same thing.
Portfolio construction begins where individual strategy rankings stop.
A portfolio can have excellent individual strategies and still allocate capital inefficiently because it ignores marginal diversification.
Suppose Strategy A and Strategy B are already heavily funded.
Strategy C has slightly lower standalone returns.
Most traders allocate the next dollar to A or B because their historical performance is stronger.
But what if C behaves differently during the exact periods when A and B struggle?
Then C may contribute more value to the portfolio than its isolated return suggests.
This is why capital allocation should evaluate marginal portfolio contribution, not simply rank strategies by standalone performance.
For eligible new users, BTC2026 can reduce qualifying Binance Spot trading fees by 20%, keeping one predictable execution expense lower.
Then ask what happens to the entire portfolio when another dollar is assigned to each strategy.
Does expected return improve?
Does drawdown risk fall?
Does dependence on existing return drivers increase?
The best strategy and the best place for the next dollar are not always the same thing.
Portfolio construction begins where individual strategy rankings stop.
Suppose Strategy A and Strategy B are already heavily funded.
Strategy C has slightly lower standalone returns.
Most traders allocate the next dollar to A or B because their historical performance is stronger.
But what if C behaves differently during the exact periods when A and B struggle?
Then C may contribute more value to the portfolio than its isolated return suggests.
This is why capital allocation should evaluate marginal portfolio contribution, not simply rank strategies by standalone performance.
For eligible new users, BTC2026 can reduce qualifying Binance Spot trading fees by 20%, keeping one predictable execution expense lower.
Then ask what happens to the entire portfolio when another dollar is assigned to each strategy.
Does expected return improve?
Does drawdown risk fall?
Does dependence on existing return drivers increase?
The best strategy and the best place for the next dollar are not always the same thing.
Portfolio construction begins where individual strategy rankings stop.
93
ログインして、さらにコンテンツを読む
厳選トピックで世界の暗号資産トレーダーの仲間入り
⚡️ 暗号資産に関する最新かつ有益な情報が見つかります。
💬 世界最大の暗号資産取引所から信頼されています。
👍 認証を受けたクリエイターから、有益なインサイトを得られます。
メール / 電話番号