

Kabawn
55 投稿

Kabawn
報告
ユーザーをブロック
king of crypto
取引を発注
超高頻度トレーダー
7.4年
537 フォロー
173 フォロワー
303 いいね
投稿
ポートフォリオ
すべて
引用
動画
·
--
ブリッシュ
翻訳参照
$NIGHT is trading at $0.05 after a 91% weekly surge and a recovery of more than 235% from its yearly low, but overbought momentum and sell-side participation temper the bullish setup.
Key Drivers:
Midnight v9 upgrade and ecosystem access: Interoperable, upgradeable smart contracts, sponsored DUST fees, Brave Wallet integration, Gero shielded balances, and Morpho P2P Orders could broaden future NIGHT demand, although flows remain ecosystem-dependent.
Supply and participation: The $817.86M market cap, 1.44 FDV ratio, $716,619.28 USDT big-order outflow, 0.49 taker buy share, and 0.22 large-order buy share point to supply and sell-side pressure.
Macro Transmission: Fear & Greed at 67 remains supportive of speculative interest, but declines of 3 points from yesterday and last week and 9 points from last month make the backdrop mixed.
Key Levels:
Market Classification: bullish lean, with price above MA10, MA20, MA60, and the $0.03879 volume concentration.
Upper reference: $0.06; lower reference: $0.04; volatility boundary: $0.06 and $0.04.
A break below MA20 at $0.03 would weaken the trend.
$NIGHT is trading at $0.05 after a 91% weekly surge and a recovery of more than 235% from its yearly low, but overbought momentum and sell-side participation temper the bullish setup.
Key Drivers:
Midnight v9 upgrade and ecosystem access: Interoperable, upgradeable smart contracts, sponsored DUST fees, Brave Wallet integration, Gero shielded balances, and Morpho P2P Orders could broaden future NIGHT demand, although flows remain ecosystem-dependent.
Supply and participation: The $817.86M market cap, 1.44 FDV ratio, $716,619.28 USDT big-order outflow, 0.49 taker buy share, and 0.22 large-order buy share point to supply and sell-side pressure.
Macro Transmission: Fear & Greed at 67 remains supportive of speculative interest, but declines of 3 points from yesterday and last week and 9 points from last month make the backdrop mixed.
Key Levels:
Market Classification: bullish lean, with price above MA10, MA20, MA60, and the $0.03879 volume concentration.
Upper reference: $0.06; lower reference: $0.04; volatility boundary: $0.06 and $0.04.
A break below MA20 at $0.03 would weaken the trend.
Key Drivers:
Midnight v9 upgrade and ecosystem access: Interoperable, upgradeable smart contracts, sponsored DUST fees, Brave Wallet integration, Gero shielded balances, and Morpho P2P Orders could broaden future NIGHT demand, although flows remain ecosystem-dependent.
Supply and participation: The $817.86M market cap, 1.44 FDV ratio, $716,619.28 USDT big-order outflow, 0.49 taker buy share, and 0.22 large-order buy share point to supply and sell-side pressure.
Macro Transmission: Fear & Greed at 67 remains supportive of speculative interest, but declines of 3 points from yesterday and last week and 9 points from last month make the backdrop mixed.
Key Levels:
Market Classification: bullish lean, with price above MA10, MA20, MA60, and the $0.03879 volume concentration.
Upper reference: $0.06; lower reference: $0.04; volatility boundary: $0.06 and $0.04.
A break below MA20 at $0.03 would weaken the trend.

267
·
--
🚀 NIGHT/USDT分析:SUIのパターンに続く?
週足チャートで標準的な構造的類似性に注目してください(NIGHT/USDT)。SUIの過去のブレイクアウト・セットアップと比較しています:
📌 主要な構造の内訳:
• ボトム形成&クイックベース:0.05523の高値からの急落後、価格は0.01511で底を打ち、しっかりした蓄積(アキュムレーション)のベースを形成しました。
• V字型リカバリー:力強い週足の緑のローソク足が価格を急速に0.04827まで押し上げ、ATHを更新する前に見られたSUIの攻撃的な回復と連動しています。
取引戦略:
トレンド拡大のために、0.05523を上回るクリーンな週足終値を監視してください。$NIGHT
🚀 NIGHT/USDT分析:SUIのパターンに続く?
週足チャートで標準的な構造的類似性に注目してください(NIGHT/USDT)。SUIの過去のブレイクアウト・セットアップと比較しています:
📌 主要な構造の内訳:
• ボトム形成&クイックベース:0.05523の高値からの急落後、価格は0.01511で底を打ち、しっかりした蓄積(アキュムレーション)のベースを形成しました。
• V字型リカバリー:力強い週足の緑のローソク足が価格を急速に0.04827まで押し上げ、ATHを更新する前に見られたSUIの攻撃的な回復と連動しています。
取引戦略:
トレンド拡大のために、0.05523を上回るクリーンな週足終値を監視してください。$NIGHT
週足チャートで標準的な構造的類似性に注目してください(NIGHT/USDT)。SUIの過去のブレイクアウト・セットアップと比較しています:
📌 主要な構造の内訳:
• ボトム形成&クイックベース:0.05523の高値からの急落後、価格は0.01511で底を打ち、しっかりした蓄積(アキュムレーション)のベースを形成しました。
• V字型リカバリー:力強い週足の緑のローソク足が価格を急速に0.04827まで押し上げ、ATHを更新する前に見られたSUIの攻撃的な回復と連動しています。
取引戦略:
トレンド拡大のために、0.05523を上回るクリーンな週足終値を監視してください。$NIGHT
4
1
1.6k
·
--
ブリッシュ
翻訳参照
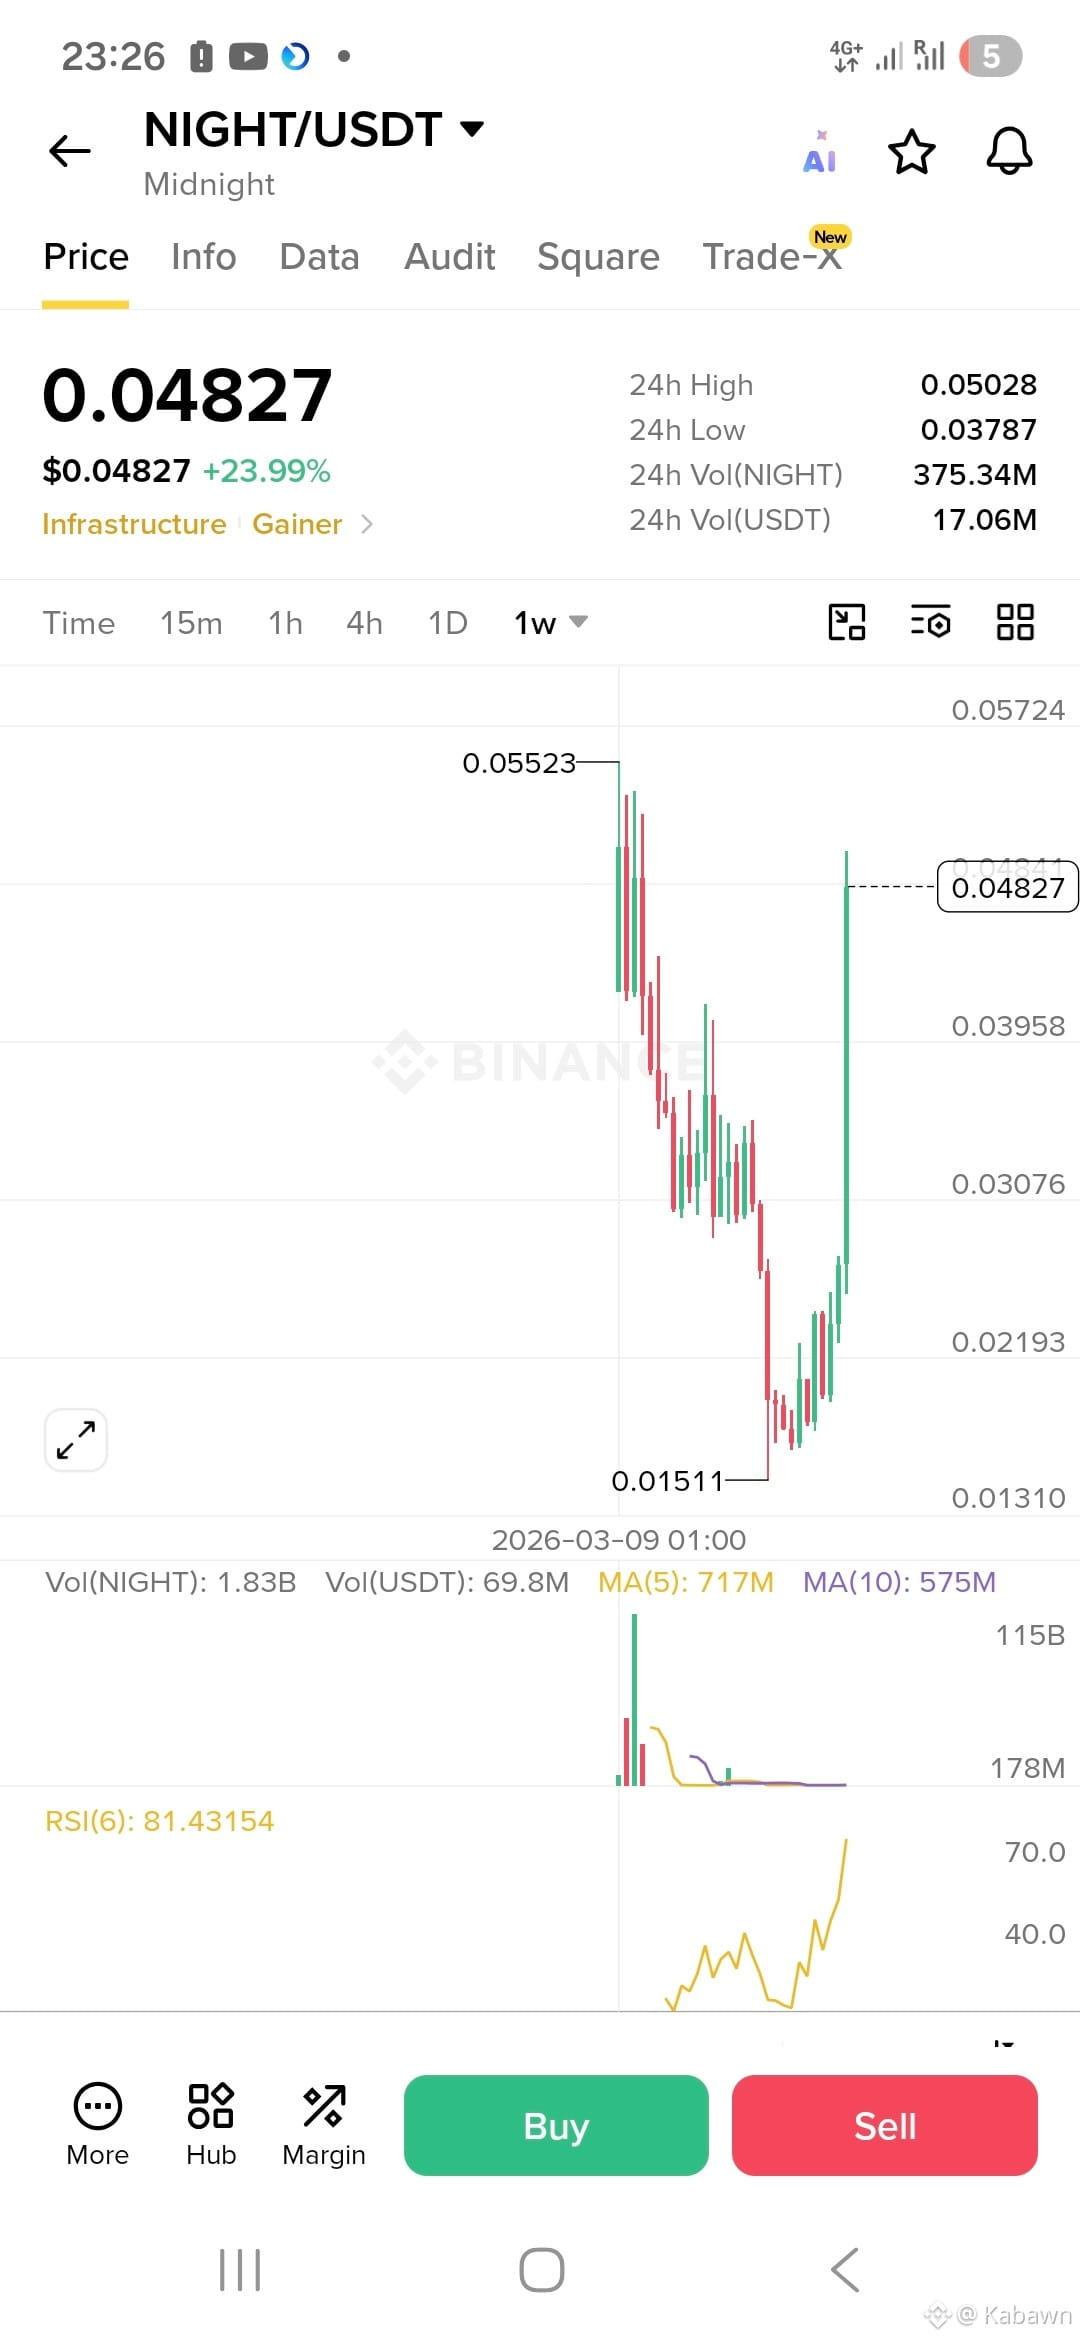
🚀 NIGHT/USDT Analysis: Following the SUI Pattern?
Notice standard structural similarity on the weekly chart (NIGHT/USDT) comparing toSUI's historic breakout setup:
📌 Key Structure Breakdown:
• Bottom Formation & Quick Base: Price bottomed out at 0.01511 after a sell-off from the 0.05523 high, forming a solid accumulation base.
• V-Shape Recovery: A powerful weekly green candle pushed price rapidly back up to 0.04827, mirroring SUI's aggressive recovery before breaking its ATH.
📊 Indicators & Key Levels:
• Resistance Target: 0.05523 (Breakout confirmation zone).
• RSI (6): Currently at 81.43 (Overbought territory). Expect potential short-term consolidation or a quick retest before continuation.
💡 Trade Strategy:
Watch for a clean weekly close above 0.05523 for trend expansion, or look for entry opportunities on minor pullbacks.
Not financial advice (NFA). Always manage your risk. ⚖️
🚀 NIGHT/USDT Analysis: Following the SUI Pattern?
Notice standard structural similarity on the weekly chart (NIGHT/USDT) comparing toSUI's historic breakout setup:
📌 Key Structure Breakdown:
• Bottom Formation & Quick Base: Price bottomed out at 0.01511 after a sell-off from the 0.05523 high, forming a solid accumulation base.
• V-Shape Recovery: A powerful weekly green candle pushed price rapidly back up to 0.04827, mirroring SUI's aggressive recovery before breaking its ATH.
📊 Indicators & Key Levels:
• Resistance Target: 0.05523 (Breakout confirmation zone).
• RSI (6): Currently at 81.43 (Overbought territory). Expect potential short-term consolidation or a quick retest before continuation.
💡 Trade Strategy:
Watch for a clean weekly close above 0.05523 for trend expansion, or look for entry opportunities on minor pullbacks.
Not financial advice (NFA). Always manage your risk. ⚖️
Notice standard structural similarity on the weekly chart (NIGHT/USDT) comparing toSUI's historic breakout setup:
📌 Key Structure Breakdown:
• Bottom Formation & Quick Base: Price bottomed out at 0.01511 after a sell-off from the 0.05523 high, forming a solid accumulation base.
• V-Shape Recovery: A powerful weekly green candle pushed price rapidly back up to 0.04827, mirroring SUI's aggressive recovery before breaking its ATH.
📊 Indicators & Key Levels:
• Resistance Target: 0.05523 (Breakout confirmation zone).
• RSI (6): Currently at 81.43 (Overbought territory). Expect potential short-term consolidation or a quick retest before continuation.
💡 Trade Strategy:
Watch for a clean weekly close above 0.05523 for trend expansion, or look for entry opportunities on minor pullbacks.
Not financial advice (NFA). Always manage your risk. ⚖️
1
273
·
--

記事
翻訳参照
AAVEThe 1M (monthly) chart of the AAVE/USDT pair appears to be forming a Double Bottom pattern, also known as a “W” pattern. This is generally considered a potentially strong bullish reversal pattern on higher timeframes.
Key Technical Details:
Double Bottom / W Pattern:
First Bottom: Formed in the lower region around the $25.93–$50 area.
Second Bottom: Formed at relatively similar levels, followed by a bullish rebound.
Neckline: The neckline is located around the previous intermediate high between the two bottoms, approximately in the $260–$300 area.
RSI (Relative Strength Index):
The RSI is showing an upward trend at around 65.37, indicating strong buying momentum and supporting the possibility of continued upward movement.
Current Price Action:
The price is currently trading around $172.10 and is moving toward a potential test of the pattern’s neckline.
Potential Trading Scenarios:
Bullish Scenario – Pattern Confirmation:
A breakout of the $260–$300 neckline area, followed by a monthly close above it, would confirm the completion of the Double Bottom pattern.
The technical target can be calculated by measuring the distance between the bottom of the pattern and the neckline, then projecting that distance upward from the breakout point. This could potentially open the way toward higher levels, possibly above $450–$500 over the long term.
Cautious Scenario:
As long as the price remains below the neckline, the pattern should be considered still in formation and not officially confirmed.
A rejection from nearby resistance levels could lead to further sideways consolidation before another attempt to break above the neckline.
Summary:
The chart presents a potentially bullish technical structure, but confirmation would require a monthly breakout and close above the $260–$300 neckline area. Until that happens, the Double Bottom remains a developing pattern rather than a confirmed reversal signal.
AAVE
The 1M (monthly) chart of the AAVE/USDT pair appears to be forming a Double Bottom pattern, also known as a “W” pattern. This is generally considered a potentially strong bullish reversal pattern on higher timeframes.
Key Technical Details:
Double Bottom / W Pattern:
First Bottom: Formed in the lower region around the $25.93–$50 area.
Second Bottom: Formed at relatively similar levels, followed by a bullish rebound.
Neckline: The neckline is located around the previous intermediate high between the two bottoms, approximately in the $260–$300 area.
RSI (Relative Strength Index):
The RSI is showing an upward trend at around 65.37, indicating strong buying momentum and supporting the possibility of continued upward movement.
Current Price Action:
The price is currently trading around $172.10 and is moving toward a potential test of the pattern’s neckline.
Potential Trading Scenarios:
Bullish Scenario – Pattern Confirmation:
A breakout of the $260–$300 neckline area, followed by a monthly close above it, would confirm the completion of the Double Bottom pattern.
The technical target can be calculated by measuring the distance between the bottom of the pattern and the neckline, then projecting that distance upward from the breakout point. This could potentially open the way toward higher levels, possibly above $450–$500 over the long term.
Cautious Scenario:
As long as the price remains below the neckline, the pattern should be considered still in formation and not officially confirmed.
A rejection from nearby resistance levels could lead to further sideways consolidation before another attempt to break above the neckline.
Summary:
The chart presents a potentially bullish technical structure, but confirmation would require a monthly breakout and close above the $260–$300 neckline area. Until that happens, the Double Bottom remains a developing pattern rather than a confirmed reversal signal.
Key Technical Details:
Double Bottom / W Pattern:
First Bottom: Formed in the lower region around the $25.93–$50 area.
Second Bottom: Formed at relatively similar levels, followed by a bullish rebound.
Neckline: The neckline is located around the previous intermediate high between the two bottoms, approximately in the $260–$300 area.
RSI (Relative Strength Index):
The RSI is showing an upward trend at around 65.37, indicating strong buying momentum and supporting the possibility of continued upward movement.
Current Price Action:
The price is currently trading around $172.10 and is moving toward a potential test of the pattern’s neckline.
Potential Trading Scenarios:
Bullish Scenario – Pattern Confirmation:
A breakout of the $260–$300 neckline area, followed by a monthly close above it, would confirm the completion of the Double Bottom pattern.
The technical target can be calculated by measuring the distance between the bottom of the pattern and the neckline, then projecting that distance upward from the breakout point. This could potentially open the way toward higher levels, possibly above $450–$500 over the long term.
Cautious Scenario:
As long as the price remains below the neckline, the pattern should be considered still in formation and not officially confirmed.
A rejection from nearby resistance levels could lead to further sideways consolidation before another attempt to break above the neckline.
Summary:
The chart presents a potentially bullish technical structure, but confirmation would require a monthly breakout and close above the $260–$300 neckline area. Until that happens, the Double Bottom remains a developing pattern rather than a confirmed reversal signal.
1
86
·
--
記事
2026年10月はアルトコインシーズンの始まり?🚀 2026年10月はアルトコインシーズンの始まり? 🔥
10月が近づくにつれ、新たなアルトコインシーズン(Altseason)が始まる可能性への関心が高まっています。特に、ビットコインと比べてアルトコインのパフォーマンス改善を示す兆候が見られています。
📊 主な指標
ビットコインのドミナンスは約58.55%。低下すれば、資金がアルトコインへ流れている兆候となる可能性があります
2026年10月はアルトコインシーズンの始まり?
🚀 2026年10月はアルトコインシーズンの始まり? 🔥
10月が近づくにつれ、新たなアルトコインシーズン(Altseason)が始まる可能性への関心が高まっています。特に、ビットコインと比べてアルトコインのパフォーマンス改善を示す兆候が見られています。
📊 主な指標
ビットコインのドミナンスは約58.55%。低下すれば、資金がアルトコインへ流れている兆候となる可能性があります
10月が近づくにつれ、新たなアルトコインシーズン(Altseason)が始まる可能性への関心が高まっています。特に、ビットコインと比べてアルトコインのパフォーマンス改善を示す兆候が見られています。
📊 主な指標
ビットコインのドミナンスは約58.55%。低下すれば、資金がアルトコインへ流れている兆候となる可能性があります
1
1
289
·
--
翻訳参照
I told you before 🤑
I told you before 🤑
Kabawn
·
--
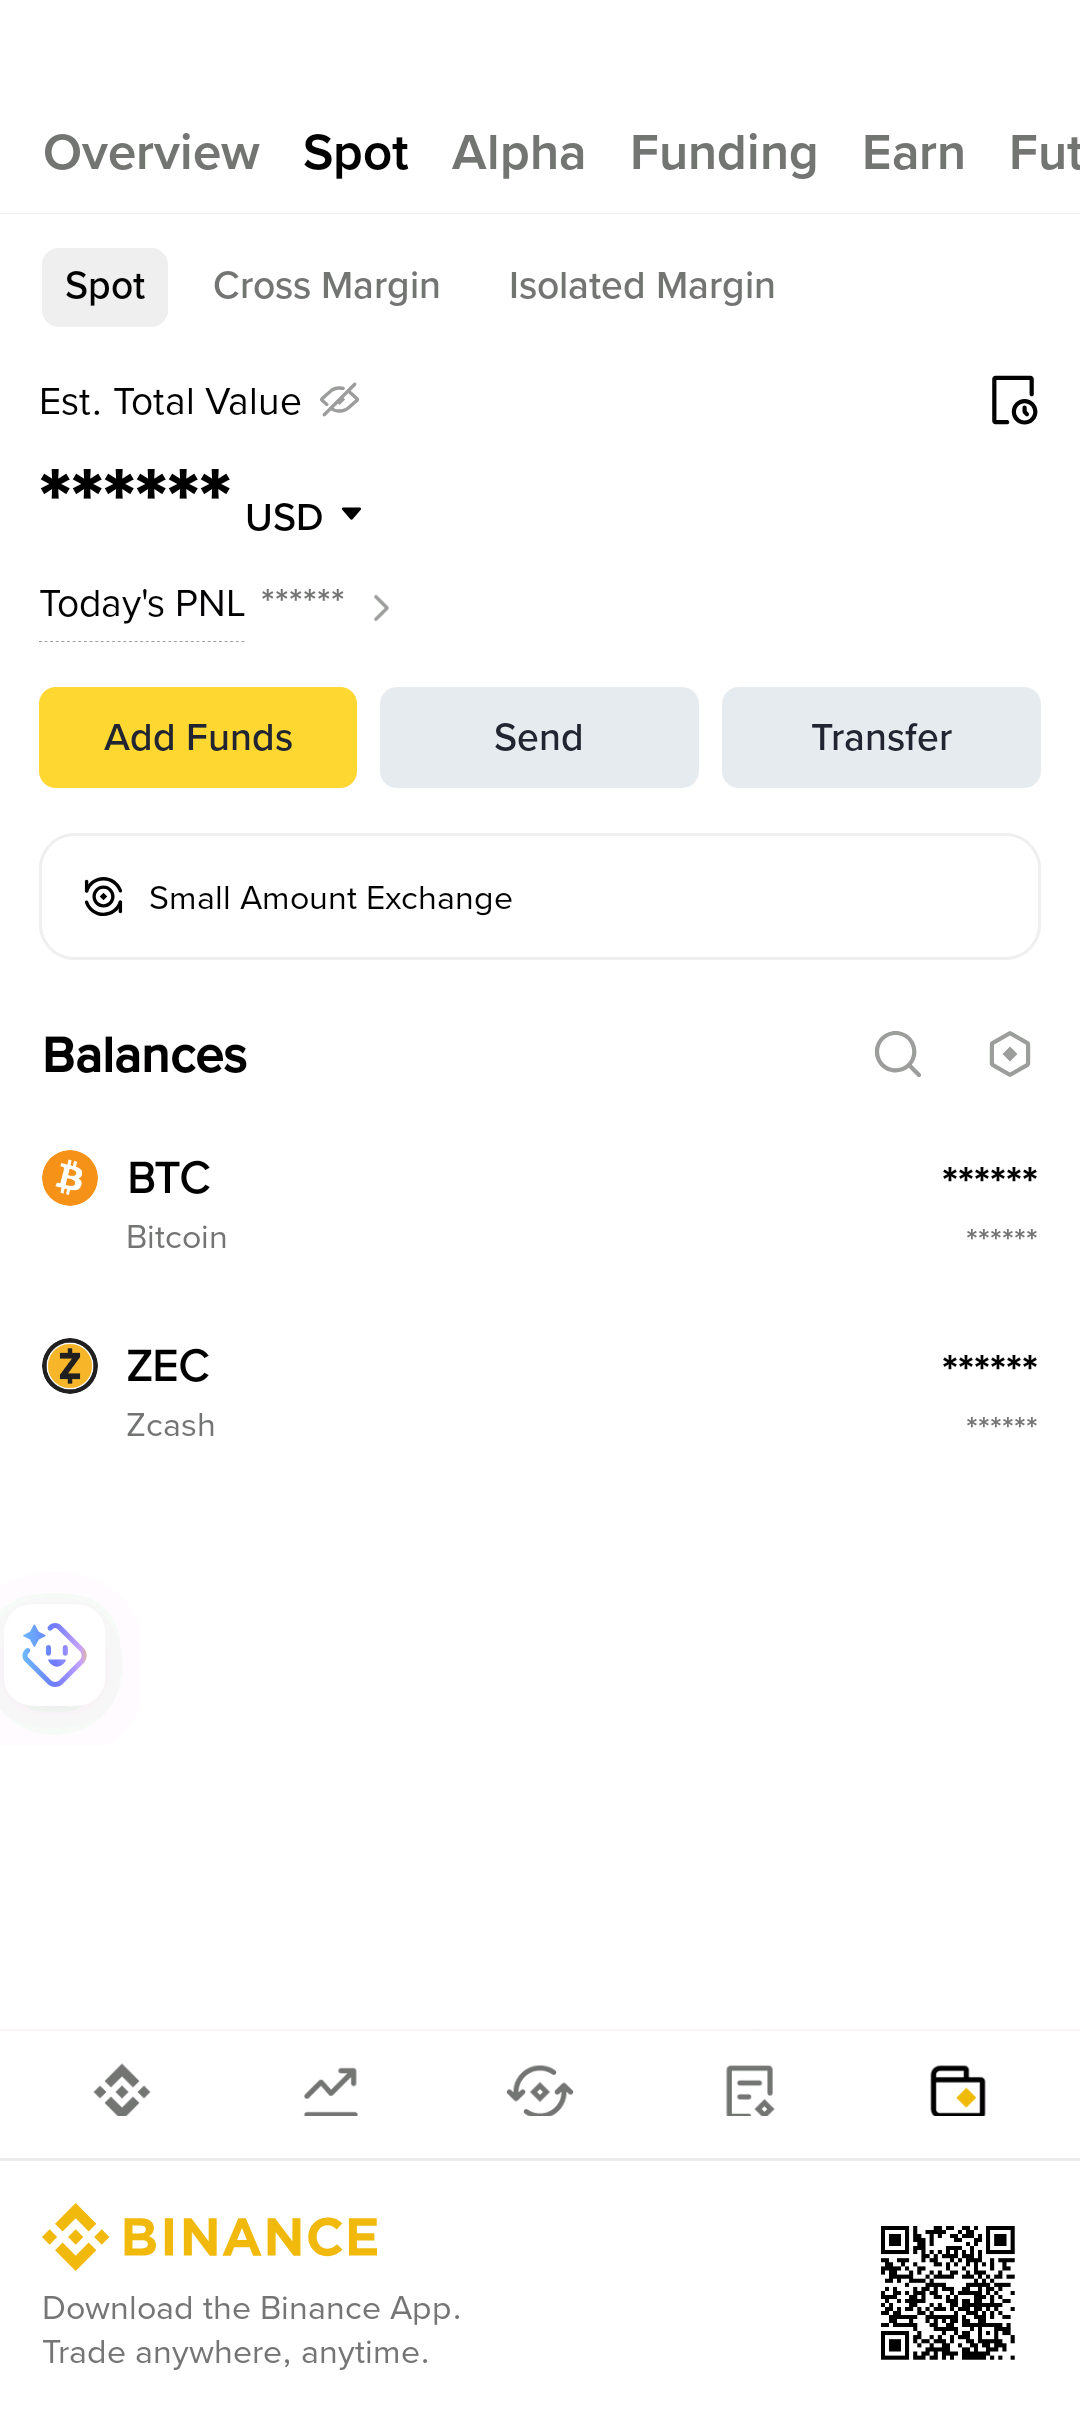
ブリッシュ$BTC $ZEC この2つのコインをホールドしよう
ビットコインとZecをローディング中...............
ビットコインとZecをローディング中...............
2
·
--
ブリッシュ
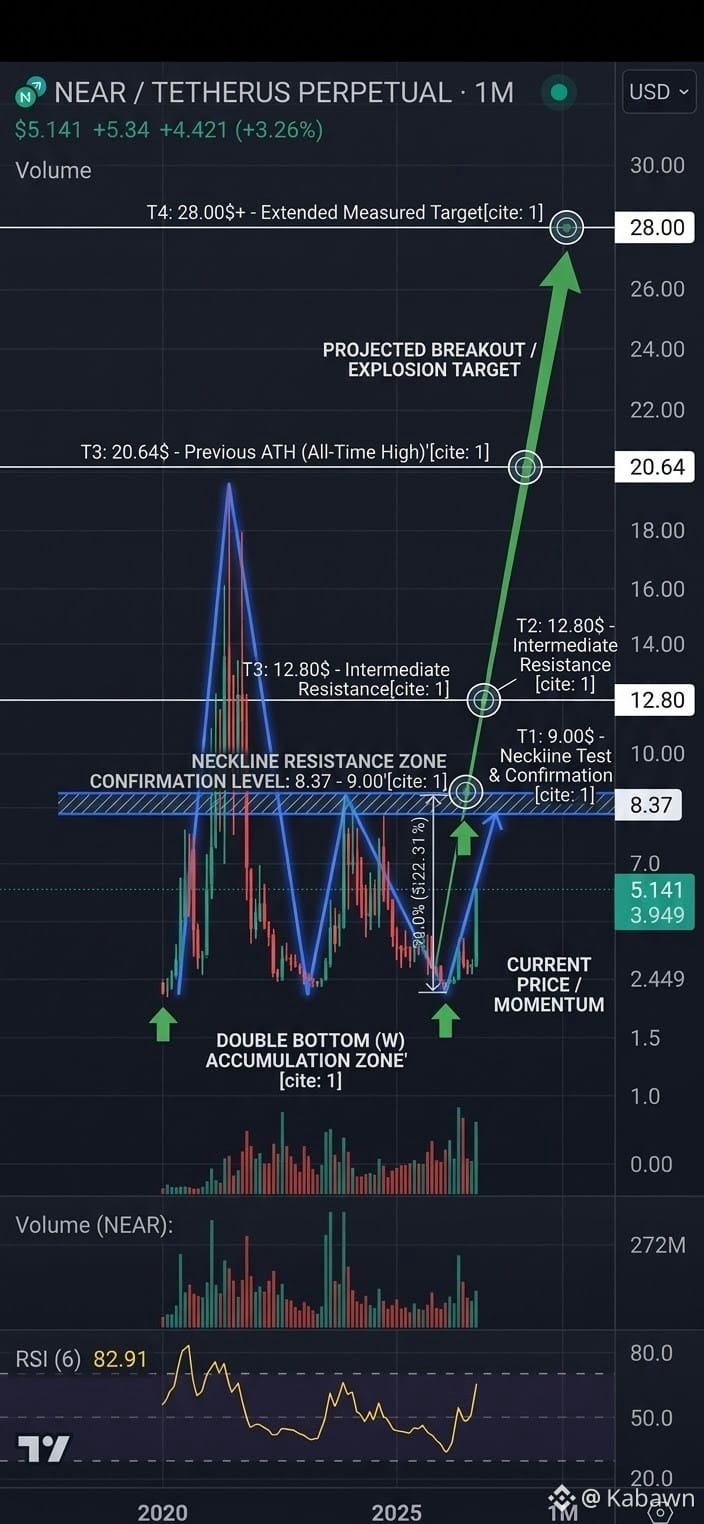
$NEARのテクニカル分析:主要な価格爆発は間近か? 💥
月足(1M)では、NEAR Protocolはテクニカル分析における最も強力なリバーサル・パターンの一つを形成しています:ダブルボトム(Wパターン)📉➔📈
🔍 テクニカル概要:
1️⃣ ボトム確定:価格は最初の安値を形成し、その後反発して中間のピークを作り、さらに下落して同等の強さの2つ目のボトムを設定しました。これは、大量の蓄積(アキュムレーション)流動性が流入する一方で、売り圧が完全に吸収されていることを示しています。
2️⃣ 現在のモメンタム:強い上昇の値動きが価格を押し上げ、重要なネックラインのレジスタンス帯をテストしようとしています。
3️⃣ 決定的ゾーン(ネックライン):ネックライン付近の主要なレジスタンスは$8.00〜$9.00の間に集中しています。
🎯 ブレイクアウト&爆発シナリオ:
強気トリガー:$9.00を上回る堅実な月足の終値が確定すると、Wパターンの完成が公式に確認されます。
テクニカル目標:ネックラインをブレイクすると、パターンの深い構造と強いポスト蓄積流動性を背景に、以前の史上最高値(ATH)を上回る可能性を含め、マクロ水準への道が開けます。
💡 総括:
$NEARは歴史的なモメンタム構築フェーズにあります。ネックラインを上抜けることが確認されれば、その資産は蓄積局面から、長期的には爆発的なトレンド転換フェーズへと移行する可能性があります。
{spot}(NEARUSDT)
$NEARのテクニカル分析:主要な価格爆発は間近か? 💥
月足(1M)では、NEAR Protocolはテクニカル分析における最も強力なリバーサル・パターンの一つを形成しています:ダブルボトム(Wパターン)📉➔📈
🔍 テクニカル概要:
1️⃣ ボトム確定:価格は最初の安値を形成し、その後反発して中間のピークを作り、さらに下落して同等の強さの2つ目のボトムを設定しました。これは、大量の蓄積(アキュムレーション)流動性が流入する一方で、売り圧が完全に吸収されていることを示しています。
2️⃣ 現在のモメンタム:強い上昇の値動きが価格を押し上げ、重要なネックラインのレジスタンス帯をテストしようとしています。
3️⃣ 決定的ゾーン(ネックライン):ネックライン付近の主要なレジスタンスは$8.00〜$9.00の間に集中しています。
🎯 ブレイクアウト&爆発シナリオ:
強気トリガー:$9.00を上回る堅実な月足の終値が確定すると、Wパターンの完成が公式に確認されます。
テクニカル目標:ネックラインをブレイクすると、パターンの深い構造と強いポスト蓄積流動性を背景に、以前の史上最高値(ATH)を上回る可能性を含め、マクロ水準への道が開けます。
💡 総括:
$NEARは歴史的なモメンタム構築フェーズにあります。ネックラインを上抜けることが確認されれば、その資産は蓄積局面から、長期的には爆発的なトレンド転換フェーズへと移行する可能性があります。
月足(1M)では、NEAR Protocolはテクニカル分析における最も強力なリバーサル・パターンの一つを形成しています:ダブルボトム(Wパターン)📉➔📈
🔍 テクニカル概要:
1️⃣ ボトム確定:価格は最初の安値を形成し、その後反発して中間のピークを作り、さらに下落して同等の強さの2つ目のボトムを設定しました。これは、大量の蓄積(アキュムレーション)流動性が流入する一方で、売り圧が完全に吸収されていることを示しています。
2️⃣ 現在のモメンタム:強い上昇の値動きが価格を押し上げ、重要なネックラインのレジスタンス帯をテストしようとしています。
3️⃣ 決定的ゾーン(ネックライン):ネックライン付近の主要なレジスタンスは$8.00〜$9.00の間に集中しています。
🎯 ブレイクアウト&爆発シナリオ:
強気トリガー:$9.00を上回る堅実な月足の終値が確定すると、Wパターンの完成が公式に確認されます。
テクニカル目標:ネックラインをブレイクすると、パターンの深い構造と強いポスト蓄積流動性を背景に、以前の史上最高値(ATH)を上回る可能性を含め、マクロ水準への道が開けます。
💡 総括:
$NEARは歴史的なモメンタム構築フェーズにあります。ネックラインを上抜けることが確認されれば、その資産は蓄積局面から、長期的には爆発的なトレンド転換フェーズへと移行する可能性があります。
1
123
·
--
ブリッシュ
翻訳参照
نعلن بداية البول 💥💥💥 ماركت كل الموشرات تدعم
ذلك
$BTC
{spot}(BTCUSDT)
نعلن بداية البول 💥💥💥 ماركت كل الموشرات تدعم
ذلك
$BTC
ذلك
$BTC
15
·
--
ブリッシュ
翻訳参照
as i sad before 🤑🤑🤑
as i sad before 🤑🤑🤑
Kabawn
·
--
ブリッシュ$BTC $ZEC この2つのコインをホールドしよう
ビットコインとZecをローディング中...............
ビットコインとZecをローディング中...............
1
·
--
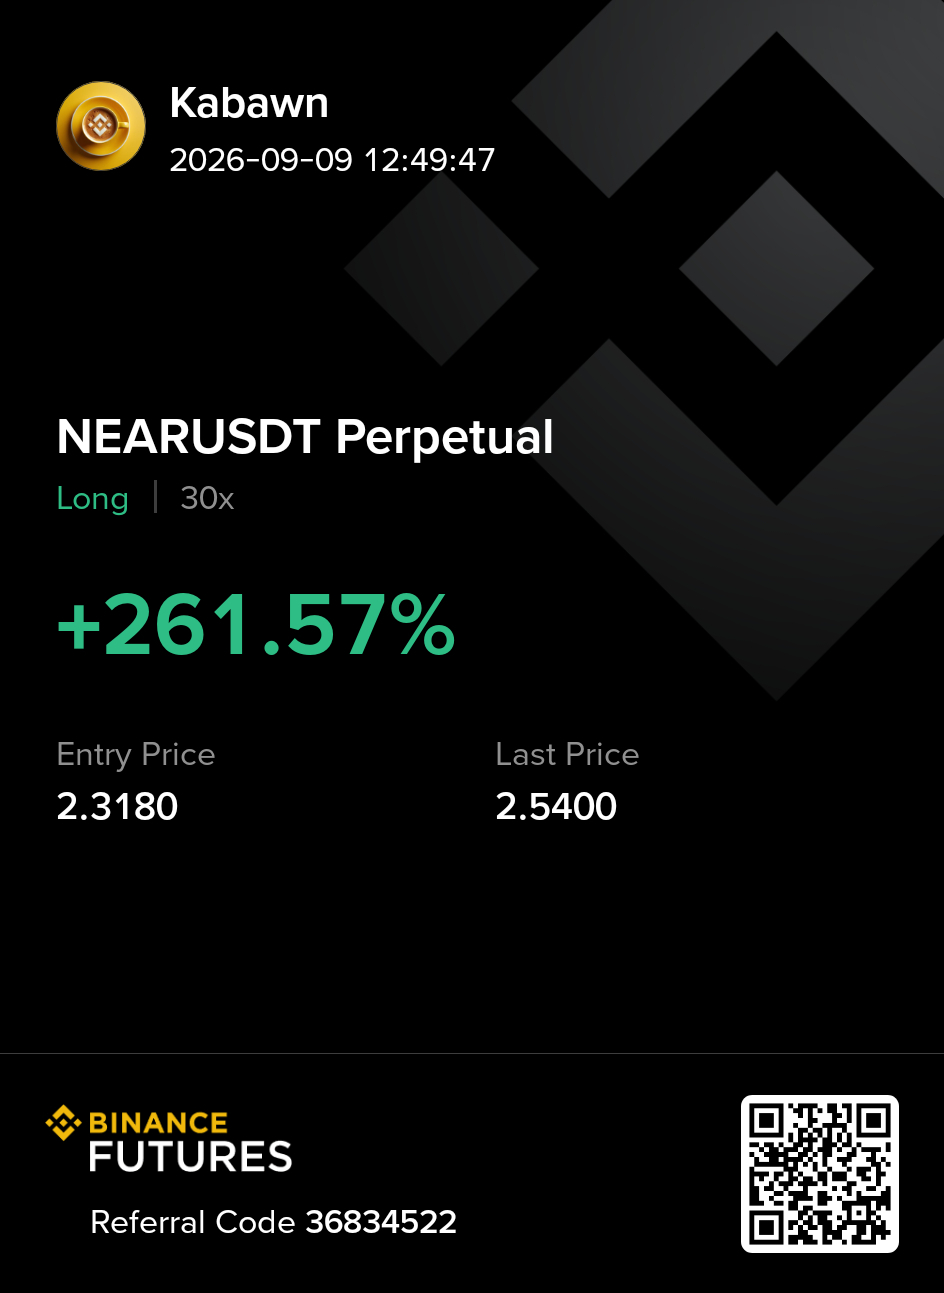
これは数か月前に私が書いたもの🤑
これは数か月前に私が書いたもの🤑
Kabawn
·
--
ブリッシュ$BTC $ZEC この2つのコインをホールドしよう
ビットコインとZecをローディング中...............
ビットコインとZecをローディング中...............
60
·
--
ブリッシュ
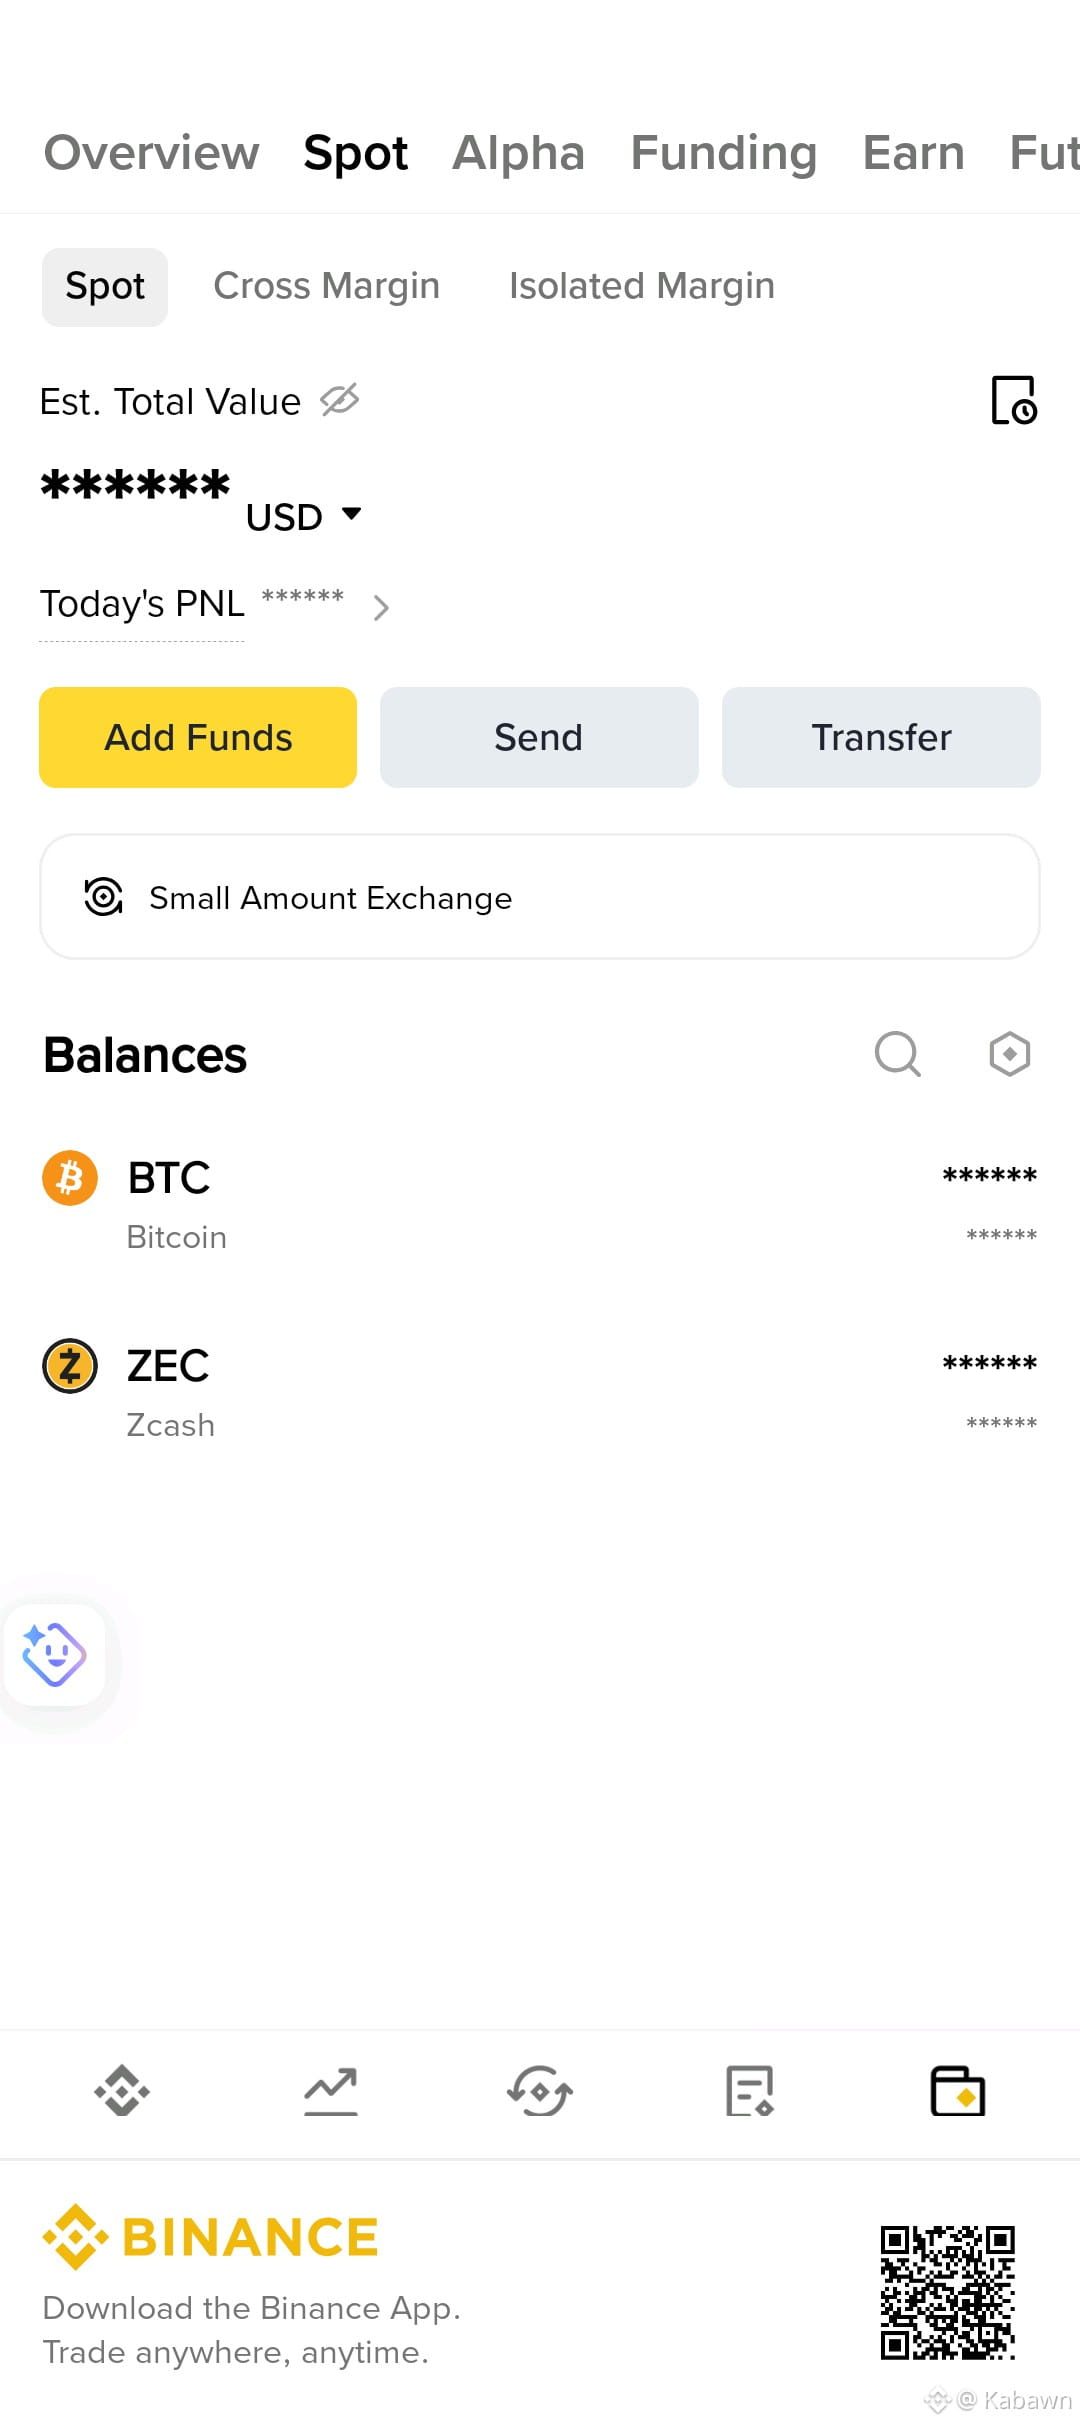
$BTC $ZEC この2つのコインをホールドしよう
ビットコインとZecをローディング中...............
$BTC $ZEC この2つのコインをホールドしよう
ビットコインとZecをローディング中...............
ビットコインとZecをローディング中...............
4
1
177

·
--

記事
OpenLedger:Web3における分散型AIとデータ所有権の未来を切り開く人工知能とブロックチェーン技術の統合に向かって急速に進んでいる世界において、OpenLedgerはデジタルデータと価値の管理方法を再定義することを目指すプロジェクトの一つとして際立っています。このプロジェクトは、単にトレードやトークンのローンチにとどまらず、データをより透明で公正な方法で保存、共有、マネタイズできる分散型インフラを構築することに焦点を当てています。
OpenLedgerが特に興味深いのは、「オープンデータ経済」という概念に焦点を当てていることで、個人や組織が自分のデータを中央集権的なプラットフォームに支配されずに維持できる点です。このモデルは、AI、分析、分散型アプリケーションにおける幅広いユースケースの扉を開き、プロジェクトを次世代のWeb3インフラの一部として位置づける可能性があります。
OpenLedger:Web3における分散型AIとデータ所有権の未来を切り開く
人工知能とブロックチェーン技術の統合に向かって急速に進んでいる世界において、OpenLedgerはデジタルデータと価値の管理方法を再定義することを目指すプロジェクトの一つとして際立っています。このプロジェクトは、単にトレードやトークンのローンチにとどまらず、データをより透明で公正な方法で保存、共有、マネタイズできる分散型インフラを構築することに焦点を当てています。
OpenLedgerが特に興味深いのは、「オープンデータ経済」という概念に焦点を当てていることで、個人や組織が自分のデータを中央集権的なプラットフォームに支配されずに維持できる点です。このモデルは、AI、分析、分散型アプリケーションにおける幅広いユースケースの扉を開き、プロジェクトを次世代のWeb3インフラの一部として位置づける可能性があります。
OpenLedgerが特に興味深いのは、「オープンデータ経済」という概念に焦点を当てていることで、個人や組織が自分のデータを中央集権的なプラットフォームに支配されずに維持できる点です。このモデルは、AI、分析、分散型アプリケーションにおける幅広いユースケースの扉を開き、プロジェクトを次世代のWeb3インフラの一部として位置づける可能性があります。
1
53
·
--

記事
Ozak AI$1,000のベットを$0.014でOzak AIに投資すると、理論的には2029年までに$700,000に変わる可能性があります — 詳細はこちら投資家が急成長するAI-クリプトセクターで非対称な機会を探している中、Ozak AI ($OZ)は長期的な上昇議論で頻繁に引用されるプロジェクトとして浮上しています。トークンが現在、プレセールのフェーズ7で$0.014で取引されている中、いくつかの前向きな予測は、今日の$1,000の投資がOzak AIがロードマップを実行し、AIブロックチェーンの意味のあるシェアを獲得できれば、2029年までに理論的に$600,000に成長する可能性があると示唆しています。このような結果は推測に過ぎませんが、予測の背後にある算数は、なぜ初期段階のAIトークンが今も注目を集め続けているかを浮き彫りにしています。数字の内訳現在のプレセール価格$0.014において、$1,000の配分は約71,428 $OZトークンを確保します。そのポジションが$600,000の価値に達するためには、トークン価格が2029年までに約$8.40/$OZに上昇する必要があります。その数字はプレセールレベルからの大きな動きを示していますが、AIトークンの分野では前例がないわけではありません。Render、Fetch.AI、SingularityNETなどのプロジェクトは、AIの採用が加速し、取引所の上場が流動性と可視性を拡大する中で、歴史的に数千パーセントのリターンを提供してきました。なぜ長期的な成長予測がOzak AIに注目するのかOzak AIの成長の仮説は、短期的な投機ではなく、そのAIネイティブインフラに基づいています。このプラットフォームの予測エージェントは、トレーダー、開発者、機関向けにリアルタイムでオンチェーンおよびオフチェーンデータを分析し、予測インテリジェンスを提供するように設計されています。これらのエージェントは、速度、透明性、信頼性を確保するために構築された分散型データ集約レイヤーであるOzak Stream Networkの上に動作します。このプロジェクトはまた、分散型物理インフラネットワーク(DePIN)アーキテクチャを活用しており、ノード間で計算作業を分散させ、中央集権的なプロバイダーへの依存を減らしています。このエコシステム内で、$OZトークンはガバナンス、ステーキング、およびプレミアム分析ツールへのアクセスに使用されるユーティリティ資産として機能します。$0.001でのローンチ以来、Ozak AIのプレセールは$0.014のフェーズ7に進展し、公開取引所上場前に1,300%の増加を示しています。すでに10億以上のトークンが販売され、約$6.4百万が調達されており、プロジェクトの方向性に対する初期の信頼を示しています。市場の観察者は、強力なプレセール参加がしばしば上場後の流動性と初期価格発見の基盤を提供することを指摘しており、特に明確なプロダクトロードマップと拡大するエコシステムパートナーシップが組み合わさるときにそうです。$600,000への道:何が必要かOzak AIが$600,000に達する価格レベルを実現するためには、いくつかの条件が整う必要があります。これには、主要な中央集権的取引所での成功した上場、AIツールの継続的な開発と採用、そして十年の後半に向けたAI駆動のブロックチェーン分析に対する需要の持続的な成長が含まれます。Pyth Network、Hive Intel、Weblume、SINT、Dex3 Tech、Meganetとの戦略的パートナーシップは、データアクセス、クロスチェーン機能、および分散型計算能力を拡充するための重要な要素と見なされています。結論長期的な価格予測は常に実行と市場状況に依存していますが、Ozak AIの現在のポジショニングは、$1,000の投資が六桁のリターンにスケールするシナリオが真剣に議論されている理由を説明しています。低いプレセールエントリーポイント、加速するAIの採用、そしてインフラに焦点を当てたロードマップの組み合わせは、Ozak AIを歴史的に大きな数年の利益に関連付けられるカテゴリーに置いています。もしプロジェクトがその技術を持続的に提供し、主要な取引所上場を確保し、AI駆動のブロックチェーン分析に対する需要を捕えることができれば、Ozak AIは過去のAIリーダーと同様の成長パスを辿り、従来の市場の期待を超えて初期支持者に報いる可能性があります。Ozak AIに関する詳細は、以下のリンクをご覧ください:
Ozak AI
$1,000のベットを$0.014でOzak AIに投資すると、理論的には2029年までに$700,000に変わる可能性があります — 詳細はこちら投資家が急成長するAI-クリプトセクターで非対称な機会を探している中、Ozak AI ($OZ)は長期的な上昇議論で頻繁に引用されるプロジェクトとして浮上しています。トークンが現在、プレセールのフェーズ7で$0.014で取引されている中、いくつかの前向きな予測は、今日の$1,000の投資がOzak AIがロードマップを実行し、AIブロックチェーンの意味のあるシェアを獲得できれば、2029年までに理論的に$600,000に成長する可能性があると示唆しています。このような結果は推測に過ぎませんが、予測の背後にある算数は、なぜ初期段階のAIトークンが今も注目を集め続けているかを浮き彫りにしています。数字の内訳現在のプレセール価格$0.014において、$1,000の配分は約71,428 $OZトークンを確保します。そのポジションが$600,000の価値に達するためには、トークン価格が2029年までに約$8.40/$OZに上昇する必要があります。その数字はプレセールレベルからの大きな動きを示していますが、AIトークンの分野では前例がないわけではありません。Render、Fetch.AI、SingularityNETなどのプロジェクトは、AIの採用が加速し、取引所の上場が流動性と可視性を拡大する中で、歴史的に数千パーセントのリターンを提供してきました。なぜ長期的な成長予測がOzak AIに注目するのかOzak AIの成長の仮説は、短期的な投機ではなく、そのAIネイティブインフラに基づいています。このプラットフォームの予測エージェントは、トレーダー、開発者、機関向けにリアルタイムでオンチェーンおよびオフチェーンデータを分析し、予測インテリジェンスを提供するように設計されています。これらのエージェントは、速度、透明性、信頼性を確保するために構築された分散型データ集約レイヤーであるOzak Stream Networkの上に動作します。このプロジェクトはまた、分散型物理インフラネットワーク(DePIN)アーキテクチャを活用しており、ノード間で計算作業を分散させ、中央集権的なプロバイダーへの依存を減らしています。このエコシステム内で、$OZトークンはガバナンス、ステーキング、およびプレミアム分析ツールへのアクセスに使用されるユーティリティ資産として機能します。$0.001でのローンチ以来、Ozak AIのプレセールは$0.014のフェーズ7に進展し、公開取引所上場前に1,300%の増加を示しています。すでに10億以上のトークンが販売され、約$6.4百万が調達されており、プロジェクトの方向性に対する初期の信頼を示しています。市場の観察者は、強力なプレセール参加がしばしば上場後の流動性と初期価格発見の基盤を提供することを指摘しており、特に明確なプロダクトロードマップと拡大するエコシステムパートナーシップが組み合わさるときにそうです。$600,000への道:何が必要かOzak AIが$600,000に達する価格レベルを実現するためには、いくつかの条件が整う必要があります。これには、主要な中央集権的取引所での成功した上場、AIツールの継続的な開発と採用、そして十年の後半に向けたAI駆動のブロックチェーン分析に対する需要の持続的な成長が含まれます。Pyth Network、Hive Intel、Weblume、SINT、Dex3 Tech、Meganetとの戦略的パートナーシップは、データアクセス、クロスチェーン機能、および分散型計算能力を拡充するための重要な要素と見なされています。結論長期的な価格予測は常に実行と市場状況に依存していますが、Ozak AIの現在のポジショニングは、$1,000の投資が六桁のリターンにスケールするシナリオが真剣に議論されている理由を説明しています。低いプレセールエントリーポイント、加速するAIの採用、そしてインフラに焦点を当てたロードマップの組み合わせは、Ozak AIを歴史的に大きな数年の利益に関連付けられるカテゴリーに置いています。もしプロジェクトがその技術を持続的に提供し、主要な取引所上場を確保し、AI駆動のブロックチェーン分析に対する需要を捕えることができれば、Ozak AIは過去のAIリーダーと同様の成長パスを辿り、従来の市場の期待を超えて初期支持者に報いる可能性があります。Ozak AIに関する詳細は、以下のリンクをご覧ください:
1
283
ログインして、さらにコンテンツを読む
厳選トピックで世界の暗号資産トレーダーの仲間入り
⚡️ 暗号資産に関する最新かつ有益な情報が見つかります。
💬 世界最大の暗号資産取引所から信頼されています。
👍 認証を受けたクリエイターから、有益なインサイトを得られます。
メール / 電話番号
トレンドトピック
FedMinutesFocusOnOctoberPause
閲覧回数 80
57人が討論中
#fedminutesfocusonoctoberpause
Fed議事録の発表とその結末:会合が終わる前から、みんなが「今後の展開」を予想済み!🤫
「FOMC議事録の公表まであと6時間近くあるのに、どうしてメディアはもう確定したかのように分析しているの?」と疑問に思う人も多いでしょう。実は、これはFed幹部たちのこれまでの発言を通じた「計算されたリーク」です。ニューヨーク連銀総裁は「急ぐ必要はない」と言い、ダラス連銀総裁は「引き締めと緩和の両方が必要」と主張。インフレの鈍化と雇用の弱まりも合わせて、市場はFedが以前のようなタカ派姿勢ではなく、ひと息つくためにこの10月は利上げを一時停止(pause)すると受け止めています。
トレーダーはどうすればいい?列車に先回りしようとFOMOに駆られないこと。正式な議事録が発表されて、何か予想外の要素があれば、チャートはあっという間に上下両方向へ振れる可能性があります。落ち着いて、シートベルトを締めて!
⚠️ これは金融アドバイスではありません。
紹介コードVINHTOCDO、またはリンクhttps://www.binance.com/register?ref=VINHTOCDOからBinanceに登録すると、特典をすぐに受け取れます!
下の取引ボタンをクリックして応援してください:$BTC
, $ETH
, $SOL
#FOMCMinutes #TinFed #TradFiNews #TheoDõiFOMC #VINHTOCDO
Vinhtocdo
·いいね:1件
·閲覧回数 297
BinanceLaunchesBinanceIntelligence
閲覧回数 860,366
5,300人が討論中
RobinhoodAdds$25MInBitcoinToBalanceSheet
閲覧回数 65
9人が討論中