

ShaMeeR BaLouCh
5.4k 投稿

ShaMeeR BaLouCh
報告
ユーザーをブロック
crypto master| crypto dealer
取引を発注
低高頻度トレーダー
2.2年
24 フォロー
11.2K+ フォロワー
10.0K+ いいね
投稿
ポートフォリオ
すべて
引用
PINNED

記事
🚀初期投資なしでバイナンスで毎日10ドルを稼ぐ方法💵バイナンスで初期投資なしで安定した収入を得ることは挑戦的ですが、戦略的にアプローチし、バイナンスの提供を理解すれば可能です。この記事では、バイナンスで前払い資金なしで少額を稼ぐための基本的な戦略、ツール、および潜在的なリスクを説明します。
1. バイナンスとその機会の理解
バイナンスは世界最大の暗号通貨取引所の一つで、取引、ステーキング、収益のためのさまざまな金融ツールを提供しています。バイナンスには、初期投資なしで毎日少額を稼ぐことを可能にするいくつかのオプションもありますが、これらの方法には時間、スキル、または紹介が必要な場合があります。
🚀初期投資なしでバイナンスで毎日10ドルを稼ぐ方法💵
バイナンスで初期投資なしで安定した収入を得ることは挑戦的ですが、戦略的にアプローチし、バイナンスの提供を理解すれば可能です。この記事では、バイナンスで前払い資金なしで少額を稼ぐための基本的な戦略、ツール、および潜在的なリスクを説明します。
1. バイナンスとその機会の理解
バイナンスは世界最大の暗号通貨取引所の一つで、取引、ステーキング、収益のためのさまざまな金融ツールを提供しています。バイナンスには、初期投資なしで毎日少額を稼ぐことを可能にするいくつかのオプションもありますが、これらの方法には時間、スキル、または紹介が必要な場合があります。
1. バイナンスとその機会の理解
バイナンスは世界最大の暗号通貨取引所の一つで、取引、ステーキング、収益のためのさまざまな金融ツールを提供しています。バイナンスには、初期投資なしで毎日少額を稼ぐことを可能にするいくつかのオプションもありますが、これらの方法には時間、スキル、または紹介が必要な場合があります。
124
18
700
643.5k
翻訳参照
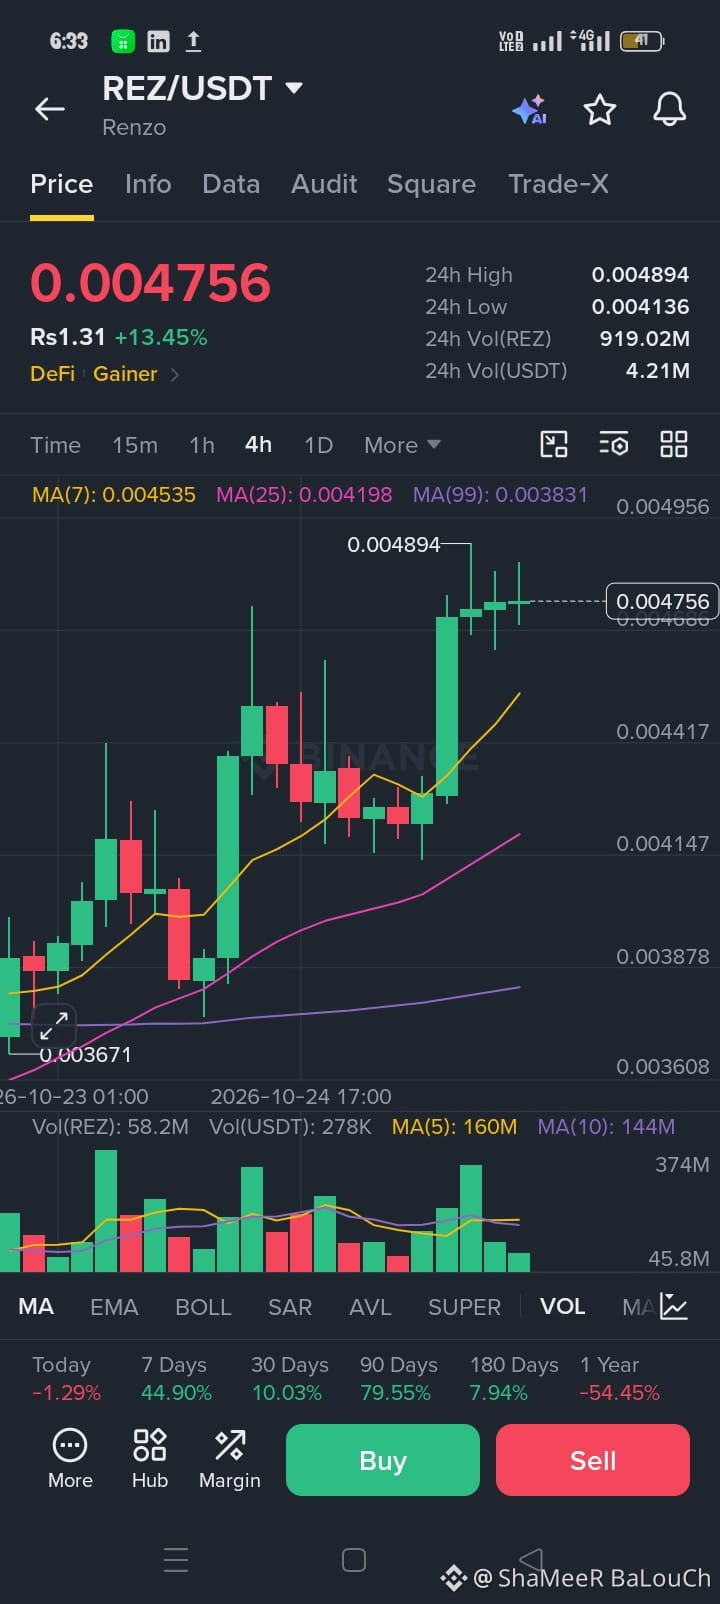
$REZ /USDT — BULLISH BREAKOUT! 🔥
Guys, $REZ is showing strong bullish momentum, gaining +13.45% and trading around $0.004756. Buyers are maintaining control after a strong upward move, with price trading above all three moving averages. 📈💚
🟢 REZ LONG SETUP 📍 Entry: $0.00465 – $0.00476
🎯 TP1: $0.00489
🎯 TP2: $0.00505
🎯 TP3: $0.00525
🛑 SL: $0.00450
📊 Technical Outlook: Price is approaching resistance near $0.004894. A confirmed breakout above this level could open the door for further upside, while rejection may trigger a short-term pullback.
⚠️ Avoid chasing the pump—wait for confirmation and watch trading volume. These are speculative, chart-based levels, not guaranteed targets. Manage your risk and trade responsibly!
$REZ
{spot}(REZUSDT)
$REZ /USDT — BULLISH BREAKOUT! 🔥
Guys, $REZ is showing strong bullish momentum, gaining +13.45% and trading around $0.004756. Buyers are maintaining control after a strong upward move, with price trading above all three moving averages. 📈💚
🟢 REZ LONG SETUP 📍 Entry: $0.00465 – $0.00476
🎯 TP1: $0.00489
🎯 TP2: $0.00505
🎯 TP3: $0.00525
🛑 SL: $0.00450
📊 Technical Outlook: Price is approaching resistance near $0.004894. A confirmed breakout above this level could open the door for further upside, while rejection may trigger a short-term pullback.
⚠️ Avoid chasing the pump—wait for confirmation and watch trading volume. These are speculative, chart-based levels, not guaranteed targets. Manage your risk and trade responsibly!
$REZ
185
翻訳参照
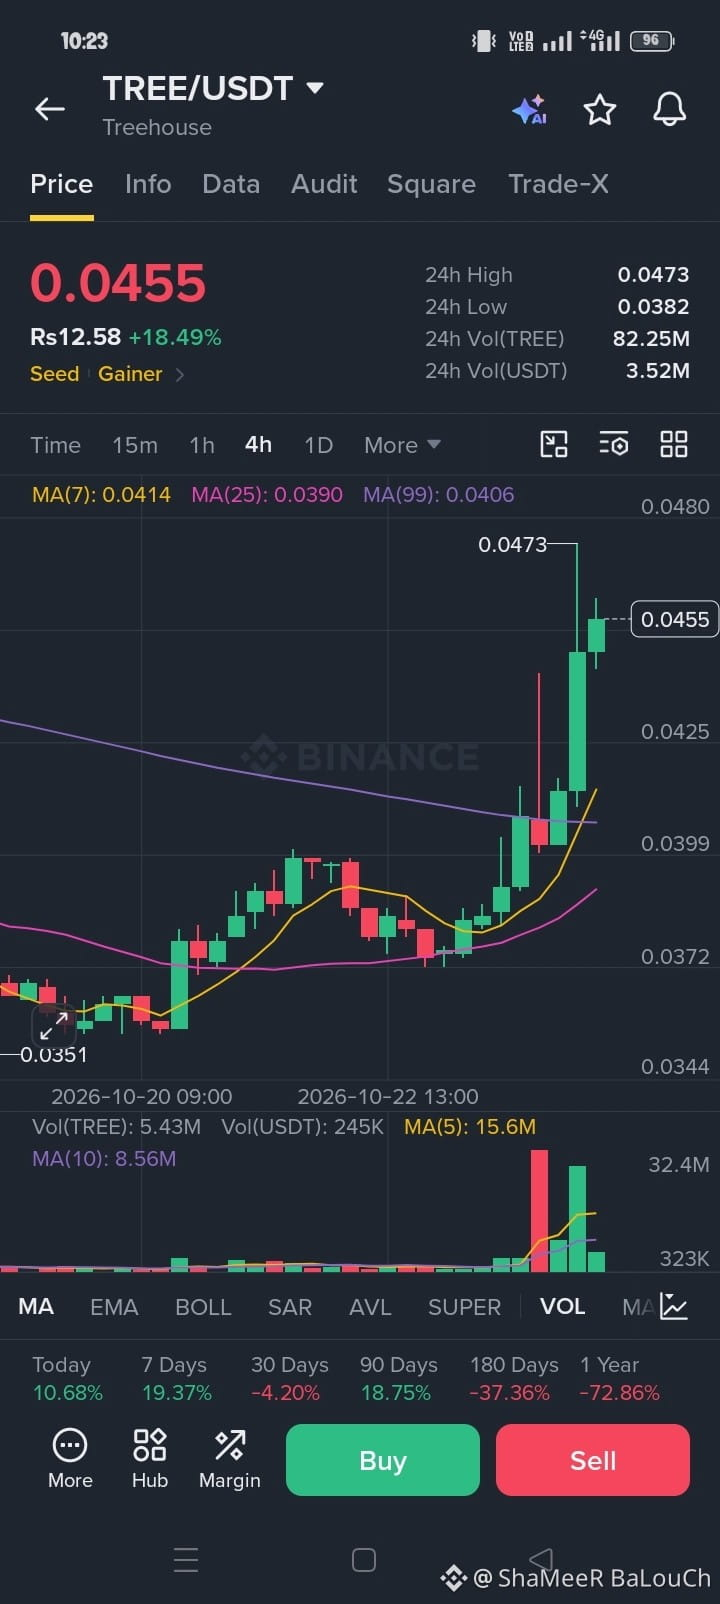
$TREE / USDT — BULLISH BREAKOUT! 🚀
Guys, $TREE is showing strong bullish momentum, surging +18.49% and trading around $0.0455. Buyers are stepping in aggressively, with strong green candles and a significant spike in trading volume. 📈💚
🟢 TREE LONG SETUP 📍 Entry: $0.0440 – $0.0455 🎯 TP1: $0.0473 🎯 TP2: $0.0490 🎯 TP3: $0.0510 🛑 SL: $0.0420
📊 Technical Outlook: Price is trading above the MA(7), MA(25), and MA(99), indicating bullish momentum. However, resistance near $0.0473 could trigger a pullback after this sharp rally.
⚠️ Wait for breakout confirmation and avoid chasing the pump. These are speculative, chart-based levels, not guaranteed targets. Always manage your risk and trade responsibly!
$TREE
{spot}(TREEUSDT)
$TREE / USDT — BULLISH BREAKOUT! 🚀
Guys, $TREE is showing strong bullish momentum, surging +18.49% and trading around $0.0455. Buyers are stepping in aggressively, with strong green candles and a significant spike in trading volume. 📈💚
🟢 TREE LONG SETUP 📍 Entry: $0.0440 – $0.0455 🎯 TP1: $0.0473 🎯 TP2: $0.0490 🎯 TP3: $0.0510 🛑 SL: $0.0420
📊 Technical Outlook: Price is trading above the MA(7), MA(25), and MA(99), indicating bullish momentum. However, resistance near $0.0473 could trigger a pullback after this sharp rally.
⚠️ Wait for breakout confirmation and avoid chasing the pump. These are speculative, chart-based levels, not guaranteed targets. Always manage your risk and trade responsibly!
$TREE
1
153
翻訳参照
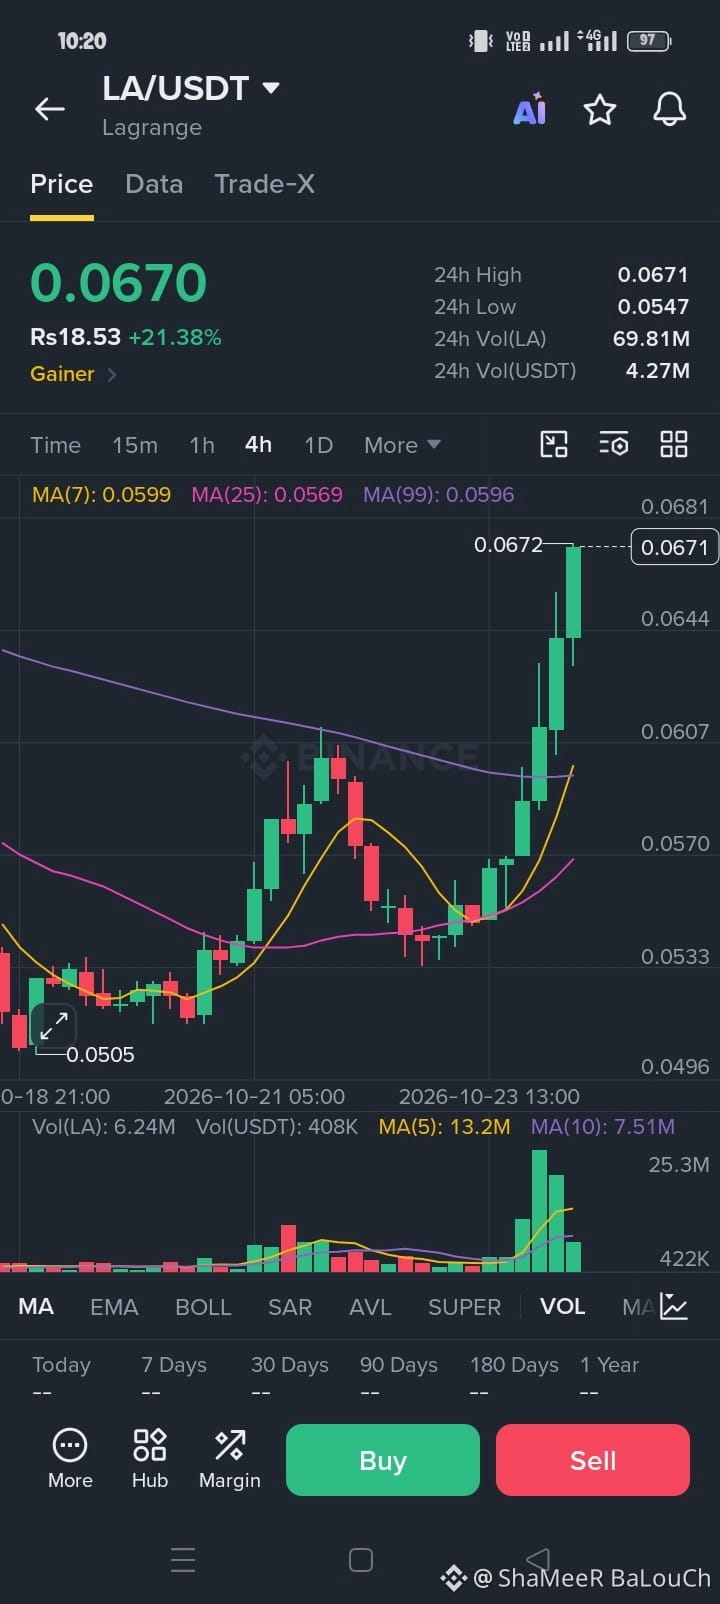
🚨 $LA / USDT — BULLISH BREAKOUT! 🚀🔥
Guys, $LA is showing strong bullish momentum, surging +21.38% and trading around $0.0670. Buyers are taking control, with strong green candles and a noticeable increase in trading volume. 📈
🟢 LA LONG SETUP 📍 Entry: $0.0650 – $0.0670 🎯 TP1: $0.0690 🎯 TP2: $0.0710 🎯 TP3: $0.0740 🛑 SL: $0.0620
⚠️ Important: Price is approaching resistance near $0.0671–$0.0681, so a pullback is possible after this sharp rally. Watch for a confirmed breakout before entering.
These levels are based on the chart, not guaranteed targets. Manage your risk and trade responsibly! $LA
{spot}(LAUSDT)
🚨 $LA / USDT — BULLISH BREAKOUT! 🚀🔥
Guys, $LA is showing strong bullish momentum, surging +21.38% and trading around $0.0670. Buyers are taking control, with strong green candles and a noticeable increase in trading volume. 📈
🟢 LA LONG SETUP 📍 Entry: $0.0650 – $0.0670 🎯 TP1: $0.0690 🎯 TP2: $0.0710 🎯 TP3: $0.0740 🛑 SL: $0.0620
⚠️ Important: Price is approaching resistance near $0.0671–$0.0681, so a pullback is possible after this sharp rally. Watch for a confirmed breakout before entering.
These levels are based on the chart, not guaranteed targets. Manage your risk and trade responsibly! $LA
223
翻訳参照
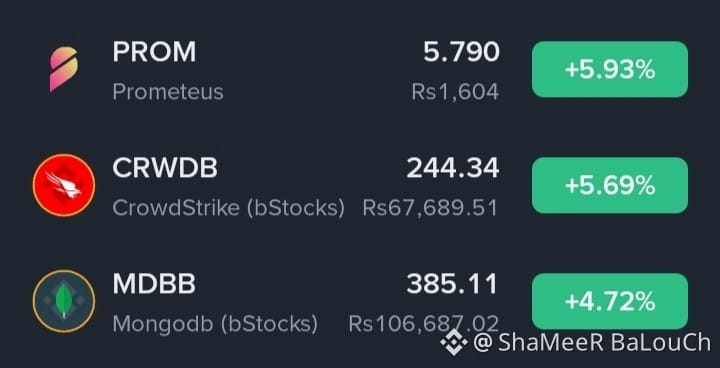
Guys, I'm watching $PROM , $CRWDB , and $MDBB for potential upside moves! Buyers are showing strength, with all three assets trading in positive territory. Momentum looks encouraging, but confirmation is still needed before entering a trade.
🟢 PROM LONG Entry: $5.790 | TP: $6.300 | SL: $5.400
🟢 CRWDB LONG Entry: $244.34 | TP: $260.00 | SL: $230.00
🟢 MDBB LONG Entry: $385.11 | TP: $405.00 | SL: $370.00
⚠️ These are speculative chart-based levels, not guaranteed targets. Always do your own research, manage your risk, and trade responsibly!
255
翻訳参照
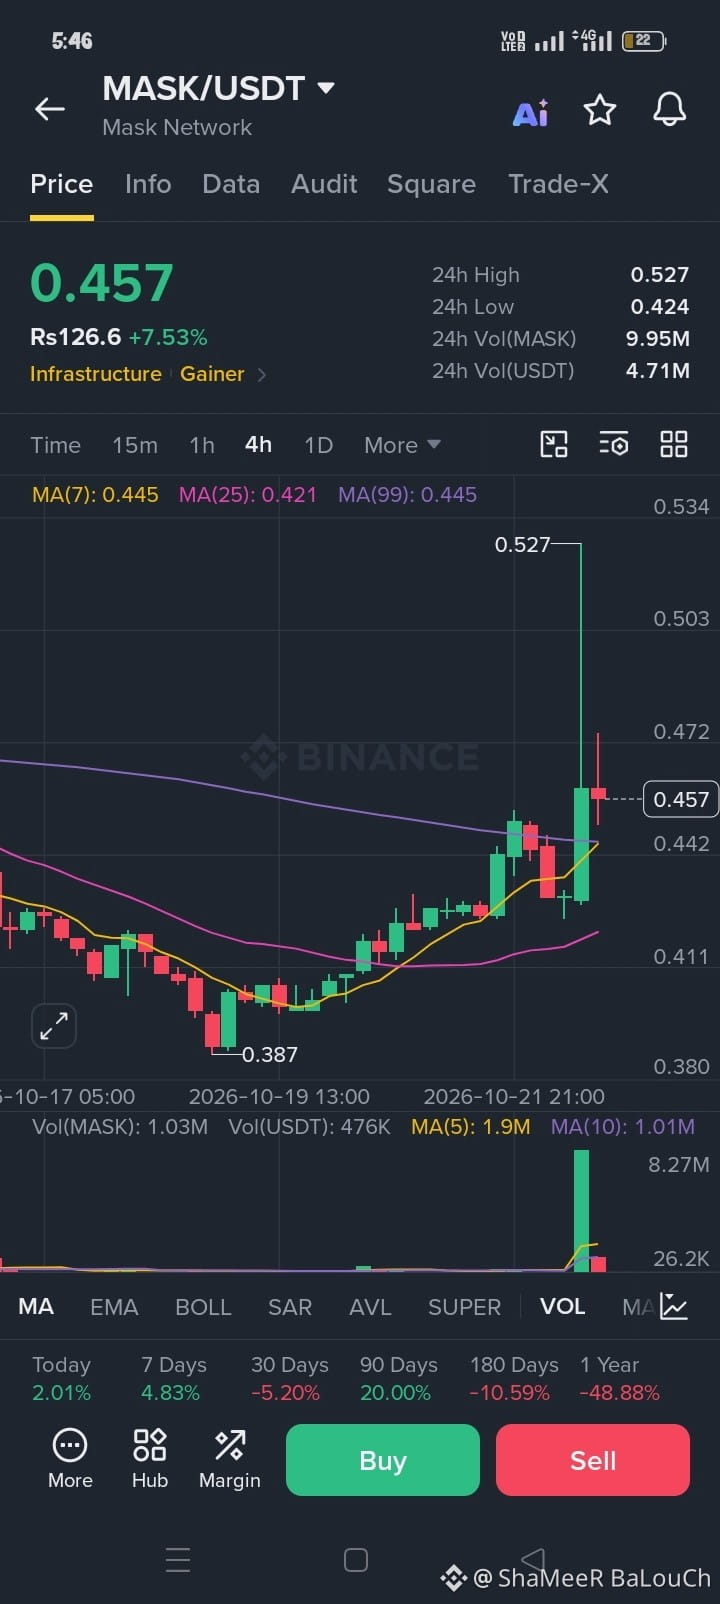
🚀 $MASK BREAKOUT ALERT — BULLS ARE BACK IN CONTROL!
MASK/USDT is trading around $0.457, up +7.53%, following a powerful rally from the $0.387 support zone. A massive volume spike accompanied the recent surge toward $0.527, signaling strong buying interest and increased market activity.
The 4-hour chart shows a bullish recovery, with price trading above the MA(7) at $0.445 and MA(25) at $0.421. However, the sharp rejection from $0.527 suggests that some selling pressure remains near the recent high.
As long as price holds above $0.445, buyers may attempt another upward move. A breakout above $0.472 could open the door toward the next resistance levels.
🎯 Upside Targets: 🥇 TP1: $0.472
🥈 TP2: $0.490
🥉 TP3: $0.503
🚀 TP4: $0.527
🛡️ Key Support Zones: $0.445 → $0.442 → $0.421
📈 Market Bias: BULLISH ABOVE $0.445
⚠️ Watch the $0.472 resistance carefully. A confirmed breakout with strong volume could support further upside, while a drop below $0.442 may weaken the bullish setup.
$MASK
{spot}(MASKUSDT)
$MSFTB
{spot}(MSFTBUSDT)
🚀 $MASK BREAKOUT ALERT — BULLS ARE BACK IN CONTROL!
MASK/USDT is trading around $0.457, up +7.53%, following a powerful rally from the $0.387 support zone. A massive volume spike accompanied the recent surge toward $0.527, signaling strong buying interest and increased market activity.
The 4-hour chart shows a bullish recovery, with price trading above the MA(7) at $0.445 and MA(25) at $0.421. However, the sharp rejection from $0.527 suggests that some selling pressure remains near the recent high.
As long as price holds above $0.445, buyers may attempt another upward move. A breakout above $0.472 could open the door toward the next resistance levels.
🎯 Upside Targets: 🥇 TP1: $0.472
🥈 TP2: $0.490
🥉 TP3: $0.503
🚀 TP4: $0.527
🛡️ Key Support Zones: $0.445 → $0.442 → $0.421
📈 Market Bias: BULLISH ABOVE $0.445
⚠️ Watch the $0.472 resistance carefully. A confirmed breakout with strong volume could support further upside, while a drop below $0.442 may weaken the bullish setup.
$MASK
$MSFTB
1
377
翻訳参照
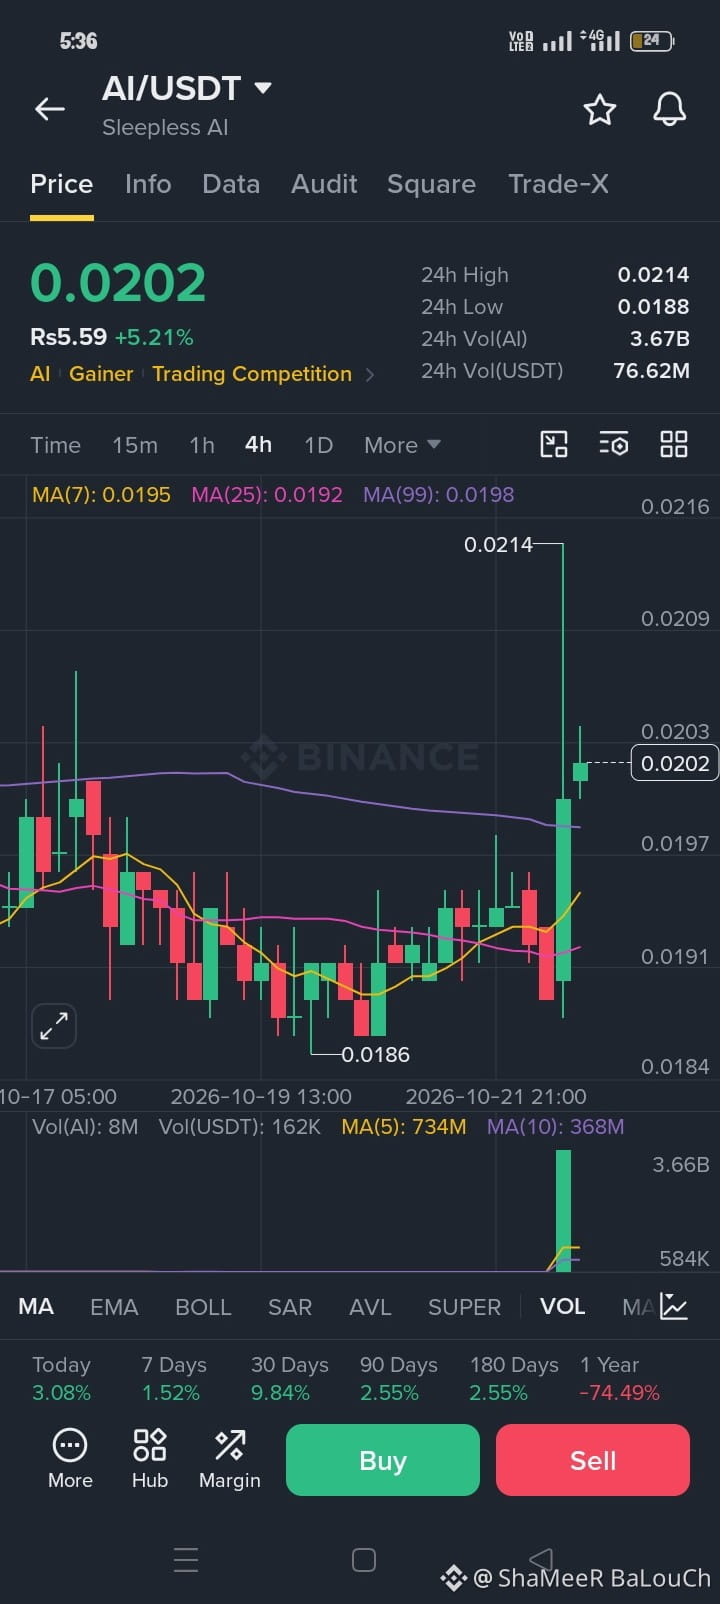
🚀 $AI BREAKOUT CONFIRMED ABOVE $0.0200 — Buyers Are Taking Control! 🔥
$AI /USDT is trading around $0.0202, up +5.21%, following a strong bullish breakout with a massive volume spike. Price has bounced sharply from the $0.0186 support and moved above the key moving averages, signaling increasing buying pressure.
The recent surge toward $0.0214 shows strong bullish momentum. As long as price holds above $0.0198–$0.0200, buyers may continue pushing higher. A sustained move above $0.0203 could open the door for another test of the recent high.
🎯 Upside Targets:
🥇 TP1: $0.0205
🥈 TP2: $0.0209
🥉 TP3: $0.0214
⚠️ Key Support: $0.0198 → $0.0195 → $0.0192
📈 Bias: BULLISH ABOVE $0.0200
Watch volume and price action for confirmation. If support breaks, the bullish setup could weaken.
$AI
{spot}(AIUSDT)
🚀 $AI BREAKOUT CONFIRMED ABOVE $0.0200 — Buyers Are Taking Control! 🔥
$AI /USDT is trading around $0.0202, up +5.21%, following a strong bullish breakout with a massive volume spike. Price has bounced sharply from the $0.0186 support and moved above the key moving averages, signaling increasing buying pressure.
The recent surge toward $0.0214 shows strong bullish momentum. As long as price holds above $0.0198–$0.0200, buyers may continue pushing higher. A sustained move above $0.0203 could open the door for another test of the recent high.
🎯 Upside Targets:
🥇 TP1: $0.0205
🥈 TP2: $0.0209
🥉 TP3: $0.0214
⚠️ Key Support: $0.0198 → $0.0195 → $0.0192
📈 Bias: BULLISH ABOVE $0.0200
Watch volume and price action for confirmation. If support breaks, the bullish setup could weaken.
$AI
358
翻訳参照
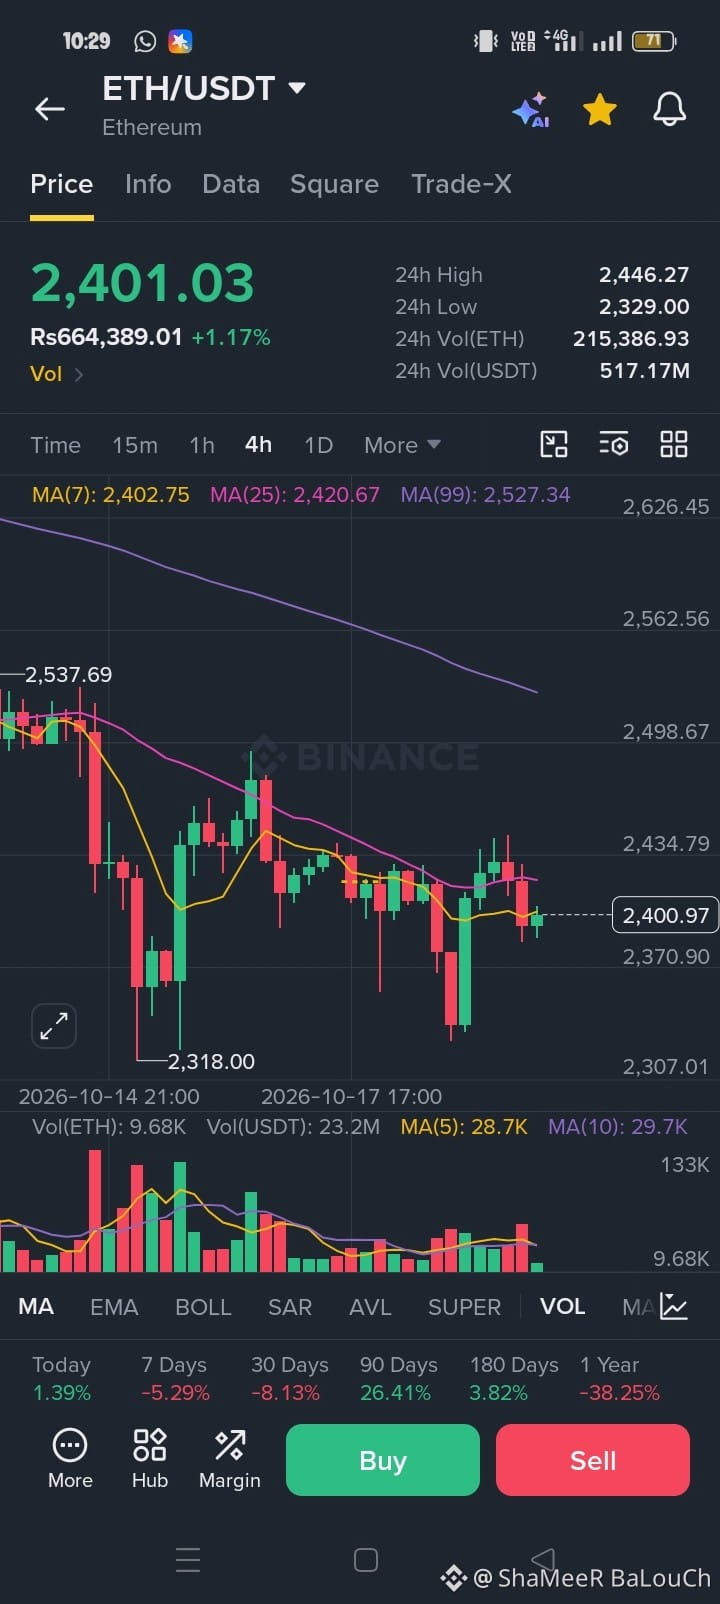
🚨 $ETH / USDT — BULLISH REVERSAL OR BREAKDOWN?🔥
💎 Ethereum is trading at $2,401 (+1.17%)! Buyers have defended the $2,318 support zone, but ETH is still facing resistance around $2,420–$2,435. A breakout above this zone could trigger another upward move! 🚀
🟢 LONG Entry: $2,405 – $2,420
🎯 TP1: $2,435
🎯 TP2: $2,465
🎯 TP3: $2,500
🛑 Stop Loss: $2,370
📉 Key Resistance: $2,420 – $2,435
🛡️ Key Support: $2,370 – $2,318
⚡ Market Insight: ETH is trading below the MA(25) at $2,420.67 and MA(99) at $2,527.34, so the broader trend remains under pressure. Watch for a confirmed breakout before entering LONG!
🐼 Always DYOR & manage your risk wisely!
👇👇 Watch the chart and trade smart!
$ETH
{spot}(ETHUSDT)
🚨 $ETH / USDT — BULLISH REVERSAL OR BREAKDOWN?🔥
💎 Ethereum is trading at $2,401 (+1.17%)! Buyers have defended the $2,318 support zone, but ETH is still facing resistance around $2,420–$2,435. A breakout above this zone could trigger another upward move! 🚀
🟢 LONG Entry: $2,405 – $2,420
🎯 TP1: $2,435
🎯 TP2: $2,465
🎯 TP3: $2,500
🛑 Stop Loss: $2,370
📉 Key Resistance: $2,420 – $2,435
🛡️ Key Support: $2,370 – $2,318
⚡ Market Insight: ETH is trading below the MA(25) at $2,420.67 and MA(99) at $2,527.34, so the broader trend remains under pressure. Watch for a confirmed breakout before entering LONG!
🐼 Always DYOR & manage your risk wisely!
👇👇 Watch the chart and trade smart!
$ETH
12
翻訳参照
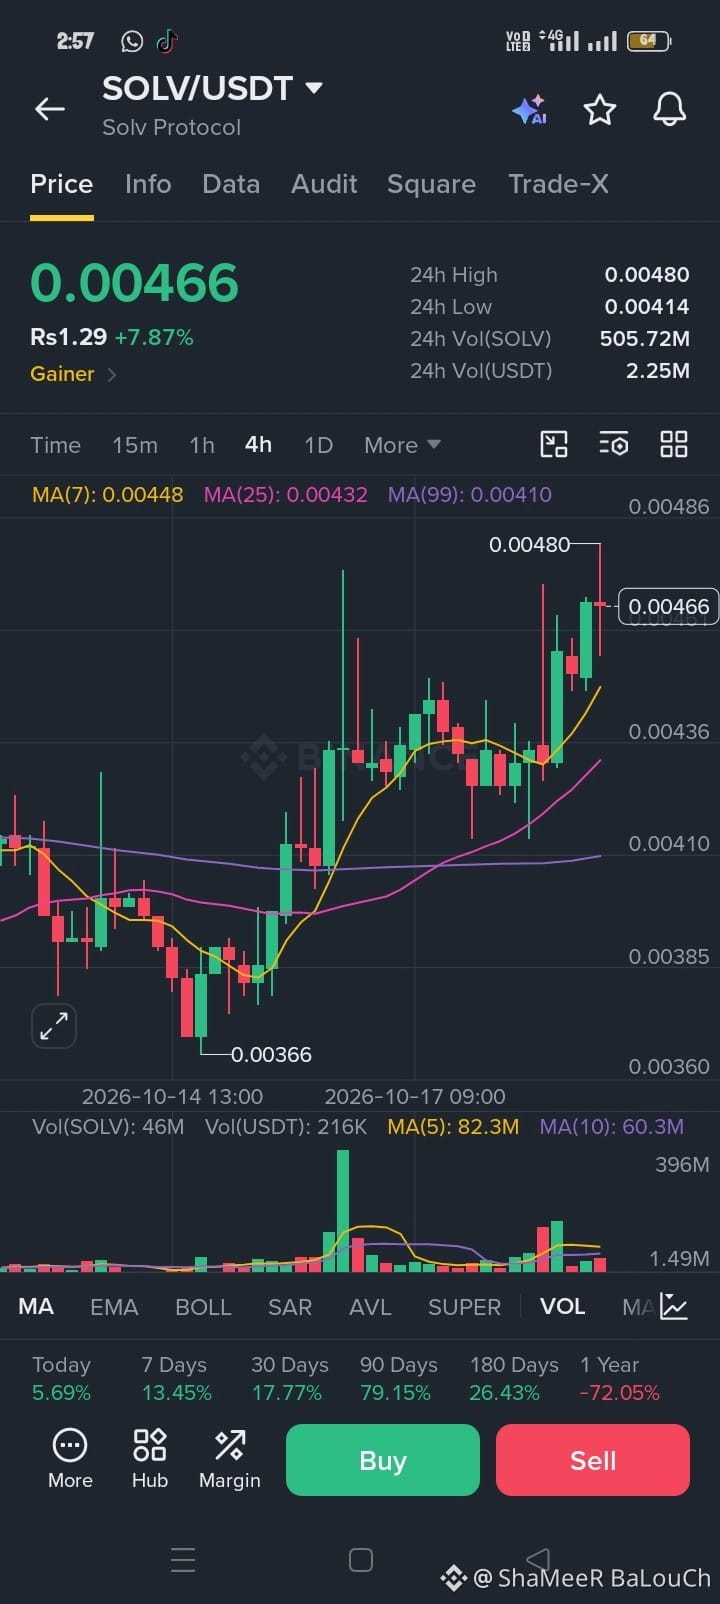
$SOLV / USDT — BULLISH BREAKOUT ALERT🚨
SOLV is showing strong bullish momentum, trading at $0.00466 (+7.87%)! 💚 The price is trading above MA(7), MA(25), and MA(99), indicating positive short-term momentum. Buyers are pushing toward the key resistance at $0.00480. A confirmed breakout could trigger another upward move! 🚀
🟢 Entry: $0.00460 – $0.00466
🎯 TP1: $0.00480
🎯 TP2: $0.00495
🎯 TP3: $0.00510
🛑 Stop Loss: $0.00448
📊 Resistance: $0.00480
🛡️ Support: $0.00448 – $0.00432
🔥 Trading Strategy: Watch for a strong breakout above $0.00480 with volume confirmation before entering a LONG position.
🐼 Always DYOR & manage your risk wisely!
👇👇 Watch the breakout and trade smart!
$SOLV
{spot}(SOLVUSDT)
$SOL
{spot}(SOLUSDT)
$SOLV / USDT — BULLISH BREAKOUT ALERT🚨
SOLV is showing strong bullish momentum, trading at $0.00466 (+7.87%)! 💚 The price is trading above MA(7), MA(25), and MA(99), indicating positive short-term momentum. Buyers are pushing toward the key resistance at $0.00480. A confirmed breakout could trigger another upward move! 🚀
🟢 Entry: $0.00460 – $0.00466
🎯 TP1: $0.00480
🎯 TP2: $0.00495
🎯 TP3: $0.00510
🛑 Stop Loss: $0.00448
📊 Resistance: $0.00480
🛡️ Support: $0.00448 – $0.00432
🔥 Trading Strategy: Watch for a strong breakout above $0.00480 with volume confirmation before entering a LONG position.
🐼 Always DYOR & manage your risk wisely!
👇👇 Watch the breakout and trade smart!
$SOLV
$SOL
180
翻訳参照
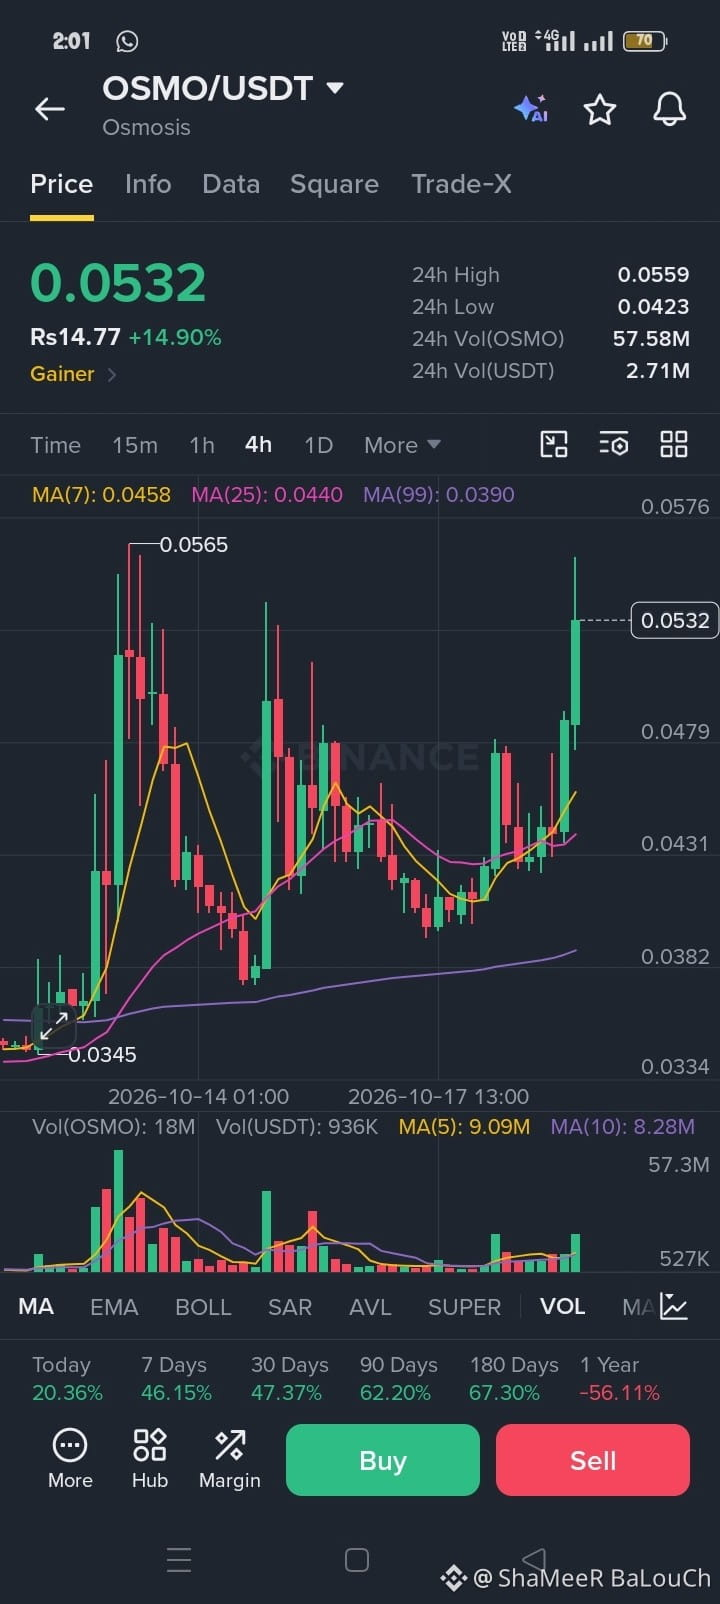
$OSMO /USDT Price Prediction: Will Osmosis Break $0.0560 or Face a Pullback?
$OSMO /USDT is currently trading at 0.0532 USDT, up approximately 14.90% in the last 24 hours.
Resistance: 0.0559–0.0565 USDT
Support: 0.0500 USDT
Strong Support: 0.0479 USDT
Bullish Scenario: If buying pressure continues, the price may move toward 0.0545–0.0559 USDT.
Bearish Scenario: If profit-taking begins, the price could pull back toward 0.0500–0.0479 USDT.
📊 Technical Analysis
The chart shows strong bullish momentum, with the current price trading above MA(7), MA(25), and MA(99). The latest green candle and increased volume indicate strong buying interest.
🎯 Final Verdict
My bias is bullish 📈 for the next hour, but the price is approaching resistance, so a short-term pullback is possible.
$OSMO
{spot}(OSMOUSDT)
$OSMO /USDT Price Prediction: Will Osmosis Break $0.0560 or Face a Pullback?
$OSMO /USDT is currently trading at 0.0532 USDT, up approximately 14.90% in the last 24 hours.
Resistance: 0.0559–0.0565 USDT
Support: 0.0500 USDT
Strong Support: 0.0479 USDT
Bullish Scenario: If buying pressure continues, the price may move toward 0.0545–0.0559 USDT.
Bearish Scenario: If profit-taking begins, the price could pull back toward 0.0500–0.0479 USDT.
📊 Technical Analysis
The chart shows strong bullish momentum, with the current price trading above MA(7), MA(25), and MA(99). The latest green candle and increased volume indicate strong buying interest.
🎯 Final Verdict
My bias is bullish 📈 for the next hour, but the price is approaching resistance, so a short-term pullback is possible.
$OSMO
121
翻訳参照
🚀$AMP / USDT Price Prediction: Can AMP Sustain Its 25% Rally or Face a Pullback?
Slightly Bullish 📈
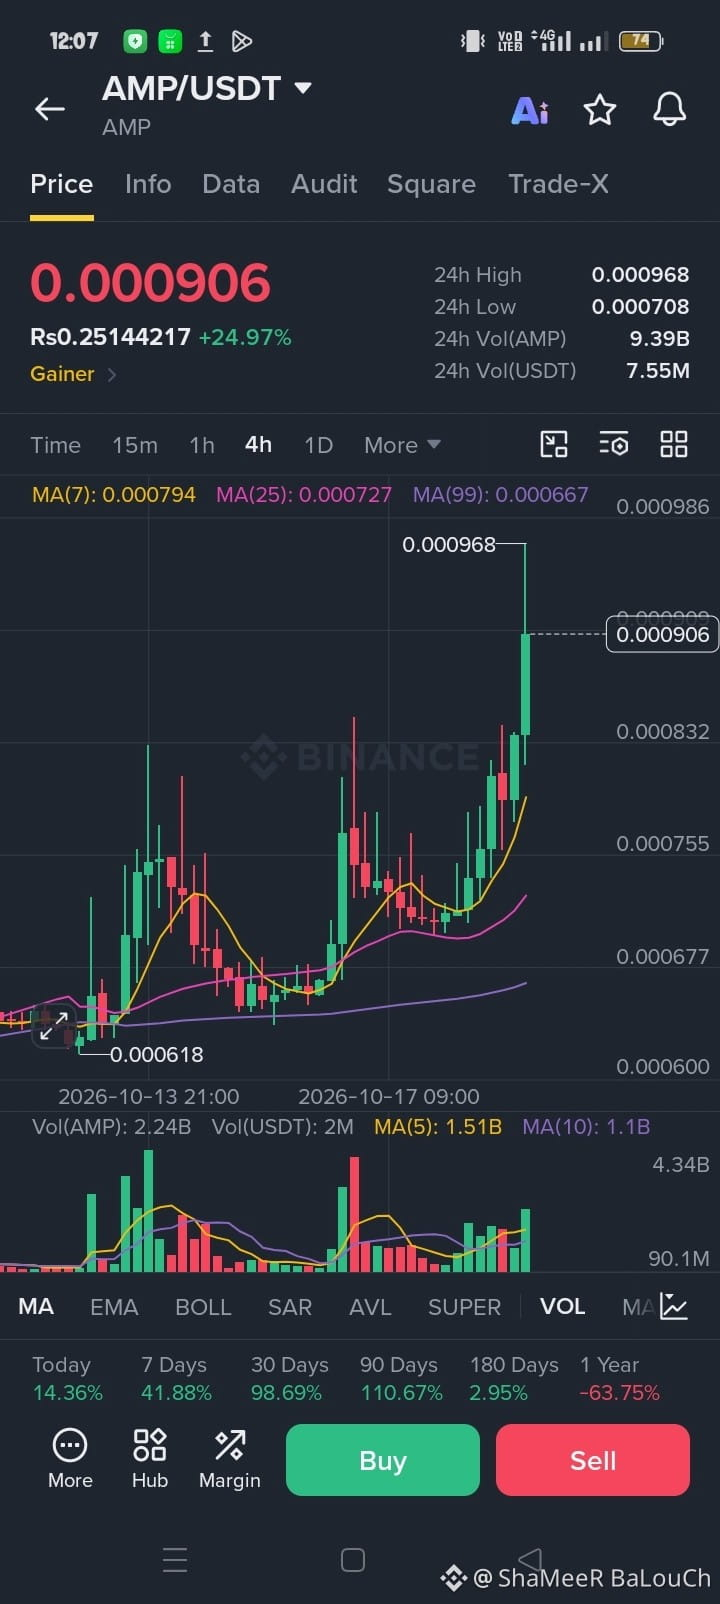
$AMP / USDT is currently trading at 0.000906 USDT, up approximately 24.97% in the last 24 hours.
Resistance: 0.000968 USDT
Support: 0.000880 USDT
Bullish Scenario: If buying pressure continues, AMP could retest 0.000968 USDT and potentially break higher.
Bearish Scenario: After this sharp rally, profit-taking could push the price toward 0.000880–0.000860 USDT.
Final Verdict: The 4-hour chart shows strong bullish momentum, with the price trading above MA(7), MA(25), and MA(99). For the next hour, my bias is slightly bullish 📈, although a short-term pullback remains possible. $AMP
{spot}(AMPUSDT)
🚀$AMP / USDT Price Prediction: Can AMP Sustain Its 25% Rally or Face a Pullback?
Slightly Bullish 📈
$AMP / USDT is currently trading at 0.000906 USDT, up approximately 24.97% in the last 24 hours.
Resistance: 0.000968 USDT
Support: 0.000880 USDT
Bullish Scenario: If buying pressure continues, AMP could retest 0.000968 USDT and potentially break higher.
Bearish Scenario: After this sharp rally, profit-taking could push the price toward 0.000880–0.000860 USDT.
Final Verdict: The 4-hour chart shows strong bullish momentum, with the price trading above MA(7), MA(25), and MA(99). For the next hour, my bias is slightly bullish 📈, although a short-term pullback remains possible. $AMP
102
$QKC /USDT クォークチェーンは次の1時間で下落する?それとも回復する?📊
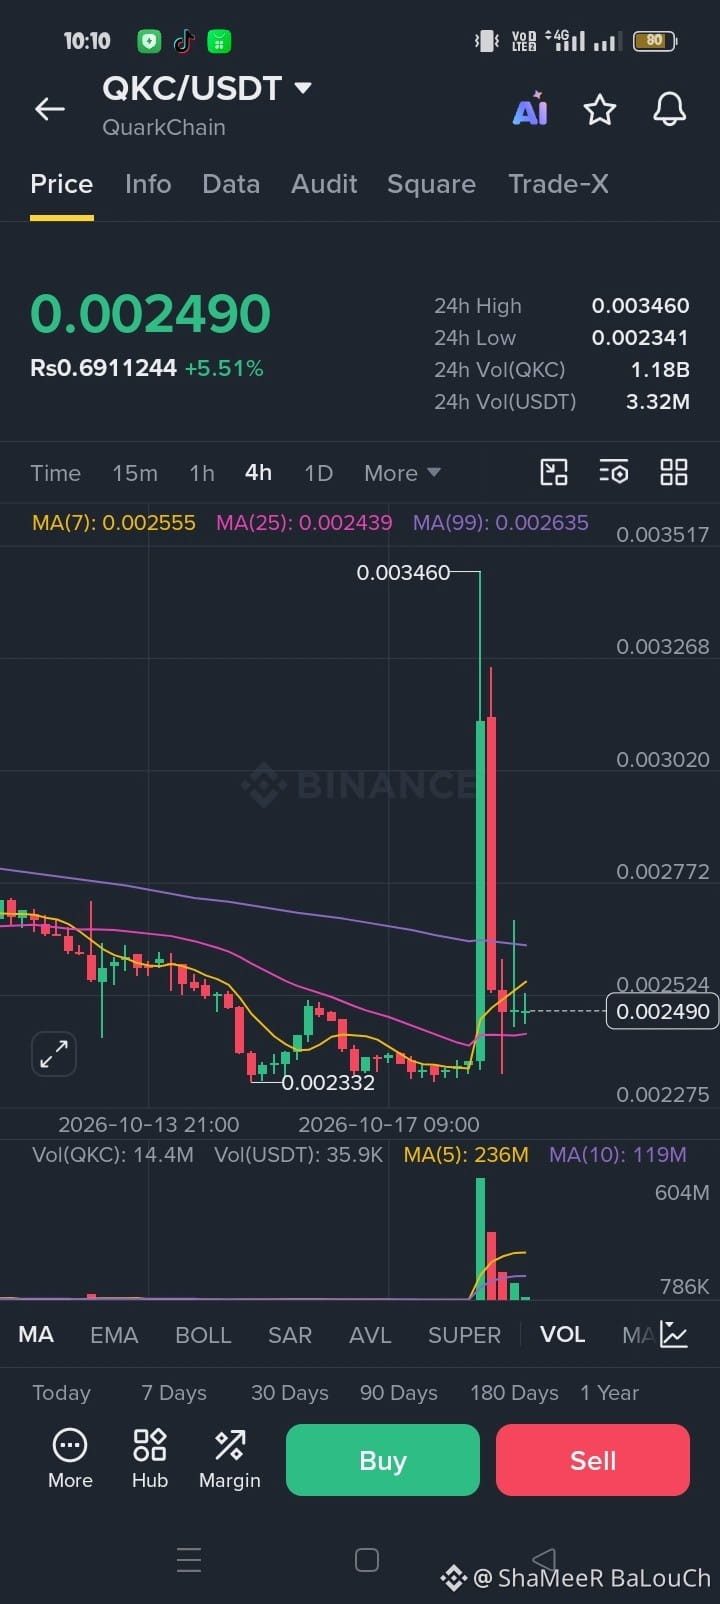
現在価格:0.002490 USDT(+5.51%)
レジスタンス:0.002524~0.002555
サポート:0.002439
下値サポート:0.002341
弱気シナリオ:価格が0.002524~0.002555を上抜けできなければ、0.002439に向けて下落する可能性があります。
強気シナリオ:出来高を伴って0.002555を上抜けた場合、0.002600~0.002635に向けて上昇する可能性があります。
最終見解:チャートでは急騰の後に大きく反落しています。価格は現在MA(7)を下回っており、短期的な弱さがうかがえます。次の1時間は、小幅な下落または横ばいとなる可能性があります。$QKC
{spot}(QKCUSDT)
$QKC /USDT クォークチェーンは次の1時間で下落する?それとも回復する?📊
現在価格:0.002490 USDT(+5.51%)
レジスタンス:0.002524~0.002555
サポート:0.002439
下値サポート:0.002341
弱気シナリオ:価格が0.002524~0.002555を上抜けできなければ、0.002439に向けて下落する可能性があります。
強気シナリオ:出来高を伴って0.002555を上抜けた場合、0.002600~0.002635に向けて上昇する可能性があります。
最終見解:チャートでは急騰の後に大きく反落しています。価格は現在MA(7)を下回っており、短期的な弱さがうかがえます。次の1時間は、小幅な下落または横ばいとなる可能性があります。$QKC
130
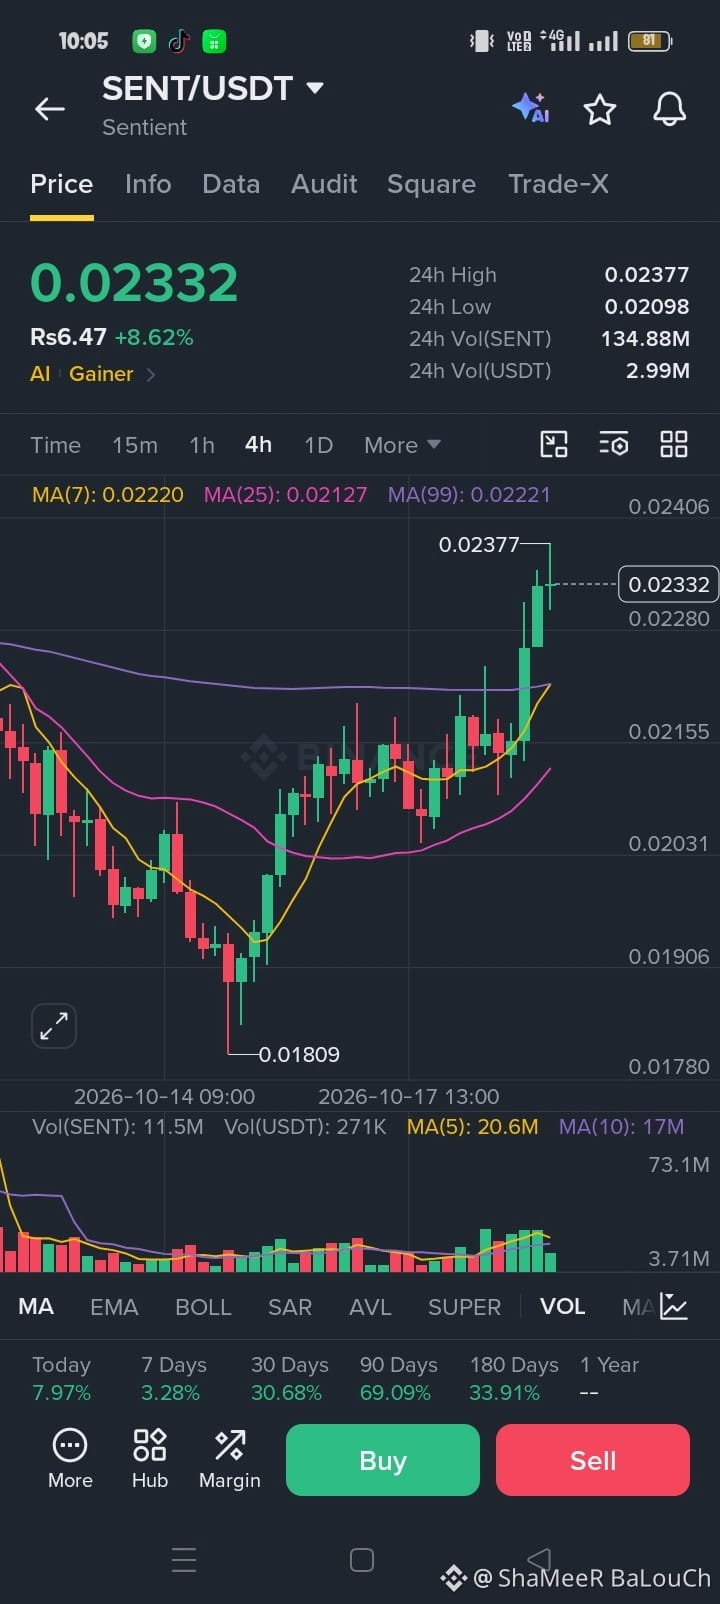
$SENT / USDTは現在0.02332 USDT(+8.62%)で取引されています
レジスタンス:0.02377 USDT
サポート:0.02280 USDT
強気シナリオ:価格が0.02377を上抜けた場合、0.02400に向けて上昇する可能性があります。
弱気シナリオ:レジスタンスを上抜けられなかった場合、0.02280~0.02250まで反落する可能性があります。
見解:この急激な上昇の後、短期的な反落または横ばいの動きが予想されますが、強気の勢いは依然として強いです。 $SENT
{spot}(SENTUSDT)
$SENT / USDTは現在0.02332 USDT(+8.62%)で取引されています
レジスタンス:0.02377 USDT
サポート:0.02280 USDT
強気シナリオ:価格が0.02377を上抜けた場合、0.02400に向けて上昇する可能性があります。
弱気シナリオ:レジスタンスを上抜けられなかった場合、0.02280~0.02250まで反落する可能性があります。
見解:この急激な上昇の後、短期的な反落または横ばいの動きが予想されますが、強気の勢いは依然として強いです。 $SENT
レジスタンス:0.02377 USDT
サポート:0.02280 USDT
強気シナリオ:価格が0.02377を上抜けた場合、0.02400に向けて上昇する可能性があります。
弱気シナリオ:レジスタンスを上抜けられなかった場合、0.02280~0.02250まで反落する可能性があります。
見解:この急激な上昇の後、短期的な反落または横ばいの動きが予想されますが、強気の勢いは依然として強いです。 $SENT
249
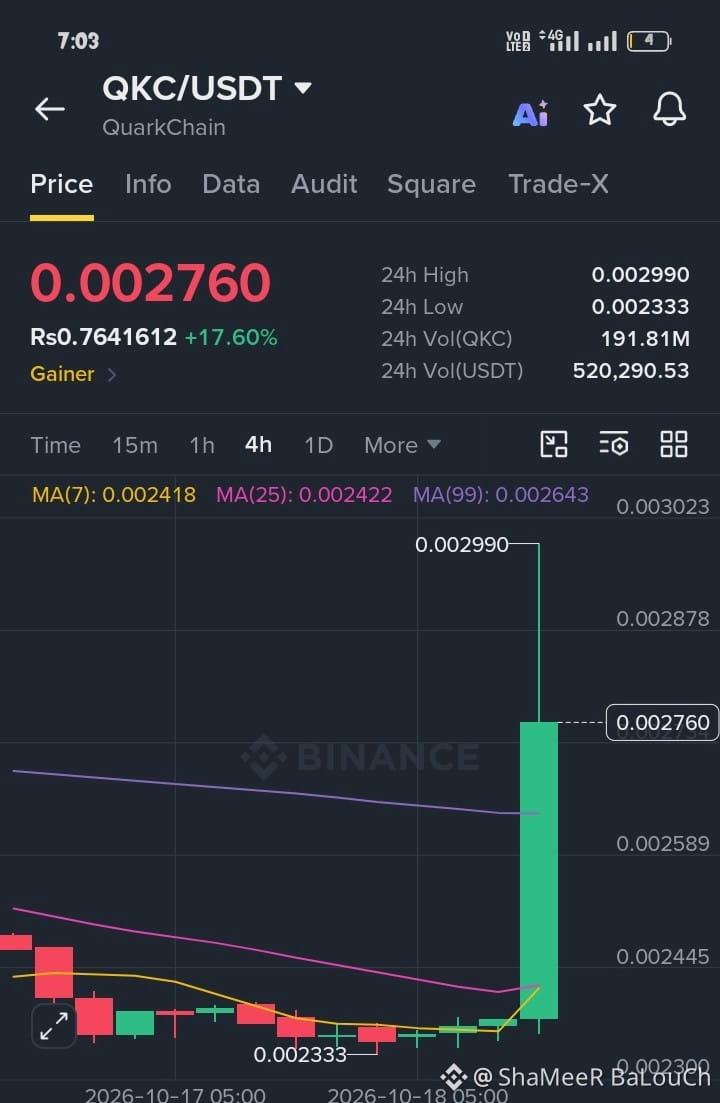
🚀$QKC /USDTが17.60%急騰 — QuarkChainはさらなるブレイクアウトに備えている?
🔥 QuarkChain(QKC)は強い上昇モメンタムを見せています!
$QKC /USDTは現在0.002760ドルで取引されており、24時間で約17.60%上昇しています。4時間足チャートでは、取引量の大幅な増加を伴う力強い陽線が見られ、買い意欲の高まりがうかがえます。
📊 テクニカル分析
💰 現在価格:0.002760ドル
📈 24時間変動率:+17.60%
🎯 レジスタンス1:0.002878ドル
🚀 主要レジスタンス:0.002990ドル
🟢 サポートゾーン:0.002589~0.002445ドル
📊 24時間取引量:191.81M QKC
🔍 チャートから何が読み取れる?
✅ 取引量が大幅に増加し、強い陽線が出現。 ✅ 価格はMA(7)、MA(25)、MA(99)を上回っており、短期的なモメンタムの改善を示しています。 ⚠️ 上ヒゲは、0.002990ドル付近で売り圧力があることを示唆しています。
🎯 次の展開は?
QKCが大きな取引量を伴って0.002990ドルを上抜ければ、さらなる上昇が期待できるでしょう。ただし、買いの勢いが弱まれば、価格は0.002589ドルのサポート付近まで押し戻される可能性があります。
💡 取引戦略:急騰後のFOMOには注意しましょう。エントリーを検討する前に、ブレイクアウトの確認、または健全な押し目を待ちましょう。
$QKC
{spot}(QKCUSDT)
🚀$QKC /USDTが17.60%急騰 — QuarkChainはさらなるブレイクアウトに備えている?
🔥 QuarkChain(QKC)は強い上昇モメンタムを見せています!
$QKC /USDTは現在0.002760ドルで取引されており、24時間で約17.60%上昇しています。4時間足チャートでは、取引量の大幅な増加を伴う力強い陽線が見られ、買い意欲の高まりがうかがえます。
📊 テクニカル分析
💰 現在価格:0.002760ドル
📈 24時間変動率:+17.60%
🎯 レジスタンス1:0.002878ドル
🚀 主要レジスタンス:0.002990ドル
🟢 サポートゾーン:0.002589~0.002445ドル
📊 24時間取引量:191.81M QKC
🔍 チャートから何が読み取れる?
✅ 取引量が大幅に増加し、強い陽線が出現。 ✅ 価格はMA(7)、MA(25)、MA(99)を上回っており、短期的なモメンタムの改善を示しています。 ⚠️ 上ヒゲは、0.002990ドル付近で売り圧力があることを示唆しています。
🎯 次の展開は?
QKCが大きな取引量を伴って0.002990ドルを上抜ければ、さらなる上昇が期待できるでしょう。ただし、買いの勢いが弱まれば、価格は0.002589ドルのサポート付近まで押し戻される可能性があります。
💡 取引戦略:急騰後のFOMOには注意しましょう。エントリーを検討する前に、ブレイクアウトの確認、または健全な押し目を待ちましょう。
$QKC
1
213
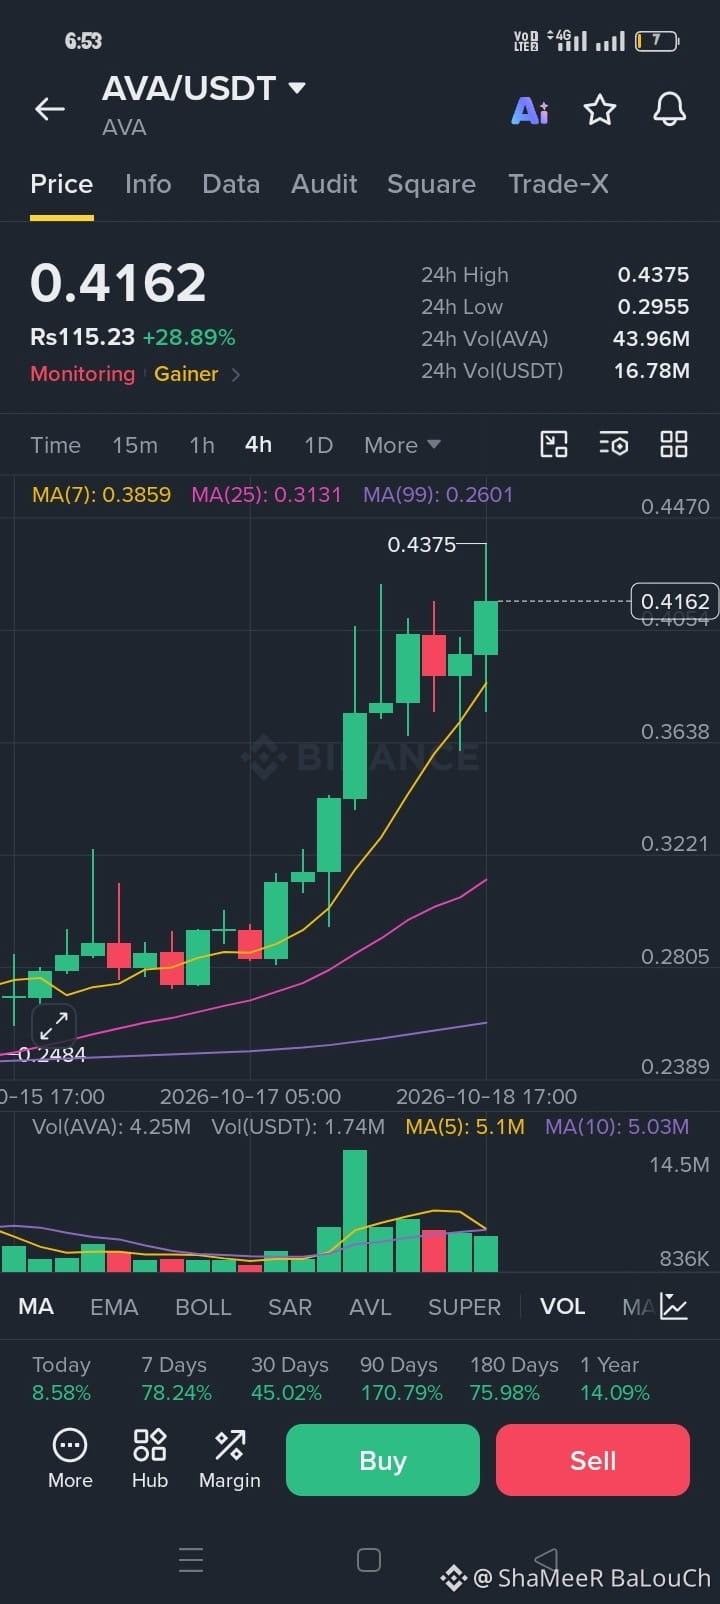
🚀$AVA /USDTが28%急騰 — 強気派は0.4375ドルのレジスタンスを狙う!
📈 AVAは強い上昇モメンタムを見せています!
$AVA /USDTは現在約0.4162ドルで取引されており、24時間で約28.89%上昇しています。4時間足チャートでは力強い上昇が見られ、買い方が主導権を維持しています。
🔍 テクニカル分析:
💰 現在価格:0.4162ドル
📈 24時間の上昇率:+28.89%
🎯 レジスタンス:0.4375ドル
🟢 サポートゾーン:0.3850~0.3640ドル
📊 トレンド:上昇モメンタム
🔥 移動平均線:MA(7)がMA(25)とMA(99)を上回っており、強い上昇トレンドを示しています。
🎯 今後の見通しは?
出来高を伴って0.4375ドルを上抜ければ、価格はさらに上昇する可能性があります。ただし、このレジスタンスで反落した場合は、0.3850ドルのサポートゾーンに向けて短期的に調整する可能性があります。
⚠️ トレードのヒント:これほど大きく上昇した後は、むやみに高値を追いかけるのは避けましょう。取引に入る前に、上昇の確認や出来高、反落の可能性に注意してください。
💬 どう思いますか?AVAは0.4375ドルを突破して上昇を続けるでしょうか。それとも売り方が主導権を握るでしょうか?
$AVA
{spot}(AVAUSDT)
#AVA #USDT #CryptoAnalysis #Binance
🚀$AVA /USDTが28%急騰 — 強気派は0.4375ドルのレジスタンスを狙う!
📈 AVAは強い上昇モメンタムを見せています!
$AVA /USDTは現在約0.4162ドルで取引されており、24時間で約28.89%上昇しています。4時間足チャートでは力強い上昇が見られ、買い方が主導権を維持しています。
🔍 テクニカル分析:
💰 現在価格:0.4162ドル
📈 24時間の上昇率:+28.89%
🎯 レジスタンス:0.4375ドル
🟢 サポートゾーン:0.3850~0.3640ドル
📊 トレンド:上昇モメンタム
🔥 移動平均線:MA(7)がMA(25)とMA(99)を上回っており、強い上昇トレンドを示しています。
🎯 今後の見通しは?
出来高を伴って0.4375ドルを上抜ければ、価格はさらに上昇する可能性があります。ただし、このレジスタンスで反落した場合は、0.3850ドルのサポートゾーンに向けて短期的に調整する可能性があります。
⚠️ トレードのヒント:これほど大きく上昇した後は、むやみに高値を追いかけるのは避けましょう。取引に入る前に、上昇の確認や出来高、反落の可能性に注意してください。
💬 どう思いますか?AVAは0.4375ドルを突破して上昇を続けるでしょうか。それとも売り方が主導権を握るでしょうか?
$AVA
#AVA #USDT #CryptoAnalysis #Binance
84
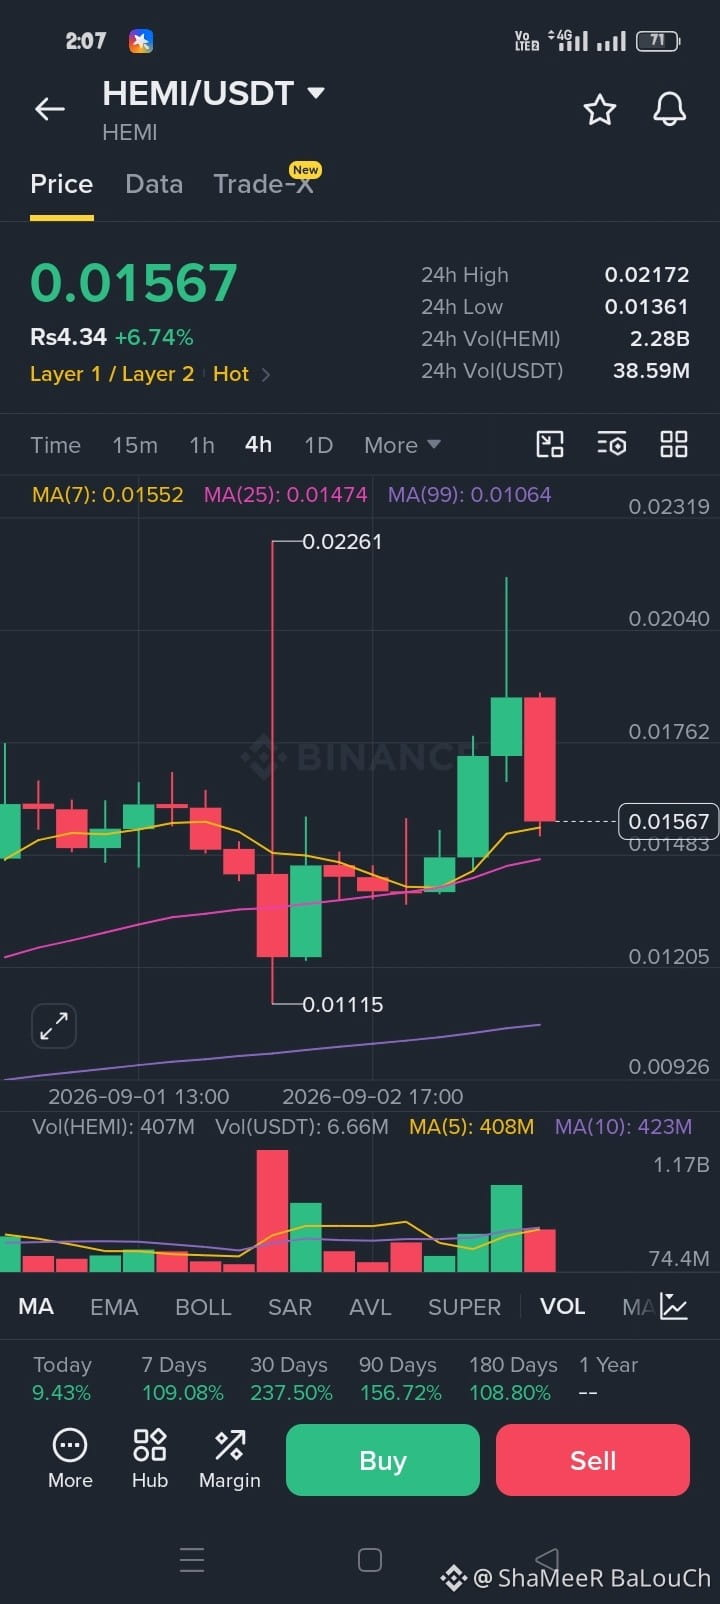
🚀$HEMI /USDT — 強いブレイクアウト後の強気構造
HEMIは0.01567 USDT付近で取引されており、+6.74%の動きを示しています。📈
4時間足チャートでは、価格は主要移動平均線を上回ったままです:
🟡 MA(7): 0.01552
🟣 MA(25): 0.01474
🔵 MA(99): 0.01064
🎯 重要レベル
サポート: 0.0147 – 0.0148
主要サポート: 0.0136
レジスタンス: 0.0176 → 0.0204 → 0.0226
HEMIは最近0.02261付近まで強く上昇した後、反落しました。買い手が0.0147–0.0150のゾーンを防衛できれば、0.0176以上を目指す再上昇の試みが可能かもしれません。
⚠️ エントリー前に出来高と4時間足のローソク足の確定を確認してください。リスク管理は慎重に行ってください。
$HEMI
{spot}(HEMIUSDT)
#HEMI #HEMIUSDT #Crypto #Binance
🚀$HEMI /USDT — 強いブレイクアウト後の強気構造
HEMIは0.01567 USDT付近で取引されており、+6.74%の動きを示しています。📈
4時間足チャートでは、価格は主要移動平均線を上回ったままです:
🟡 MA(7): 0.01552
🟣 MA(25): 0.01474
🔵 MA(99): 0.01064
🎯 重要レベル
サポート: 0.0147 – 0.0148
主要サポート: 0.0136
レジスタンス: 0.0176 → 0.0204 → 0.0226
HEMIは最近0.02261付近まで強く上昇した後、反落しました。買い手が0.0147–0.0150のゾーンを防衛できれば、0.0176以上を目指す再上昇の試みが可能かもしれません。
⚠️ エントリー前に出来高と4時間足のローソク足の確定を確認してください。リスク管理は慎重に行ってください。
$HEMI
#HEMI #HEMIUSDT #Crypto #Binance
425
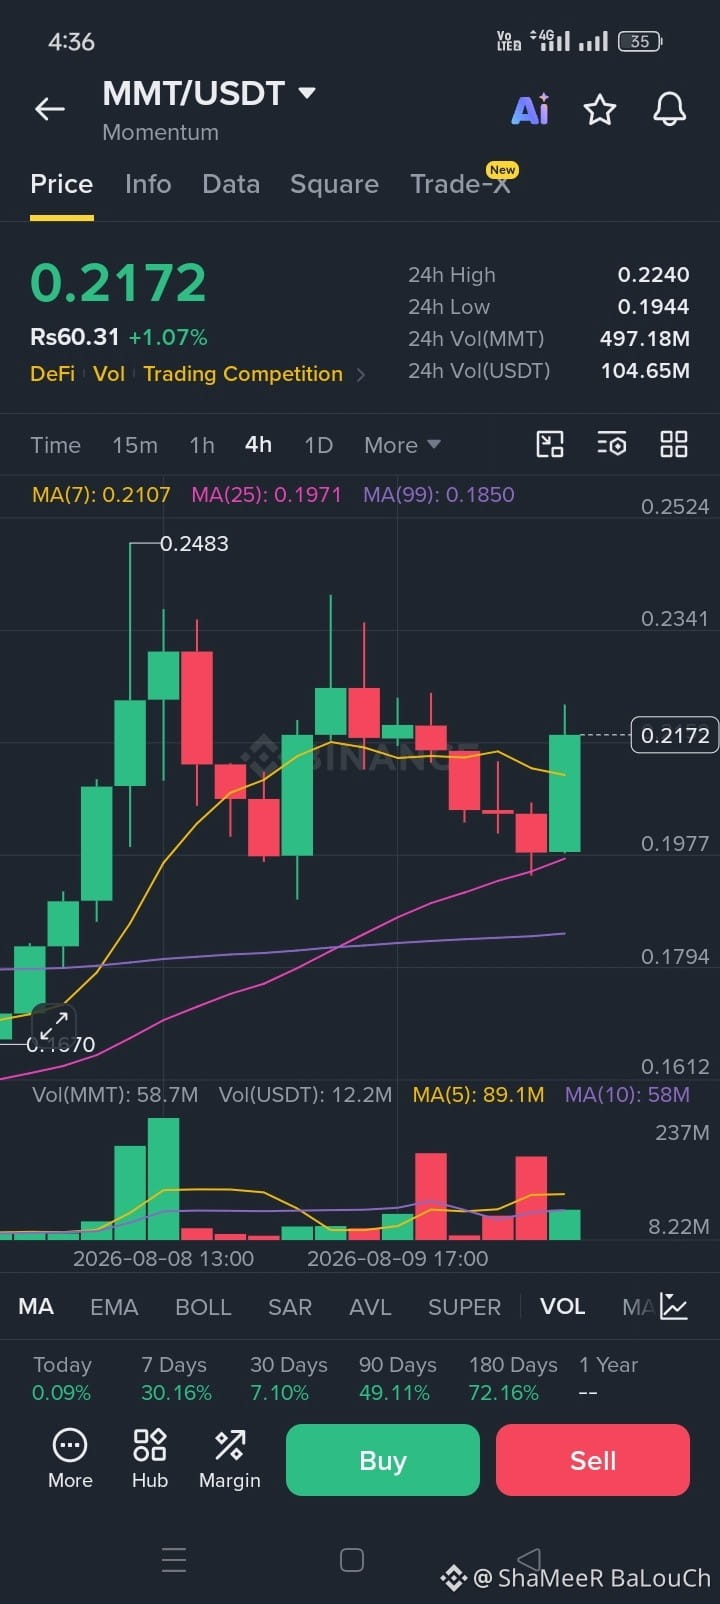
$MMT / USDT: 強気が$0.21を奪還 — 次は$0.224か?
勢い(MMT)は$0.2172付近で取引されており、$0.1977のエリアから跳ね返した後、4Hチャートで強い回復を見せています。
🔹 24H 高値: $0.2240
🔹 24H 安値: $0.1944
🔹 MA(7): $0.2107
🔹 MA(25): $0.1971
🔹 MA(99): $0.1850
📈 テクニカル見通し
MMTは$0.1977のサポートから力強く反発し、MA(7)を奪還しながら、MA(25)およびMA(99)の上をしっかり維持しています。これにより、より広い4Hの構造は強気を保っています。
$0.217〜$0.224を継続して上回れば、過去の高値である$0.234付近が視野に入ります。
買い手の勢いが失われる場合は、最初のサポートが$0.2107、その次が$0.1977です。
🎯 重要レベル
🟩 サポート: $0.2107 → $0.1977
🟥 レジスタンス: $0.2240 → $0.2341
⬆️ 強気の目標: $0.2483
⚠️ MMTは変動が大きいため、確認を待ちつつリスク管理を慎重に行ってください。
$MMT
{spot}(MMTUSDT)
$MMT / USDT: 強気が$0.21を奪還 — 次は$0.224か?
勢い(MMT)は$0.2172付近で取引されており、$0.1977のエリアから跳ね返した後、4Hチャートで強い回復を見せています。
🔹 24H 高値: $0.2240
🔹 24H 安値: $0.1944
🔹 MA(7): $0.2107
🔹 MA(25): $0.1971
🔹 MA(99): $0.1850
📈 テクニカル見通し
MMTは$0.1977のサポートから力強く反発し、MA(7)を奪還しながら、MA(25)およびMA(99)の上をしっかり維持しています。これにより、より広い4Hの構造は強気を保っています。
$0.217〜$0.224を継続して上回れば、過去の高値である$0.234付近が視野に入ります。
買い手の勢いが失われる場合は、最初のサポートが$0.2107、その次が$0.1977です。
🎯 重要レベル
🟩 サポート: $0.2107 → $0.1977
🟥 レジスタンス: $0.2240 → $0.2341
⬆️ 強気の目標: $0.2483
⚠️ MMTは変動が大きいため、確認を待ちつつリスク管理を慎重に行ってください。
$MMT
178
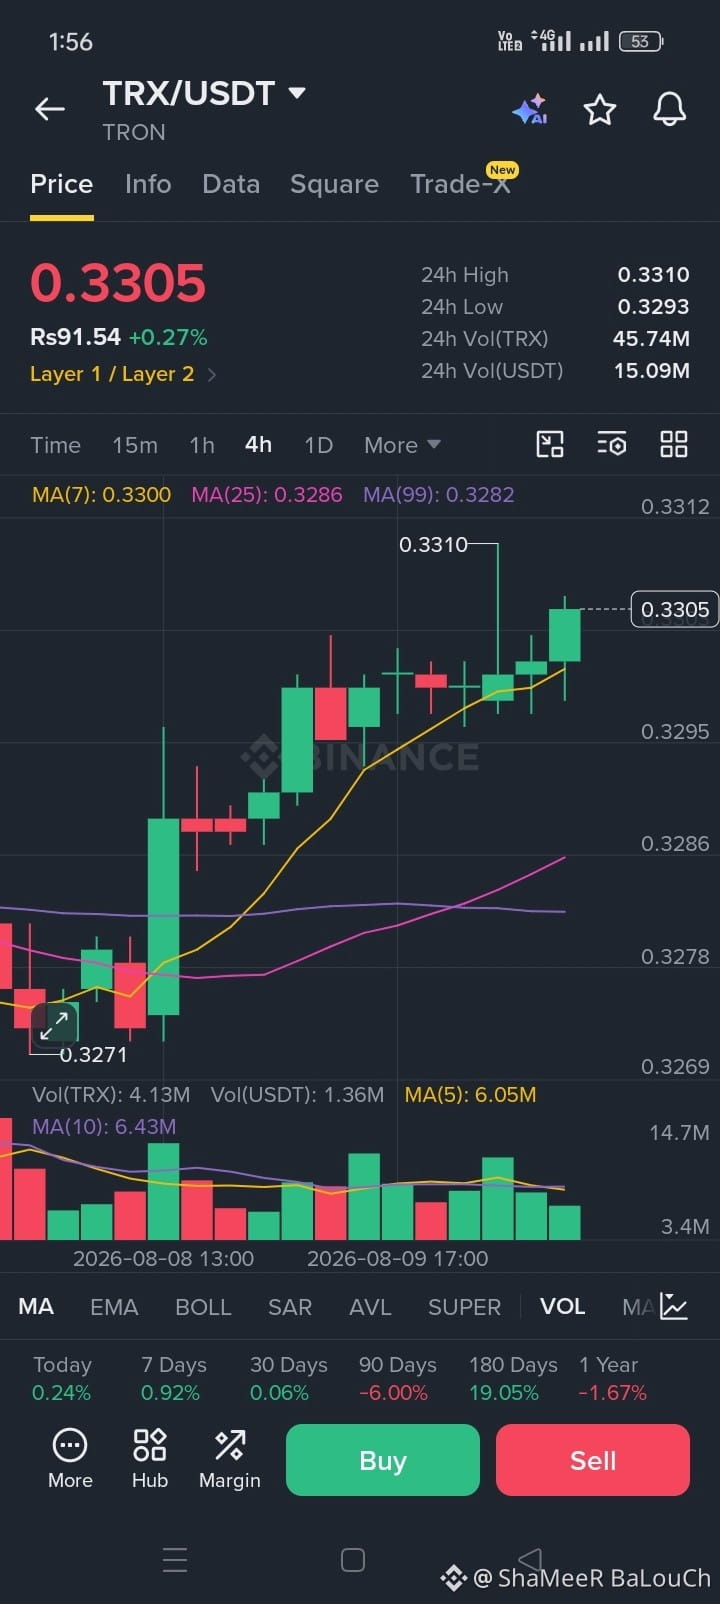
$TRX / 米ドルテザー(USDT): 強気テスト $0.3310 のレジスタンス
TRON(TRX)はおよそ $0.3305 で取引されており、4時間足チャートで安定した強気モメンタムを示しています。
🔹 24H 高値: $0.3310
🔹 24H 安値: $0.3293
🔹 MA(7): $0.3300
🔹 MA(25): $0.3286
🔹 MA(99): $0.3282
📈 テクニカル見通し
TRX は3つの移動平均すべての上に維持されており、短期の構造は強気です。価格は現在、$0.3310〜$0.3312 のレジスタンス帯に接近しています。
$0.3312 を上回るきれいな4時間足の終値が出れば、$0.3325〜$0.3340 方向への動きを支える可能性があります。
ブレイクが失敗した場合、最初のサポートは $0.3295、その次が $0.3282〜$0.3286 です。
🎯 重要レベル
🟩 サポート: $0.3295 → $0.3282
🟥 レジスタンス: $0.3310 → $0.3312
⬆️ 強気目標: $0.3325 → $0.3340
⚠️ ブレイクの確認を待ち、リスク管理を慎重に行いましょう。
$TRX
{spot}(TRXUSDT)
$TRB
{spot}(TRBUSDT)
$TRX / 米ドルテザー(USDT): 強気テスト $0.3310 のレジスタンス
TRON(TRX)はおよそ $0.3305 で取引されており、4時間足チャートで安定した強気モメンタムを示しています。
🔹 24H 高値: $0.3310
🔹 24H 安値: $0.3293
🔹 MA(7): $0.3300
🔹 MA(25): $0.3286
🔹 MA(99): $0.3282
📈 テクニカル見通し
TRX は3つの移動平均すべての上に維持されており、短期の構造は強気です。価格は現在、$0.3310〜$0.3312 のレジスタンス帯に接近しています。
$0.3312 を上回るきれいな4時間足の終値が出れば、$0.3325〜$0.3340 方向への動きを支える可能性があります。
ブレイクが失敗した場合、最初のサポートは $0.3295、その次が $0.3282〜$0.3286 です。
🎯 重要レベル
🟩 サポート: $0.3295 → $0.3282
🟥 レジスタンス: $0.3310 → $0.3312
⬆️ 強気目標: $0.3325 → $0.3340
⚠️ ブレイクの確認を待ち、リスク管理を慎重に行いましょう。
$TRX
$TRB
424
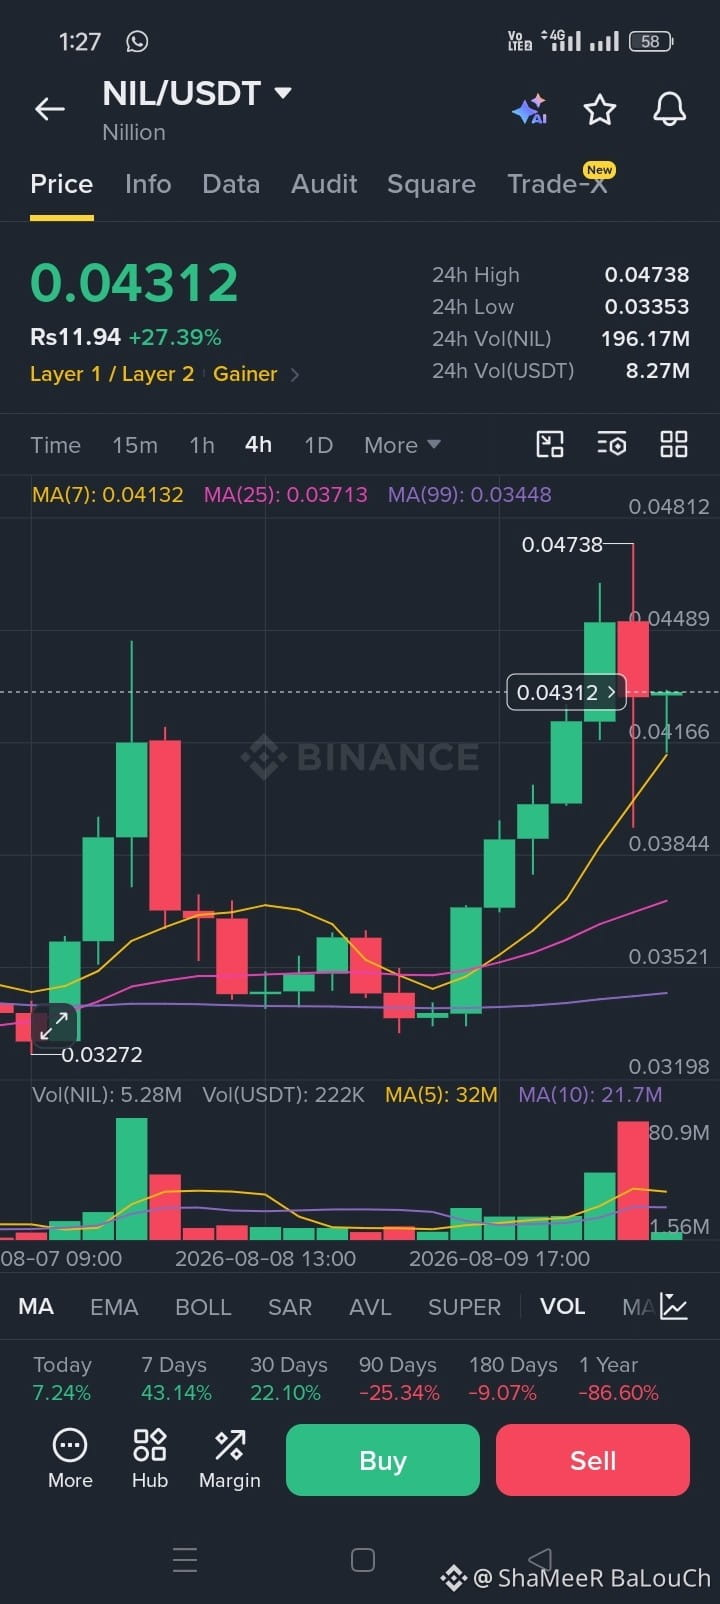
$NIL / USDT: 強気が$0.04738へ接近 — ブレイクアウトは目前?
Nillion(NIL)は$0.04312前後で取引されており、24Hで27.39%上昇。4Hチャートでは強い強気モメンタムを示しています。
🔹 24H 高値: $0.04738
🔹 24H 安値: $0.03353
🔹 MA(7): $0.04132
🔹 MA(25): $0.03713
🔹 MA(99): $0.03448
📈 テクニカル見通し
NILは主要な移動平均線を上抜けており、強気の構造を維持しています。直近の$0.04738への上昇は強い買いの関心を示しますが、その水準からの跳ね返り(拒否)は利益確定の動きも示唆しています。
$0.0416〜$0.0413を維持できれば、強気のセットアップを保てる可能性があります。$0.04738〜$0.04812での明確なブレイクアウトが起これば、より高い水準への道が開けるかもしれません。
🎯 重要レベル
🟩 サポート: $0.0413 → $0.0384
🟥 レジスタンス: $0.0449 → $0.0474
⬆️ ブレイクアウト: $0.0481超
⚠️ 強い27%の上昇の後は、ボラティリティが高い状態が続くことがあります。適切なリスク管理を行い、確認を待ちましょう。
$NIL
{spot}(NILUSDT)
$NIL / USDT: 強気が$0.04738へ接近 — ブレイクアウトは目前?
Nillion(NIL)は$0.04312前後で取引されており、24Hで27.39%上昇。4Hチャートでは強い強気モメンタムを示しています。
🔹 24H 高値: $0.04738
🔹 24H 安値: $0.03353
🔹 MA(7): $0.04132
🔹 MA(25): $0.03713
🔹 MA(99): $0.03448
📈 テクニカル見通し
NILは主要な移動平均線を上抜けており、強気の構造を維持しています。直近の$0.04738への上昇は強い買いの関心を示しますが、その水準からの跳ね返り(拒否)は利益確定の動きも示唆しています。
$0.0416〜$0.0413を維持できれば、強気のセットアップを保てる可能性があります。$0.04738〜$0.04812での明確なブレイクアウトが起これば、より高い水準への道が開けるかもしれません。
🎯 重要レベル
🟩 サポート: $0.0413 → $0.0384
🟥 レジスタンス: $0.0449 → $0.0474
⬆️ ブレイクアウト: $0.0481超
⚠️ 強い27%の上昇の後は、ボラティリティが高い状態が続くことがあります。適切なリスク管理を行い、確認を待ちましょう。
$NIL
86
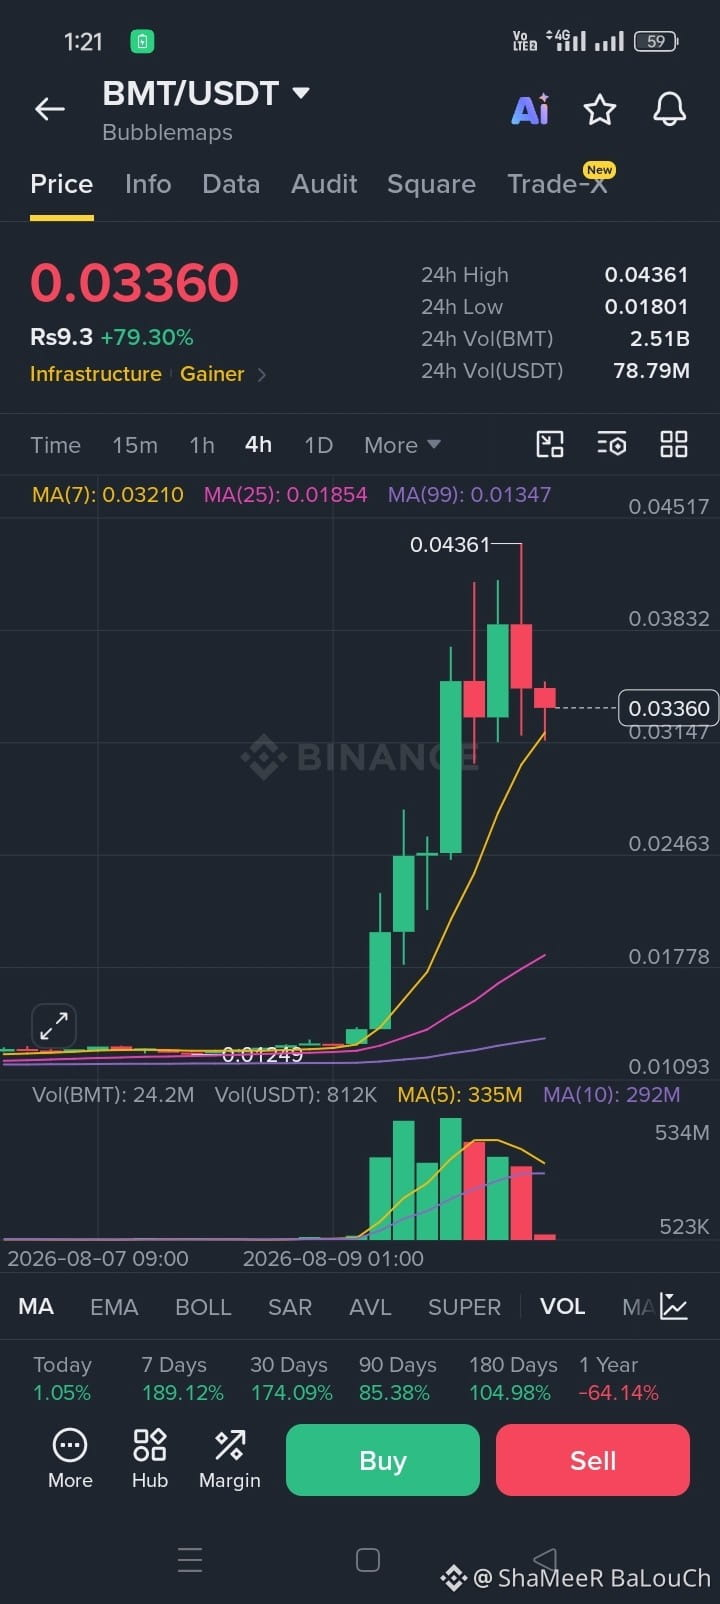
📌$BMT / USDT: 急騰79%の大爆発—ブルズは$0.0436を突破できる?
📊 BubbleMaps(BMT)は爆発的な勢いを示しており、現在は約$0.03360で取引されていて、過去24時間で+79.30%です。
🔹 24H 高値: $0.04361
🔹 24H 安値: $0.01801
🔹 MA(7): $0.03210
🔹 MA(25): $0.01854
🔹 MA(99): $0.01347
📈 テクニカル見通し
BMTは非常に強い出来高を伴う力強いブレイクアウトを達成し、価格はMA(25)およびMA(99)を大きく上回っています。$0.04361に到達した後、チャートではいくつかの利益確定の動きが見られます。
主要サポート: $0.031〜$0.032
大きなレジスタンス: $0.0383〜$0.0436
BMTが$0.031〜$0.032のゾーンを維持できれば、$0.0383および$0.0436に向けた次の試みが可能になるかもしれません。
⚠️ $0.031を下回るブレイクが起きると、$0.0246付近までのより深い押し目につながる可能性があります。
🎯 重要なレベル
🟩 サポート: $0.0321 → $0.0246
🟥 レジスタンス: $0.0383 → $0.0436
⬆️ $0.0436を上抜けるブレイクアウトは、さらなる上昇余地を示唆する可能性があります。
高ボラティリティ: 1日の+79%の値動きの後は、リスク管理を慎重に行いましょう。
$BMT
{spot}(BMTUSDT)
#BMT #BMTUSDT #BubbleMaps #Binance
📌$BMT / USDT: 急騰79%の大爆発—ブルズは$0.0436を突破できる?
📊 BubbleMaps(BMT)は爆発的な勢いを示しており、現在は約$0.03360で取引されていて、過去24時間で+79.30%です。
🔹 24H 高値: $0.04361
🔹 24H 安値: $0.01801
🔹 MA(7): $0.03210
🔹 MA(25): $0.01854
🔹 MA(99): $0.01347
📈 テクニカル見通し
BMTは非常に強い出来高を伴う力強いブレイクアウトを達成し、価格はMA(25)およびMA(99)を大きく上回っています。$0.04361に到達した後、チャートではいくつかの利益確定の動きが見られます。
主要サポート: $0.031〜$0.032
大きなレジスタンス: $0.0383〜$0.0436
BMTが$0.031〜$0.032のゾーンを維持できれば、$0.0383および$0.0436に向けた次の試みが可能になるかもしれません。
⚠️ $0.031を下回るブレイクが起きると、$0.0246付近までのより深い押し目につながる可能性があります。
🎯 重要なレベル
🟩 サポート: $0.0321 → $0.0246
🟥 レジスタンス: $0.0383 → $0.0436
⬆️ $0.0436を上抜けるブレイクアウトは、さらなる上昇余地を示唆する可能性があります。
高ボラティリティ: 1日の+79%の値動きの後は、リスク管理を慎重に行いましょう。
$BMT
#BMT #BMTUSDT #BubbleMaps #Binance
151
ログインして、さらにコンテンツを読む
厳選トピックで世界の暗号資産トレーダーの仲間入り
⚡️ 暗号資産に関する最新かつ有益な情報が見つかります。
💬 世界最大の暗号資産取引所から信頼されています。
👍 認証を受けたクリエイターから、有益なインサイトを得られます。
メール / 電話番号