

Oleg542
1.5k 投稿

Oleg542
Привіт 👋 я ентузіаст в сфері крипти, активно вивчаю ринок, тому якщо щось потрібно, я на зв'язку 🤝
取引を発注
高頻度トレーダー
4.4年
98 フォロー
399 フォロワー
735 いいね
投稿
ポートフォリオ
すべて
引用
ライブ
翻訳参照

Andrii Obolon
·
--
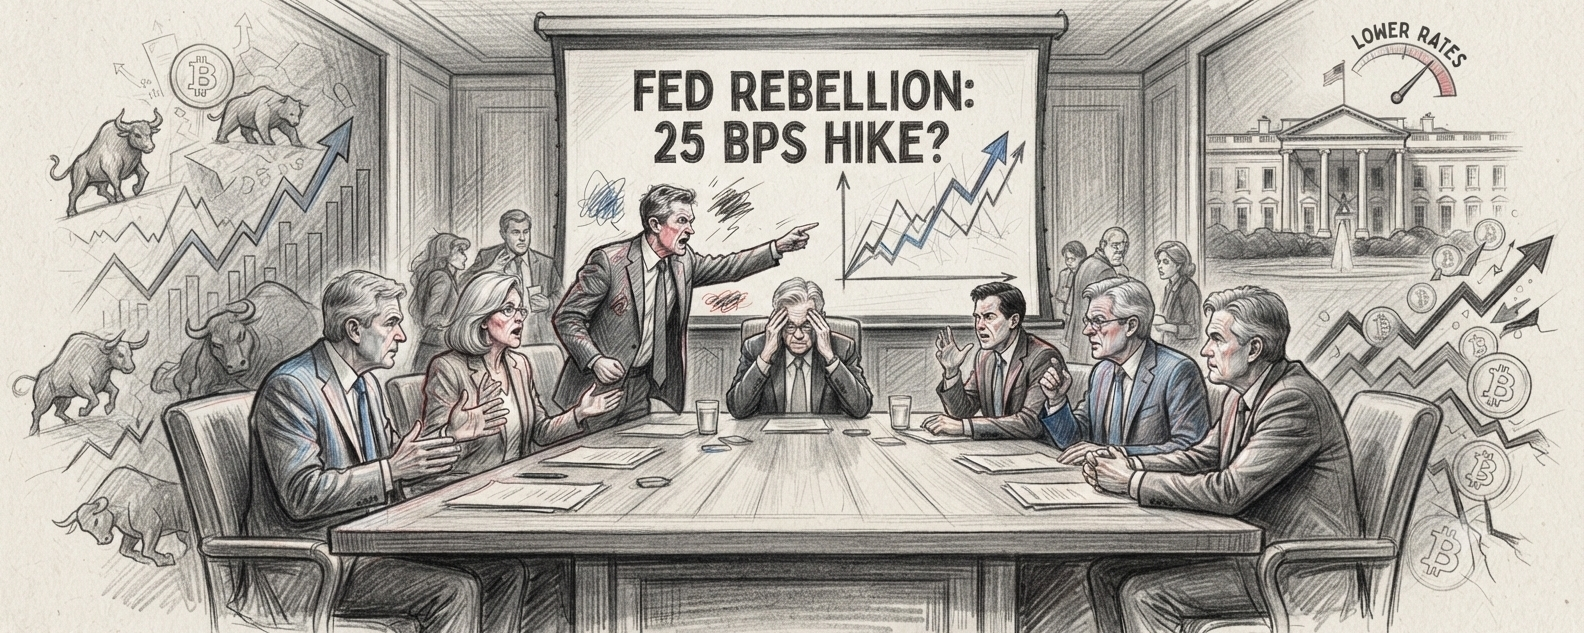
FRBの反乱
FRBの反乱:なぜ今日の会合が市場を揺るがし得るのか
世界は、ここ数年で最も劇的な米連邦準備制度(FRB)の決定を前に息をのんでいる。新たなエネルギー・ショックに加え、インフレが急騰し、さらにホワイトハウスからの「金利を引き下げろ」との強い政治的圧力が高まる中、FRBには存亡をかけた選択が迫られている。
先物市場は、急激な転換と25ベーシスポイントの利上げ(3.75%〜4.00%のレンジ)となる確率を織り込んでいる。これは、2023年以来初めて金融政策を引き締めることを意味し、政権の意向に逆らう形となる。焦点は、中央銀行が、7月の分岐局面(分科の結果)以降、その一歩を踏み出す勇気があるかどうかだ。7月には、3人の委員が、長い間で初めて「金利据え置き」に反対票を投じていた。
世界は、ここ数年で最も劇的な米連邦準備制度(FRB)の決定を前に息をのんでいる。新たなエネルギー・ショックに加え、インフレが急騰し、さらにホワイトハウスからの「金利を引き下げろ」との強い政治的圧力が高まる中、FRBには存亡をかけた選択が迫られている。
先物市場は、急激な転換と25ベーシスポイントの利上げ(3.75%〜4.00%のレンジ)となる確率を織り込んでいる。これは、2023年以来初めて金融政策を引き締めることを意味し、政権の意向に逆らう形となる。焦点は、中央銀行が、7月の分岐局面(分科の結果)以降、その一歩を踏み出す勇気があるかどうかだ。7月には、3人の委員が、長い間で初めて「金利据え置き」に反対票を投じていた。
Andrii Obolon
·
--
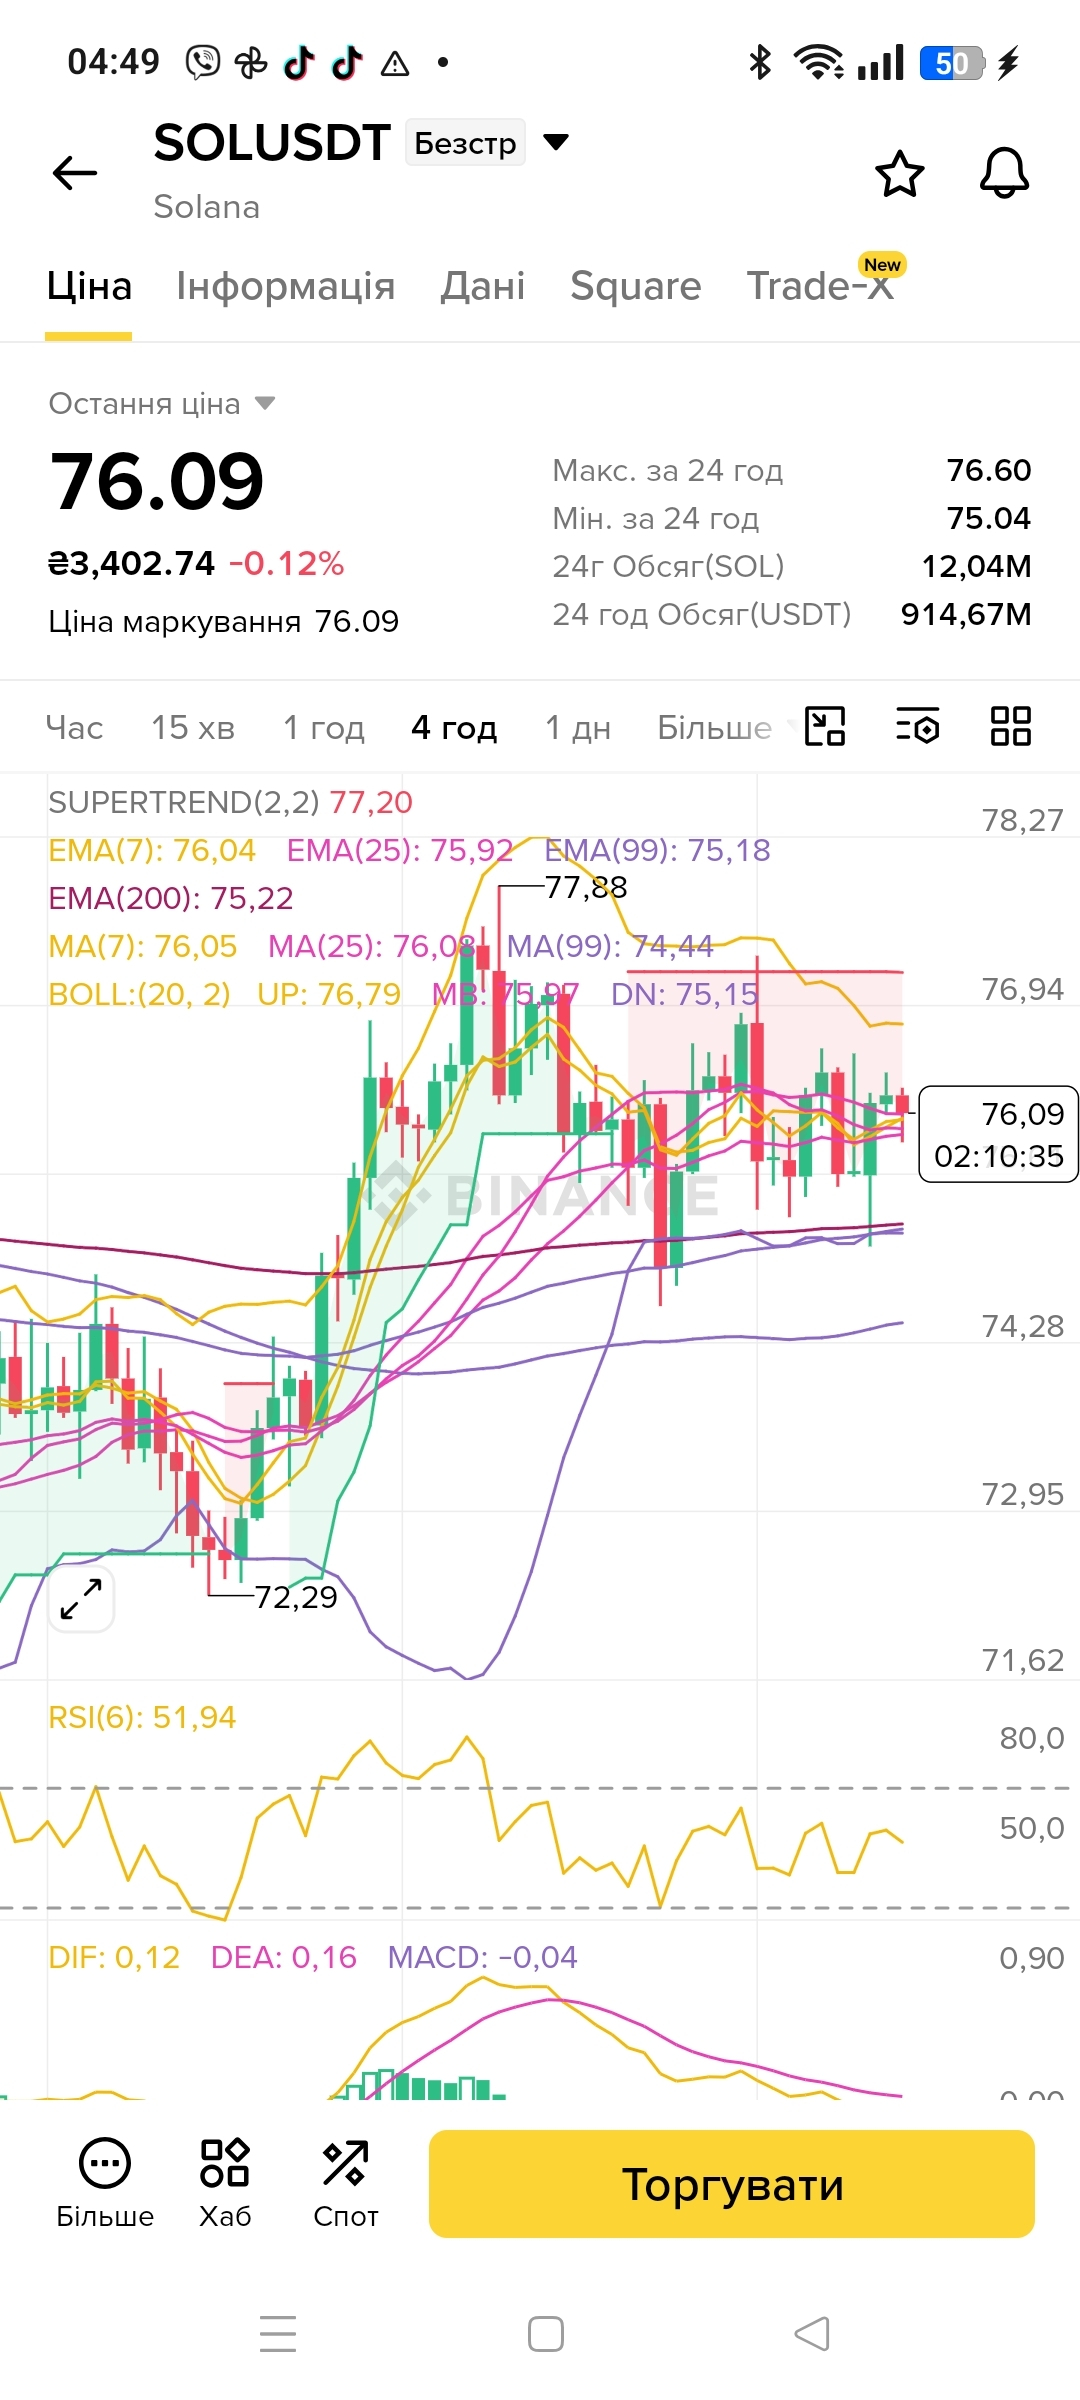
🪙 資産: $SOL /USDT(Binance)
🔴 方向: ショート(売りポジション)
📉 トレンド: 下降修正トレンド。価格は77.88(チャートの高値)から現在の76.09まで反落しており、約2.3%の調整。価格はEMA(7) 76.04、EMA(25) 75.92、EMA(99) 75.18、EMA(200) 75.22の上で推移している一方、Supertrend 77.20の下にあるため、混在した状況で短期的には弱気寄り。RSI(6)は51.94で中立ゾーン、いまのところ売られ過ぎの兆候はなく、さらなる下落余地あり。MACDはマイナス(DIF 0.12、DEA 0.16、MACD -0.04)—プラス圏での弱気クロスで弱さを裏付け。Supertrend 77.20は赤色で価格より上—追加の弱さシグナル。出来高は914.67Mドルで高いアクティビティを示している。
🎯 トレーディング設定
🎯 エントリー: 76.00 – 76.50
🛑 ストップロス: 78.00(Supertrend 77.20より上 / 足元の高値77.88 + バッファ)
📉 利確:
🔴 TP1: 75.00 — 直近24h安値75.04の下 / BOLL DN 75.15
🔴 TP2: 74.00 — EMA(99) 75.18 / EMA(200) 75.22の下
🔴 TP3: 72.50 — 足元の底72.29に接近
🔑 重要な水準
🔵 ボトム(72.29): ローカル最安値 / 成長開始レベル
🔴 レジスタンス(77.88): ローカル高値 / 下落開始レベル
🟢 サポート(75.15): BOLL DN / 近辺の動的水準
🎯 エントリーゾーン(76.00–76.50): 現在のゾーン / EMA(7) 76.04の下からのリテスト
🛑 ストップロス(78.00): Supertrendおよび局所高値の上にバッファを加えた水準
⚠️ 免責事項: 本分析は金融アドバイスではありません。取引は自己責任で行ってください。
$SOL
🔴 方向: ショート(売りポジション)
📉 トレンド: 下降修正トレンド。価格は77.88(チャートの高値)から現在の76.09まで反落しており、約2.3%の調整。価格はEMA(7) 76.04、EMA(25) 75.92、EMA(99) 75.18、EMA(200) 75.22の上で推移している一方、Supertrend 77.20の下にあるため、混在した状況で短期的には弱気寄り。RSI(6)は51.94で中立ゾーン、いまのところ売られ過ぎの兆候はなく、さらなる下落余地あり。MACDはマイナス(DIF 0.12、DEA 0.16、MACD -0.04)—プラス圏での弱気クロスで弱さを裏付け。Supertrend 77.20は赤色で価格より上—追加の弱さシグナル。出来高は914.67Mドルで高いアクティビティを示している。
🎯 トレーディング設定
🎯 エントリー: 76.00 – 76.50
🛑 ストップロス: 78.00(Supertrend 77.20より上 / 足元の高値77.88 + バッファ)
📉 利確:
🔴 TP1: 75.00 — 直近24h安値75.04の下 / BOLL DN 75.15
🔴 TP2: 74.00 — EMA(99) 75.18 / EMA(200) 75.22の下
🔴 TP3: 72.50 — 足元の底72.29に接近
🔑 重要な水準
🔵 ボトム(72.29): ローカル最安値 / 成長開始レベル
🔴 レジスタンス(77.88): ローカル高値 / 下落開始レベル
🟢 サポート(75.15): BOLL DN / 近辺の動的水準
🎯 エントリーゾーン(76.00–76.50): 現在のゾーン / EMA(7) 76.04の下からのリテスト
🛑 ストップロス(78.00): Supertrendおよび局所高値の上にバッファを加えた水準
⚠️ 免責事項: 本分析は金融アドバイスではありません。取引は自己責任で行ってください。
$SOL

$BNB 0.2 USDTを保有
Andrii Obolon
·
--
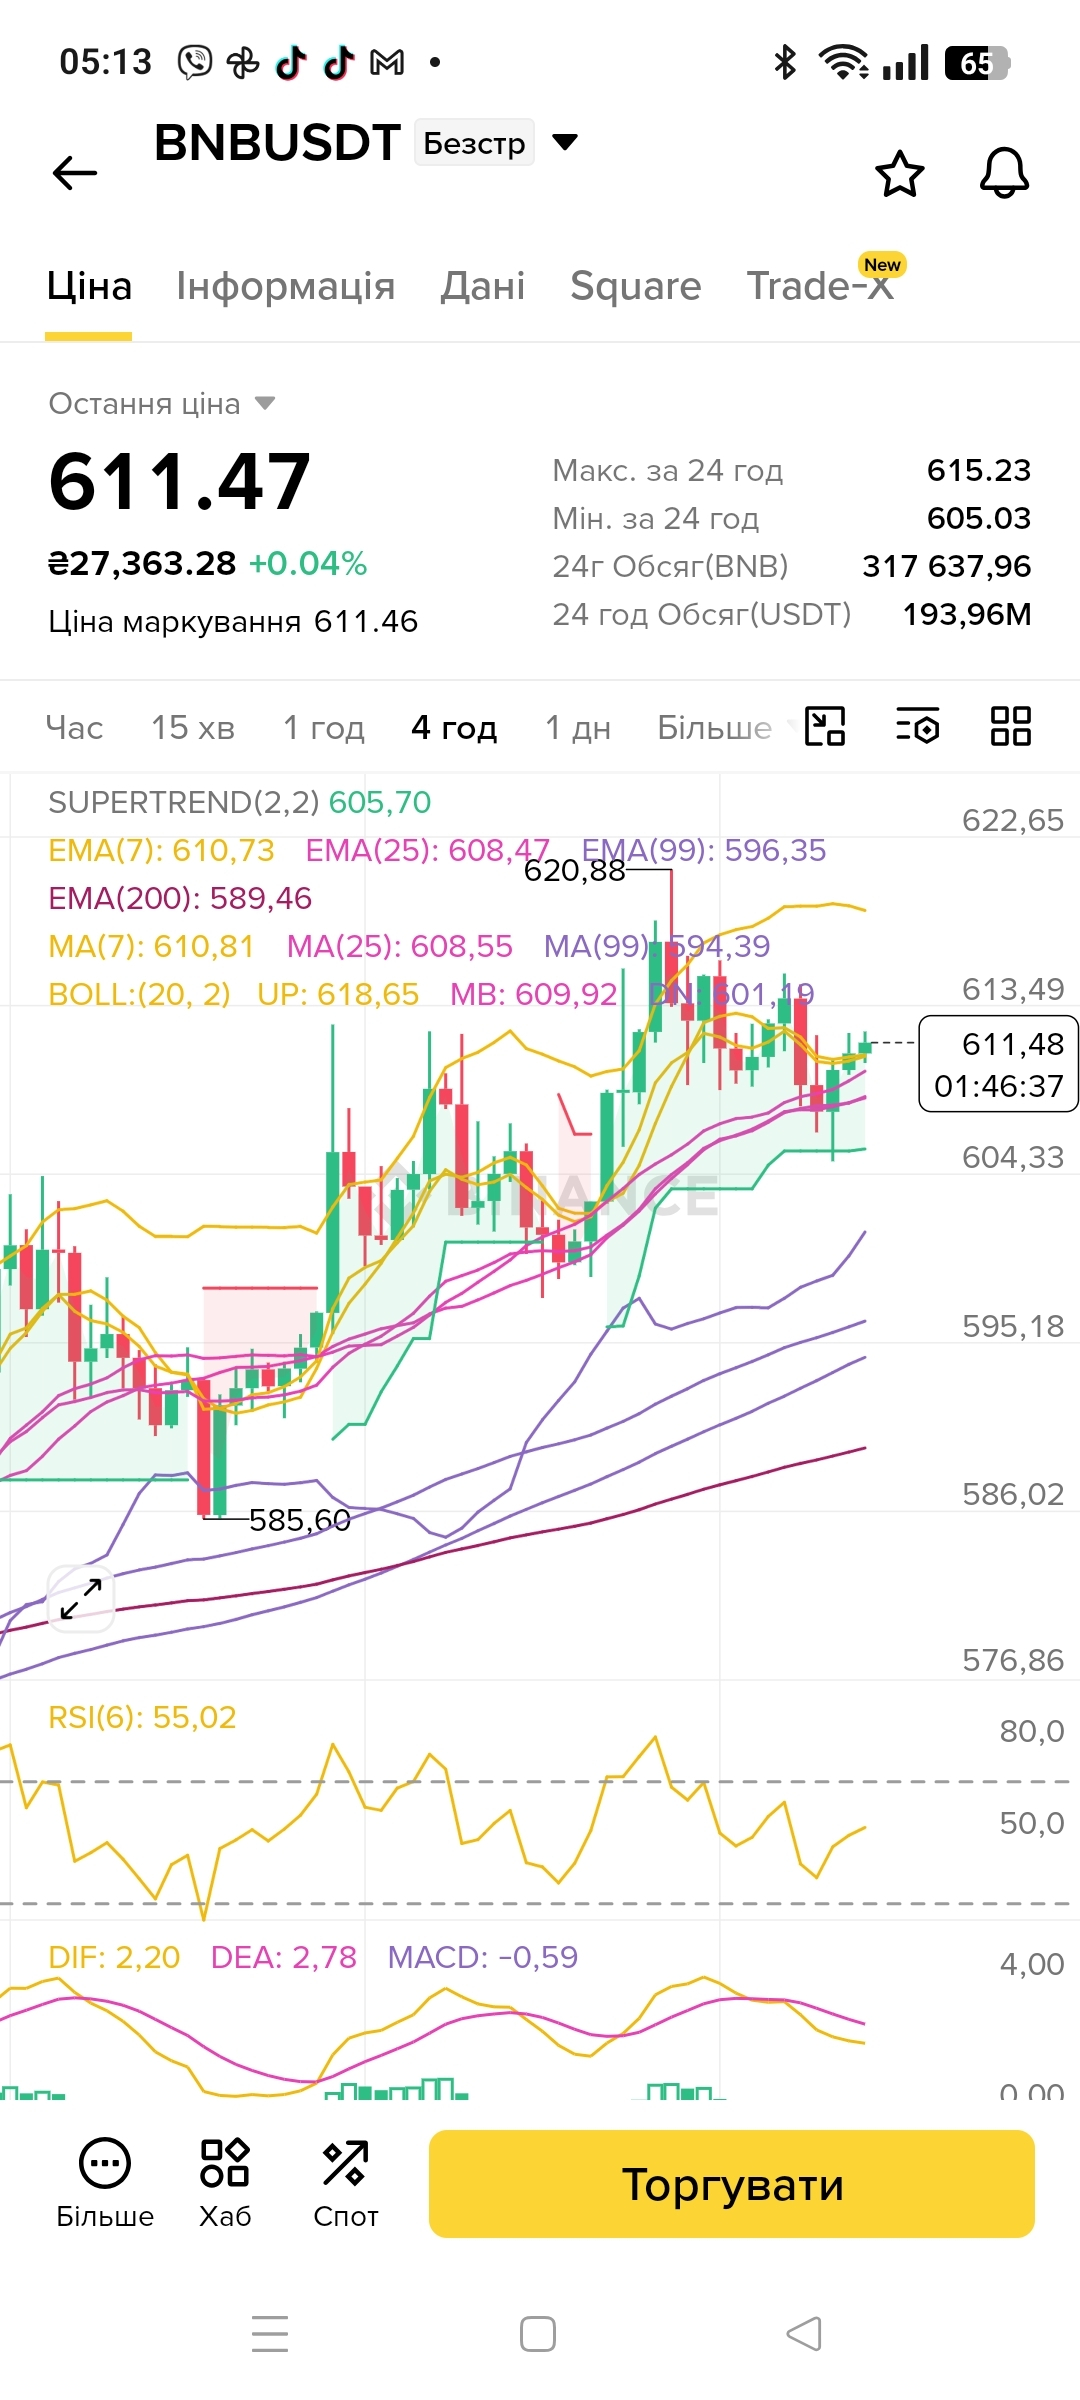
🪙 資産: $BNB /USDT (Binance)
🟢 方向: ロング(買いポジション)
📈 トレンド: 明確な上昇トレンド。価格は585.60(チャート下限)から現在の611.47まで急騰しており、約4.4%の上昇です。価格は主要なすべてのEMAを上回って取引されています:EMA(7) 610.73、EMA(25) 608.47、EMA(99) 596.35、EMA(200) 589.46 — 強気の完全なセットアップ。RSI(6)は55.02で、中立寄りの強気ゾーンにあり、さらなる上昇余地があります。MACDはプラス圏にあります(DIF 2.20、DEA 2.78、MACD -0.59)— 弱い弱気のクロスを示し、成長を継続する前の短期的なレンジ/調整を意味します。Supertrend 605.70は緑で価格の下に位置 — 追加の強さシグナルです。出来高($193.96M)は買いが活発であることを裏付けています。
🎯 取引セットアップ
🎯 エントリー: 610.00 – 611.50
🛑 ロスカット: 602.00(Supertrend 605.70下 / 24時間安値605.03 + バッファ)
📈 利確目標:
🟢 TP1: 615.50 — 24時間高値615.23をブレイク
🟢 TP2: 620.00 — ローカル高値620.88
🟢 TP3: 625.00 — 拡張目標で、630ゾーンに接近
🔑 重要水準
🔵 安値(585.60): ローカル最安値 / 上昇開始レベル
🔴 レジスタンス(620.88): ローカル高値 / 調整開始レベル
🟢 サポート(605.70): Supertrend / 24時間安値605.03
🎯 エントリーゾーン(610.00–611.50): 現在のゾーン / EMA(7) 610.73の上抜け後のリテスト
🛑 ロスカット(602.00): Supertrendと24時間安値の下にバッファ付き
⚠️ 免責事項: 本分析は投資助言ではありません。取引はご自身の判断と責任で行ってください。
$BNB
🟢 方向: ロング(買いポジション)
📈 トレンド: 明確な上昇トレンド。価格は585.60(チャート下限)から現在の611.47まで急騰しており、約4.4%の上昇です。価格は主要なすべてのEMAを上回って取引されています:EMA(7) 610.73、EMA(25) 608.47、EMA(99) 596.35、EMA(200) 589.46 — 強気の完全なセットアップ。RSI(6)は55.02で、中立寄りの強気ゾーンにあり、さらなる上昇余地があります。MACDはプラス圏にあります(DIF 2.20、DEA 2.78、MACD -0.59)— 弱い弱気のクロスを示し、成長を継続する前の短期的なレンジ/調整を意味します。Supertrend 605.70は緑で価格の下に位置 — 追加の強さシグナルです。出来高($193.96M)は買いが活発であることを裏付けています。
🎯 取引セットアップ
🎯 エントリー: 610.00 – 611.50
🛑 ロスカット: 602.00(Supertrend 605.70下 / 24時間安値605.03 + バッファ)
📈 利確目標:
🟢 TP1: 615.50 — 24時間高値615.23をブレイク
🟢 TP2: 620.00 — ローカル高値620.88
🟢 TP3: 625.00 — 拡張目標で、630ゾーンに接近
🔑 重要水準
🔵 安値(585.60): ローカル最安値 / 上昇開始レベル
🔴 レジスタンス(620.88): ローカル高値 / 調整開始レベル
🟢 サポート(605.70): Supertrend / 24時間安値605.03
🎯 エントリーゾーン(610.00–611.50): 現在のゾーン / EMA(7) 610.73の上抜け後のリテスト
🛑 ロスカット(602.00): Supertrendと24時間安値の下にバッファ付き
⚠️ 免責事項: 本分析は投資助言ではありません。取引はご自身の判断と責任で行ってください。
$BNB
Andrii Obolon
·
--
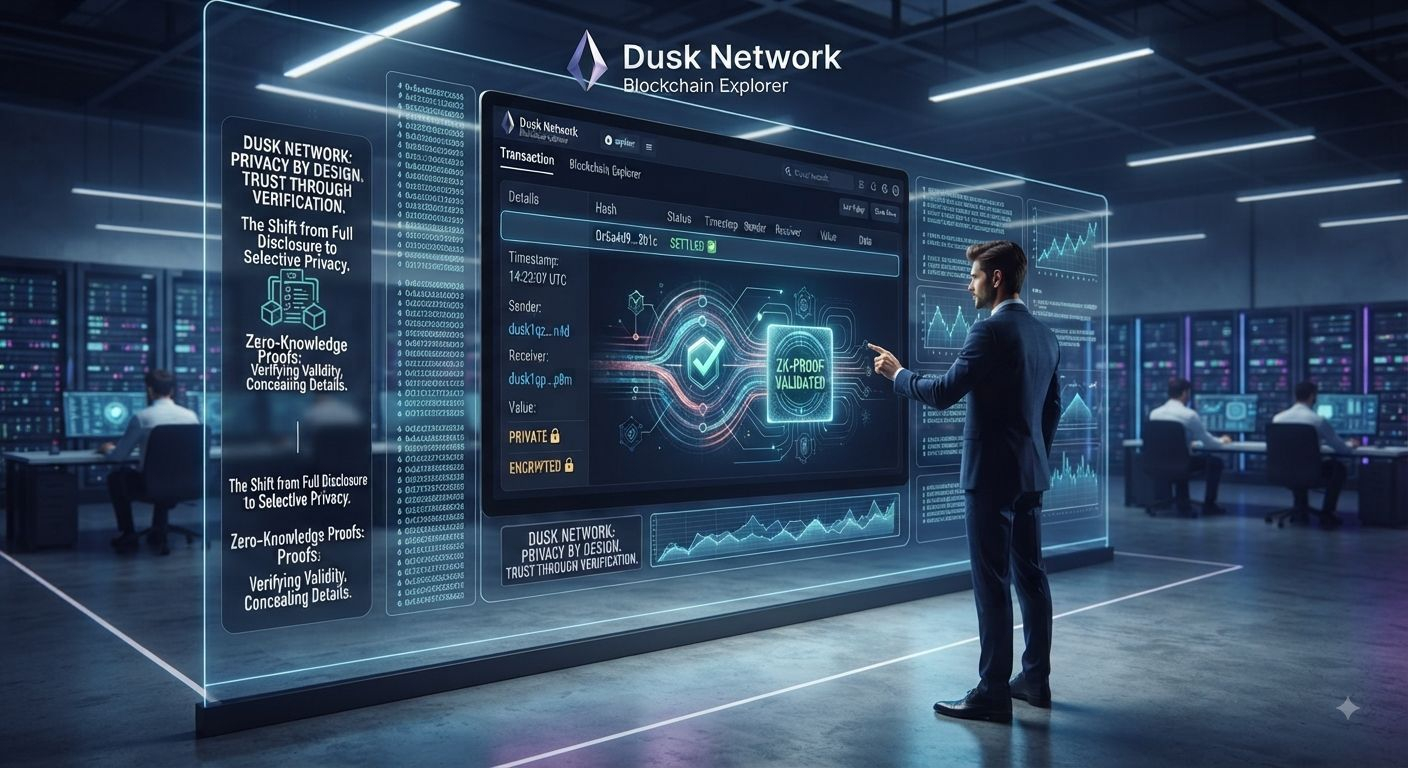
#dusk $DUSK Duskネットワーク上のトランザクションを分析していたところ、思いがけない経験をしました。トランザクションは「settled(確定済み)」というステータスになっているのに、想定される付随データのボリュームが欠けていました。最初はエクスプローラーの遅延のせいだと思いましたが、後になってもっと深い真実に気づきました。
パブリック・ブロックチェーンでは、完全な透明性と、すべての操作の詳細を開示することで信頼を築くことに慣れています。けれども、プライバシーに重きを置いたインフラは別のパラダイムを提供します。つまり、トランザクションが有効であることを知ることと、そのすべての詳細を知ることは同じではない、ということです。
そのような仕組みでは、信頼はあらゆる詳細の開示ではなく、結果の有効性を検証するための暗号学的ツールに基づいています。これはセキュリティへの考え方、ひいては「透明性」という概念全体を根本から変えてしまいます。
#dusk @Dusk $DUSK
パブリック・ブロックチェーンでは、完全な透明性と、すべての操作の詳細を開示することで信頼を築くことに慣れています。けれども、プライバシーに重きを置いたインフラは別のパラダイムを提供します。つまり、トランザクションが有効であることを知ることと、そのすべての詳細を知ることは同じではない、ということです。
そのような仕組みでは、信頼はあらゆる詳細の開示ではなく、結果の有効性を検証するための暗号学的ツールに基づいています。これはセキュリティへの考え方、ひいては「透明性」という概念全体を根本から変えてしまいます。
#dusk @Dusk $DUSK

Andrii Obolon
·
--
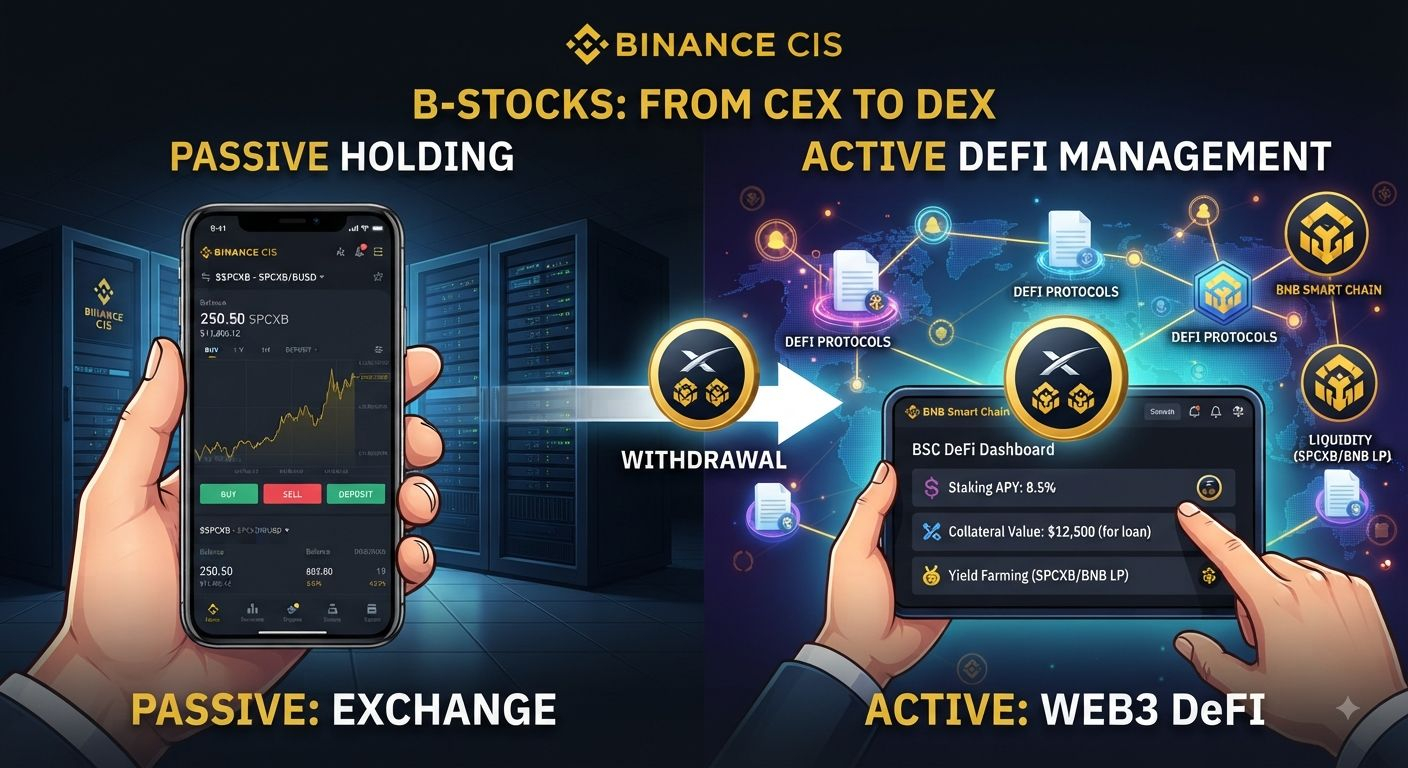
#bstockscis Web3ウォレットに#bstocksсis を出力すると、何が変わるのでしょうか?単なる保管場所の変更ではありません。実際に、$SPCXB (トークン化されたSpaceXの資産)を使ったところ、まったく別のロジックが見えてきました。取引所上のポジションをただ眺めるだけではなく、BNB Smart Chainのエコシステムの中でモビリティが開かれるのです。
#bstocksсis はBEP-20トークンとして機能するため、標準のインターフェースの範囲を超えています。DeFiシナリオ$BNB Chainに統合することで、保有するだけでなく、資産を流動性や担保としても利用できます。これにより、「買って持ち続ける」という従来の戦略が、資本を能動的に管理するものへと変わります。
あなたはどうしていますか:$SPCXB を取引所に置いたままですか、それともWeb3エコシステムに統合しますか?@BinanceCIS
#bstocksсis はBEP-20トークンとして機能するため、標準のインターフェースの範囲を超えています。DeFiシナリオ$BNB Chainに統合することで、保有するだけでなく、資産を流動性や担保としても利用できます。これにより、「買って持ち続ける」という従来の戦略が、資本を能動的に管理するものへと変わります。
あなたはどうしていますか:$SPCXB を取引所に置いたままですか、それともWeb3エコシステムに統合しますか?@BinanceCIS
Andrii Obolon
·
--
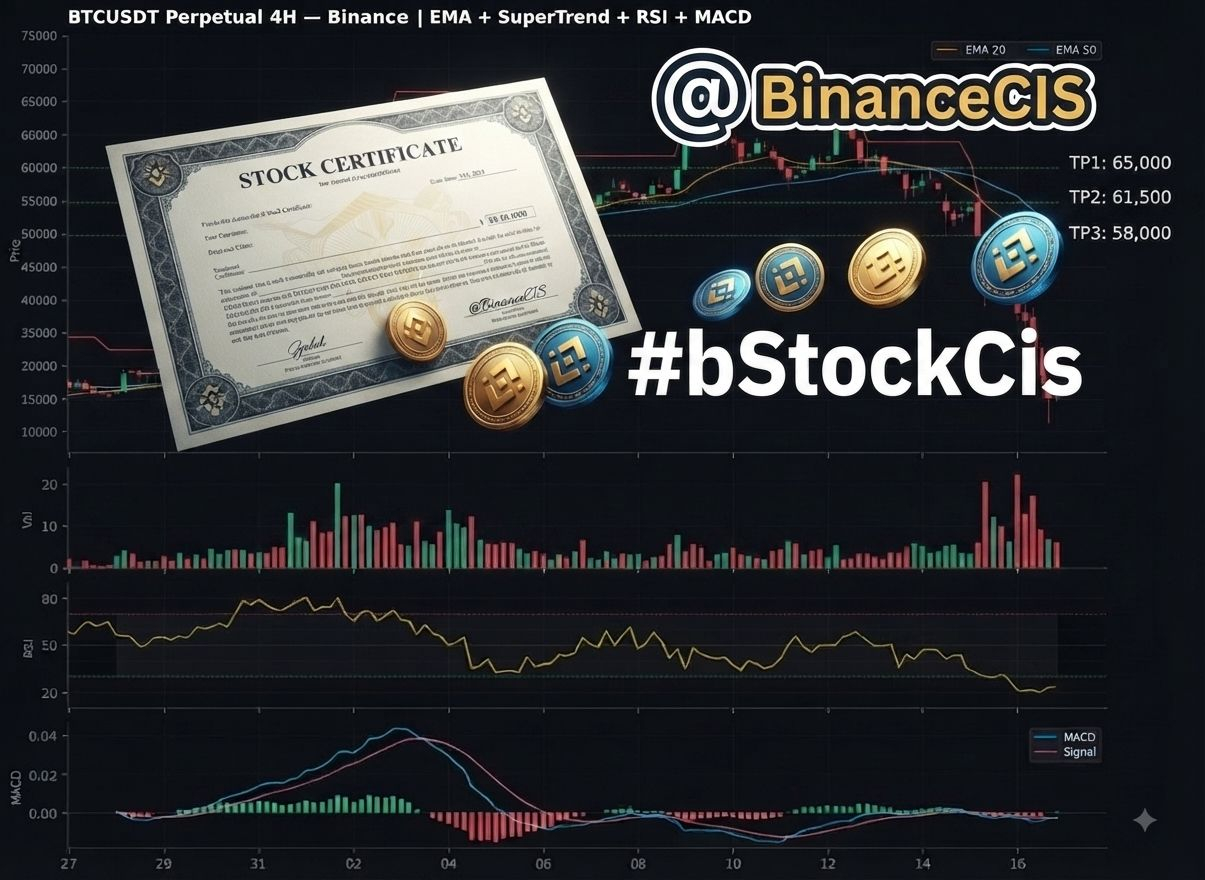
#bstockscis 株式アクセスの進化:なぜトークン化がルールを変えるのか
最初は株式のトークン化に懐疑的でした。基礎となる資産が変わらないなら、なぜ従来の形を変える必要があるのか? しかし、プロジェクト#bstockscic をより詳しく検討したことで、その見方を改めることができました。
主な価値は、資産そのものの形が変わることではなく、それに至る道筋が根本的に簡素化される点にあります。これまで投資家は、時代遅れな仕組みに合わせることを強いられていました:
従来の取引所における厳格な営業時間。
仲介業者の連鎖。
高い参入障壁と最小金額。
トークン化は、こうしたインフラ上の障壁を取り除きます。市場は、規制された場から、必要なタイミングで利用できるしなやかなエコシステムへと変わります。
心理的な側面と参入障壁
端数の取得が可能になり、最小限の必要資本が客観的に下がることで、スタートのための障壁は確実に減ります。とはいえ、技術はアクセスの問題を解決しても、投資家の内面的なためらいをなくすわけではありません。金融規律を築くことは、依然として個人の課題として残ります .@BinanceCIS .$SPCXB $NVDAB
最初は株式のトークン化に懐疑的でした。基礎となる資産が変わらないなら、なぜ従来の形を変える必要があるのか? しかし、プロジェクト#bstockscic をより詳しく検討したことで、その見方を改めることができました。
主な価値は、資産そのものの形が変わることではなく、それに至る道筋が根本的に簡素化される点にあります。これまで投資家は、時代遅れな仕組みに合わせることを強いられていました:
従来の取引所における厳格な営業時間。
仲介業者の連鎖。
高い参入障壁と最小金額。
トークン化は、こうしたインフラ上の障壁を取り除きます。市場は、規制された場から、必要なタイミングで利用できるしなやかなエコシステムへと変わります。
心理的な側面と参入障壁
端数の取得が可能になり、最小限の必要資本が客観的に下がることで、スタートのための障壁は確実に減ります。とはいえ、技術はアクセスの問題を解決しても、投資家の内面的なためらいをなくすわけではありません。金融規律を築くことは、依然として個人の課題として残ります .@BinanceCIS .$SPCXB $NVDAB
Andrii Obolon
·
--
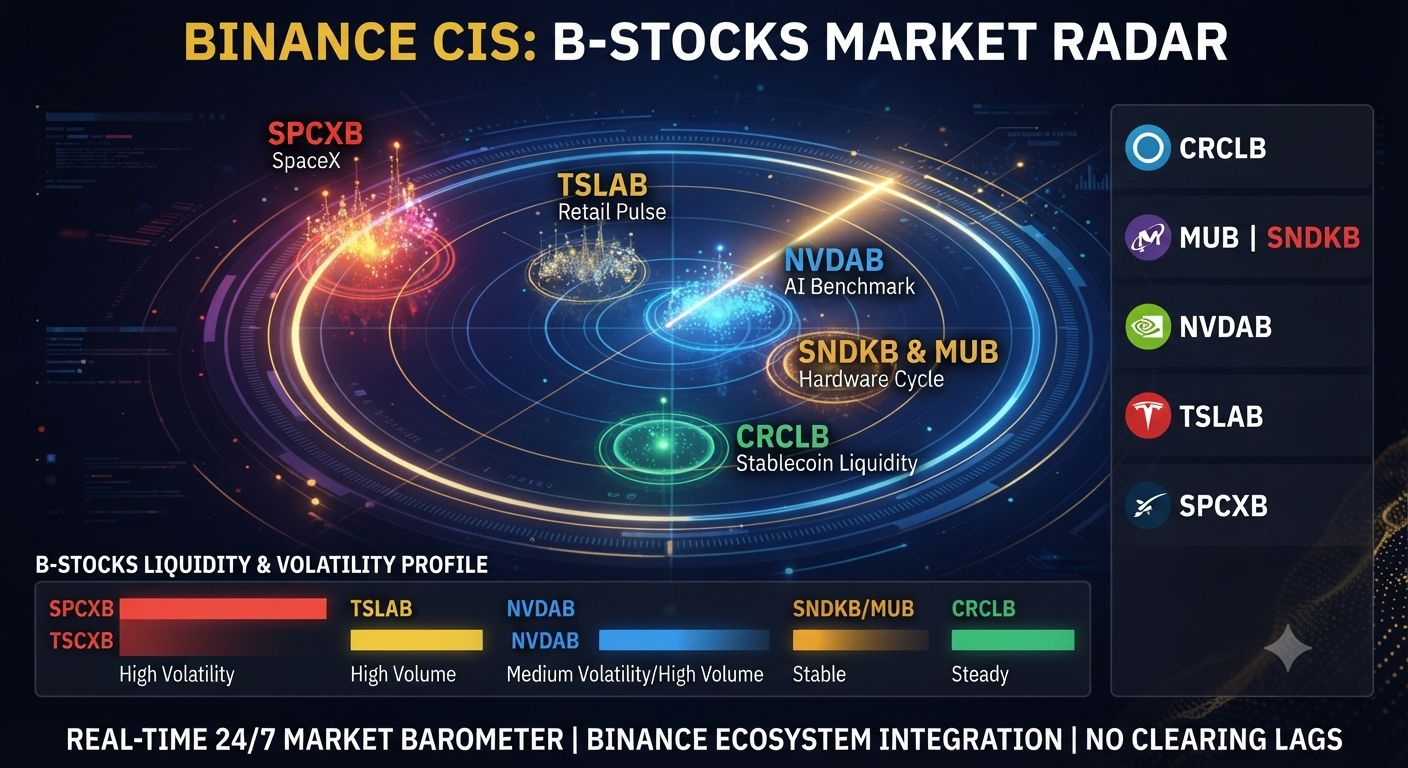
#bstockscis トークン化された資産(bStocks)— 市場の指標
bStocksは、従来の清算システムに遅延なく、24/7で市場心理と取引の運用上のバロメーターです。
主要なシグナル:
🚀 $SPCXB B(SpaceX):投機的な食欲と、プライベート資産への関心。
⚡ TSLAB(Tesla):リテールの鼓動と、夜間のマクロニュースへの反応。
🤖 $NVDAB (NVIDIA):人工知能分野への関心のベンチマーク。
💾 $SNDKB & MUB:ハードウェア基盤へのローテーション指標。
🪙 CRCLB(Circle):ステーブルコイン経済のマクロ指標。
結論:bStocksの板(スタック)を分析することで、リアルタイムに実資本の集中度を把握できます。
@BinanceCIS
の更新にご注目ください
bStocksは、従来の清算システムに遅延なく、24/7で市場心理と取引の運用上のバロメーターです。
主要なシグナル:
🚀 $SPCXB B(SpaceX):投機的な食欲と、プライベート資産への関心。
⚡ TSLAB(Tesla):リテールの鼓動と、夜間のマクロニュースへの反応。
🤖 $NVDAB (NVIDIA):人工知能分野への関心のベンチマーク。
💾 $SNDKB & MUB:ハードウェア基盤へのローテーション指標。
🪙 CRCLB(Circle):ステーブルコイン経済のマクロ指標。
結論:bStocksの板(スタック)を分析することで、リアルタイムに実資本の集中度を把握できます。
@BinanceCIS
の更新にご注目ください
Andrii Obolon
·
--
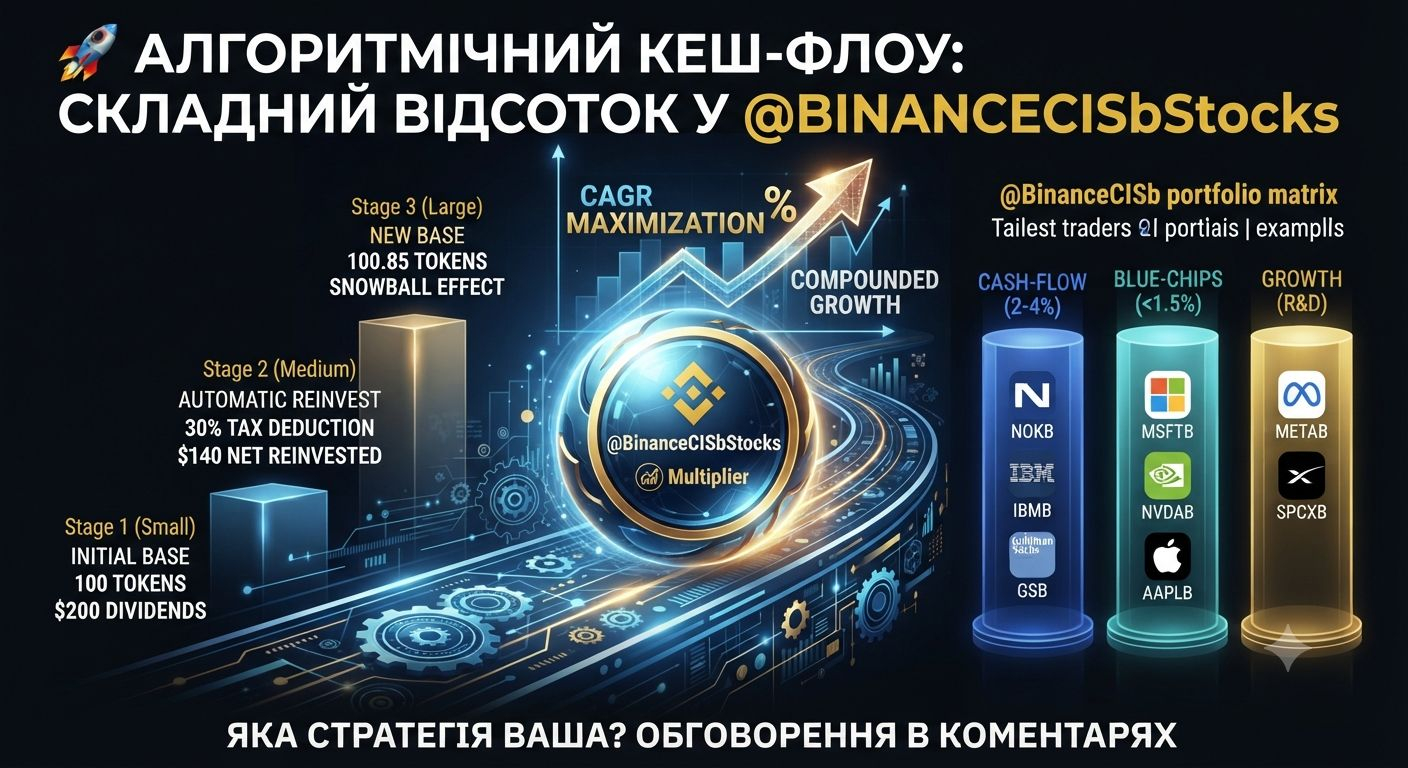
#bstockscis 🚀 アルゴリズム・キャッシュフロー:複利が生む複雑なパーセンテージ効果 @BinanceCIS #bStockCis
プロ向けトレーディングでは、業務上のリスクを最小化し、手作業のルーチンを減らすことが極めて重要です。エコシステム @BinanceCIS のスマートコントラクト Multiplier は、24/7 の再投資を自動化し、継続的な compound(複利)効果によって CAGR 指標を最大化します。
⚙️ 支払い(配当)アーキテクチャ
プロトコルは配当から 30% の税金を自動的に控除し、その残り(純額)を即座に市場での持分の買い戻しへ振り向けます。
Unit Economics:基礎が 100 トークンなら $200 の配当を生みます。税引き後($60)では純フローが $140 となり、再投資によってポジションが 100.85 トークンまで増加します。次のサイクルは、拡張されたベースで既に動き出します(Snowball Effect)。
📊 ポートフォリオ・マトリクス @BinanceCIS
Cash-Flow(2–4%):Nokia(NOKB)、IBM(IBMB)、Goldman Sachs(GSB)— 安定した流動性の創出。
Blue-Chips(<1.5%):Microsoft(MSFTB)、Nvidia(NVDAB)、Apple(AAPLB)— ファンダメンタルの安定性。
Growth(R&D):Meta(METAB)、SpaceX(SPCXB)— 利益を再投資し、資本のアップサイド(上昇余地)を狙います。
コミュニティへのディスカッション:あなたのポートフォリオでは、どちらが優勢ですか?安定したキャッシュフローか、それとも攻めの growth アップサイドか。コメントで教えてください。$SPCXB $METAB $NVDAB
プロ向けトレーディングでは、業務上のリスクを最小化し、手作業のルーチンを減らすことが極めて重要です。エコシステム @BinanceCIS のスマートコントラクト Multiplier は、24/7 の再投資を自動化し、継続的な compound(複利)効果によって CAGR 指標を最大化します。
⚙️ 支払い(配当)アーキテクチャ
プロトコルは配当から 30% の税金を自動的に控除し、その残り(純額)を即座に市場での持分の買い戻しへ振り向けます。
Unit Economics:基礎が 100 トークンなら $200 の配当を生みます。税引き後($60)では純フローが $140 となり、再投資によってポジションが 100.85 トークンまで増加します。次のサイクルは、拡張されたベースで既に動き出します(Snowball Effect)。
📊 ポートフォリオ・マトリクス @BinanceCIS
Cash-Flow(2–4%):Nokia(NOKB)、IBM(IBMB)、Goldman Sachs(GSB)— 安定した流動性の創出。
Blue-Chips(<1.5%):Microsoft(MSFTB)、Nvidia(NVDAB)、Apple(AAPLB)— ファンダメンタルの安定性。
Growth(R&D):Meta(METAB)、SpaceX(SPCXB)— 利益を再投資し、資本のアップサイド(上昇余地)を狙います。
コミュニティへのディスカッション:あなたのポートフォリオでは、どちらが優勢ですか?安定したキャッシュフローか、それとも攻めの growth アップサイドか。コメントで教えてください。$SPCXB $METAB $NVDAB
Andrii Obolon
·
--
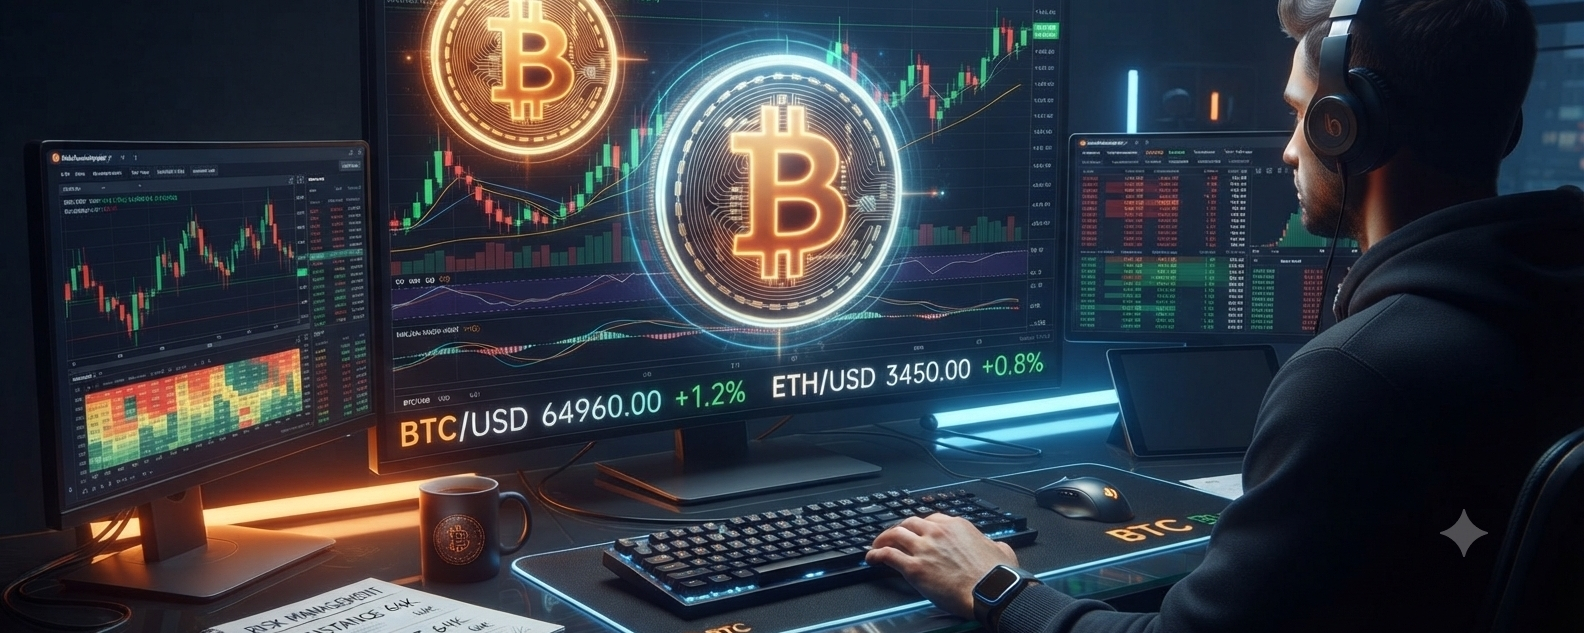
BTC。ぜひ共有し、コメントし、応援してください!ありがとうございます!🤝
🎯 3日間の価格レンジ予測(8月8日〜11日)
週末が控えているため—通常、スポット市場では変動率が低下し、取引高も減りやすい—最も可能性が高いシナリオは、次のコリドー内での推移です:
予想レンジ:$63,800 – $66,400
強気シナリオ(成長):買い手が勢いを維持し、日足チャートで$65,000を上回る水準を定着させられるなら、価格は$66,200 – $66,400のレンジをテストしにいく動きを試みる可能性があります。
弱気シナリオ(調整):短期トレーダーによる利益確定が入った場合、$64,000 – $64,200の強いサポート帯までの押し目が起こり得ます。ただし、週末の間にネガティブなマクロ経済ニュースがない限り、$63,000を大きく下回る急落は起こりにくいでしょう。
週末が控えているため—通常、スポット市場では変動率が低下し、取引高も減りやすい—最も可能性が高いシナリオは、次のコリドー内での推移です:
予想レンジ:$63,800 – $66,400
強気シナリオ(成長):買い手が勢いを維持し、日足チャートで$65,000を上回る水準を定着させられるなら、価格は$66,200 – $66,400のレンジをテストしにいく動きを試みる可能性があります。
弱気シナリオ(調整):短期トレーダーによる利益確定が入った場合、$64,000 – $64,200の強いサポート帯までの押し目が起こり得ます。ただし、週末の間にネガティブなマクロ経済ニュースがない限り、$63,000を大きく下回る急落は起こりにくいでしょう。
Andrii Obolon
·
--
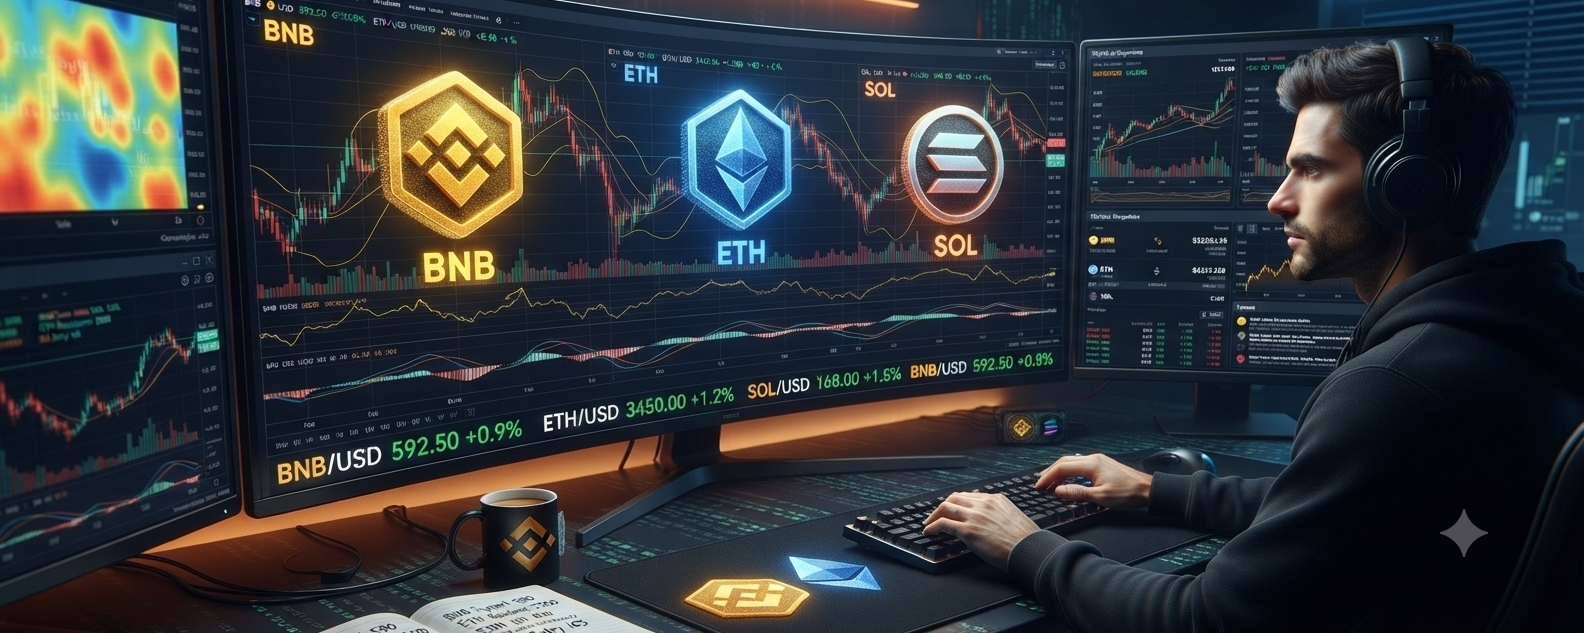
BNB 。ぜひ共有・コメント・応援してください!ありがとうございます!
BNB(バイナンス・コイン)の価格レンジ分析と今後3日間の予測
2026年8月8日時点で、BNBは約592.50ドルで取引されており、堅調な推移を示しています。さらに、進行中のエコシステムのユーティリティによって裏付けられている重要な心理的サポートゾーンである$580-$590の上に位置を維持しています。
以下は、今後3日間(8月11日まで)のBNBに関するテクニカル概要と、予測される取引レンジ(トレーディング・コリドー)です。
📊 主要なサポート・レジスタンス水準
レジスタンス2:$615.00 ~ $625.00(主要な上値目標および過去のブレイクアウトゾーン)。
2026年8月8日時点で、BNBは約592.50ドルで取引されており、堅調な推移を示しています。さらに、進行中のエコシステムのユーティリティによって裏付けられている重要な心理的サポートゾーンである$580-$590の上に位置を維持しています。
以下は、今後3日間(8月11日まで)のBNBに関するテクニカル概要と、予測される取引レンジ(トレーディング・コリドー)です。
📊 主要なサポート・レジスタンス水準
レジスタンス2:$615.00 ~ $625.00(主要な上値目標および過去のブレイクアウトゾーン)。
Andrii Obolon
·
--
#bstockscis #bstockscis 🚀 複利の魔法:@BinanceCIS b
いつでも自動で配当を受け取る24/7!
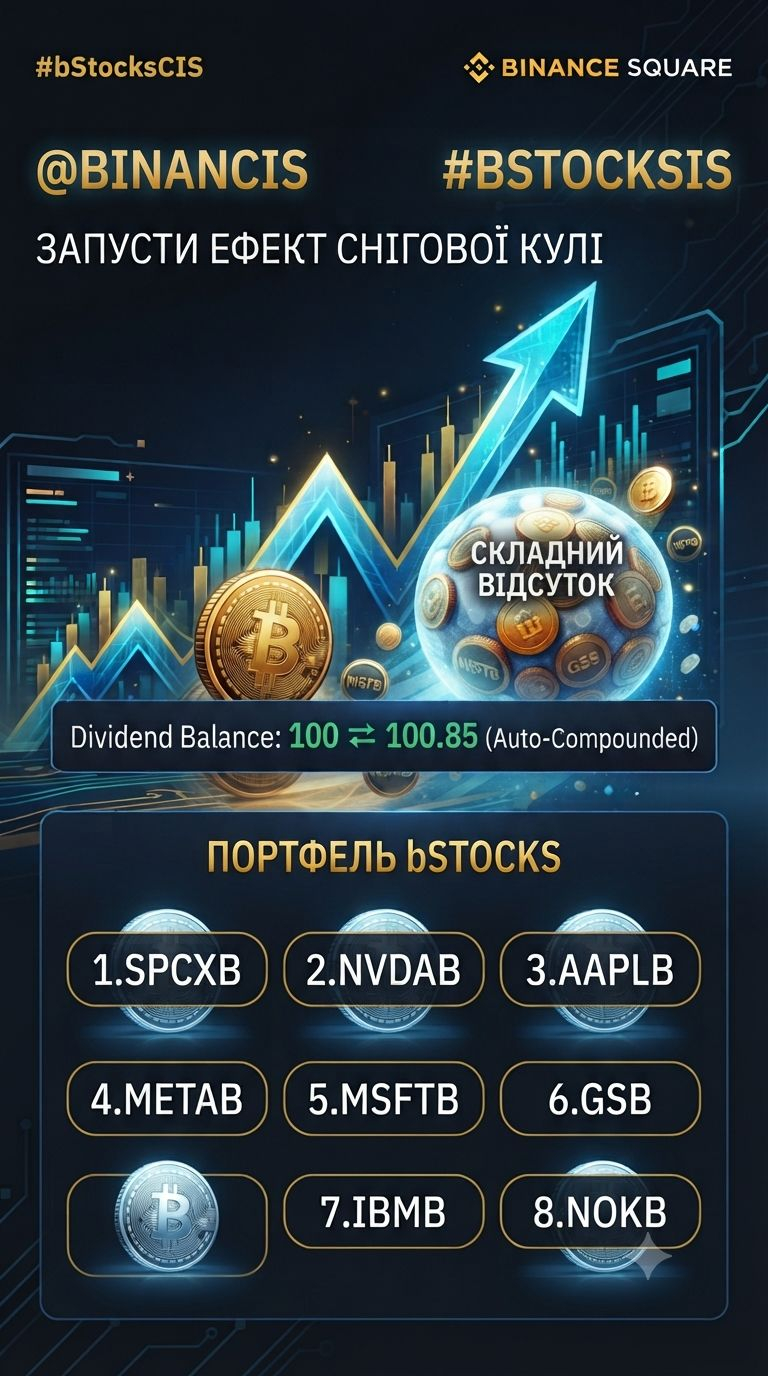
手作業での出金集計はもう不要です!@BinanceCIS の Multiplier スマートコントラクトがすべてを自動で行い、オート課税30%の後の純キャッシュフローが新しい持分へ即時に再投資されます。
🧮 手計算で(例):
トークン100枚 → 配当$200 → 税引き後は$140 → スマートコントラクトが追加で持分を購入し、残高が100.85トークンになります。次の支払いは増えた基準残高に対して飛んできます!スノーボール効果が始動。
📊 @BinanceCIS の利回り目安:
💸 フロー(2–4%):Nokia(NOKB)、IBM(IBMB)、Goldman Sachs(GSB)。
⚖️ ブルーチップ(1.5%以下):Microsoft(MSFTB)、Nvidia(NVDAB)、Apple(AAPLB)。
🚀 配当成長(%):Meta(METAB)、SpaceX(SPCXB)— すべての利益を技術、インフラ拡張、R&Dへ再投資し、将来の最大資本を目指す企業。
💬 あなたに近いのはどちらですか—安定した現金か、それとも攻めの成長か?コメントで教えてください。$SPCXB $NVDAB
いつでも自動で配当を受け取る24/7!
手作業での出金集計はもう不要です!@BinanceCIS の Multiplier スマートコントラクトがすべてを自動で行い、オート課税30%の後の純キャッシュフローが新しい持分へ即時に再投資されます。
🧮 手計算で(例):
トークン100枚 → 配当$200 → 税引き後は$140 → スマートコントラクトが追加で持分を購入し、残高が100.85トークンになります。次の支払いは増えた基準残高に対して飛んできます!スノーボール効果が始動。
📊 @BinanceCIS の利回り目安:
💸 フロー(2–4%):Nokia(NOKB)、IBM(IBMB)、Goldman Sachs(GSB)。
⚖️ ブルーチップ(1.5%以下):Microsoft(MSFTB)、Nvidia(NVDAB)、Apple(AAPLB)。
🚀 配当成長(%):Meta(METAB)、SpaceX(SPCXB)— すべての利益を技術、インフラ拡張、R&Dへ再投資し、将来の最大資本を目指す企業。
💬 あなたに近いのはどちらですか—安定した現金か、それとも攻めの成長か?コメントで教えてください。$SPCXB $NVDAB

S E R g g U A
·
--
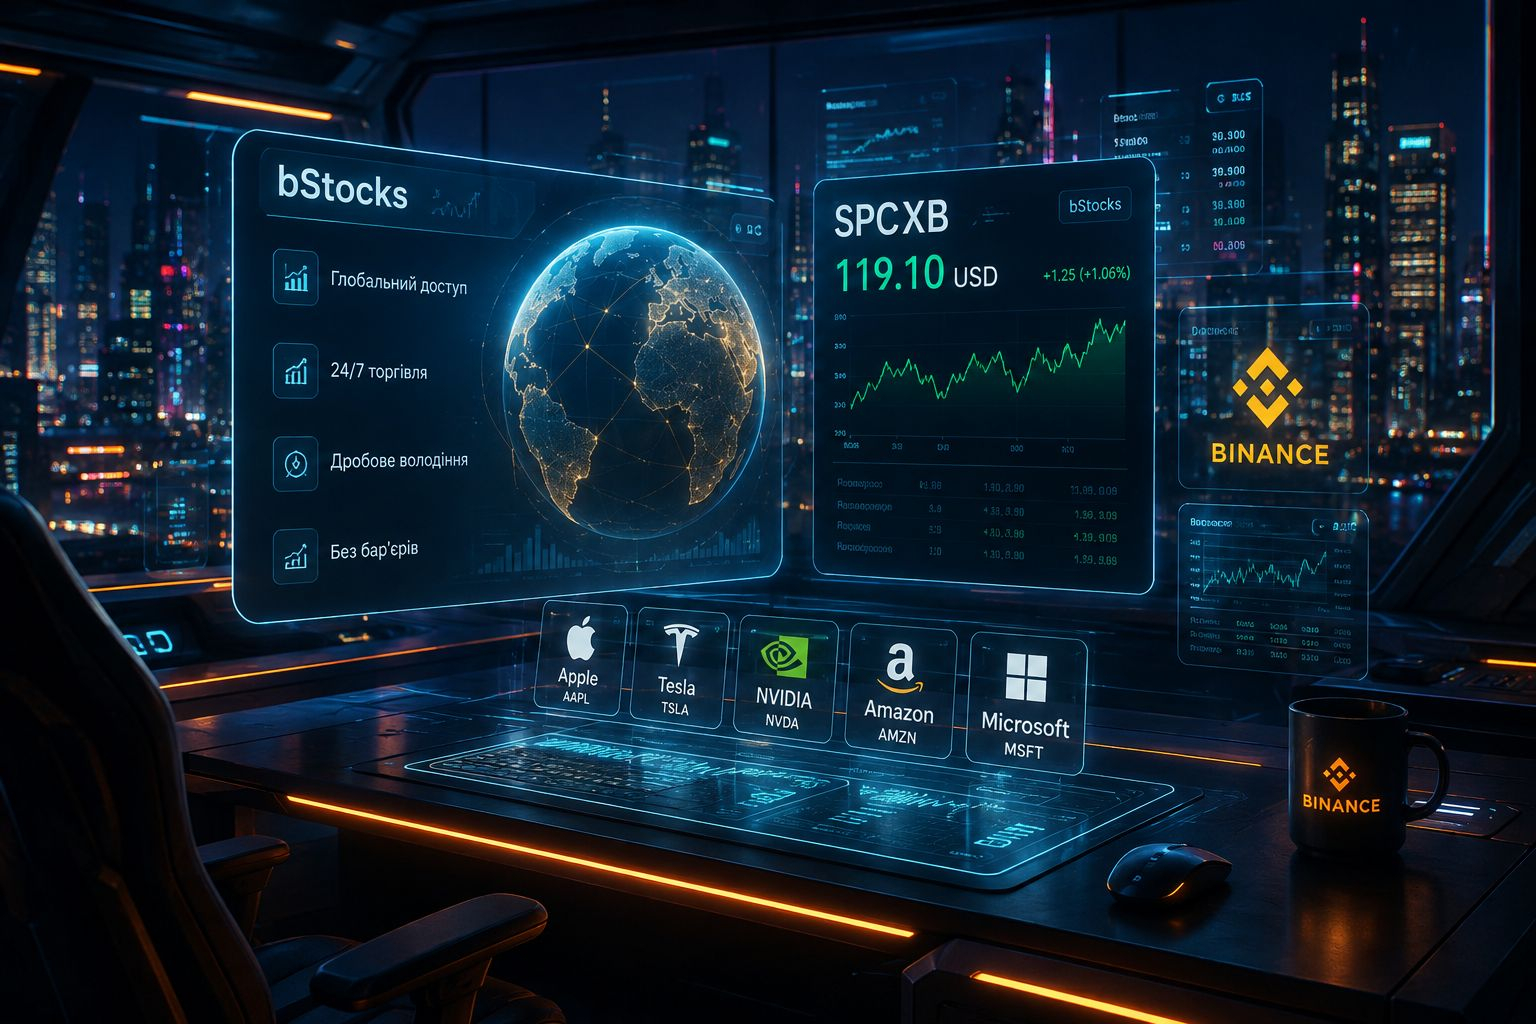
#bstockscis 私は株式をトークン化する必要性がよく分からないまま、しばらく時間が過ぎていました。別のボトルに水を移すだけみたいなものだと思っていたんです。中身は同じで、変わるのはラベルだけ。
でも、いくつかのテストを経て考えが変わりました。
結局のところ、問題は株式そのものではありません。問題は、株式へのアクセスがどのように行われるかです。
#bStocks は証券市場そのものを変えるのではありません。古いルールに縛られにくくするのです。出来事に反応するのに、証券取引所が開くのを待つ必要はありません。これは資産と関わるための、まったく別のアプローチです。
もう一つ、私が自分の中で特に注目した点は、分割して購入できること。最初から大きな金額を投じる必要はありません。小さく始めて、仕組みがどう動くのかを見て、それからポジションを増やしていけばいい。
こうした変化を追うのが面白いです。なぜなら、それが、金融商品が一般のユーザーにぐっと近づいていく様子を示しているからです。
そして今では、ますますこう考えるようになりました。投資の最大の障壁は、資産の価格ではなく、スタートを「そのうち」に先送りする習慣なのかもしれない、と。
@BinanceCIS $SPCXB
#bStocksCis
でも、いくつかのテストを経て考えが変わりました。
結局のところ、問題は株式そのものではありません。問題は、株式へのアクセスがどのように行われるかです。
#bStocks は証券市場そのものを変えるのではありません。古いルールに縛られにくくするのです。出来事に反応するのに、証券取引所が開くのを待つ必要はありません。これは資産と関わるための、まったく別のアプローチです。
もう一つ、私が自分の中で特に注目した点は、分割して購入できること。最初から大きな金額を投じる必要はありません。小さく始めて、仕組みがどう動くのかを見て、それからポジションを増やしていけばいい。
こうした変化を追うのが面白いです。なぜなら、それが、金融商品が一般のユーザーにぐっと近づいていく様子を示しているからです。
そして今では、ますますこう考えるようになりました。投資の最大の障壁は、資産の価格ではなく、スタートを「そのうち」に先送りする習慣なのかもしれない、と。
@BinanceCIS $SPCXB
#bStocksCis

MS Aira
·
--
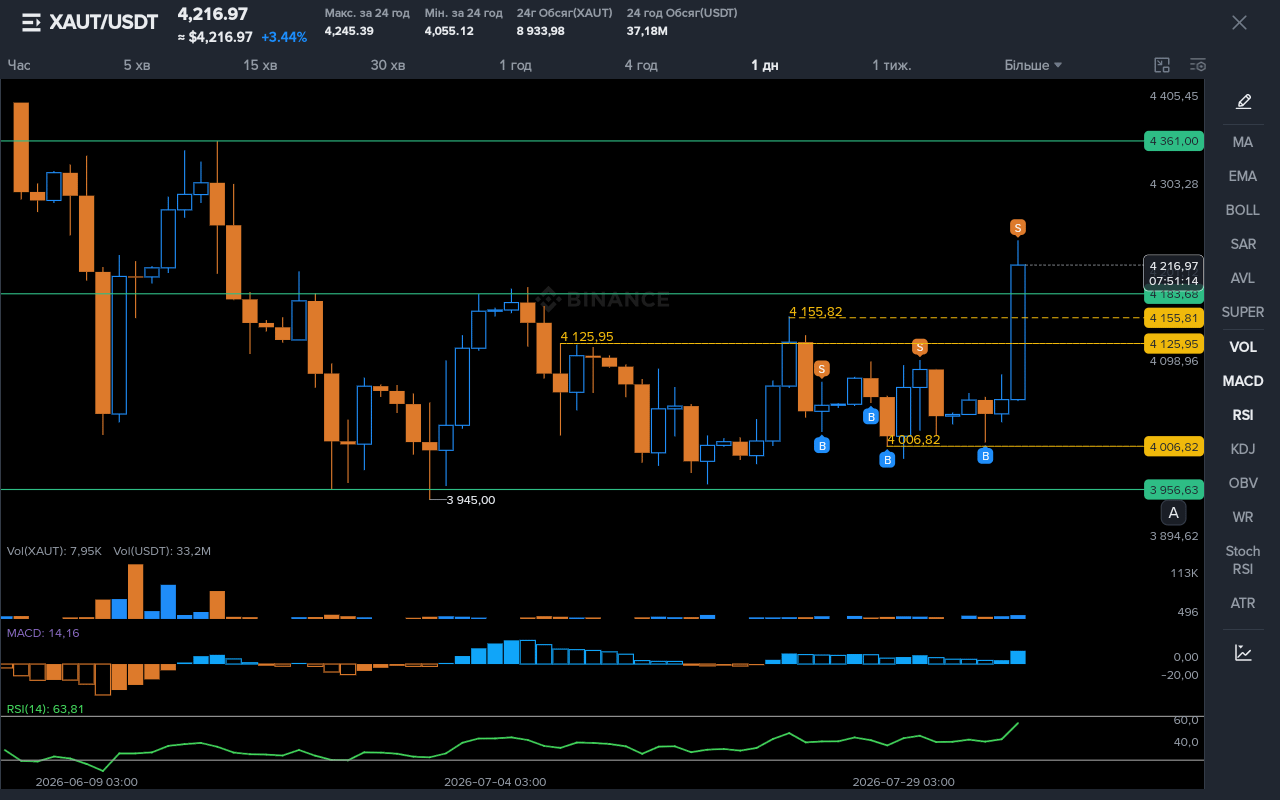
ブリッシュ🟢 $XAUT - 強烈なビッシュの衝撃を披露(+3,44%/日)💲💰
#XAUT #GOLD #CryptoAnalysis #TechnicalAnalysis #BinanceSquare
#XAUT #GOLD #CryptoAnalysis #TechnicalAnalysis #BinanceSquare
MS Aira
·
--
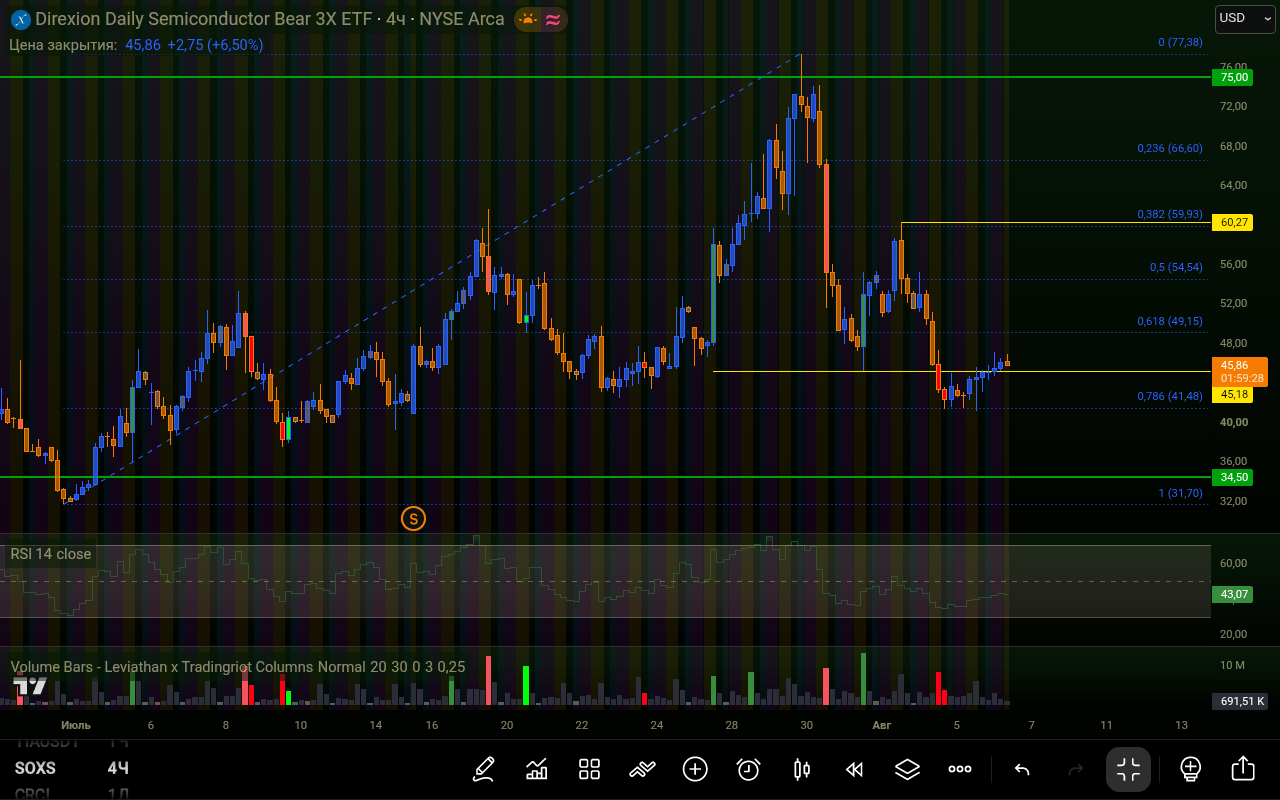
ブリッシュ半導体セクターのダイナミクスに興味があり、取引に柔軟なツールを探していますか?トークン化されたSOXSの類似商品(Direxion Daily Semiconductor Bear 3X Shares)なら、暗号取引所でチップ市場に取り組み、リスクをその場でヘッジできます!📊
bStocksの始め方:
• 検索:Binance Spot Market(ティッカーを入力、例:$SOXSB /USDT)でbStocksを探すか、専用のbStocksセクションをご利用ください。
• 最初の取引:USDTで通常の現物ペアとして購入するか、既存のポジションを「直通取引(1:1)」で無料で変換できます。
• 利用可能性:口座の最低条件はなく、必要なのは端数のしきい値のみで$5です!
暗号と株式市場を便利に組み合わせる機会をくれた @BinanceCIS s に感謝します!🚀
#BinanceSquare #crypto #TradingSignal #Investments #bstockscis
bStocksの始め方:
• 検索:Binance Spot Market(ティッカーを入力、例:$SOXSB /USDT)でbStocksを探すか、専用のbStocksセクションをご利用ください。
• 最初の取引:USDTで通常の現物ペアとして購入するか、既存のポジションを「直通取引(1:1)」で無料で変換できます。
• 利用可能性:口座の最低条件はなく、必要なのは端数のしきい値のみで$5です!
暗号と株式市場を便利に組み合わせる機会をくれた @BinanceCIS s に感謝します!🚀
#BinanceSquare #crypto #TradingSignal #Investments #bstockscis
MS Aira
·
--
下落局面でSpaceXを買う。なぜファンドはパニックで、個人はSPCXを買い増すのか?
🚀 最初のレポート後、SpaceXの株は13.6%下落(108ドルまで)。市場には分断が生まれています:
• ファンドが売る:彼らは、人工知能とデータセンターにかかる莫大なコストに怯えています——四半期で180億ドル超。大手プレイヤーは、それがStarlinkの利益を食い潰すのではと恐れています。 📉
• 個人(および私)が買う:落下後最初の1時間だけで、個人投資家は株を2,270万ドル分買い集めました。私たちは、AIへの投資を損失ではなく、企業の将来の支配の“未来”だと見ています。さらに、現在の価格はIPO(135ドル)より20%安いです。📈
• ファンドが売る:彼らは、人工知能とデータセンターにかかる莫大なコストに怯えています——四半期で180億ドル超。大手プレイヤーは、それがStarlinkの利益を食い潰すのではと恐れています。 📉
• 個人(および私)が買う:落下後最初の1時間だけで、個人投資家は株を2,270万ドル分買い集めました。私たちは、AIへの投資を損失ではなく、企業の将来の支配の“未来”だと見ています。さらに、現在の価格はIPO(135ドル)より20%安いです。📈

Andrii Obolon
·
--
HEI.""投稿をシェアしてください、ありがとうございます!"🤝
🔥 HEI/USDT: 3日間の取引プランと価格レンジ!
HEIの資産は現在、$0.084前後で推移しており、蓄積フェーズにあります。この値動きを効果的に取引し、重要なタイミングを逃さないために、これから3日間の段階的な計画を分解していきましょう。
📅 Day 1: 最初のバリアの蓄積とテスト
初日には、現在のポジションを維持することと、買い手の強さをテストすることが主な焦点です。市場は、直近のボラティリティの後、ベースを形成しつつあります。
想定レンジ: $0.080 – $0.090
HEIの資産は現在、$0.084前後で推移しており、蓄積フェーズにあります。この値動きを効果的に取引し、重要なタイミングを逃さないために、これから3日間の段階的な計画を分解していきましょう。
📅 Day 1: 最初のバリアの蓄積とテスト
初日には、現在のポジションを維持することと、買い手の強さをテストすることが主な焦点です。市場は、直近のボラティリティの後、ベースを形成しつつあります。
想定レンジ: $0.080 – $0.090

Andrii Obolon
·
--
結束の力:自由なウクライナから皆さんこんにちは!🇺🇦
ウクライナの皆さんこんにちは!私たちの力は、私たちの団結と、お互いを支え合うことにあります。共に、どんな困難も乗り越え、最高のコンテンツを作り、あらゆる戦線で勝利に近づいていきます。
ウクライナ人の皆さん、登録して、広めて、そしてお互いを支えてください!一緒なら私たちは無敵です。ウクライナに栄光あれ!💙💛
$RONIN $XAU $KAITO
ウクライナの皆さんこんにちは!私たちの力は、私たちの団結と、お互いを支え合うことにあります。共に、どんな困難も乗り越え、最高のコンテンツを作り、あらゆる戦線で勝利に近づいていきます。
ウクライナ人の皆さん、登録して、広めて、そしてお互いを支えてください!一緒なら私たちは無敵です。ウクライナに栄光あれ!💙💛
$RONIN $XAU $KAITO

Andrii Obolon
·
--
RONIN.私のページに、こちらで投稿を共有してください!
🔥 限定公開 RONINUSDT分析:底値で買う価値はあるのか?今後3日間の先物で何が起きる?
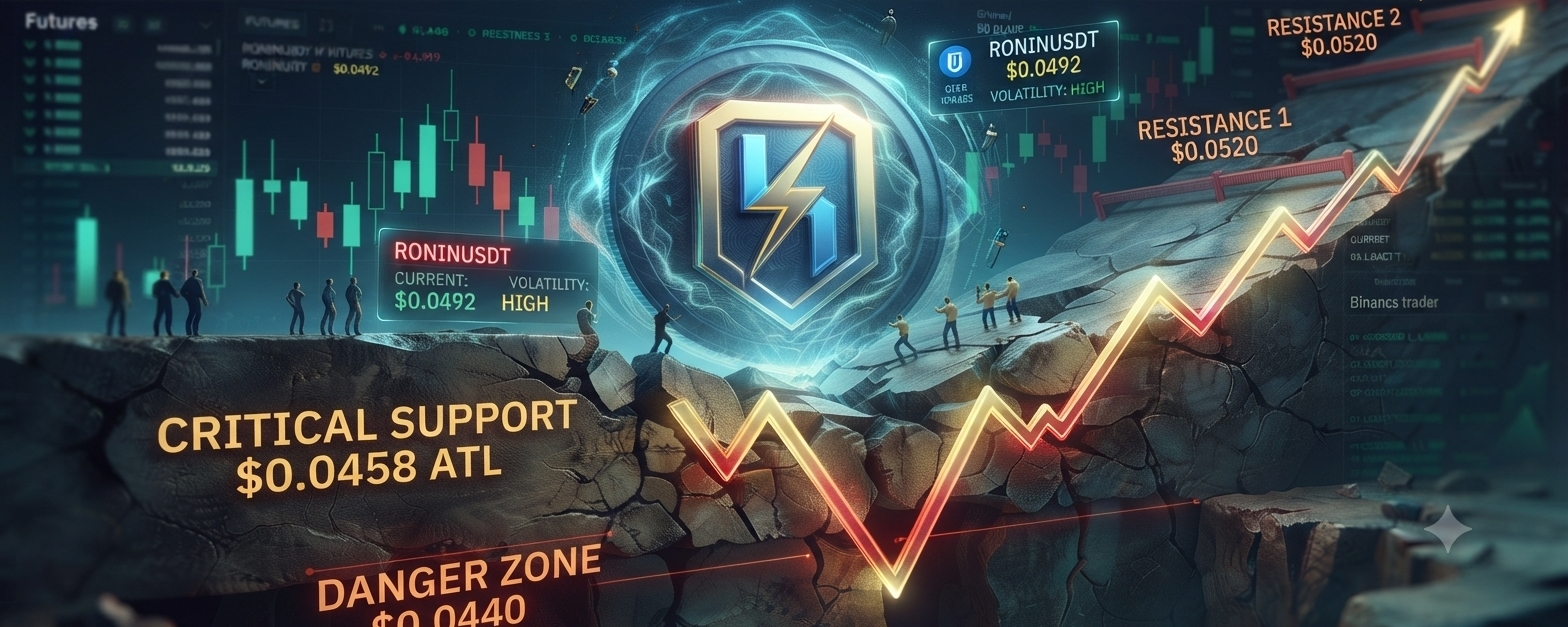
今後3日間のRONINUSDTペアのテクニカル分析では、重要な局面が示されています。資産は$0.0485〜$0.0495のレンジで取引されており、史上最安値の瀬戸際にあります。市場は大きな値動きに備えており、リスク管理を誤ればトレーダーの入金(デポジット)を失う可能性があります。
市場の状況と価格のベース
このコインは底付近で深いローカルの蓄積フェーズにあります。4時間足と日足では、RSI指標が中立圏に位置しており、買われ過ぎの条件にならないため、どちらの方向にも投機的な動きの余地があります。
今後3日間のRONINUSDTペアのテクニカル分析では、重要な局面が示されています。資産は$0.0485〜$0.0495のレンジで取引されており、史上最安値の瀬戸際にあります。市場は大きな値動きに備えており、リスク管理を誤ればトレーダーの入金(デポジット)を失う可能性があります。
市場の状況と価格のベース
このコインは底付近で深いローカルの蓄積フェーズにあります。4時間足と日足では、RSI指標が中立圏に位置しており、買われ過ぎの条件にならないため、どちらの方向にも投機的な動きの余地があります。
ログインして、さらにコンテンツを読む