

Ismat Crypto
125 投稿

Ismat Crypto
報告
ユーザーをブロック
Crypto Trader & Market Analyst. Helping you understand charts, spot trades, and daily crypto trends easily. Follow for regular market setups!
高頻度トレーダー
3.7年
44 フォロー
22 フォロワー
143 いいね
投稿
すべて
引用
·
--
翻訳参照
🚀 Market Rebound Strategy: 1 to 5 Days Short-Term Outlook for BTC, ETH, & BNB!
The market is showing a strong relief bounce on the 4H charts. If you are looking for short-term swing setups over the next 1 to 5 days, here is the technical breakdown and key levels to watch for Bitcoin, Ethereum, and Binance Coin.
🎯 1. Bitcoin (BTC/USDT)
• Current Price: $78,142
• 1-5 Day Outlook: Bullish Consolidation
• Analysis: BTC found strong support at $76,325. It is currently testing the 25 MA ($78,559).
• Target Zone (1-5 Days): If BTC breaks and holds above $78,600, expect a fast move towards $79,800 and potentially a retest of the $81,000 zone.
• Invalidation: A daily close below $76,300 cancels this bullish momentum.
🎯 2. Ethereum (ETH/USDT)
• Current Price: $2,268.93
• 1-5 Day Outlook: Relief Rally Continuation
• Analysis: ETH bounced aggressively from its $2,174 local bottom. It has already reclaimed the 7 MA ($2,265).
• Target Zone (1-5 Days): Watch for a test of the 25 MA at $2,275. A clean breakout here clears the path toward $2,320 and $2,350.
• Invalidation: Dropping back below the $2,200 psychological support level.
🎯 3. BNB (BNB/USDT)
• Current Price: $711.65
• 1-5 Day Outlook: Bullish Reversal
• Analysis: BNB saw an immediate buy-back after dipping to $680. It is now stable above $710 and eyeing the 25 MA ($718).
• Target Zone (1-5 Days): Over the next few days, if BNB stays above $710, the immediate targets are $730 and $745.
• Invalidation: A breakdown below the major $690 support area.
⚠️ Risk Management Note
Short-term setups (1-5 days) depend heavily on volume. Keep an eye on BTC dominance and overall market volume before entering new positions. Always trade with a proper stop-loss!
What are your targets for this week? Let me know in the comments below! 👇
#CryptoTrading #Bitcoin #Ethereum #BNB #TechnicalAnalysis #BinanceSquare #TradingSignals #CryptoForecast
2
92
·
--
🔥 アルトコインの勢い最新情報:EVAA、MAGMA、AIOTがブレイクアウト!🔥
本日、注目のトークンで大きな強気の値動きが見られます!テクニカル指標と現在のパフォーマンスを見ていきましょう。
1️⃣ $EVAA(EVAA Protocol):現在$1.3687で取引されており、+11.06%上昇しています。$1.6100の高値を付けた後、局所的なサポートを見つけ、4時間足チャートでは7MA($1.33)と25MA($1.28)を上回る水準で順調に値固めしています。$1.42を明確に上抜ければ、次の上昇局面に進む可能性があります。
2️⃣ $MAGMA:$0.4442で力強く推移し、過去24時間で+18.62%上昇しています。出来高の急増(USDT建てで$77.72M)が目立ち、価格は移動平均線をしっかり上回っています。近いうちに直近高値の$0.4840を再び試す展開が期待されます。
3️⃣ $AIOT(OKZOO):3銘柄の中で最も大きく上昇し、+24.01%の急騰で$0.0898で取引されています。AIOTの取引量は1.10Bに達し、大量の資金が流入しています。4時間足で主要なレジスタンス水準を次々と突破しており、強い買い圧力を示しています。
📊 市場センチメント:これらの中小型アルトコインには現在、大量の出来高が集まっており、多くのマクロ資産を上回るパフォーマンスを見せています。
⚠️ 注意:常に取引戦略を守り、適切にリスクを管理しましょう。局所的な高値でむやみにエントリーしないでください!
この3銘柄のうち、今後も上昇が続きそうなのはどれだと思いますか?ぜひコメントで教えてください!👇
#BinanceSquare #CryptoTrading #Altcoins #TechnicalAnalysis #EVAA #MAGMA #AIOT
1
572
·
--
翻訳参照
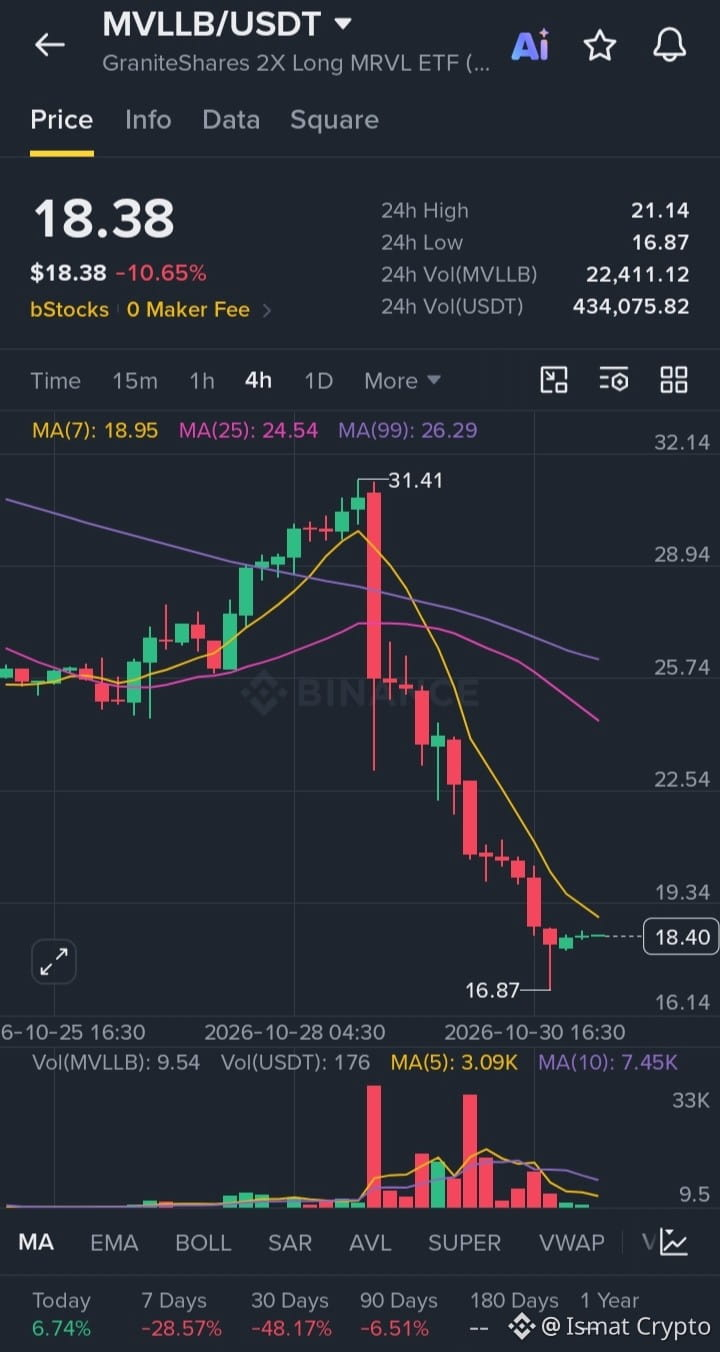
$MVLLB/USDT Analysis: Will the $16.87 Support Hold? 📉
GraniteShares 2X Long MRVL ETF ($MVLLB) has faced a significant correction recently, dropping -10.65% today to sit at $18.38.
Looking closely at the 4-hour chart, the token experienced a heavy rejection after peaking near the $31.41 resistance zone. The intense bearish momentum pushed the price below major moving averages, with the MA(7) currently tracking above the price at $18.95.
Key Technical Levels to Watch:
🔹 Immediate Support: $16.87 (Recent local bottom)
🔹 Immediate Resistance: $18.95 (MA 7) & $24.54 (MA 25)
The price is currently showing a minor relief bounce after hitting the $16.87 support floor. If the buyers manage to reclaim the $18.95 level, we could see a short-term recovery rally. However, if the $16.87 support breaks, further downside exposure is highly likely. Strict risk management is recommended.
What are your thoughts? Is this a good buy-the-dip opportunity or will it break lower? 👇
#CryptoTrading #TechnicalAnalysis #MVLLB #BinanceSquare
$MVLLB
{spot}(MVLLBUSDT)
$MVLLB /USDT Analysis: Will the $16.87 Support Hold? 📉
GraniteShares 2X Long MRVL ETF ($MVLLB ) has faced a significant correction recently, dropping -10.65% today to sit at $18.38.
Looking closely at the 4-hour chart, the token experienced a heavy rejection after peaking near the $31.41 resistance zone. The intense bearish momentum pushed the price below major moving averages, with the MA(7) currently tracking above the price at $18.95.
Key Technical Levels to Watch:
🔹 Immediate Support: $16.87 (Recent local bottom)
🔹 Immediate Resistance: $18.95 (MA 7) & $24.54 (MA 25)
The price is currently showing a minor relief bounce after hitting the $16.87 support floor. If the buyers manage to reclaim the $18.95 level, we could see a short-term recovery rally. However, if the $16.87 support breaks, further downside exposure is highly likely. Strict risk management is recommended.
What are your thoughts? Is this a good buy-the-dip opportunity or will it break lower? 👇
#CryptoTrading #TechnicalAnalysis #MVLLB #BinanceSquare
$MVLLB
1
107
·
--
翻訳参照
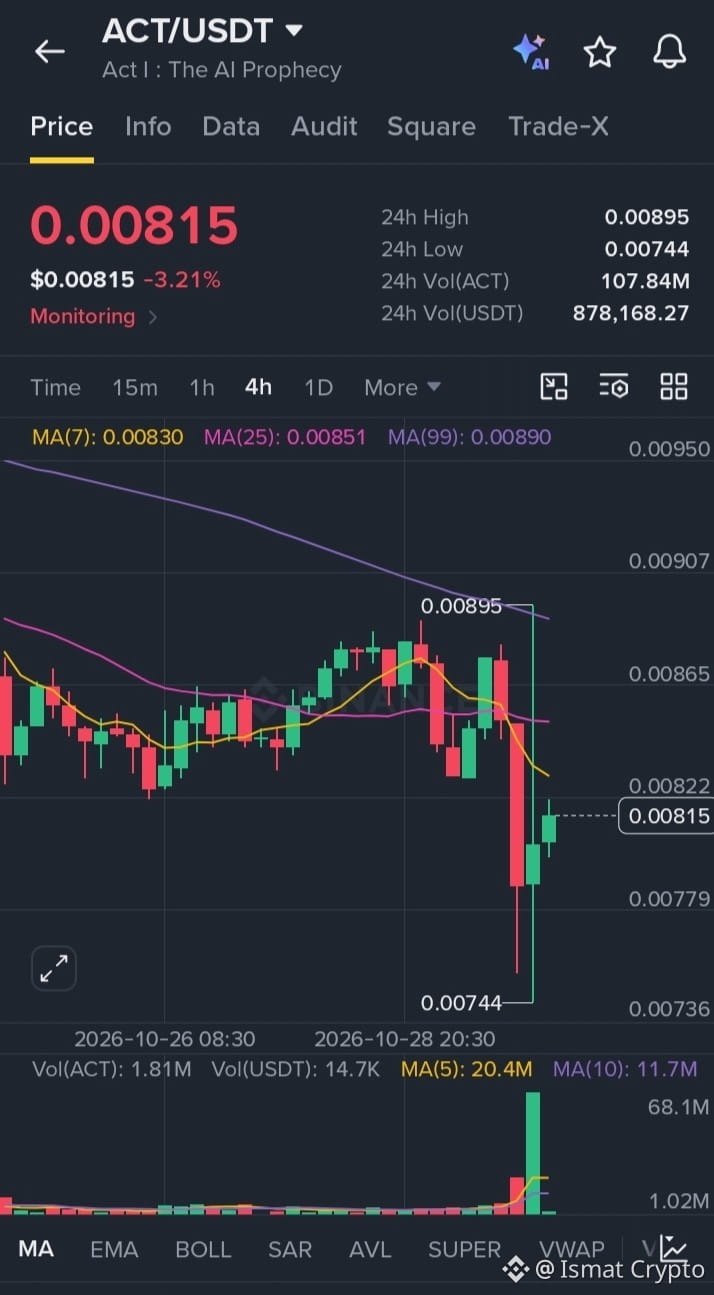
ACT/USDT Spot Setup: Mid-Term Accumulation Zone
Market analysis indicates that ACT (Act I: The AI Prophecy) is currently showing strong signs of stabilization around its local support level. After a healthy correction, the price is consolidating in a key accumulation zone, presenting an excellent risk-to-reward ratio for patient investors looking for solid gains.
Trade Details:
• Token: ACT/USDT
• Current Price: $0.00815
• Entry Zone: $0.00780 - $0.00820
• Holding Period: 45 to 60 Days ⏳
• Target Potential: 50% - 100%+ potential bounce from this accumulation area.
Why hold ACT right now?
1. Strong Support Base: The chart shows immediate buyers stepping in near the $0.00744 low, making this a high-probability reversal zone.
2. AI Narrative: As an AI-driven project, it holds strong mid-term narrative momentum.
3. Patience Pays: This is not a scalping trade. Giving it 45–60 days allows the market structure to completely mature and break out of the current consolidation.
Always manage your risk properly and spot-buy in parts.
#ACTUSDT #CryptoAnalysis #BinanceSquare #Altcoins #CryptoTrading
451
·
--
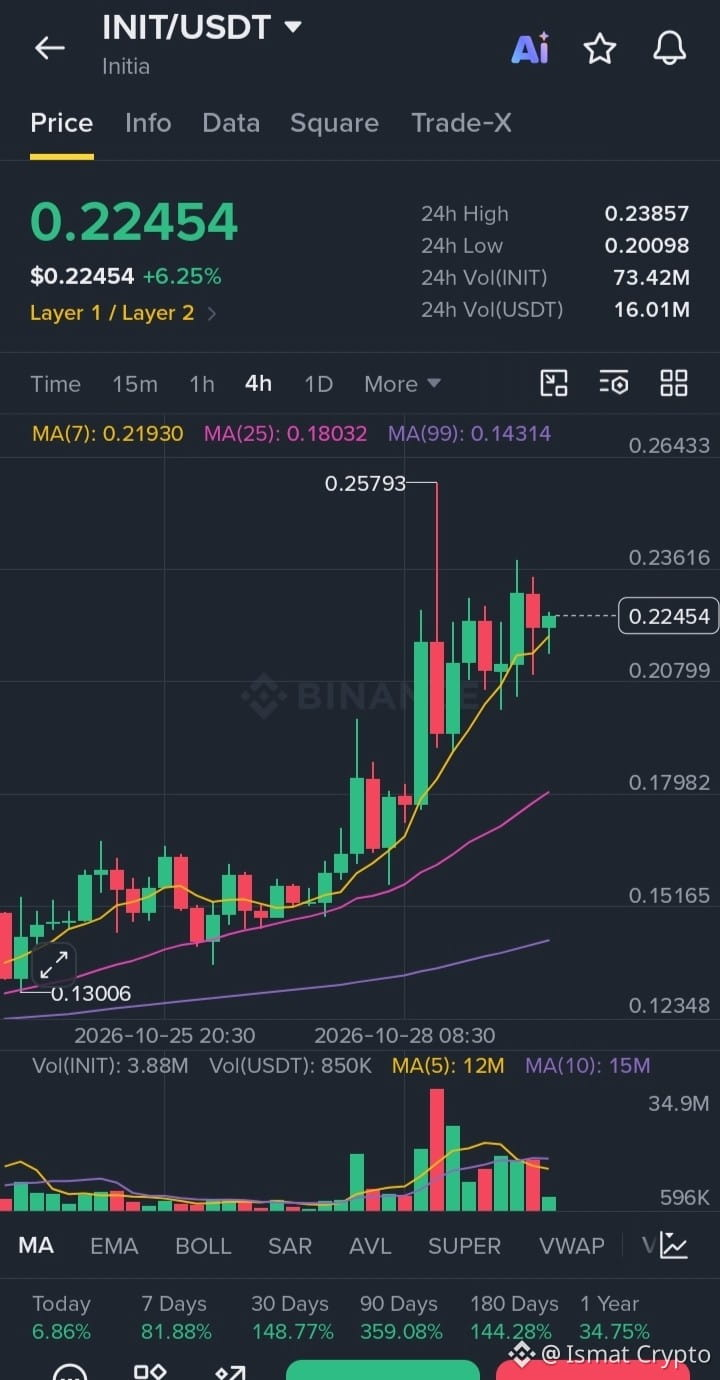
🚀 $INIT が燃え上がってる!90日で+359%は本当にすごい!👇
INIT/USDTの4時間足チャートは、今まさに教科書どおりの強気モメンタムを示しています。今日は+6.25%上昇し、現在は$0.22454で取引されています。
私が強気な理由:
• トレンドの一致:MA(7)がMA(25)とMA(99)をしっかり上回っています。
• 大商い:過去24時間の取引高は1,600万USDT超。買い手が完全に主導権を握っています!
• パフォーマンス:7日(+81%)|30日(+148%)|90日(+359%)。
🎯 次の目標:$0.21を上回っている限り、次の大きな上昇局面では、簡単に$0.26超えを試すでしょう。FOMOに流されず、健全な押し目でエントリーを狙いましょう!
💬 みなさんはどう動きますか?押し目買い、それとも様子見?コメントで教えてください!
👉 次の相場分析を見逃さないよう、フォロー&いいねをお願いします!📈
#INIT #BinanceSquare #暗号資産取引 #テクニカル分析 #Bullish
$INIT
{spot}(INITUSDT)
🚀 $INIT が燃え上がってる!90日で+359%は本当にすごい!👇
INIT/USDTの4時間足チャートは、今まさに教科書どおりの強気モメンタムを示しています。今日は+6.25%上昇し、現在は$0.22454で取引されています。
私が強気な理由:
• トレンドの一致:MA(7)がMA(25)とMA(99)をしっかり上回っています。
• 大商い:過去24時間の取引高は1,600万USDT超。買い手が完全に主導権を握っています!
• パフォーマンス:7日(+81%)|30日(+148%)|90日(+359%)。
🎯 次の目標:$0.21を上回っている限り、次の大きな上昇局面では、簡単に$0.26超えを試すでしょう。FOMOに流されず、健全な押し目でエントリーを狙いましょう!
💬 みなさんはどう動きますか?押し目買い、それとも様子見?コメントで教えてください!
👉 次の相場分析を見逃さないよう、フォロー&いいねをお願いします!📈
#INIT #BinanceSquare #暗号資産取引 #テクニカル分析 #Bullish
$INIT
357
·
--
SKHYNIXが今、完全に急騰中!今日は+7.53%超え!
SKHYNIXUSDTの4時間足チャートを見ると、強気派が完全に主導権を握っています。価格は一気に24時間高値の1,111.29まで上昇し、現在は1,102.86付近でしっかり推移しています。
この出来高を見てください!24時間で14.4億USDTという大きな出来高は、これがだましのブレイクアウトではなく、本物の資金が流入していることを示しています。価格はMA(7)とMA(25)を明確に上抜けており、力強く自然な買いの勢いが見られます。
📈 個人的な見解:
チャートの形は、中期保有に向けて非常に力強く見えます。私は個人的に、今後45〜60日間の高い成長ポテンシャルを持つ保有銘柄として注目しています。健全な持ち合いに見えますし、このブレイクアウトがさらに大きなマクロトレンドの動きを引き起こす可能性もあります。
皆さんはどう動きますか?今からロングに乗る?それとも1,040のサポートゾーン付近まで健全なリテストを待つ?目標価格をコメントで教えてください!👇
#SKHYNIXUSDT #CryptoTrading #PositionTrading #Binance #Altcoins #Bullish #CryptoHolding
$SKHYNIX
{future}(SKHYNIXUSDT)
SKHYNIXが今、完全に急騰中!今日は+7.53%超え!
SKHYNIXUSDTの4時間足チャートを見ると、強気派が完全に主導権を握っています。価格は一気に24時間高値の1,111.29まで上昇し、現在は1,102.86付近でしっかり推移しています。
この出来高を見てください!24時間で14.4億USDTという大きな出来高は、これがだましのブレイクアウトではなく、本物の資金が流入していることを示しています。価格はMA(7)とMA(25)を明確に上抜けており、力強く自然な買いの勢いが見られます。
📈 個人的な見解:
チャートの形は、中期保有に向けて非常に力強く見えます。私は個人的に、今後45〜60日間の高い成長ポテンシャルを持つ保有銘柄として注目しています。健全な持ち合いに見えますし、このブレイクアウトがさらに大きなマクロトレンドの動きを引き起こす可能性もあります。
皆さんはどう動きますか?今からロングに乗る?それとも1,040のサポートゾーン付近まで健全なリテストを待つ?目標価格をコメントで教えてください!👇
#SKHYNIXUSDT #CryptoTrading #PositionTrading #Binance #Altcoins #Bullish #CryptoHolding
$SKHYNIX
323
·
--
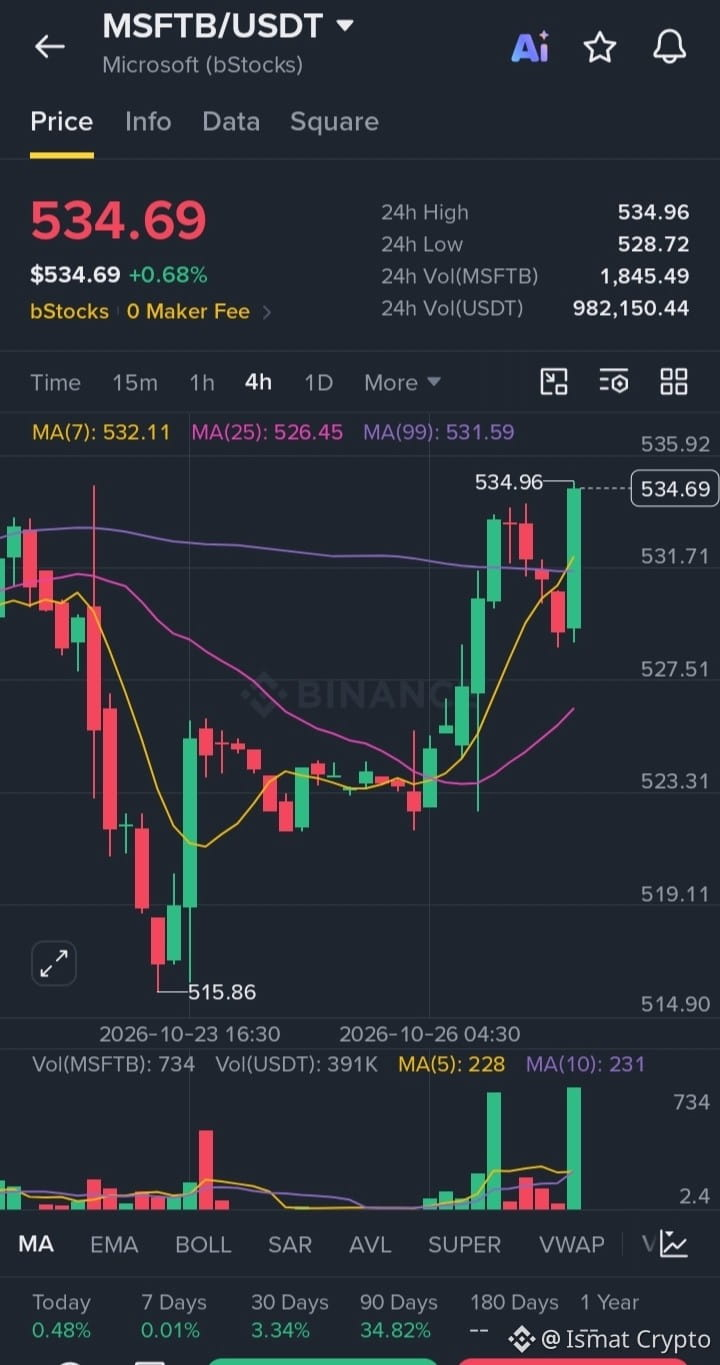
MSFTB/USDT分析:強気の勢いが加速中!
1. 4時間足チャートをざっと見ると、非常に明るいシグナルが見られます。
2. 515.86ドルで目先の底を打った後、価格は力強く回復しました。
3. トークン化株は現在、534.69ドル(+0.68%)と緑色で取引されています。
4. 買い手は価格を主要なMA(99)ラインである531.59ドルより上に押し上げることに成功しました。
5. この大きなクロスオーバーは、中期的なトレンド反転を示しています。
6. 目先の短期サポートは、532.11ドルのMA(7)によってしっかり維持されています。
7. 市場は現在、24時間高値のレジスタンスである534.96ドルを積極的に試しています。
8. 4時間足のローソク足がこの水準を明確に上回って確定すれば、大きなブレイクアウトにつながる可能性があります。
9. 24時間のUSDT取引高は急速に増加し、100万ドル近くに達しています。
10. 一時的に反落した場合でも、531~532ドルの間に強いサポートがあります。
11. 現時点で、チャート全体の構造は依然として買い手に大きく有利です。
12. 今日、上昇継続を狙ったエントリーのチャンスがあるかもしれないので、このペアをウォッチリストに入れておきましょう!
MSFTBの目標価格はどこですか?ぜひ下のコメント欄で話し合いましょう!👇
$MSFTB
{spot}(MSFTBUSDT)
MSFTB/USDT分析:強気の勢いが加速中!
1. 4時間足チャートをざっと見ると、非常に明るいシグナルが見られます。
2. 515.86ドルで目先の底を打った後、価格は力強く回復しました。
3. トークン化株は現在、534.69ドル(+0.68%)と緑色で取引されています。
4. 買い手は価格を主要なMA(99)ラインである531.59ドルより上に押し上げることに成功しました。
5. この大きなクロスオーバーは、中期的なトレンド反転を示しています。
6. 目先の短期サポートは、532.11ドルのMA(7)によってしっかり維持されています。
7. 市場は現在、24時間高値のレジスタンスである534.96ドルを積極的に試しています。
8. 4時間足のローソク足がこの水準を明確に上回って確定すれば、大きなブレイクアウトにつながる可能性があります。
9. 24時間のUSDT取引高は急速に増加し、100万ドル近くに達しています。
10. 一時的に反落した場合でも、531~532ドルの間に強いサポートがあります。
11. 現時点で、チャート全体の構造は依然として買い手に大きく有利です。
12. 今日、上昇継続を狙ったエントリーのチャンスがあるかもしれないので、このペアをウォッチリストに入れておきましょう!
MSFTBの目標価格はどこですか?ぜひ下のコメント欄で話し合いましょう!👇
$MSFTB
44
·
--
皆さん、おめでとうございます 💐
皆さん、おめでとうございます 💐


Binance TG Community
·
--
Binance Square 中秋節キャンペーン当選者リスト
🎂 Binanceユーザーの皆様、Binance Squareの月餅作りキャンペーンにご参加いただき、ありがとうございました!🎉 皆様の創造性あふれる素晴らしいケーキのデザインのおかげで、お祝いがさらに特別なものになりました。💛 🏆 当選者250名が発表されました!当選された皆様、おめでとうございます。また、ご参加いただき、創造性を共有してくださった皆様に心より感謝いたします!🥳
報酬は本発表から10日以内に配布されます。
以下からSquareのユーザー名をご確認ください:
@Cripp
@CazadorSobresRojos
@OlexanderL
@MariiaL
報酬は本発表から10日以内に配布されます。
以下からSquareのユーザー名をご確認ください:
@Cripp
@CazadorSobresRojos
@OlexanderL
@MariiaL

·
--
📊 相場チェック:急騰チャート3銘柄!次に資金が向かう先は?
$CHIP、$ERA、$NIGHTの4時間足チャートを注視しています。3銘柄とも強い勢いを見せていますが、それぞれまったく異なる局面にあります。
🔹 CHIP -> 放物線状のブレイクアウト(ハイリスク・ハイリターン)
🔹 ERA -> 調整後の蓄積・回復局面
🔹 NIGHT -> 重要なMA(99)の抵抗線に直面する反転の試み
コメントで予想を教えてください。次に2倍になるのはどの銘柄? 🚀👇
#BinanceSquare #CryptoMarket #TechnicalAnalysis
$CHIP
{spot}(CHIPUSDT)
$ERA
{spot}(ERAUSDT)
$NIGHT
{spot}(NIGHTUSDT)
📊 相場チェック:急騰チャート3銘柄!次に資金が向かう先は?
$CHIP 、$ERA 、$NIGHT の4時間足チャートを注視しています。3銘柄とも強い勢いを見せていますが、それぞれまったく異なる局面にあります。
🔹 CHIP -> 放物線状のブレイクアウト(ハイリスク・ハイリターン)
🔹 ERA -> 調整後の蓄積・回復局面
🔹 NIGHT -> 重要なMA(99)の抵抗線に直面する反転の試み
コメントで予想を教えてください。次に2倍になるのはどの銘柄? 🚀👇
#BinanceSquare #CryptoMarket #TechnicalAnalysis
$CHIP
$ERA
$NIGHT
$CHIP 、$ERA 、$NIGHT の4時間足チャートを注視しています。3銘柄とも強い勢いを見せていますが、それぞれまったく異なる局面にあります。
🔹 CHIP -> 放物線状のブレイクアウト(ハイリスク・ハイリターン)
🔹 ERA -> 調整後の蓄積・回復局面
🔹 NIGHT -> 重要なMA(99)の抵抗線に直面する反転の試み
コメントで予想を教えてください。次に2倍になるのはどの銘柄? 🚀👇
#BinanceSquare #CryptoMarket #TechnicalAnalysis
$CHIP
$ERA
$NIGHT
530
·
--
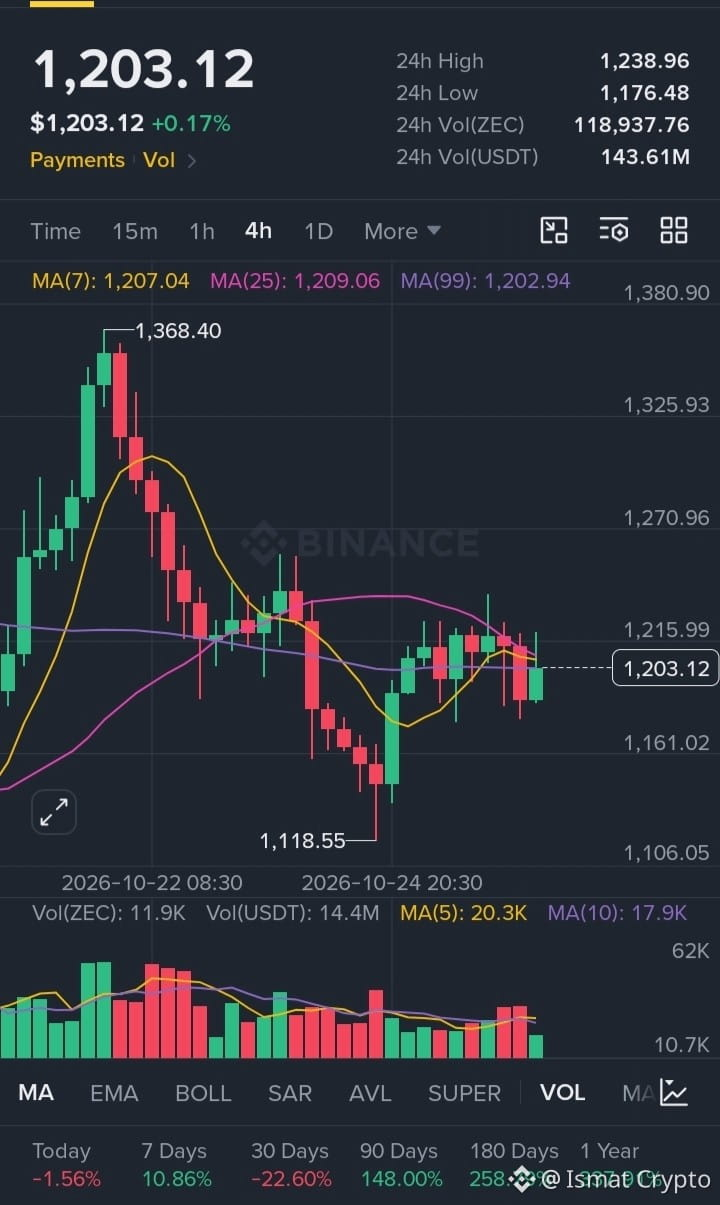
ZEC/USDTは現在、1,203付近の非常に重要な水準で値固めをしています。
現在のチャート構造からは、下落余地は限られており、力強い上昇が始まりつつあることがうかがえます。
ここでの戦略はシンプルです。現在の価格で買い増し、少なくとも45〜60日間保有します。
市場が次の上昇局面に備えるなか、中期的な目標は大いに期待できそうです。エントリーを確保して、あとは市場に任せましょう! 📊
#ZEC #暗号資産 #トレード分析 #現物取引 #Binance
$ZEC
{spot}(ZECUSDT)
ZEC/USDTは現在、1,203付近の非常に重要な水準で値固めをしています。
現在のチャート構造からは、下落余地は限られており、力強い上昇が始まりつつあることがうかがえます。
ここでの戦略はシンプルです。現在の価格で買い増し、少なくとも45〜60日間保有します。
市場が次の上昇局面に備えるなか、中期的な目標は大いに期待できそうです。エントリーを確保して、あとは市場に任せましょう! 📊
#ZEC #暗号資産 #トレード分析 #現物取引 #Binance
$ZEC
現在のチャート構造からは、下落余地は限られており、力強い上昇が始まりつつあることがうかがえます。
ここでの戦略はシンプルです。現在の価格で買い増し、少なくとも45〜60日間保有します。
市場が次の上昇局面に備えるなか、中期的な目標は大いに期待できそうです。エントリーを確保して、あとは市場に任せましょう! 📊
#ZEC #暗号資産 #トレード分析 #現物取引 #Binance
$ZEC
278
·
--
#BinancePick に参加して、#BinancePick チャレンジの予想を投稿します!🌟 100万USDCの賞金プールはかなり豪華です。参加する皆さんの幸運を祈っています。おすすめのコイン予想をコメント欄に投稿してください!🪙✨
#BinancePick に参加して、#BinancePick チャレンジの予想を投稿します!🌟 100万USDCの賞金プールはかなり豪華です。参加する皆さんの幸運を祈っています。おすすめのコイン予想をコメント欄に投稿してください!🪙✨

3
·
--
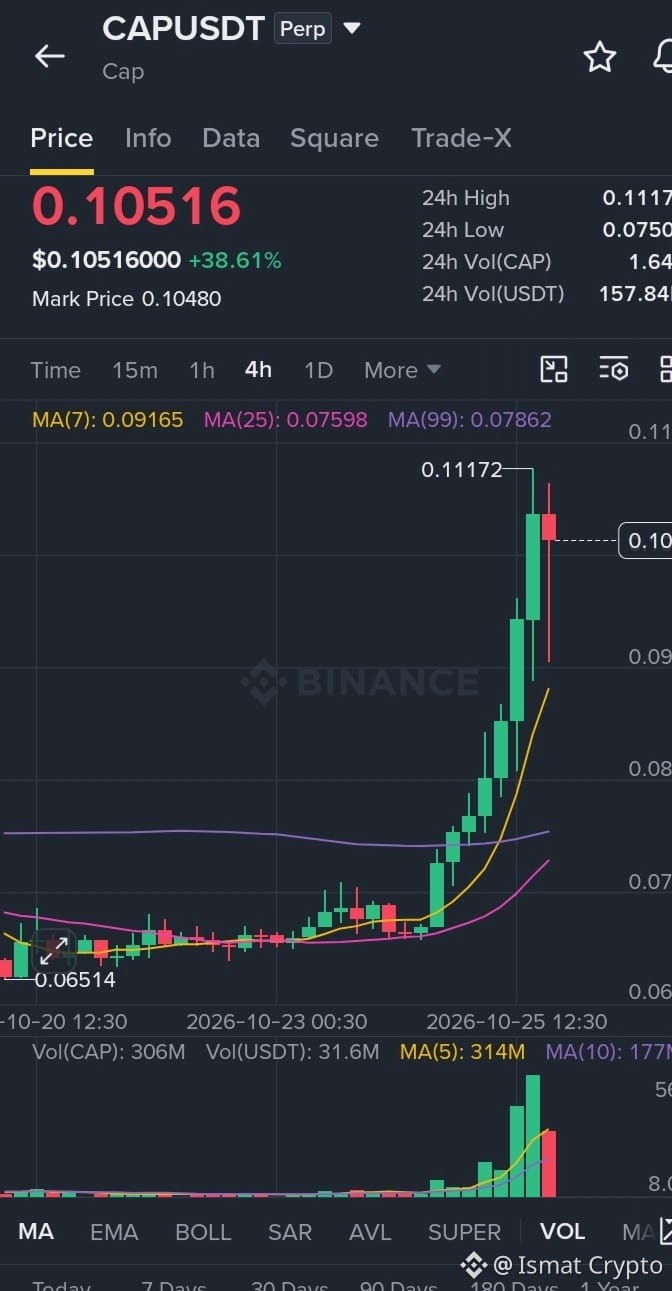
CAP/USDTは今日はかなり強い動きを見せており、38%を超える上昇で、現在は約$0.10516で取引されています。
4時間足を見ると、このブレイクアウトは取引高の大幅な増加に裏付けられており、24時間の取引高は16.4億CAPに達しています。価格は短期移動平均線を難なく上抜け、移動平均線は上向きに転じて、しっかりとしたサポートゾーンとして機能し始めています。
一時は$0.11172の高値をつけ、現在はそのすぐ下で値固めしています。買い手が価格を心理的節目である$0.100以上に維持できれば、近いうちに再び高値を目指す展開になるかもしれません。ただし、これほど急騰した後は、サポート水準が健全に再テストされるかどうかにも注目するのが賢明です。
この値動きについて、皆さんはどう思いますか?勢いに乗って買いますか、それとも押し目を待ちますか?
#CAPUSDT #暗号資産 #トレード #テクニカル分析 #BinanceSquare
$CAP
{future}(CAPUSDT)
CAP/USDTは今日はかなり強い動きを見せており、38%を超える上昇で、現在は約$0.10516で取引されています。
4時間足を見ると、このブレイクアウトは取引高の大幅な増加に裏付けられており、24時間の取引高は16.4億CAPに達しています。価格は短期移動平均線を難なく上抜け、移動平均線は上向きに転じて、しっかりとしたサポートゾーンとして機能し始めています。
一時は$0.11172の高値をつけ、現在はそのすぐ下で値固めしています。買い手が価格を心理的節目である$0.100以上に維持できれば、近いうちに再び高値を目指す展開になるかもしれません。ただし、これほど急騰した後は、サポート水準が健全に再テストされるかどうかにも注目するのが賢明です。
この値動きについて、皆さんはどう思いますか?勢いに乗って買いますか、それとも押し目を待ちますか?
#CAPUSDT #暗号資産 #トレード #テクニカル分析 #BinanceSquare
$CAP
331
·
--
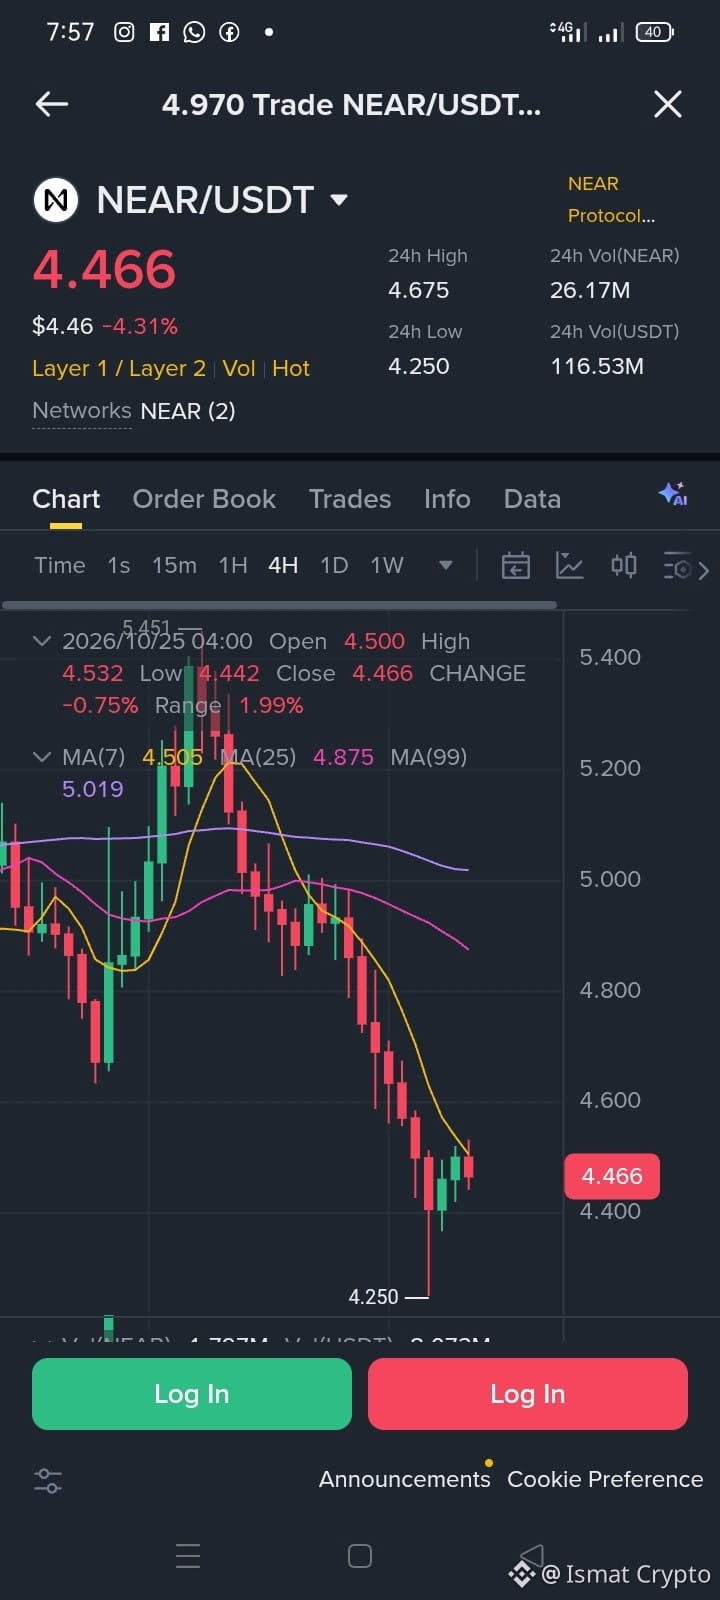
🚨 NEAR vs. ICP:これは絶好の押し目?それとも危険な罠?🤔
チャートを見ると、今日はNEARとICPの両方に強い下落圧力がかかっています。NEAR/USDTは現在4.466ドル前後(-4.31%)で取引されており、ICP/USDTは2.642ドル(-3.37%)まで下落しました。
どちらのレイヤー1の有力銘柄も、重要なサポートゾーンに差し掛かっています。今回の急な市場調整に多くの個人投資家が不安を感じていますが、賢い投資家は、パニックが最高潮に達すると、大きなチャンスが訪れることも知っています。📉
クジラたちは大きな反発に備えているのでしょうか?それとも、反転する前にさらなる下落が待っているのでしょうか?現物トレーダーにとって、相場が下落している日に有望なプロジェクトを買い増すことは、これまで最も利益につながる戦略でした。
👇 今、あなたはどう動きますか?
パニック売り?じっと保有?それとも欲張って押し目買い?コメント欄で目標価格を教えてください!毎日の最新情報を見逃さないよう、いいねとフォローもお忘れなく。👁️🗨️
#NEAR $NEAR #ICP $ICP #CryptoAnalysis #BuyTheDip #BinanceSquare
$NEAR
{spot}(NEARUSDT)
🚨 NEAR vs. ICP:これは絶好の押し目?それとも危険な罠?🤔
チャートを見ると、今日はNEARとICPの両方に強い下落圧力がかかっています。NEAR/USDTは現在4.466ドル前後(-4.31%)で取引されており、ICP/USDTは2.642ドル(-3.37%)まで下落しました。
どちらのレイヤー1の有力銘柄も、重要なサポートゾーンに差し掛かっています。今回の急な市場調整に多くの個人投資家が不安を感じていますが、賢い投資家は、パニックが最高潮に達すると、大きなチャンスが訪れることも知っています。📉
クジラたちは大きな反発に備えているのでしょうか?それとも、反転する前にさらなる下落が待っているのでしょうか?現物トレーダーにとって、相場が下落している日に有望なプロジェクトを買い増すことは、これまで最も利益につながる戦略でした。
👇 今、あなたはどう動きますか?
パニック売り?じっと保有?それとも欲張って押し目買い?コメント欄で目標価格を教えてください!毎日の最新情報を見逃さないよう、いいねとフォローもお忘れなく。👁️🗨️
#NEAR $NEAR #ICP $ICP #CryptoAnalysis #BuyTheDip #BinanceSquare
$NEAR
2
914
·
--
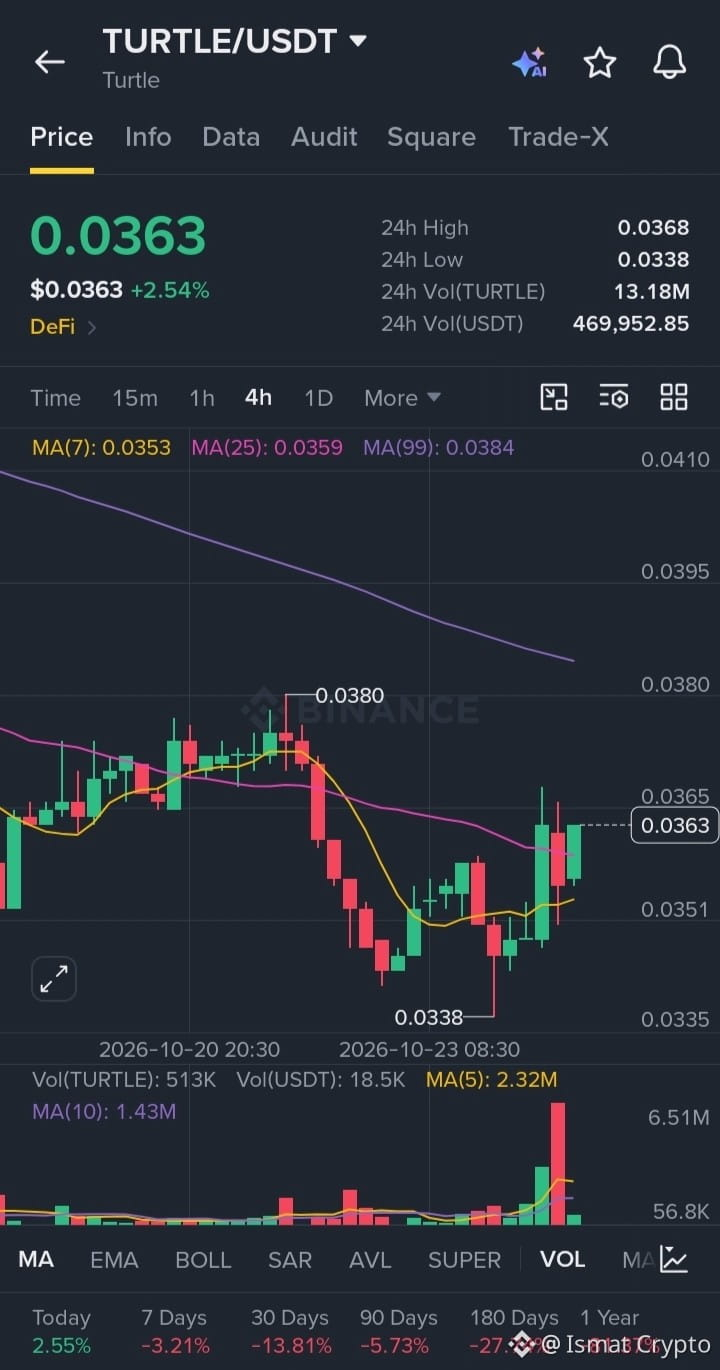
急がば回れ!🐢
$TURTLE は4時間足チャートで着実な回復の兆しを見せており、今日は+2.54%の上昇を維持しています。出来高も増え始め、勢いも良好です。
⚠️重要な戦略:最大限の成果を得るには、ここでは忍耐が鍵です。この動きの潜在力を十分に捉えるため、購入後少なくとも45〜60日間は保有しましょう。📉⏳
次は目先のレジスタンスに注目です!📈
この保有戦略について、どう思いますか?ぜひコメントで教えてください!👇
#TURTLE #暗号資産 #トレード #BinanceSquare #アルトコイン #CryptoInvesting
$TURTLE
{spot}(TURTLEUSDT)
急がば回れ!🐢
$TURTLE は4時間足チャートで着実な回復の兆しを見せており、今日は+2.54%の上昇を維持しています。出来高も増え始め、勢いも良好です。
⚠️重要な戦略:最大限の成果を得るには、ここでは忍耐が鍵です。この動きの潜在力を十分に捉えるため、購入後少なくとも45〜60日間は保有しましょう。📉⏳
次は目先のレジスタンスに注目です!📈
この保有戦略について、どう思いますか?ぜひコメントで教えてください!👇
#TURTLE #暗号資産 #トレード #BinanceSquare #アルトコイン #CryptoInvesting
$TURTLE
$TURTLE は4時間足チャートで着実な回復の兆しを見せており、今日は+2.54%の上昇を維持しています。出来高も増え始め、勢いも良好です。
⚠️重要な戦略:最大限の成果を得るには、ここでは忍耐が鍵です。この動きの潜在力を十分に捉えるため、購入後少なくとも45〜60日間は保有しましょう。📉⏳
次は目先のレジスタンスに注目です!📈
この保有戦略について、どう思いますか?ぜひコメントで教えてください!👇
#TURTLE #暗号資産 #トレード #BinanceSquare #アルトコイン #CryptoInvesting
$TURTLE
2
272
·
--
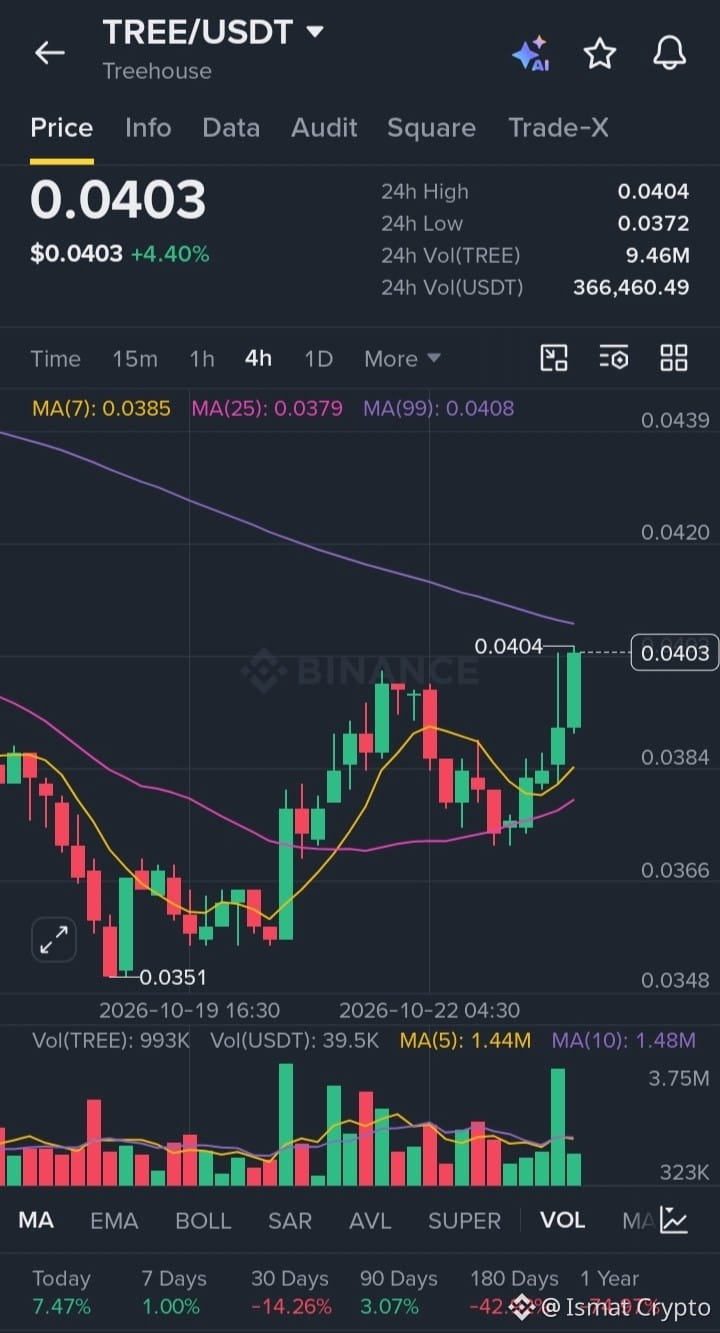
現在のTREE/USDTチャートを見ていますが、面白い動きになってきました。価格は0.0403付近で推移しており、4.40%の堅調な回復を見せています。
4時間足を見ると、最近0.0351のサポートラインからしっかり反発しています。現在はMA(7)とMA(25)の両方を上回って推移しており、短期的な強気の勢いを示す良い兆候です。
出来高もここ数日と比べてやや増加しています。安値圏での買い集めの段階はほぼ終わり、近いうちに力強いブレイクアウトが起こる可能性もありそうです。
この銘柄についての私の計画はとてもシンプルです。ここで少し買い、今後45〜60日間じっくり保有するつもりです。この期間があれば、市場が目先のレジスタンスを突破し、本格的な上昇を見せる余地も十分にあるでしょう。
いつものことですが、現物取引には忍耐が必要です。日々の小さな値動きに慌てる必要はありません。買って、保有して、あとは展開を見守りましょう。皆さんはTREEについてどう思いますか?保有していますか、それとも見送りますか?
#TREEUSDT #CryptoTrading #SpotHolding #BinanceSquare
$TREE
{spot}(TREEUSDT)
現在のTREE/USDTチャートを見ていますが、面白い動きになってきました。価格は0.0403付近で推移しており、4.40%の堅調な回復を見せています。
4時間足を見ると、最近0.0351のサポートラインからしっかり反発しています。現在はMA(7)とMA(25)の両方を上回って推移しており、短期的な強気の勢いを示す良い兆候です。
出来高もここ数日と比べてやや増加しています。安値圏での買い集めの段階はほぼ終わり、近いうちに力強いブレイクアウトが起こる可能性もありそうです。
この銘柄についての私の計画はとてもシンプルです。ここで少し買い、今後45〜60日間じっくり保有するつもりです。この期間があれば、市場が目先のレジスタンスを突破し、本格的な上昇を見せる余地も十分にあるでしょう。
いつものことですが、現物取引には忍耐が必要です。日々の小さな値動きに慌てる必要はありません。買って、保有して、あとは展開を見守りましょう。皆さんはTREEについてどう思いますか?保有していますか、それとも見送りますか?
#TREEUSDT #CryptoTrading #SpotHolding #BinanceSquare
$TREE
2
2
277
·
--
🚀 今日急騰中のコインTOP 3:買いか、それとも罠か? 🚨
市場は急速に動いています!4時間足チャートで、今日の上昇率トップはこちらです:
⚡ $BMT:現在$0.02750(+27.55%)。出来高が急増し、ブレイクアウト!強気派は次の目標を$0.030超えに定めています。
🔥 $SOXSB:$52.70(+19.85%)まで急騰。安値を切り上げるきれいな動きで、勢いは非常に強いです。
💎 $GTC:$0.29503(+8.79%)で取引中。着実に回復しています。$0.300を突破すれば、大きな上昇が期待できそうです!
⚠️ 注意:ボラティリティが非常に高いです。焦って飛び乗らず、必ず厳格なストップロスを設定しましょう!
👇 どのコインを保有していますか?目標価格をコメントしてください!
👉 毎日のアルファ情報と勝ちにつながるシグナルを受け取るにはフォロー! 🔥
#BinanceSquare #CryptoTrading #BMT #GTC #WhaleAlert #BullRun
1
414
·
--
#BinancePick
最大規模の暗号資産予測イベントがついに開催!🚀
あなたの相場分析は外れ知らず?Binanceが賞金総額1,000,000 USDCの「Binance Pick Season 1」を開始しました!💰
私はすでに300以上のボーナススコアを獲得し、毎日のチェックインも済ませました。このチャンスを見逃さないで!
👇 現在のスコアはいくつですか?コメント欄で教えてください!
今すぐフォローボタンを押して、Binanceの限定キャンペーン情報やヒント、暗号資産市場の最新情報をチェックしましょう!
#BinancePick #CryptoPredictions #BinanceSquare #CryptoEarning

59
·
--
🤔 $ARBは大幅上昇に向けて準備中?
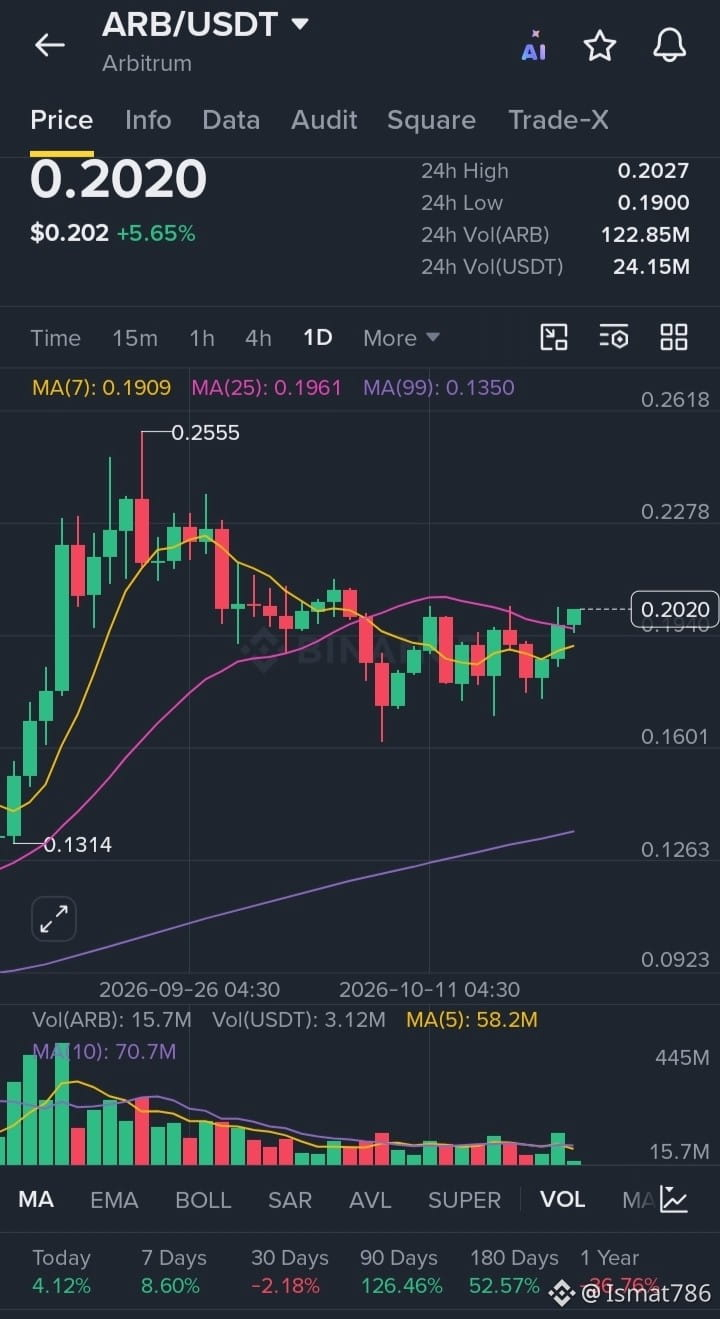
ARB/USDTの日足チャートを見てみましょう!価格は力強く反発して$0.2020に達し、直近のレジスタンスを突破しました。90日間のパフォーマンスは驚異の+126.46%を記録しており、長期トレンドが依然として非常に活発であることを示しています。
ブレイクアウトに乗って買いますか?それとも反発で売りますか?予想をコメントで教えてください!🪙👇
#BinanceSquare #ARB #Layer2 #CryptoTrading #Bullish
🤔 $ARBは大幅上昇に向けて準備中?
ARB/USDTの日足チャートを見てみましょう!価格は力強く反発して$0.2020に達し、直近のレジスタンスを突破しました。90日間のパフォーマンスは驚異の+126.46%を記録しており、長期トレンドが依然として非常に活発であることを示しています。
ブレイクアウトに乗って買いますか?それとも反発で売りますか?予想をコメントで教えてください!🪙👇
#BinanceSquare #ARB #Layer2 #CryptoTrading #Bullish
ARB/USDTの日足チャートを見てみましょう!価格は力強く反発して$0.2020に達し、直近のレジスタンスを突破しました。90日間のパフォーマンスは驚異の+126.46%を記録しており、長期トレンドが依然として非常に活発であることを示しています。
ブレイクアウトに乗って買いますか?それとも反発で売りますか?予想をコメントで教えてください!🪙👇
#BinanceSquare #ARB #Layer2 #CryptoTrading #Bullish
1
202
·
--
**上昇相場チェックリスト:$ARB、PEPE、DASHが上値を突破!**
今日の1日足チャートを見ると、買い手が市場に戻ってきています。テクニカル面を簡単に見てみましょう。
📈 **$ARB
/USDT($0.1913 | +5.34%)**
Arbitrumは日足のサポートラインから順調に反発しています。24時間の取引高は4,390万ARBを超え、活発な関心が戻っていることを示しています。
📈 **$PEPE /USDT($0.00000407 | +5.17%)**
PEPEは24時間の取引高が2,140万ドルを超え、底堅さを見せています。日足のMA(7)をわずかに上回る水準で値動きが収束しており、ブレイクアウトが近いかもしれません!
📈 **$DASH /USDT($49.33 | +1.50%)**
DASHは急落後に回復しています。心理的な節目となる50ドルのレジスタンスラインに注目です。
今後1週間で、最も強気に見えるのはこの3銘柄のうちどれですか? 🤔 コメントで話し合いましょう!
#Binance #Trading #MemeCoins #Altcoins
**上昇相場チェックリスト:$ARB 、PEPE、DASHが上値を突破!**
今日の1日足チャートを見ると、買い手が市場に戻ってきています。テクニカル面を簡単に見てみましょう。
📈 **$ARB
/USDT($0.1913 | +5.34%)**
Arbitrumは日足のサポートラインから順調に反発しています。24時間の取引高は4,390万ARBを超え、活発な関心が戻っていることを示しています。
📈 **$PEPE /USDT($0.00000407 | +5.17%)**
PEPEは24時間の取引高が2,140万ドルを超え、底堅さを見せています。日足のMA(7)をわずかに上回る水準で値動きが収束しており、ブレイクアウトが近いかもしれません!
📈 **$DASH /USDT($49.33 | +1.50%)**
DASHは急落後に回復しています。心理的な節目となる50ドルのレジスタンスラインに注目です。
今後1週間で、最も強気に見えるのはこの3銘柄のうちどれですか? 🤔 コメントで話し合いましょう!
#Binance #Trading #MemeCoins #Altcoins
1
434
·
--
皆さん、今日の日足チャートを見ていたら、上昇率ランキングで気になる動きがいくつかありました。
まずは、
$GTC。価格は$0.26633で、今日は18%以上上昇する強さを見せています。短期MAをしっかり上回っており、過去30日間で+247%もの急騰を見せるなど、明らかに強気派が優勢です。ただし、$0.393付近にある大きなレジスタンスには注意してください。
一方、
$ERAは$0.0705でしっかりと底固めを試みており、日足で11%の反発を見せています。出来高が大きく($11.6M)、MA7を再び上回りました。ただ、長い下落トレンドを経て、本格的にトレンドが転換したと判断するには、日足終値でMA25($0.066)を上回るのを確認したいところです。
最後に、
$QKCは大きな陽線をつけて$0.002610まで上昇し、トークン数で850Mという出来高急増を伴って、目先のレジスタンスを突破しました。$0.00272をサポートに転換できれば、今週もこの上昇が続く展開は十分ありそうです。
個人的には、押し目買いのチャンスを探しながら、$GTCをかなり注視しています。ただし、リスク管理を徹底し、陽線を見てむやみに飛び乗らないようにしましょう。
この3銘柄について、皆さんはどう動きますか?勢いに乗って買いますか?それとも、より明確なリテストを待ちますか?ぜひコメントで教えてください!👇
1
248
ログインして、さらにコンテンツを読む
厳選トピックで世界の暗号資産トレーダーの仲間入り
⚡️ 暗号資産に関する最新かつ有益な情報が見つかります。
💬 世界最大の暗号資産取引所から信頼されています。
👍 認証を受けたクリエイターから、有益なインサイトを得られます。
メール / 電話番号