

Ibrahim Awwab
9 投稿

Ibrahim Awwab
報告
ユーザーをブロック
Ibrahim Awwab | Crypto & Market Analyst, Sharing crypto market insights, technical analysis, Bitcoin updates, altcoin trends, and practical trading education.
取引を発注
5.5か月
0 フォロー
11 フォロワー
6 いいね
投稿
ポートフォリオ
翻訳参照
#QNTRises287%
🚨 QNT Surges 287% — What’s Behind the Move?
#QNT has recorded a remarkable 287% rise, putting the token firmly on traders’ radar.
Moves this large can attract momentum traders quickly, but they also come with extreme volatility and elevated risk.
Before chasing the move, I’d watch:
- 📊 Trading volume and liquidity
- 📈 Whether the breakout holds after the initial surge
- 🔄 Possible pullback/retest
- ⚠️ Whether the move is supported by genuine market demand
A sharp percentage gain is not, by itself, confirmation that the trend will continue.
Ibrahim Awwab
Crypto | Market Analysis | Trading Education
Are you watching QNT after this move, or waiting for a pullback?
#QNT #Quant #CryptoMarket #Altcoins #TradingEducation #BinanceSquare
Educational market analysis only. Not financial advice.
#QNTRises287%
🚨 QNT Surges 287% — What’s Behind the Move?
#QNT has recorded a remarkable 287% rise, putting the token firmly on traders’ radar.
Moves this large can attract momentum traders quickly, but they also come with extreme volatility and elevated risk.
Before chasing the move, I’d watch:
- 📊 Trading volume and liquidity
- 📈 Whether the breakout holds after the initial surge
- 🔄 Possible pullback/retest
- ⚠️ Whether the move is supported by genuine market demand
A sharp percentage gain is not, by itself, confirmation that the trend will continue.
Ibrahim Awwab
Crypto | Market Analysis | Trading Education
Are you watching QNT after this move, or waiting for a pullback?
#QNT #Quant #CryptoMarket #Altcoins #TradingEducation #BinanceSquare
Educational market analysis only. Not financial advice.
🚨 QNT Surges 287% — What’s Behind the Move?
#QNT has recorded a remarkable 287% rise, putting the token firmly on traders’ radar.
Moves this large can attract momentum traders quickly, but they also come with extreme volatility and elevated risk.
Before chasing the move, I’d watch:
- 📊 Trading volume and liquidity
- 📈 Whether the breakout holds after the initial surge
- 🔄 Possible pullback/retest
- ⚠️ Whether the move is supported by genuine market demand
A sharp percentage gain is not, by itself, confirmation that the trend will continue.
Ibrahim Awwab
Crypto | Market Analysis | Trading Education
Are you watching QNT after this move, or waiting for a pullback?
#QNT #Quant #CryptoMarket #Altcoins #TradingEducation #BinanceSquare
Educational market analysis only. Not financial advice.
155
翻訳参照
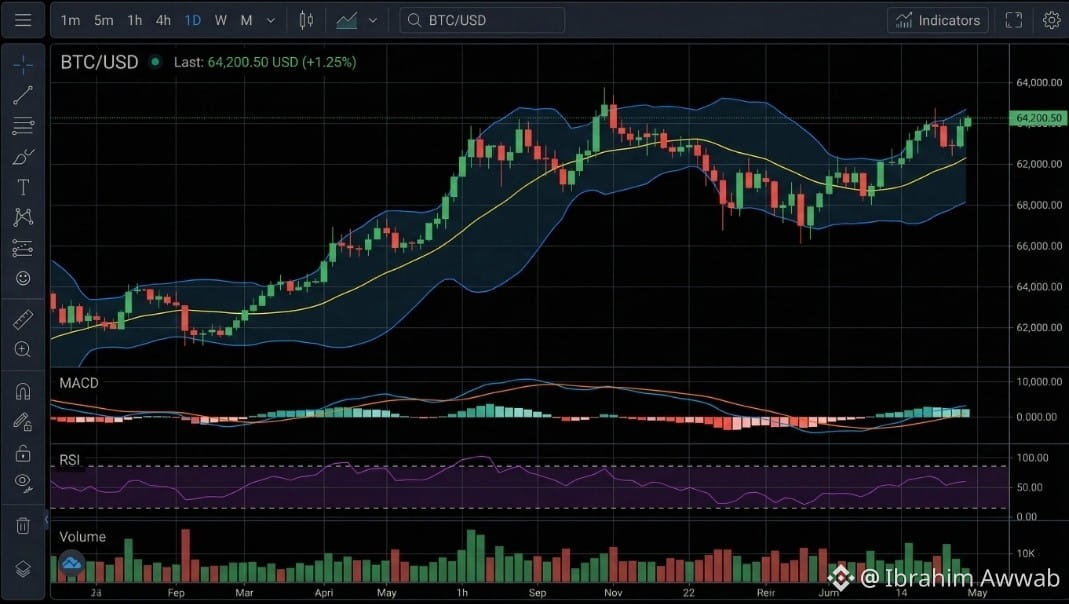
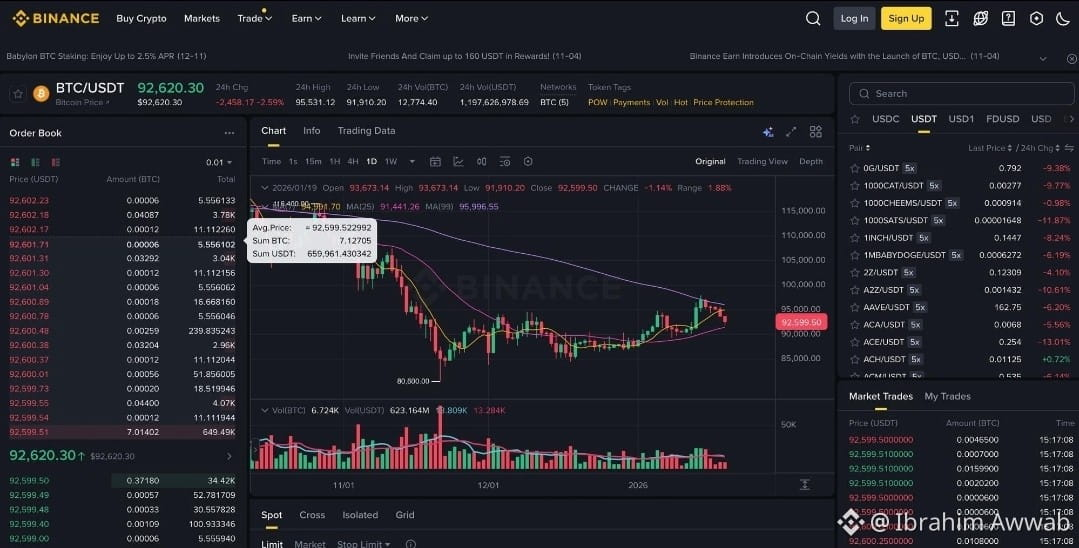
$BTC Next 1-Hour Outlook
₿ BTC: ~$83.15K
1H: -0.17% | 24H: -0.82%
BTC is showing short-term weakness, but price is still holding the important $82K–$83K area.
My 1H scenarios:
🟢 Bullish: Reclaim $83.5K–$84K with volume → momentum could improve.
🔴 Bearish: Lose $82K → downside pressure could increase.
⚪ Between: Expect possible sideways/choppy action.
I’m not chasing the candle. Wait for confirmation, define invalidation, then trade the setup.
⚠️ Educational analysis only. Crypto is highly volatile.
Ibrahim Awwab
Crypto | Market Analysis | Trading Education
What are you watching for the next hour?
#BTC #Bitcoin #CryptoTrading #TechnicalAnalysis #BinanceSquare
$BTC Next 1-Hour Outlook
₿ BTC: ~$83.15K
1H: -0.17% | 24H: -0.82%
BTC is showing short-term weakness, but price is still holding the important $82K–$83K area.
My 1H scenarios:
🟢 Bullish: Reclaim $83.5K–$84K with volume → momentum could improve.
🔴 Bearish: Lose $82K → downside pressure could increase.
⚪ Between: Expect possible sideways/choppy action.
I’m not chasing the candle. Wait for confirmation, define invalidation, then trade the setup.
⚠️ Educational analysis only. Crypto is highly volatile.
Ibrahim Awwab
Crypto | Market Analysis | Trading Education
What are you watching for the next hour?
#BTC #Bitcoin #CryptoTrading #TechnicalAnalysis #BinanceSquare
₿ BTC: ~$83.15K
1H: -0.17% | 24H: -0.82%
BTC is showing short-term weakness, but price is still holding the important $82K–$83K area.
My 1H scenarios:
🟢 Bullish: Reclaim $83.5K–$84K with volume → momentum could improve.
🔴 Bearish: Lose $82K → downside pressure could increase.
⚪ Between: Expect possible sideways/choppy action.
I’m not chasing the candle. Wait for confirmation, define invalidation, then trade the setup.
⚠️ Educational analysis only. Crypto is highly volatile.
Ibrahim Awwab
Crypto | Market Analysis | Trading Education
What are you watching for the next hour?
#BTC #Bitcoin #CryptoTrading #TechnicalAnalysis #BinanceSquare
28
記事
翻訳参照
Crypto Market at a Decision Point: Bitcoin Consolidates While Altcoins Test Their StrengthCrypto Market at a Decision Point: Bitcoin Consolidates While Altcoins Test Their Strength
September 30, 2026
The crypto market is entering an interesting phase.
Bitcoin is no longer pushing aggressively toward the recent highs, but neither has it broken down decisively. $BTC is trading around the $83K area, while Ethereum is near $2.67K. Across Binance Square, one theme appears repeatedly: consolidation, selective altcoin strength, and increasing sensitivity to macro conditions.
The question now isn't simply whether Bitcoin is bullish or bearish.
The more useful question is:
Which side is actually gaining control at the key levels?
Bitcoin: the $82K–$85K battle
Bitcoin recently traded near $87K before pulling back toward the low-$83K region. Current market reports identify roughly $82K–$83K as an important near-term support zone, while $85K remains a key resistance area.
This creates a relatively straightforward trading framework:
Above $85K:
A sustained breakout, particularly with stronger volume, would provide more convincing evidence that buyers are attempting to regain control.
Between $82K and $85K:
This remains a range environment. Traders should be careful about treating every intraday move as a new trend.
Below $82K:
The short-term structure becomes more vulnerable, with the $80K area becoming increasingly relevant.
The important distinction is between a price touch and a confirmed breakout. A brief move above resistance isn't necessarily enough. Confirmation through closing price, volume and follow-through matters.
Momentum is becoming less decisive
One current Binance Square market update puts BTC's RSI around 49, while MACD is reported as negative. That combination is consistent with a market that has lost some short-term momentum rather than one displaying an extremely stretched directional condition.
That matters because traders can easily mistake consolidation for either accumulation or distribution.
At this stage, the chart itself needs to provide the answer.
Ethereum and the altcoin question
Ethereum is showing a slightly different picture.
Recent Square discussions have highlighted ETH's relative resilience, while other reports note that short positioning in $ETH has reached elevated levels. If ETH moves sharply against crowded short positioning, volatility could increase quickly.
Meanwhile, the Altcoin Season Index has been reported around 60–64, below the commonly referenced 75 threshold for a broad altcoin season. This suggests that there is evidence of rotation toward some altcoins, but not enough to describe the entire market as being in a confirmed altseason.
That distinction is important.
A few altcoins moving strongly does not automatically mean the entire altcoin market has entered a sustained bullish phase.
$BTC dominance remains important
BTC dominance is currently around 58.6% in the latest Square market data.
High BTC dominance while some altcoins outperform can create an interesting market structure.
I'm watching whether:
- BTC holds its current range.
- BTH continues showing relative strength.
- BTC dominance begins declining consistently.
- Altcoin volume expands beyond a handful of individual tokens.
A sustained combination of those factors would provide stronger evidence of broader capital rotation.
Macro is still part of the trade
Crypto is not trading in isolation.
Recent market reports point to elevated U.S. Treasury yields as an important source of pressure on risk assets. One September 30 report noted the U.S. 10-year Treasury yield briefly reaching 5.293%, while the 30-year yield reached 5.6206%.
The market is also watching upcoming U.S. economic data, particularly core PCE inflation and the employment report, because changes in rate expectations can influence liquidity and risk appetite.
This is why a technically attractive crypto setup can fail if the broader macro environment suddenly changes.
ETF flows are worth watching
Another important theme is that institutional flows have not completely disappeared.
Recent reporting showed continued spot ETF inflows, although the pace has slowed compared with previous sessions. One report cited approximately $31 million of net BTC ETF inflows on September 28, while ETH ETF inflows were also positive.
So the current picture isn't simply:
“Institutions are leaving crypto.”
It is more nuanced:
Price momentum has weakened while institutional demand remains present but less aggressive.
That creates an environment where BTC can move sideways until a stronger catalyst appears.
What I'm watching next
For BTC, my primary levels remain:
Resistance:
$85K → $86K–$87K
Support:
$82K–$83K → ~$80K
For ETH, I'm watching whether relative strength continues if BTC remains range-bound.
For altcoins, I'm looking for volume confirmation, not simply large percentage moves on low liquidity.
And across the entire market, I'm watching the relationship between:
BTC price + BTC dominance + ETF flows + Treasury yields + trading volume.
Those five factors can tell us considerably more than a single green or red candle.
Practical trading perspective
This is the type of market where patience becomes a trading advantage.
If BTC is inside a range, there is no requirement to trade every movement inside that range.
A disciplined approach is to define the level that confirms the setup before entering, identify where the idea becomes invalid, and size the position so that a wrong trade does not damage the account.
Don't confuse activity with opportunity.
Sometimes the best trade is waiting for the market to show its hand.
Bottom line
Bitcoin is currently sitting at an important decision area around the low-$83K region.
The market has not yet provided a decisive breakout above $85K or a confirmed breakdown below the $82K support zone. Meanwhile, Ethereum and selected altcoins are showing signs of relative strength, but broader altseason confirmation is still absent.
The next major move will likely be more meaningful if it comes with volume and confirmation, rather than simply a fast intraday candle.
I'll be watching the levels — not chasing the headlines.
Ibrahim Awwab
Crypto | Market Analysis | Trading Education
⚠️ Risk reminder: Crypto assets are highly volatile. This article is for educational and market-analysis purposes only and is not financial advice. Always conduct your own research and manage risk appropriately.
#Bitcoin #BTC #Ethereum #ETH #CryptoMarket #TechnicalAnalysis #Altcoins #TradingEducation
Crypto Market at a Decision Point: Bitcoin Consolidates While Altcoins Test Their Strength
Crypto Market at a Decision Point: Bitcoin Consolidates While Altcoins Test Their Strength
September 30, 2026
The crypto market is entering an interesting phase.
Bitcoin is no longer pushing aggressively toward the recent highs, but neither has it broken down decisively. $BTC is trading around the $83K area, while Ethereum is near $2.67K. Across Binance Square, one theme appears repeatedly: consolidation, selective altcoin strength, and increasing sensitivity to macro conditions.
The question now isn't simply whether Bitcoin is bullish or bearish.
The more useful question is:
Which side is actually gaining control at the key levels?
Bitcoin: the $82K–$85K battle
Bitcoin recently traded near $87K before pulling back toward the low-$83K region. Current market reports identify roughly $82K–$83K as an important near-term support zone, while $85K remains a key resistance area.
This creates a relatively straightforward trading framework:
Above $85K:
A sustained breakout, particularly with stronger volume, would provide more convincing evidence that buyers are attempting to regain control.
Between $82K and $85K:
This remains a range environment. Traders should be careful about treating every intraday move as a new trend.
Below $82K:
The short-term structure becomes more vulnerable, with the $80K area becoming increasingly relevant.
The important distinction is between a price touch and a confirmed breakout. A brief move above resistance isn't necessarily enough. Confirmation through closing price, volume and follow-through matters.
Momentum is becoming less decisive
One current Binance Square market update puts BTC's RSI around 49, while MACD is reported as negative. That combination is consistent with a market that has lost some short-term momentum rather than one displaying an extremely stretched directional condition.
That matters because traders can easily mistake consolidation for either accumulation or distribution.
At this stage, the chart itself needs to provide the answer.
Ethereum and the altcoin question
Ethereum is showing a slightly different picture.
Recent Square discussions have highlighted ETH's relative resilience, while other reports note that short positioning in $ETH has reached elevated levels. If ETH moves sharply against crowded short positioning, volatility could increase quickly.
Meanwhile, the Altcoin Season Index has been reported around 60–64, below the commonly referenced 75 threshold for a broad altcoin season. This suggests that there is evidence of rotation toward some altcoins, but not enough to describe the entire market as being in a confirmed altseason.
That distinction is important.
A few altcoins moving strongly does not automatically mean the entire altcoin market has entered a sustained bullish phase.
$BTC dominance remains important
BTC dominance is currently around 58.6% in the latest Square market data.
High BTC dominance while some altcoins outperform can create an interesting market structure.
I'm watching whether:
- BTC holds its current range.
- BTH continues showing relative strength.
- BTC dominance begins declining consistently.
- Altcoin volume expands beyond a handful of individual tokens.
A sustained combination of those factors would provide stronger evidence of broader capital rotation.
Macro is still part of the trade
Crypto is not trading in isolation.
Recent market reports point to elevated U.S. Treasury yields as an important source of pressure on risk assets. One September 30 report noted the U.S. 10-year Treasury yield briefly reaching 5.293%, while the 30-year yield reached 5.6206%.
The market is also watching upcoming U.S. economic data, particularly core PCE inflation and the employment report, because changes in rate expectations can influence liquidity and risk appetite.
This is why a technically attractive crypto setup can fail if the broader macro environment suddenly changes.
ETF flows are worth watching
Another important theme is that institutional flows have not completely disappeared.
Recent reporting showed continued spot ETF inflows, although the pace has slowed compared with previous sessions. One report cited approximately $31 million of net BTC ETF inflows on September 28, while ETH ETF inflows were also positive.
So the current picture isn't simply:
“Institutions are leaving crypto.”
It is more nuanced:
Price momentum has weakened while institutional demand remains present but less aggressive.
That creates an environment where BTC can move sideways until a stronger catalyst appears.
What I'm watching next
For BTC, my primary levels remain:
Resistance:
$85K → $86K–$87K
Support:
$82K–$83K → ~$80K
For ETH, I'm watching whether relative strength continues if BTC remains range-bound.
For altcoins, I'm looking for volume confirmation, not simply large percentage moves on low liquidity.
And across the entire market, I'm watching the relationship between:
BTC price + BTC dominance + ETF flows + Treasury yields + trading volume.
Those five factors can tell us considerably more than a single green or red candle.
Practical trading perspective
This is the type of market where patience becomes a trading advantage.
If BTC is inside a range, there is no requirement to trade every movement inside that range.
A disciplined approach is to define the level that confirms the setup before entering, identify where the idea becomes invalid, and size the position so that a wrong trade does not damage the account.
Don't confuse activity with opportunity.
Sometimes the best trade is waiting for the market to show its hand.
Bottom line
Bitcoin is currently sitting at an important decision area around the low-$83K region.
The market has not yet provided a decisive breakout above $85K or a confirmed breakdown below the $82K support zone. Meanwhile, Ethereum and selected altcoins are showing signs of relative strength, but broader altseason confirmation is still absent.
The next major move will likely be more meaningful if it comes with volume and confirmation, rather than simply a fast intraday candle.
I'll be watching the levels — not chasing the headlines.
Ibrahim Awwab
Crypto | Market Analysis | Trading Education
⚠️ Risk reminder: Crypto assets are highly volatile. This article is for educational and market-analysis purposes only and is not financial advice. Always conduct your own research and manage risk appropriately.
#Bitcoin #BTC #Ethereum #ETH #CryptoMarket #TechnicalAnalysis #Altcoins #TradingEducation
September 30, 2026
The crypto market is entering an interesting phase.
Bitcoin is no longer pushing aggressively toward the recent highs, but neither has it broken down decisively. $BTC is trading around the $83K area, while Ethereum is near $2.67K. Across Binance Square, one theme appears repeatedly: consolidation, selective altcoin strength, and increasing sensitivity to macro conditions.
The question now isn't simply whether Bitcoin is bullish or bearish.
The more useful question is:
Which side is actually gaining control at the key levels?
Bitcoin: the $82K–$85K battle
Bitcoin recently traded near $87K before pulling back toward the low-$83K region. Current market reports identify roughly $82K–$83K as an important near-term support zone, while $85K remains a key resistance area.
This creates a relatively straightforward trading framework:
Above $85K:
A sustained breakout, particularly with stronger volume, would provide more convincing evidence that buyers are attempting to regain control.
Between $82K and $85K:
This remains a range environment. Traders should be careful about treating every intraday move as a new trend.
Below $82K:
The short-term structure becomes more vulnerable, with the $80K area becoming increasingly relevant.
The important distinction is between a price touch and a confirmed breakout. A brief move above resistance isn't necessarily enough. Confirmation through closing price, volume and follow-through matters.
Momentum is becoming less decisive
One current Binance Square market update puts BTC's RSI around 49, while MACD is reported as negative. That combination is consistent with a market that has lost some short-term momentum rather than one displaying an extremely stretched directional condition.
That matters because traders can easily mistake consolidation for either accumulation or distribution.
At this stage, the chart itself needs to provide the answer.
Ethereum and the altcoin question
Ethereum is showing a slightly different picture.
Recent Square discussions have highlighted ETH's relative resilience, while other reports note that short positioning in $ETH has reached elevated levels. If ETH moves sharply against crowded short positioning, volatility could increase quickly.
Meanwhile, the Altcoin Season Index has been reported around 60–64, below the commonly referenced 75 threshold for a broad altcoin season. This suggests that there is evidence of rotation toward some altcoins, but not enough to describe the entire market as being in a confirmed altseason.
That distinction is important.
A few altcoins moving strongly does not automatically mean the entire altcoin market has entered a sustained bullish phase.
$BTC dominance remains important
BTC dominance is currently around 58.6% in the latest Square market data.
High BTC dominance while some altcoins outperform can create an interesting market structure.
I'm watching whether:
- BTC holds its current range.
- BTH continues showing relative strength.
- BTC dominance begins declining consistently.
- Altcoin volume expands beyond a handful of individual tokens.
A sustained combination of those factors would provide stronger evidence of broader capital rotation.
Macro is still part of the trade
Crypto is not trading in isolation.
Recent market reports point to elevated U.S. Treasury yields as an important source of pressure on risk assets. One September 30 report noted the U.S. 10-year Treasury yield briefly reaching 5.293%, while the 30-year yield reached 5.6206%.
The market is also watching upcoming U.S. economic data, particularly core PCE inflation and the employment report, because changes in rate expectations can influence liquidity and risk appetite.
This is why a technically attractive crypto setup can fail if the broader macro environment suddenly changes.
ETF flows are worth watching
Another important theme is that institutional flows have not completely disappeared.
Recent reporting showed continued spot ETF inflows, although the pace has slowed compared with previous sessions. One report cited approximately $31 million of net BTC ETF inflows on September 28, while ETH ETF inflows were also positive.
So the current picture isn't simply:
“Institutions are leaving crypto.”
It is more nuanced:
Price momentum has weakened while institutional demand remains present but less aggressive.
That creates an environment where BTC can move sideways until a stronger catalyst appears.
What I'm watching next
For BTC, my primary levels remain:
Resistance:
$85K → $86K–$87K
Support:
$82K–$83K → ~$80K
For ETH, I'm watching whether relative strength continues if BTC remains range-bound.
For altcoins, I'm looking for volume confirmation, not simply large percentage moves on low liquidity.
And across the entire market, I'm watching the relationship between:
BTC price + BTC dominance + ETF flows + Treasury yields + trading volume.
Those five factors can tell us considerably more than a single green or red candle.
Practical trading perspective
This is the type of market where patience becomes a trading advantage.
If BTC is inside a range, there is no requirement to trade every movement inside that range.
A disciplined approach is to define the level that confirms the setup before entering, identify where the idea becomes invalid, and size the position so that a wrong trade does not damage the account.
Don't confuse activity with opportunity.
Sometimes the best trade is waiting for the market to show its hand.
Bottom line
Bitcoin is currently sitting at an important decision area around the low-$83K region.
The market has not yet provided a decisive breakout above $85K or a confirmed breakdown below the $82K support zone. Meanwhile, Ethereum and selected altcoins are showing signs of relative strength, but broader altseason confirmation is still absent.
The next major move will likely be more meaningful if it comes with volume and confirmation, rather than simply a fast intraday candle.
I'll be watching the levels — not chasing the headlines.
Ibrahim Awwab
Crypto | Market Analysis | Trading Education
⚠️ Risk reminder: Crypto assets are highly volatile. This article is for educational and market-analysis purposes only and is not financial advice. Always conduct your own research and manage risk appropriately.
#Bitcoin #BTC #Ethereum #ETH #CryptoMarket #TechnicalAnalysis #Altcoins #TradingEducation
39
翻訳参照
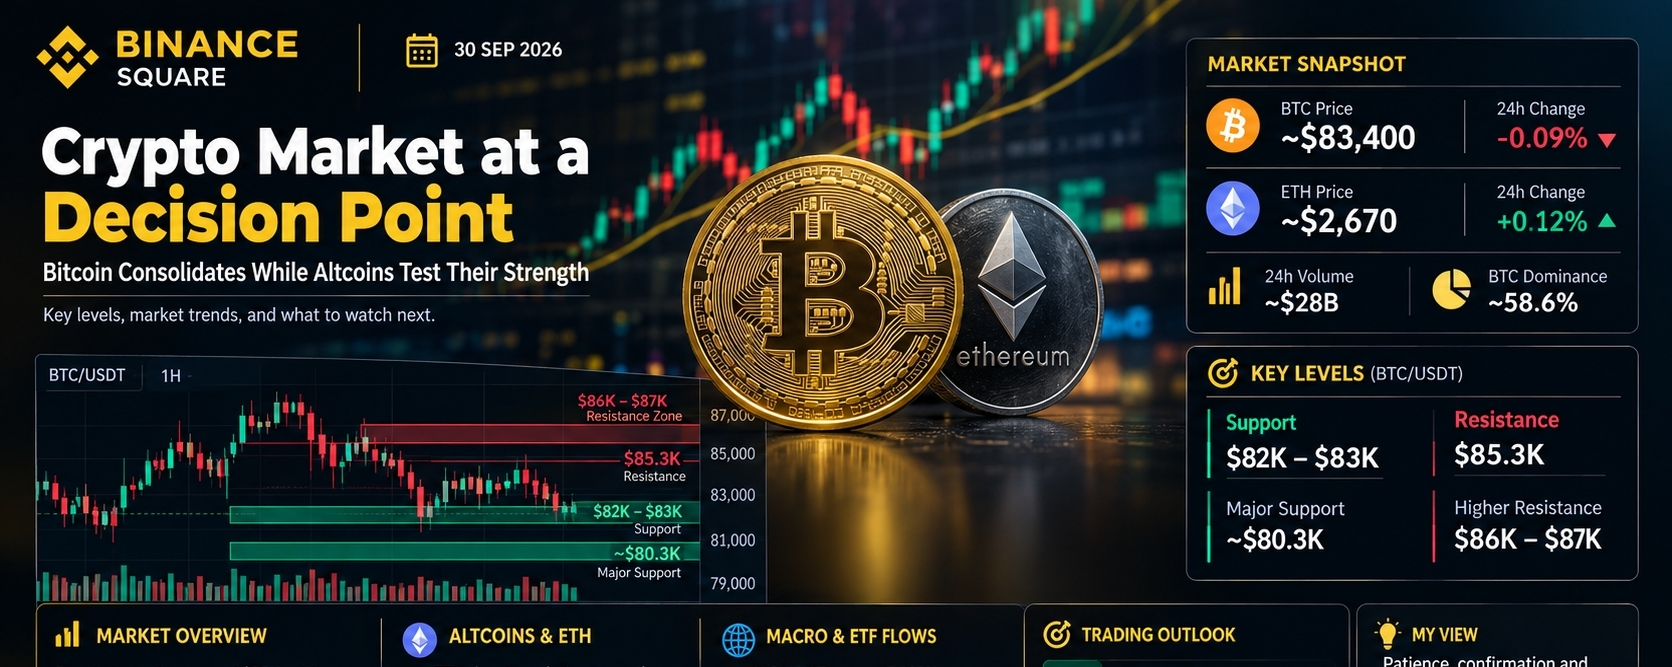
Bitcoin Market Update — Sept. 30, 2026
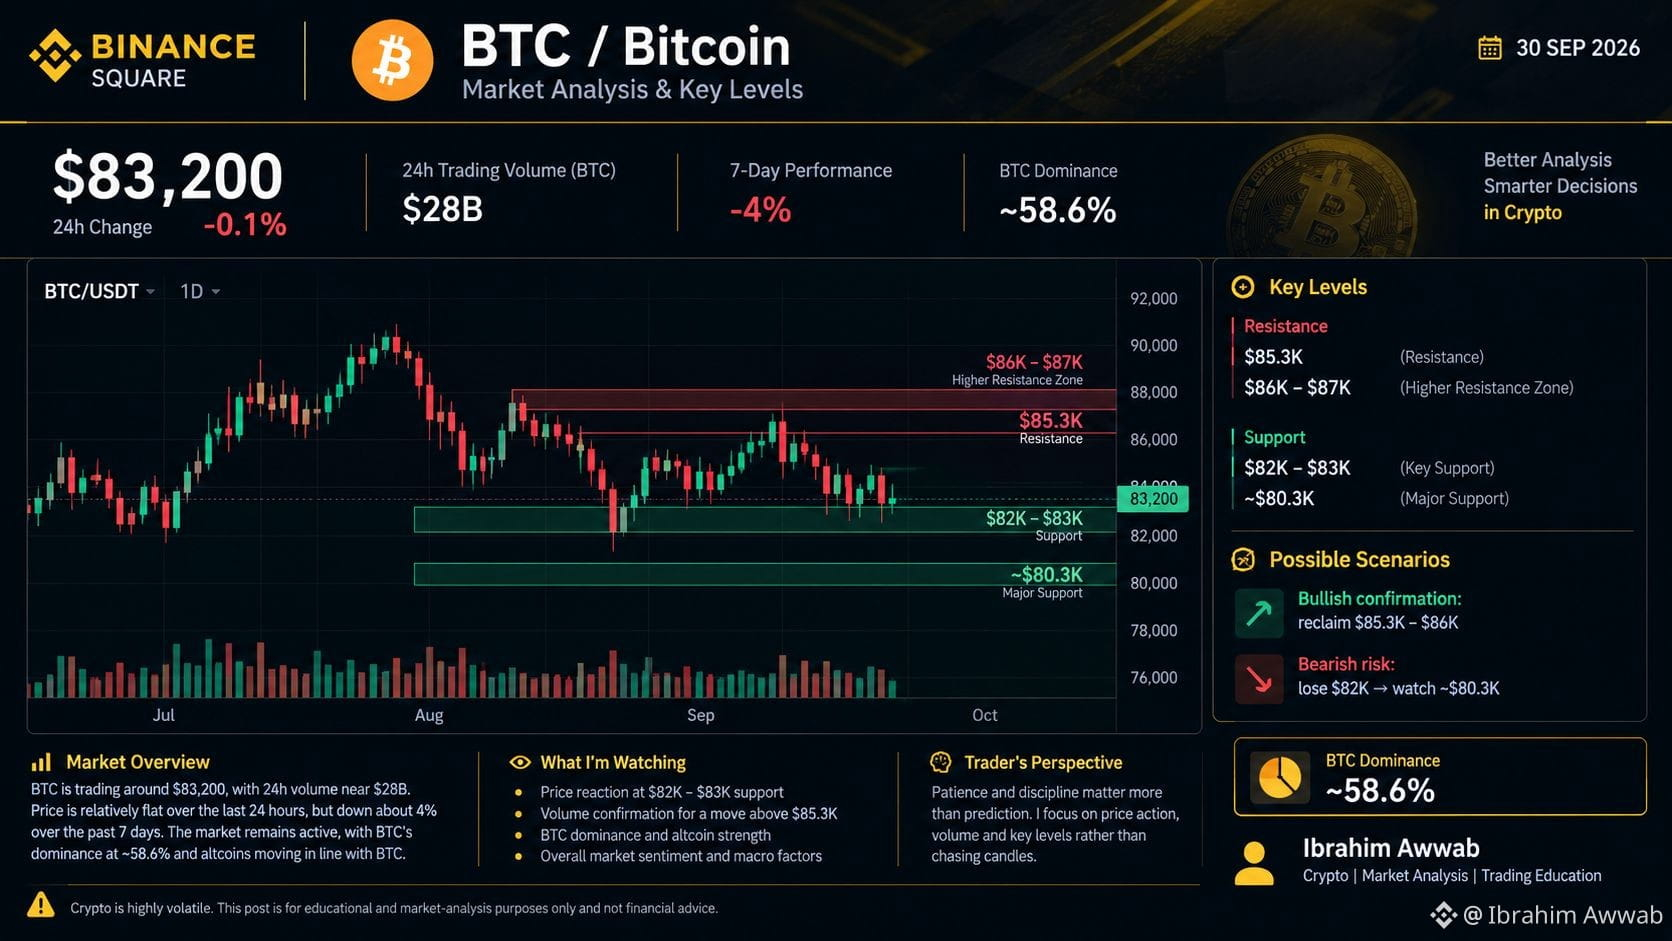
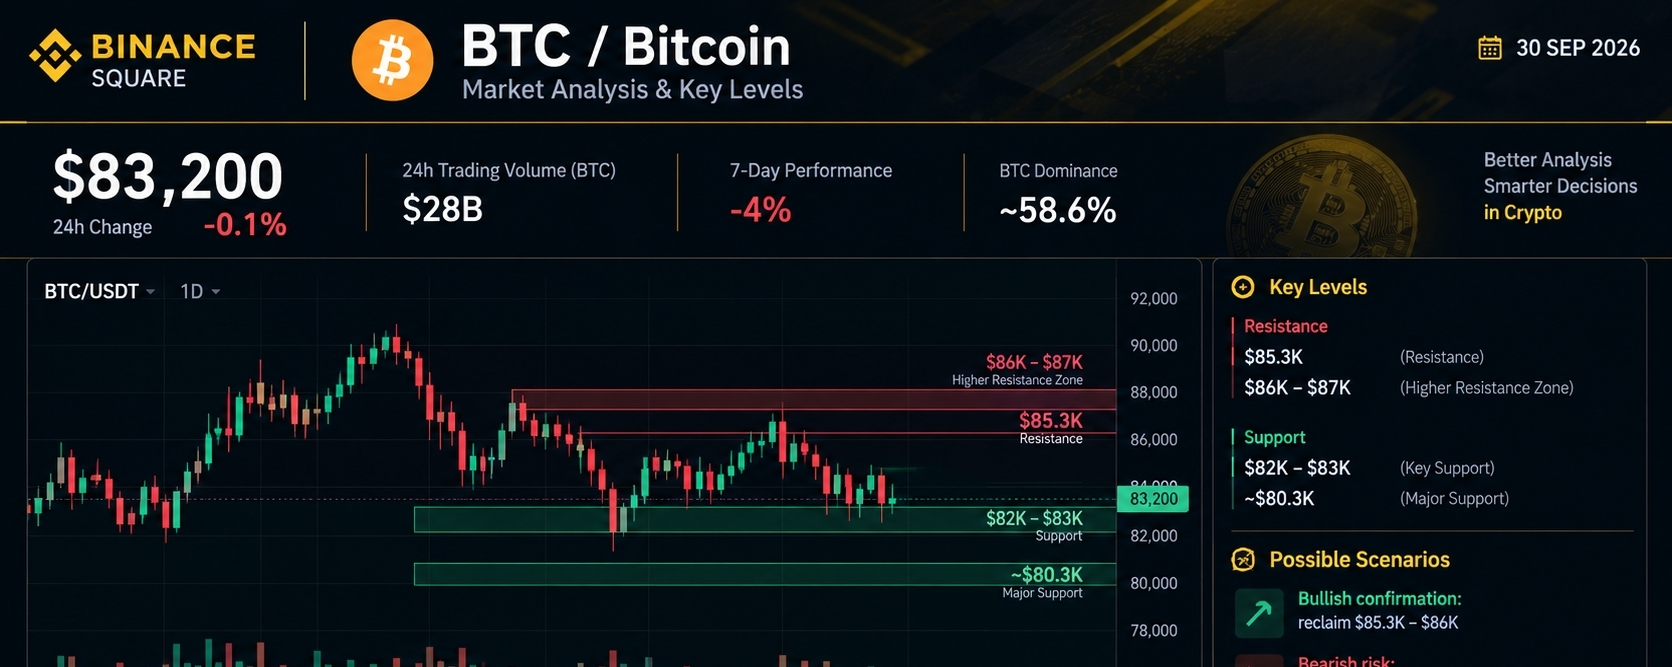
₿ BTC: ~$83.2K | 24h: ~−0.1%
Volume: ~$28B | BTC Dominance: ~58.6%
Key levels
- Support: $82K–$83K
- Major support: ~$80.3K
- Resistance: $85.3K
- Higher resistance: $86K–$87K
🟢 Reclaiming $85.3K–$86K with strong volume would strengthen the bullish setup.
🔴 Losing $82K could bring ~$80.3K back into focus.
I’m watching confirmation, volume, and price structure rather than chasing candles.
Educational market analysis only. Crypto is highly volatile and this is not financial advice.
Ibrahim Awwab
Crypto | Market Analysis | Trading Education
What level are you watching?
#btc70k
Bitcoin Market Update — Sept. 30, 2026
₿ BTC: ~$83.2K | 24h: ~−0.1%
Volume: ~$28B | BTC Dominance: ~58.6%
Key levels
- Support: $82K–$83K
- Major support: ~$80.3K
- Resistance: $85.3K
- Higher resistance: $86K–$87K
🟢 Reclaiming $85.3K–$86K with strong volume would strengthen the bullish setup.
🔴 Losing $82K could bring ~$80.3K back into focus.
I’m watching confirmation, volume, and price structure rather than chasing candles.
Educational market analysis only. Crypto is highly volatile and this is not financial advice.
Ibrahim Awwab
Crypto | Market Analysis | Trading Education
What level are you watching?
#btc70k
₿ BTC: ~$83.2K | 24h: ~−0.1%
Volume: ~$28B | BTC Dominance: ~58.6%
Key levels
- Support: $82K–$83K
- Major support: ~$80.3K
- Resistance: $85.3K
- Higher resistance: $86K–$87K
🟢 Reclaiming $85.3K–$86K with strong volume would strengthen the bullish setup.
🔴 Losing $82K could bring ~$80.3K back into focus.
I’m watching confirmation, volume, and price structure rather than chasing candles.
Educational market analysis only. Crypto is highly volatile and this is not financial advice.
Ibrahim Awwab
Crypto | Market Analysis | Trading Education
What level are you watching?
#btc70k
59
記事
翻訳参照
Bitcoin Is Testing the Market’s Conviction BTC at ~$83.2KBitcoin Is Testing the Market’s Conviction $BTC at ~$83.2K
📊 Market snapshot — September 30, 2026
Bitcoin is trading around $83,200, with 24h trading volume near $28B. BTC is roughly flat over the last 24 hours but remains about 4% lower over the past 7 days.
The broader market is still relatively active, but recent price action shows that buyers have not yet fully reclaimed the highs seen earlier this month.
Technical view
BTC remains in a broader recovery structure, but the short-term chart is currently in a corrective phase.
What I’m watching:
Trend: Short-term consolidation/correction after the recent move toward the mid-$80Ks.
Momentum: Neutral-to-cautious while BTC remains below the recent highs.
Volume: BTC 24h volume is around $28B, with recent volume data showing reduced activity versus the previous day.
BTC dominance: CoinMarketCap currently shows BTC dominance around 58.6%, keeping Bitcoin’s relative market share elevated.
Market breadth: Major altcoins are moving with BTC, so I’m watching whether strength eventually rotates from BTC into higher-beta assets.
Key levels
Resistance
$85.3K — immediate resistance area
$86K–$87K — recent high/resistance zone
Support
$82K–$83K — current price area
~$80.3K — more important downside support identified by recent technical analysis
Two scenarios I’m watching
Bullish scenario:
BTC reclaims the $85K–$86K area with stronger spot volume and holds above it on a daily closing basis. That would provide clearer confirmation that buyers are regaining control.
Bearish scenario:
BTC continues rejecting the mid-$80Ks and loses the $82K area, increasing the probability of another test toward the $80K region.
For me, the important point is confirmation. I would rather watch price establish a level than chase a large candle after it has already moved.
Trader’s perspective:
Markets rarely reward impatience consistently. Price action, volume and invalidation levels matter more than a prediction.
⚠️ Risk reminder: Crypto is highly volatile. This post is for educational and market-analysis purposes only and is not financial advice or a guarantee of future performance. Always manage risk according to your own circumstances.
Ibrahim Awwab
Crypto | Market Analysis | Trading Education
What level are you watching most closely — $80K, $85K, or the $86K–$87K zone?
#Bitcoin #BTC #CryptoMarket #TechnicalAnalysis #TradingEducation #Altcoins #Web3 #crypto
Bitcoin Is Testing the Market’s Conviction BTC at ~$83.2K
Bitcoin Is Testing the Market’s Conviction $BTC at ~$83.2K
📊 Market snapshot — September 30, 2026
Bitcoin is trading around $83,200, with 24h trading volume near $28B. BTC is roughly flat over the last 24 hours but remains about 4% lower over the past 7 days.
The broader market is still relatively active, but recent price action shows that buyers have not yet fully reclaimed the highs seen earlier this month.
Technical view
BTC remains in a broader recovery structure, but the short-term chart is currently in a corrective phase.
What I’m watching:
Trend: Short-term consolidation/correction after the recent move toward the mid-$80Ks.
Momentum: Neutral-to-cautious while BTC remains below the recent highs.
Volume: BTC 24h volume is around $28B, with recent volume data showing reduced activity versus the previous day.
BTC dominance: CoinMarketCap currently shows BTC dominance around 58.6%, keeping Bitcoin’s relative market share elevated.
Market breadth: Major altcoins are moving with BTC, so I’m watching whether strength eventually rotates from BTC into higher-beta assets.
Key levels
Resistance
$85.3K — immediate resistance area
$86K–$87K — recent high/resistance zone
Support
$82K–$83K — current price area
~$80.3K — more important downside support identified by recent technical analysis
Two scenarios I’m watching
Bullish scenario:
BTC reclaims the $85K–$86K area with stronger spot volume and holds above it on a daily closing basis. That would provide clearer confirmation that buyers are regaining control.
Bearish scenario:
BTC continues rejecting the mid-$80Ks and loses the $82K area, increasing the probability of another test toward the $80K region.
For me, the important point is confirmation. I would rather watch price establish a level than chase a large candle after it has already moved.
Trader’s perspective:
Markets rarely reward impatience consistently. Price action, volume and invalidation levels matter more than a prediction.
⚠️ Risk reminder: Crypto is highly volatile. This post is for educational and market-analysis purposes only and is not financial advice or a guarantee of future performance. Always manage risk according to your own circumstances.
Ibrahim Awwab
Crypto | Market Analysis | Trading Education
What level are you watching most closely — $80K, $85K, or the $86K–$87K zone?
#Bitcoin #BTC #CryptoMarket #TechnicalAnalysis #TradingEducation #Altcoins #Web3 #crypto
📊 Market snapshot — September 30, 2026
Bitcoin is trading around $83,200, with 24h trading volume near $28B. BTC is roughly flat over the last 24 hours but remains about 4% lower over the past 7 days.
The broader market is still relatively active, but recent price action shows that buyers have not yet fully reclaimed the highs seen earlier this month.
Technical view
BTC remains in a broader recovery structure, but the short-term chart is currently in a corrective phase.
What I’m watching:
Trend: Short-term consolidation/correction after the recent move toward the mid-$80Ks.
Momentum: Neutral-to-cautious while BTC remains below the recent highs.
Volume: BTC 24h volume is around $28B, with recent volume data showing reduced activity versus the previous day.
BTC dominance: CoinMarketCap currently shows BTC dominance around 58.6%, keeping Bitcoin’s relative market share elevated.
Market breadth: Major altcoins are moving with BTC, so I’m watching whether strength eventually rotates from BTC into higher-beta assets.
Key levels
Resistance
$85.3K — immediate resistance area
$86K–$87K — recent high/resistance zone
Support
$82K–$83K — current price area
~$80.3K — more important downside support identified by recent technical analysis
Two scenarios I’m watching
Bullish scenario:
BTC reclaims the $85K–$86K area with stronger spot volume and holds above it on a daily closing basis. That would provide clearer confirmation that buyers are regaining control.
Bearish scenario:
BTC continues rejecting the mid-$80Ks and loses the $82K area, increasing the probability of another test toward the $80K region.
For me, the important point is confirmation. I would rather watch price establish a level than chase a large candle after it has already moved.
Trader’s perspective:
Markets rarely reward impatience consistently. Price action, volume and invalidation levels matter more than a prediction.
⚠️ Risk reminder: Crypto is highly volatile. This post is for educational and market-analysis purposes only and is not financial advice or a guarantee of future performance. Always manage risk according to your own circumstances.
Ibrahim Awwab
Crypto | Market Analysis | Trading Education
What level are you watching most closely — $80K, $85K, or the $86K–$87K zone?
#Bitcoin #BTC #CryptoMarket #TechnicalAnalysis #TradingEducation #Altcoins #Web3 #crypto
65
🔥 今日動いているコイン — 9月30日
アルトコイン市場が面白くなってきています。
今日は注目されているいくつかのコイン:
• $CRV — 強い24時間モメンタム
• $HBAR — 注目の出来高 + 価格変動
• $ICP — 上方向に押し上げ
• $AAVE — 強いDeFiモメンタム
• $LINK — さらに注目を集め続けている
私はグリーンの足を追いかけません。出来高、構造、サポート/レジスタンス、そしてモメンタムが維持できるかを見ています。
1日で10〜20%動くコインは、同じくらい素早く反転することもあります。
本当の疑問は「どのコインが上がっているの?」ではありません。
「何がその値動きを動かしていて、それを維持できるのか?」です。
自分で調べてください。感情ではなく計画でトレードを。
あなたは今日、どのコインを見ていますか?
#crypto #Altcoins #Bitcoin #BinanceSquareFamily Square #cryptouniverseofficial V #HBAR #ICP #AAVE #LINK #CryptoTrading #CryptoMarket
🔥 今日動いているコイン — 9月30日
アルトコイン市場が面白くなってきています。
今日は注目されているいくつかのコイン:
• $CRV — 強い24時間モメンタム
• $HBAR — 注目の出来高 + 価格変動
• $ICP — 上方向に押し上げ
• $AAVE — 強いDeFiモメンタム
• $LINK — さらに注目を集め続けている
私はグリーンの足を追いかけません。出来高、構造、サポート/レジスタンス、そしてモメンタムが維持できるかを見ています。
1日で10〜20%動くコインは、同じくらい素早く反転することもあります。
本当の疑問は「どのコインが上がっているの?」ではありません。
「何がその値動きを動かしていて、それを維持できるのか?」です。
自分で調べてください。感情ではなく計画でトレードを。
あなたは今日、どのコインを見ていますか?
#crypto #Altcoins #Bitcoin #BinanceSquareFamily Square #cryptouniverseofficial V #HBAR #ICP #AAVE #LINK #CryptoTrading #CryptoMarket
アルトコイン市場が面白くなってきています。
今日は注目されているいくつかのコイン:
• $CRV — 強い24時間モメンタム
• $HBAR — 注目の出来高 + 価格変動
• $ICP — 上方向に押し上げ
• $AAVE — 強いDeFiモメンタム
• $LINK — さらに注目を集め続けている
私はグリーンの足を追いかけません。出来高、構造、サポート/レジスタンス、そしてモメンタムが維持できるかを見ています。
1日で10〜20%動くコインは、同じくらい素早く反転することもあります。
本当の疑問は「どのコインが上がっているの?」ではありません。
「何がその値動きを動かしていて、それを維持できるのか?」です。
自分で調べてください。感情ではなく計画でトレードを。
あなたは今日、どのコインを見ていますか?
#crypto #Altcoins #Bitcoin #BinanceSquareFamily Square #cryptouniverseofficial V #HBAR #ICP #AAVE #LINK #CryptoTrading #CryptoMarket

659
翻訳参照
I'm new user how to receive 100$ boun?
jelp me please
I'm new user how to receive 100$ boun?
jelp me please
jelp me please
6
21
ログインして、さらにコンテンツを読む
厳選トピックで世界の暗号資産トレーダーの仲間入り
⚡️ 暗号資産に関する最新かつ有益な情報が見つかります。
💬 世界最大の暗号資産取引所から信頼されています。
👍 認証を受けたクリエイターから、有益なインサイトを得られます。
メール / 電話番号
トレンドトピック
BitcoinClears$85200
閲覧回数 21
27人が討論中
#BitcoinClears$85200
ビットコインは85,200を回復し、米国の新たな経済指標を受けてより広範な市場が反応する中、BTCは85K付近で取引されています。
🎯 トレーダーが注目すべき理由:
85Kのゾーンは、出来高、流動性、モメンタムの確認のために今や重要な監視ポイントです。
📊 取引ウォッチ:
• BTC現物の出来高
• 85K–86Kの値動き
• OI + フィンディング
• ETFフロー
• BTCドミナンス
🔥 10Xの考え方:ブレイクアウトを追いかけないでください。ポジションを取る前に、価格+出来高の確認を見届けましょう。
$ARK $MOVR $QNT
Cheri Texiera O7ec
·いいね:0件
·閲覧回数 392
AltcoinSeasonIndexHoldsAbove60For5Days
閲覧回数 1,626
246人が討論中
BitcoinSlipsBelow$84000
閲覧回数 1,080
63人が討論中