

iamcryptoprince
107 投稿

iamcryptoprince
報告
ユーザーをブロック
Let's trade
取引を発注
高頻度トレーダー
4.6か月
0 フォロー
12 フォロワー
24 いいね
投稿
ポートフォリオ
すべて
引用
動画
こういう考え方のせいで、私は2300ドルも失いました。
#iamcryptoprince
こういう考え方のせいで、私は2300ドルも失いました。
#iamcryptoprince
#iamcryptoprince

HK1535
·
--
価格が下がっても上がっても、私は死ぬまでLUNCを買い続けます。
どん底か、最高潮か。
永遠に #lunc
どん底か、最高潮か。
永遠に #lunc
65
72
Binance Squareは2、3年前はこんな感じじゃなかった。今は、安い名声を得るために写真を投稿する女の子がほとんど。Binance Squareは以前は取引に焦点が当たっていて、あれが本当に恋しい!
#iamcryptoprince
Binance Squareは2、3年前はこんな感じじゃなかった。今は、安い名声を得るために写真を投稿する女の子がほとんど。Binance Squareは以前は取引に焦点が当たっていて、あれが本当に恋しい!
#iamcryptoprince
#iamcryptoprince
47
みなさん2万持ってるのに、それでも安全に取引できないの?
みなさん2万持ってるのに、それでも安全に取引できないの?

Scalper IR
·
--
3年後に戻ってきます。私たちと一緒にいてください!いつでも連絡してくれれば、喜んでご相談に乗ります。今はただ休みたいだけなんです。さようなら、クリプト……
40
Zecはルナを思い出させる。15ドルから1500ドルまで、ありえない。
#iamcryptoprince
Zecはルナを思い出させる。15ドルから1500ドルまで、ありえない。
#iamcryptoprince
#iamcryptoprince
170
·
--
ブリッシュ
ソルシグナル
サポート:100〜102
レジスタンス:110
次のレジスタンス:114〜115
買い=102.25〜103.50
売り=110.20
$SOL が111をブレイクしたら、次のレジスタンスに応じて売り。
#iamcryptoprince
{spot}(SOLUSDT)
ソルシグナル
サポート:100〜102
レジスタンス:110
次のレジスタンス:114〜115
買い=102.25〜103.50
売り=110.20
$SOL が111をブレイクしたら、次のレジスタンスに応じて売り。
#iamcryptoprince
サポート:100〜102
レジスタンス:110
次のレジスタンス:114〜115
買い=102.25〜103.50
売り=110.20
$SOL が111をブレイクしたら、次のレジスタンスに応じて売り。
#iamcryptoprince
84
·
--
弱気相場
Solの更新
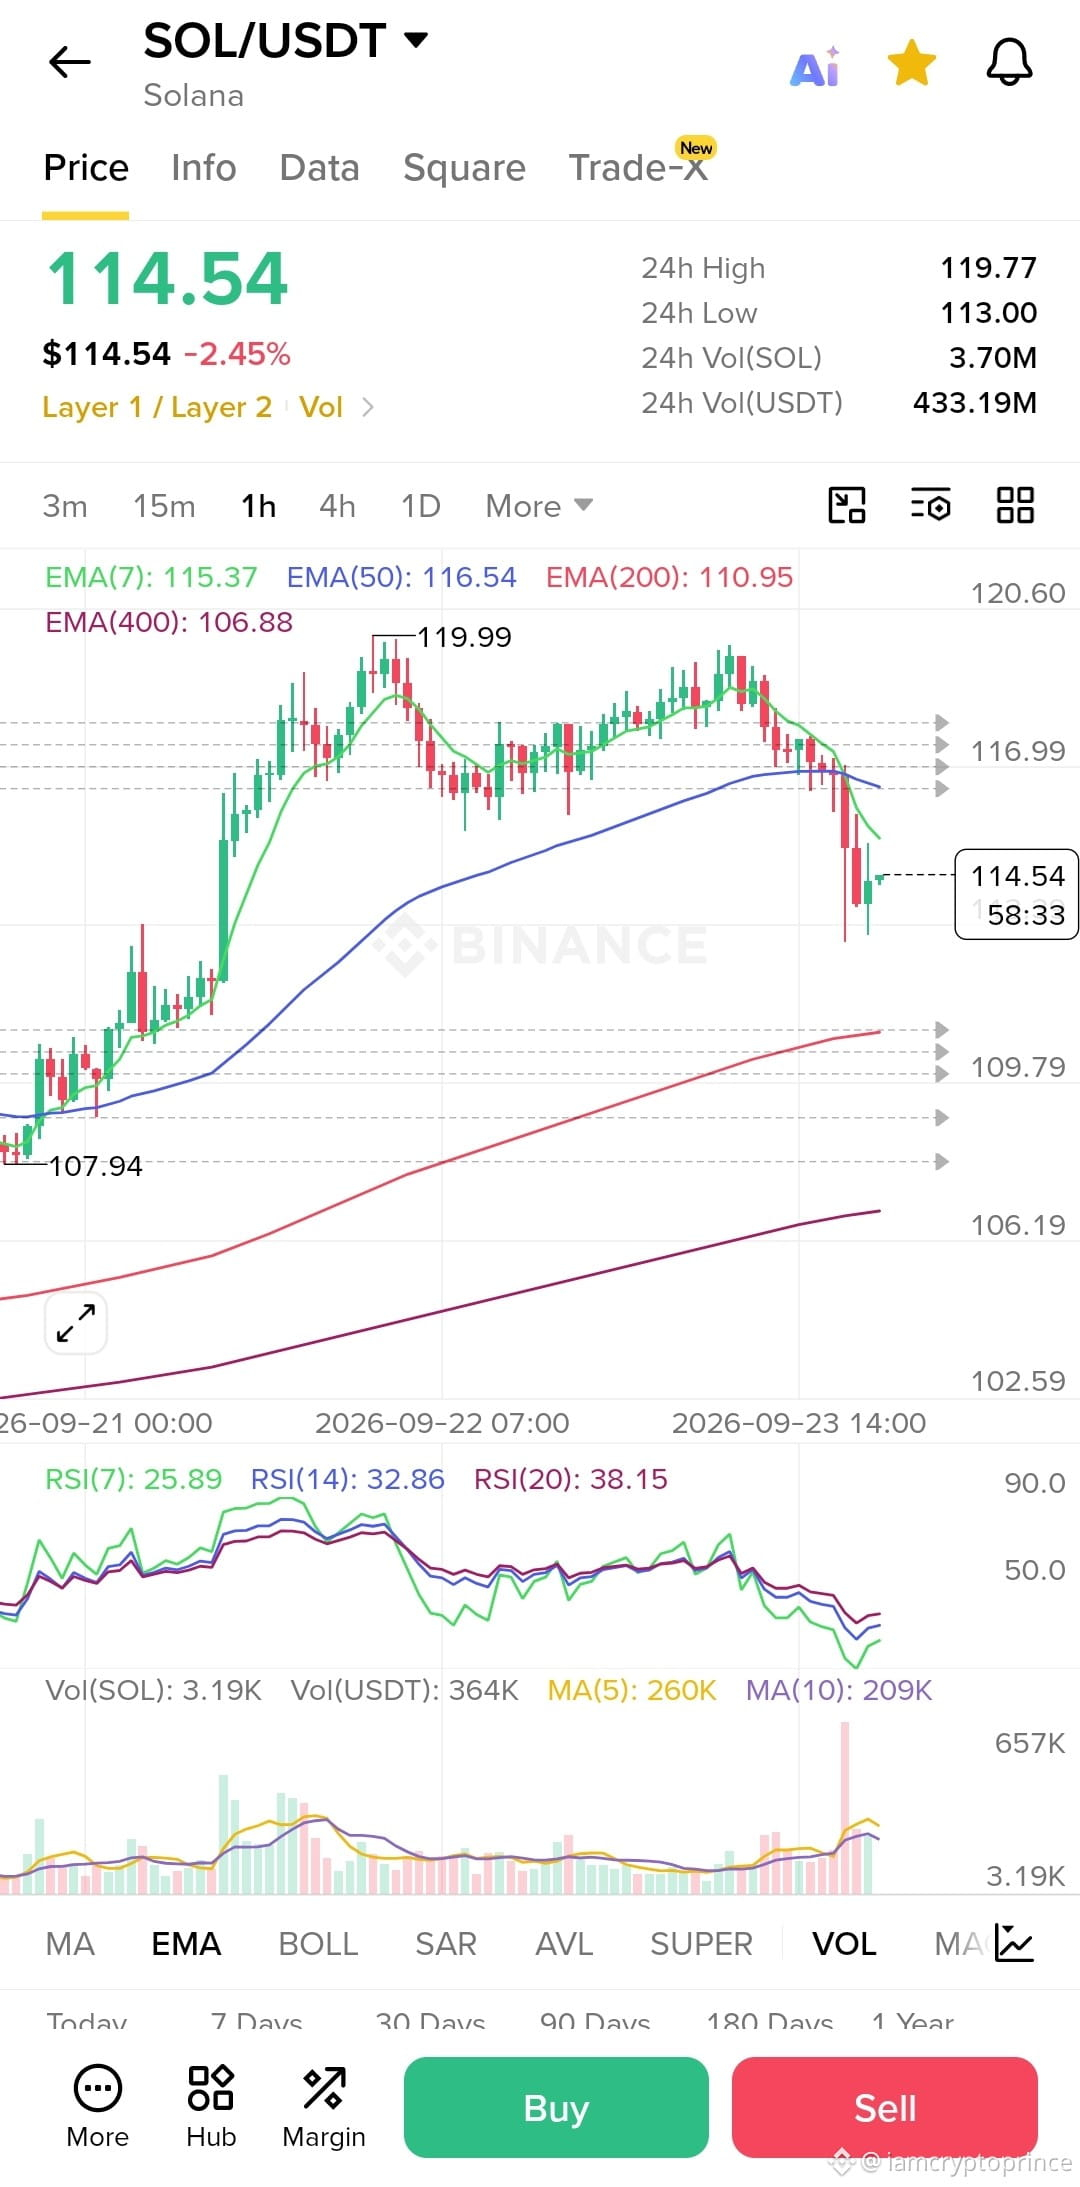
SOLは依然として96.38周辺で弱さを示しています。
サポート=95.30および93.64
レジスタンス=97.25、その後98.74、その後103.08
現時点では93.60を待っています。現在の価格を追いかけるよりも、より強い押し目で買うか、確認を伴ってSOLが$97.25を取り戻すまで待ちたいです。焦ってエントリーするよりも忍耐のほうが良いです。
#iamcryptoprince
Solの更新
SOLは依然として96.38周辺で弱さを示しています。
サポート=95.30および93.64
レジスタンス=97.25、その後98.74、その後103.08
現時点では93.60を待っています。現在の価格を追いかけるよりも、より強い押し目で買うか、確認を伴ってSOLが$97.25を取り戻すまで待ちたいです。焦ってエントリーするよりも忍耐のほうが良いです。
#iamcryptoprince
SOLは依然として96.38周辺で弱さを示しています。
サポート=95.30および93.64
レジスタンス=97.25、その後98.74、その後103.08
現時点では93.60を待っています。現在の価格を追いかけるよりも、より強い押し目で買うか、確認を伴ってSOLが$97.25を取り戻すまで待ちたいです。焦ってエントリーするよりも忍耐のほうが良いです。
#iamcryptoprince
62
·
--
弱気相場
ビットコイン・アップデート
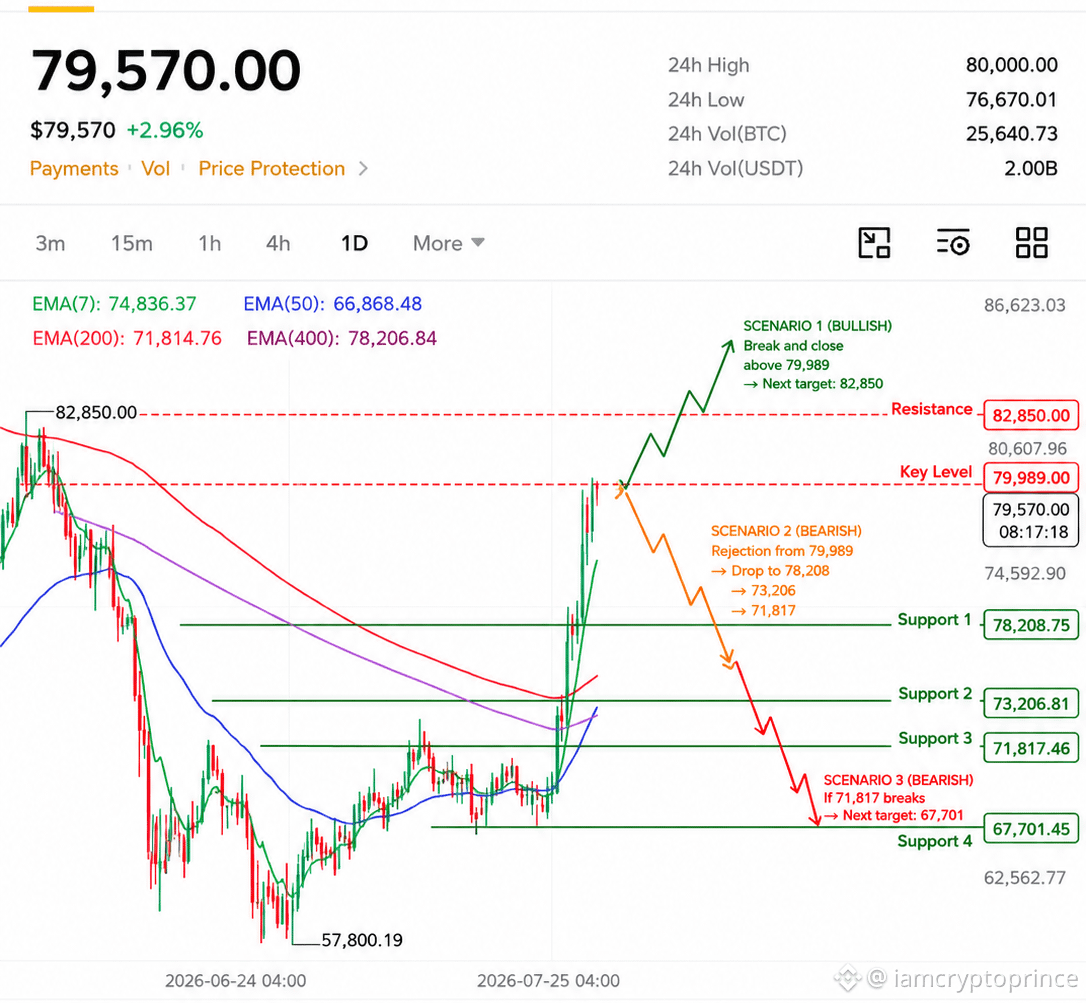
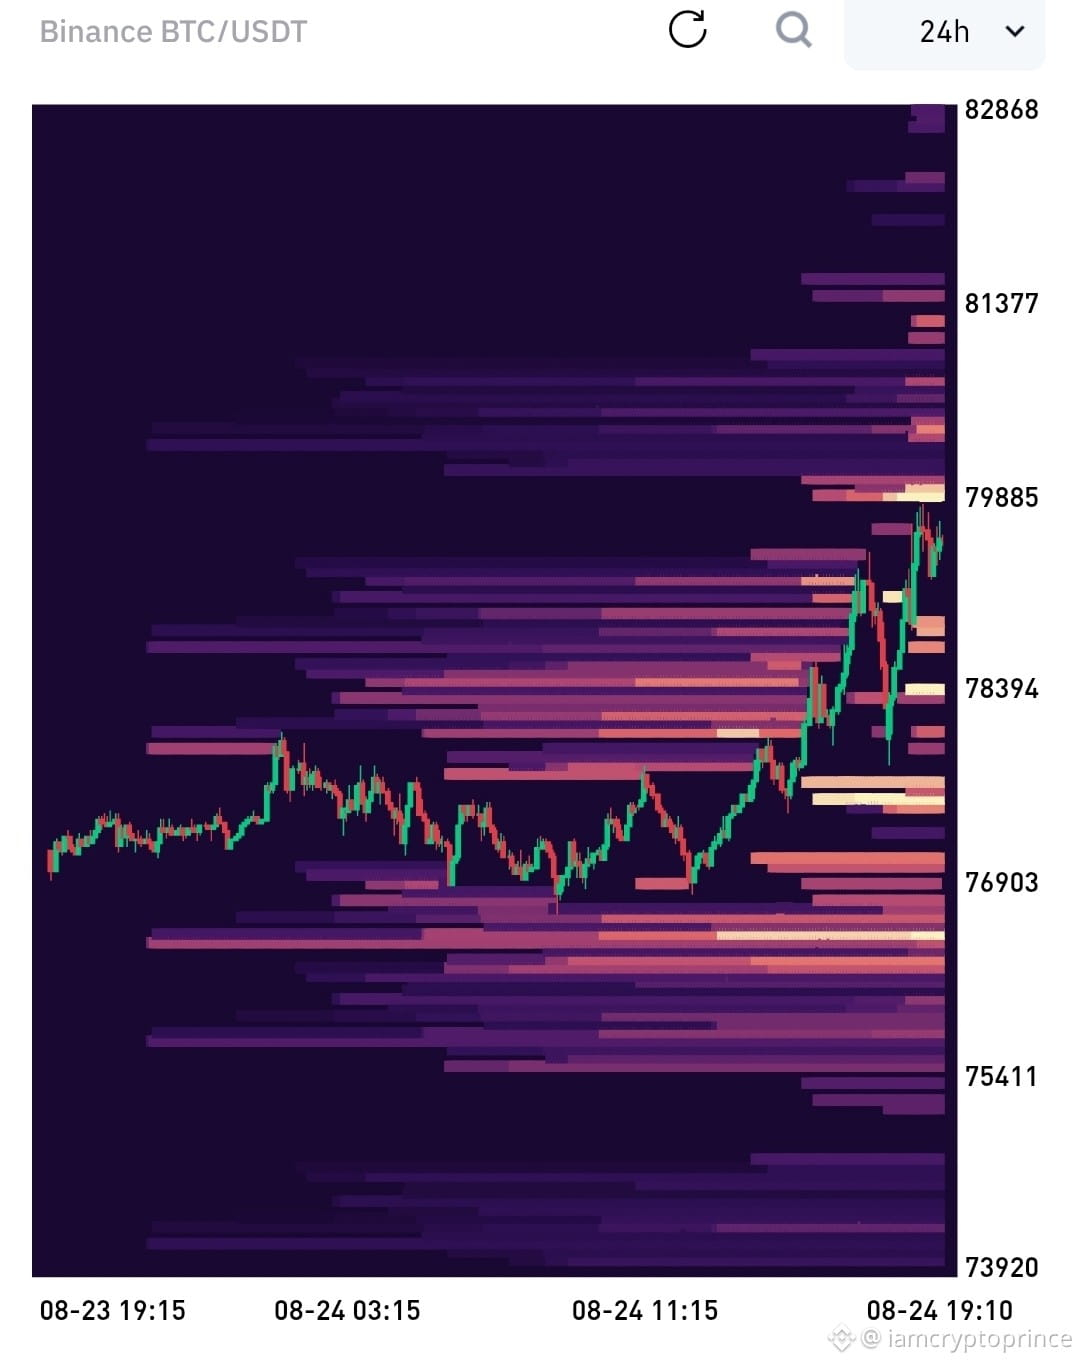
BTCは約79570で、今週のBTC価格の急騰はあまりにも素早く、簡単にブルトラップと見なせます。そのため
レジスタンス:80000 → 82850
サポート:78208 → 73206 → 71817 → 67701
もし$BTC が80000を突破してその上を維持するなら、次は82850が目標になります。しかし、ここで拒否(反落)される場合、最初のより深い調整でBTCは73206や71817へ向かう可能性があり、さらに71817もブレイクした場合、67701が次の主要サポートになります。
80000〜82850付近の反応は、次の動きにとって非常に重要です。
#iamcryptoprince
ビットコイン・アップデート
BTCは約79570で、今週のBTC価格の急騰はあまりにも素早く、簡単にブルトラップと見なせます。そのため
レジスタンス:80000 → 82850
サポート:78208 → 73206 → 71817 → 67701
もし$BTC が80000を突破してその上を維持するなら、次は82850が目標になります。しかし、ここで拒否(反落)される場合、最初のより深い調整でBTCは73206や71817へ向かう可能性があり、さらに71817もブレイクした場合、67701が次の主要サポートになります。
80000〜82850付近の反応は、次の動きにとって非常に重要です。
#iamcryptoprince
BTCは約79570で、今週のBTC価格の急騰はあまりにも素早く、簡単にブルトラップと見なせます。そのため
レジスタンス:80000 → 82850
サポート:78208 → 73206 → 71817 → 67701
もし$BTC が80000を突破してその上を維持するなら、次は82850が目標になります。しかし、ここで拒否(反落)される場合、最初のより深い調整でBTCは73206や71817へ向かう可能性があり、さらに71817もブレイクした場合、67701が次の主要サポートになります。
80000〜82850付近の反応は、次の動きにとって非常に重要です。
#iamcryptoprince
84
·
--
ブリッシュ
SOLの更新とシグナル
サポート = 90、その後 88〜89
レジスタンス = 95〜97、その後 100〜102
買い価格 = 89〜93
売り価格 = 97〜102(市場状況に応じて)
BTCが$75.5Kを上回って推移するなら、SOLはレジスタンスに向けて回復し、再び100を上回る可能性があります。BTCがそれを失うなら、$SOL は下方のサポートをテストするかもしれません。
トレンドは終わっていません。
#iamcryptoprince
SOLの更新とシグナル
サポート = 90、その後 88〜89
レジスタンス = 95〜97、その後 100〜102
買い価格 = 89〜93
売り価格 = 97〜102(市場状況に応じて)
BTCが$75.5Kを上回って推移するなら、SOLはレジスタンスに向けて回復し、再び100を上回る可能性があります。BTCがそれを失うなら、$SOL は下方のサポートをテストするかもしれません。
トレンドは終わっていません。
#iamcryptoprince
サポート = 90、その後 88〜89
レジスタンス = 95〜97、その後 100〜102
買い価格 = 89〜93
売り価格 = 97〜102(市場状況に応じて)
BTCが$75.5Kを上回って推移するなら、SOLはレジスタンスに向けて回復し、再び100を上回る可能性があります。BTCがそれを失うなら、$SOL は下方のサポートをテストするかもしれません。
トレンドは終わっていません。
#iamcryptoprince
112
·
--
ブリッシュ
Bitcoin update
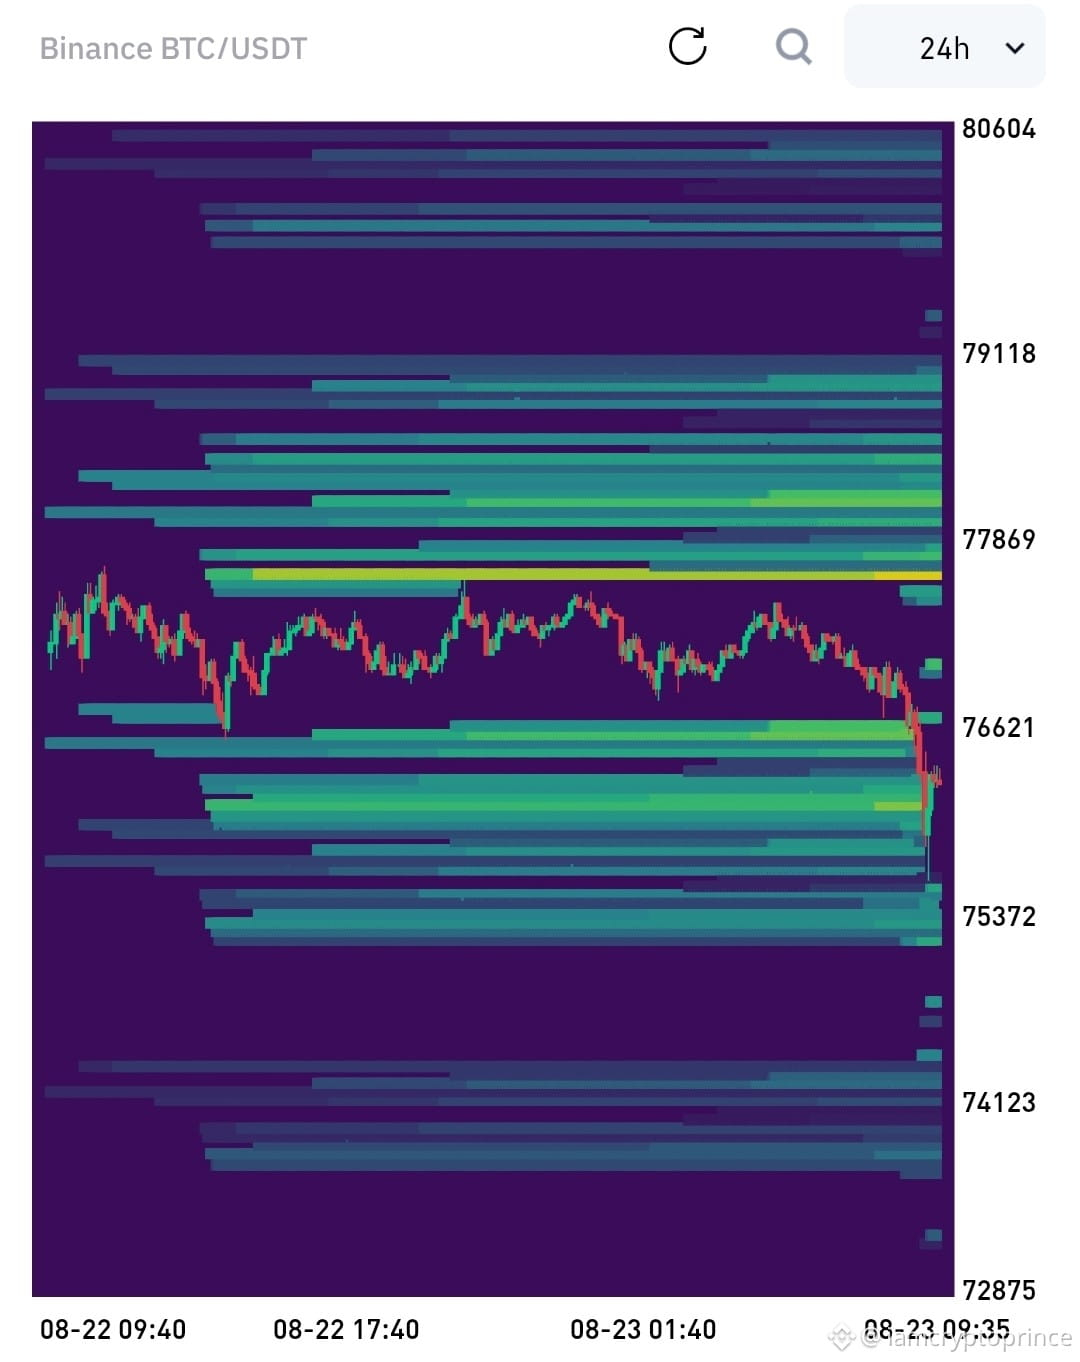
以前の投稿$BTC 75で想定していた通り、500の流動性が刈り取られ、btcは下げた後現在約76,200です。
次に:
75,500が維持されるなら=おそらく77,500 → 78,500へリバウンド
75,500が強く割れるなら=次の下値目標は約74,000 → 73,000
BTCが77,500を取り返すなら、79,000〜80,000の上側にある流動性がより大きな目標になります。
75.5Kのスイープは、完全なトレンド転換というよりは流動性の奪取(リクイディティ・グラブ)のように見えます。そして次の目標は77500だと思います。
#iamcryptoprince
Bitcoin update
以前の投稿$BTC 75で想定していた通り、500の流動性が刈り取られ、btcは下げた後現在約76,200です。
次に:
75,500が維持されるなら=おそらく77,500 → 78,500へリバウンド
75,500が強く割れるなら=次の下値目標は約74,000 → 73,000
BTCが77,500を取り返すなら、79,000〜80,000の上側にある流動性がより大きな目標になります。
75.5Kのスイープは、完全なトレンド転換というよりは流動性の奪取(リクイディティ・グラブ)のように見えます。そして次の目標は77500だと思います。
#iamcryptoprince
以前の投稿$BTC 75で想定していた通り、500の流動性が刈り取られ、btcは下げた後現在約76,200です。
次に:
75,500が維持されるなら=おそらく77,500 → 78,500へリバウンド
75,500が強く割れるなら=次の下値目標は約74,000 → 73,000
BTCが77,500を取り返すなら、79,000〜80,000の上側にある流動性がより大きな目標になります。
75.5Kのスイープは、完全なトレンド転換というよりは流動性の奪取(リクイディティ・グラブ)のように見えます。そして次の目標は77500だと思います。
#iamcryptoprince
94
·
--
弱気相場
ビットコインの最新情報
$BTC は過去5日間ほぼノンストップで上昇したため、この調整は予想されていました。ですが正直、まだ調整が浅いのではないかと感じています。
まずは76K〜75Kのエリアを見ています。ここを割り込むなら、次に重要なゾーンは73K〜74Kかもしれません。70K〜72Kに向けて下落するなら、より強いリセットになりそうです。
もしBTCが77K付近で踏みとどまり、すぐに79K〜80Kを上回ってくるなら、これは小さな一時停止だっただけの可能性があります。
個人的には、BTCにはきちんとした調整をして、安定した上で、ストレートに上がり続けるというよりは上昇を継続してほしいです。
#iamcryptoprince
ビットコインの最新情報
$BTC は過去5日間ほぼノンストップで上昇したため、この調整は予想されていました。ですが正直、まだ調整が浅いのではないかと感じています。
まずは76K〜75Kのエリアを見ています。ここを割り込むなら、次に重要なゾーンは73K〜74Kかもしれません。70K〜72Kに向けて下落するなら、より強いリセットになりそうです。
もしBTCが77K付近で踏みとどまり、すぐに79K〜80Kを上回ってくるなら、これは小さな一時停止だっただけの可能性があります。
個人的には、BTCにはきちんとした調整をして、安定した上で、ストレートに上がり続けるというよりは上昇を継続してほしいです。
#iamcryptoprince
$BTC は過去5日間ほぼノンストップで上昇したため、この調整は予想されていました。ですが正直、まだ調整が浅いのではないかと感じています。
まずは76K〜75Kのエリアを見ています。ここを割り込むなら、次に重要なゾーンは73K〜74Kかもしれません。70K〜72Kに向けて下落するなら、より強いリセットになりそうです。
もしBTCが77K付近で踏みとどまり、すぐに79K〜80Kを上回ってくるなら、これは小さな一時停止だっただけの可能性があります。
個人的には、BTCにはきちんとした調整をして、安定した上で、ストレートに上がり続けるというよりは上昇を継続してほしいです。
#iamcryptoprince
71
·
--
弱気相場
今週の大きな市場ニュース:
7月29日 – 米国のFOMC(米連邦準備制度)の利上げ(政策金利)決定。
7月30日 – 米国のインフレおよびGDPデータ。
7月31日 – 雇用および消費者信頼感データ。
今週は暗号資産(クリプト)で大きな値動きが起きる可能性があるため、これらの日付を念頭に置いて取引してください。#iamcryptoprince
今週の大きな市場ニュース:
7月29日 – 米国のFOMC(米連邦準備制度)の利上げ(政策金利)決定。
7月30日 – 米国のインフレおよびGDPデータ。
7月31日 – 雇用および消費者信頼感データ。
今週は暗号資産(クリプト)で大きな値動きが起きる可能性があるため、これらの日付を念頭に置いて取引してください。#iamcryptoprince
7月29日 – 米国のFOMC(米連邦準備制度)の利上げ(政策金利)決定。
7月30日 – 米国のインフレおよびGDPデータ。
7月31日 – 雇用および消費者信頼感データ。
今週は暗号資産(クリプト)で大きな値動きが起きる可能性があるため、これらの日付を念頭に置いて取引してください。#iamcryptoprince
78
ログインして、さらにコンテンツを読む
厳選トピックで世界の暗号資産トレーダーの仲間入り
⚡️ 暗号資産に関する最新かつ有益な情報が見つかります。
💬 世界最大の暗号資産取引所から信頼されています。
👍 認証を受けたクリエイターから、有益なインサイトを得られます。
メール / 電話番号