
HamzaJani 804
761 投稿

HamzaJani 804
報告
ユーザーをブロック
25 フォロー
4.1K+ フォロワー
837 いいね
投稿
翻訳参照
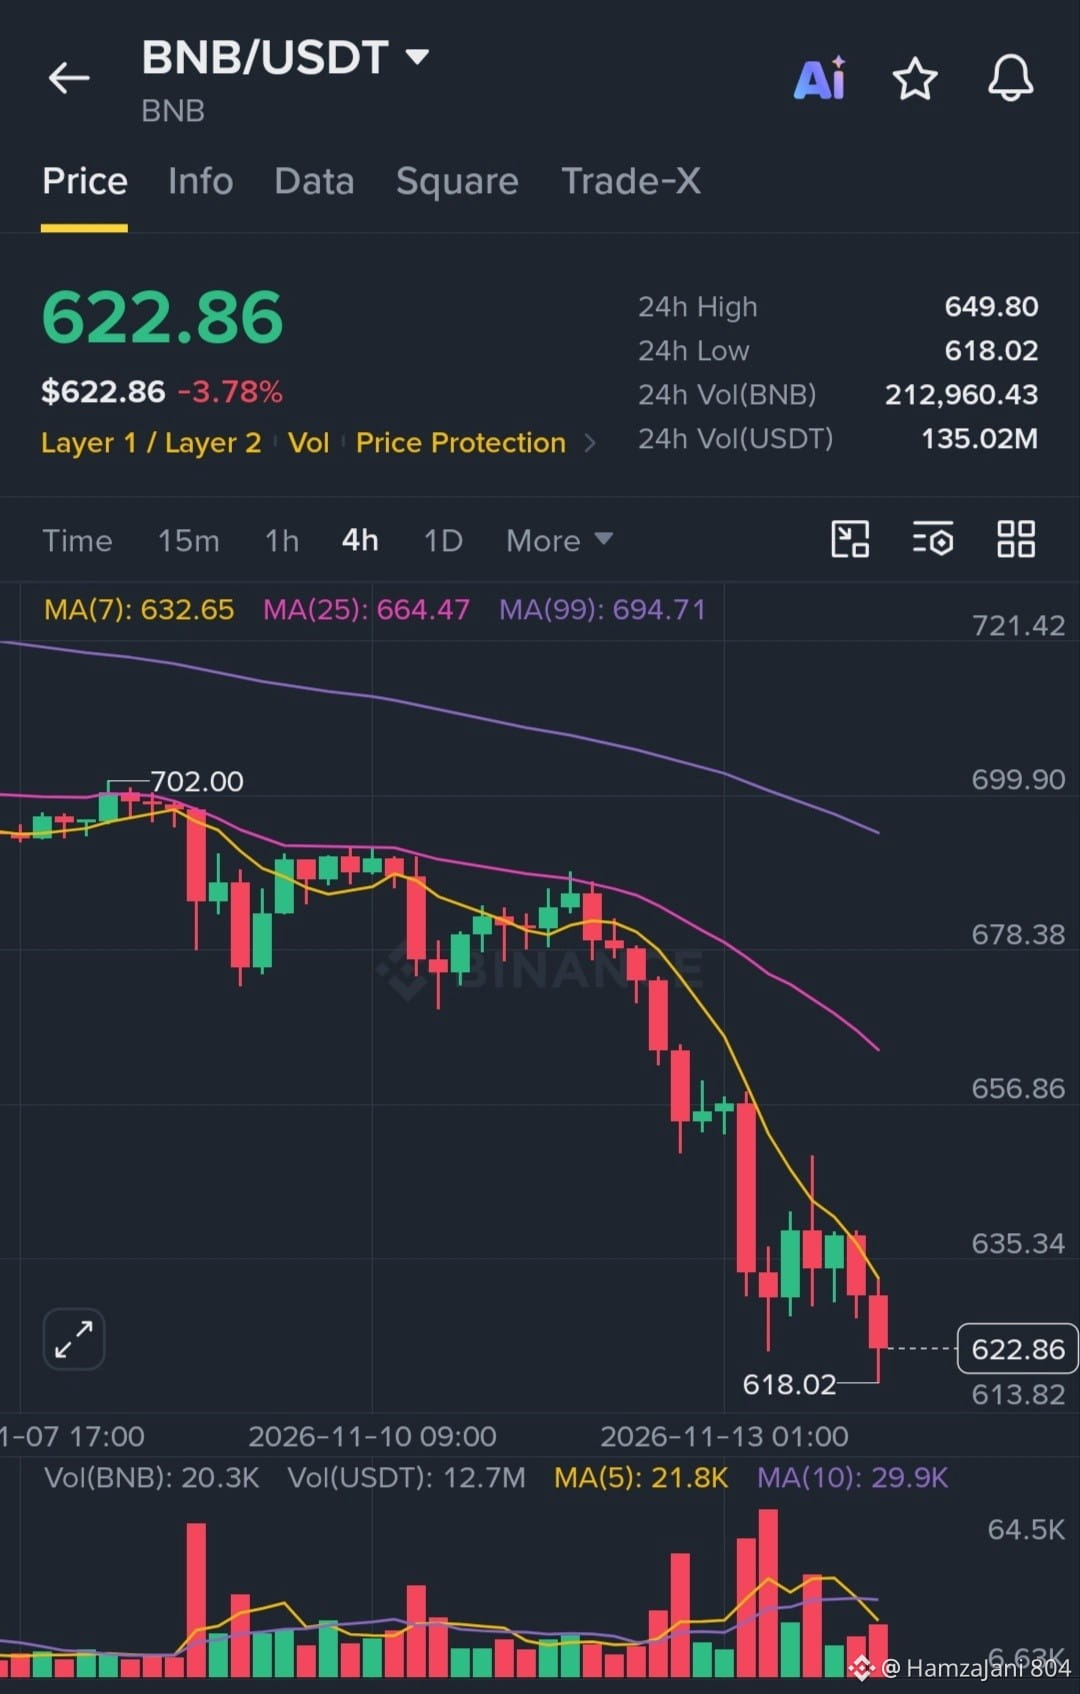
$BNB is currently trading at $622.86, down 3.78% over the past 24 hours. The chart shows a downward trend, moving from a 24-hour high of $649.80 down to a low of $618.02. With a 24-hour volume of 135.02M USDT, market activity remains significant as it hovers near its recent lows.
$BNB is currently trading at $622.86, down 3.78% over the past 24 hours. The chart shows a downward trend, moving from a 24-hour high of $649.80 down to a low of $618.02. With a 24-hour volume of 135.02M USDT, market activity remains significant as it hovers near its recent lows.
79
翻訳参照
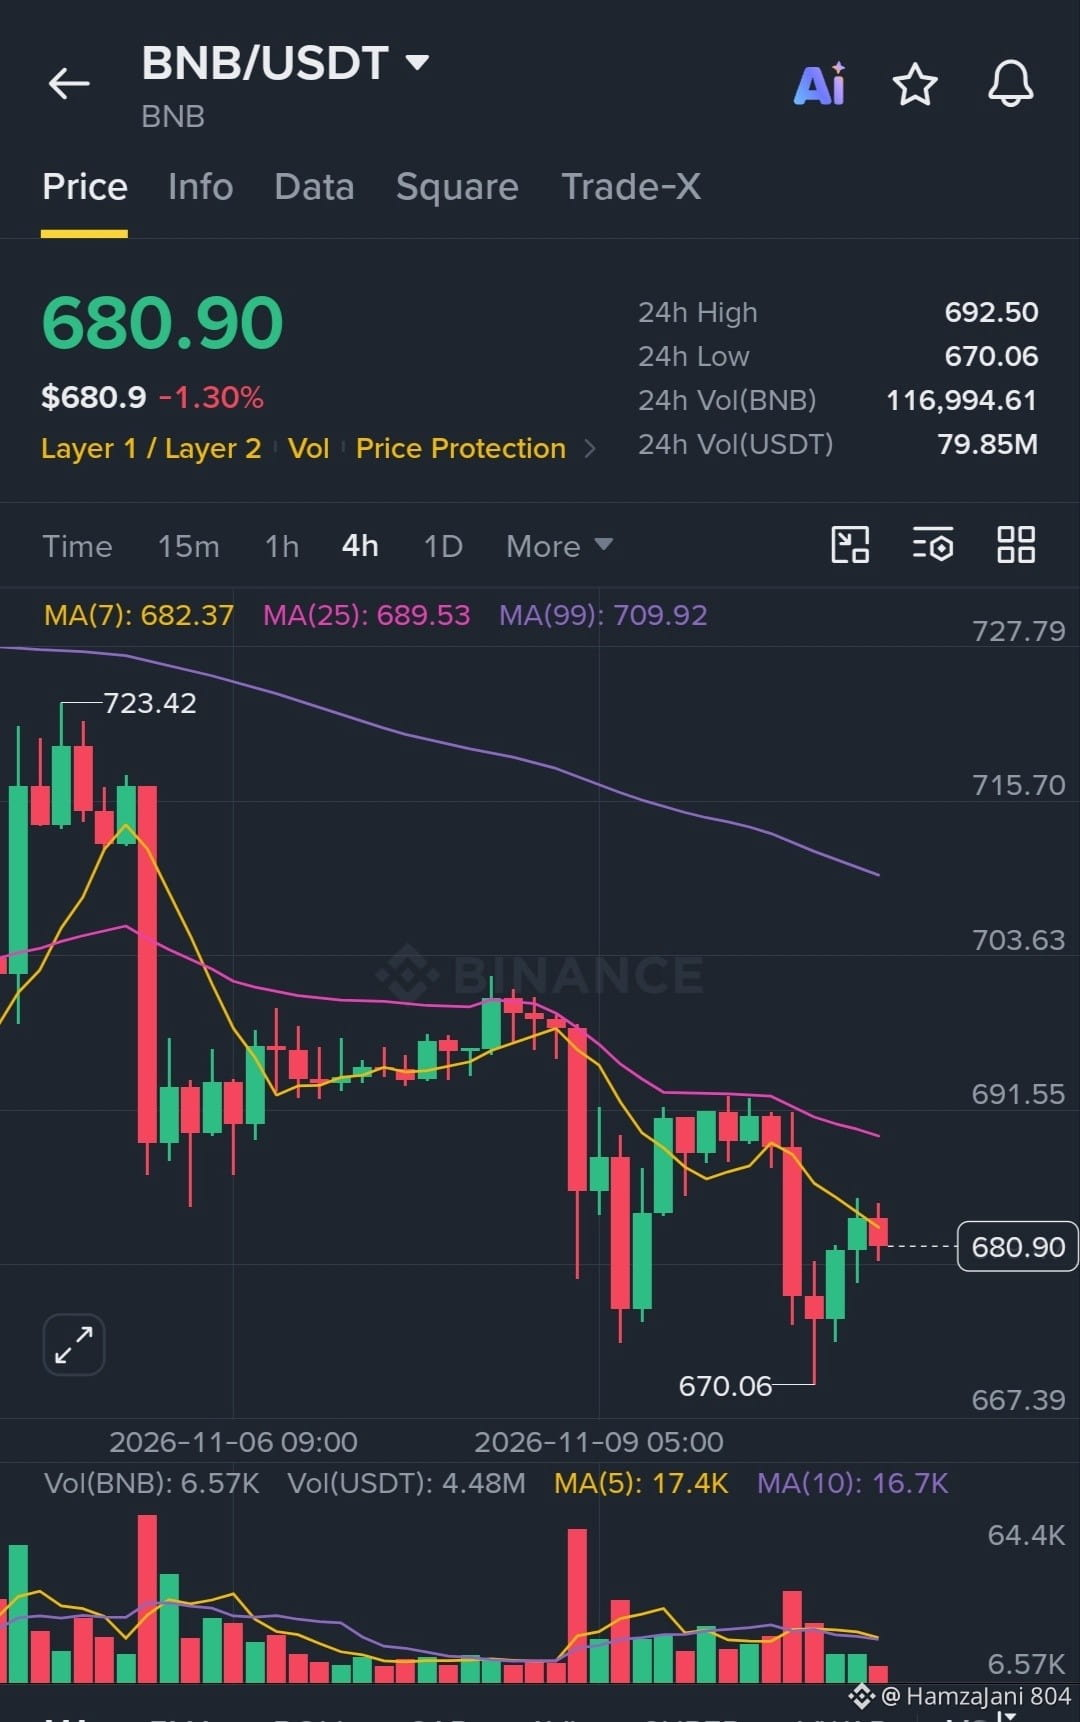
$BNB /USDT is currently trading at $680.90, reflecting a 1.30% decrease over the past 24 hours. The token reached a 24-hour high of $692.50 and a low of $670.06. Trading volume remains active, with 116,994.61 BNB and 79.85M USDT traded. Monitor key moving averages and support levels near $670 as market conditions continue to develop.
$BNB /USDT is currently trading at $680.90, reflecting a 1.30% decrease over the past 24 hours. The token reached a 24-hour high of $692.50 and a low of $670.06. Trading volume remains active, with 116,994.61 BNB and 79.85M USDT traded. Monitor key moving averages and support levels near $670 as market conditions continue to develop.
70
翻訳参照
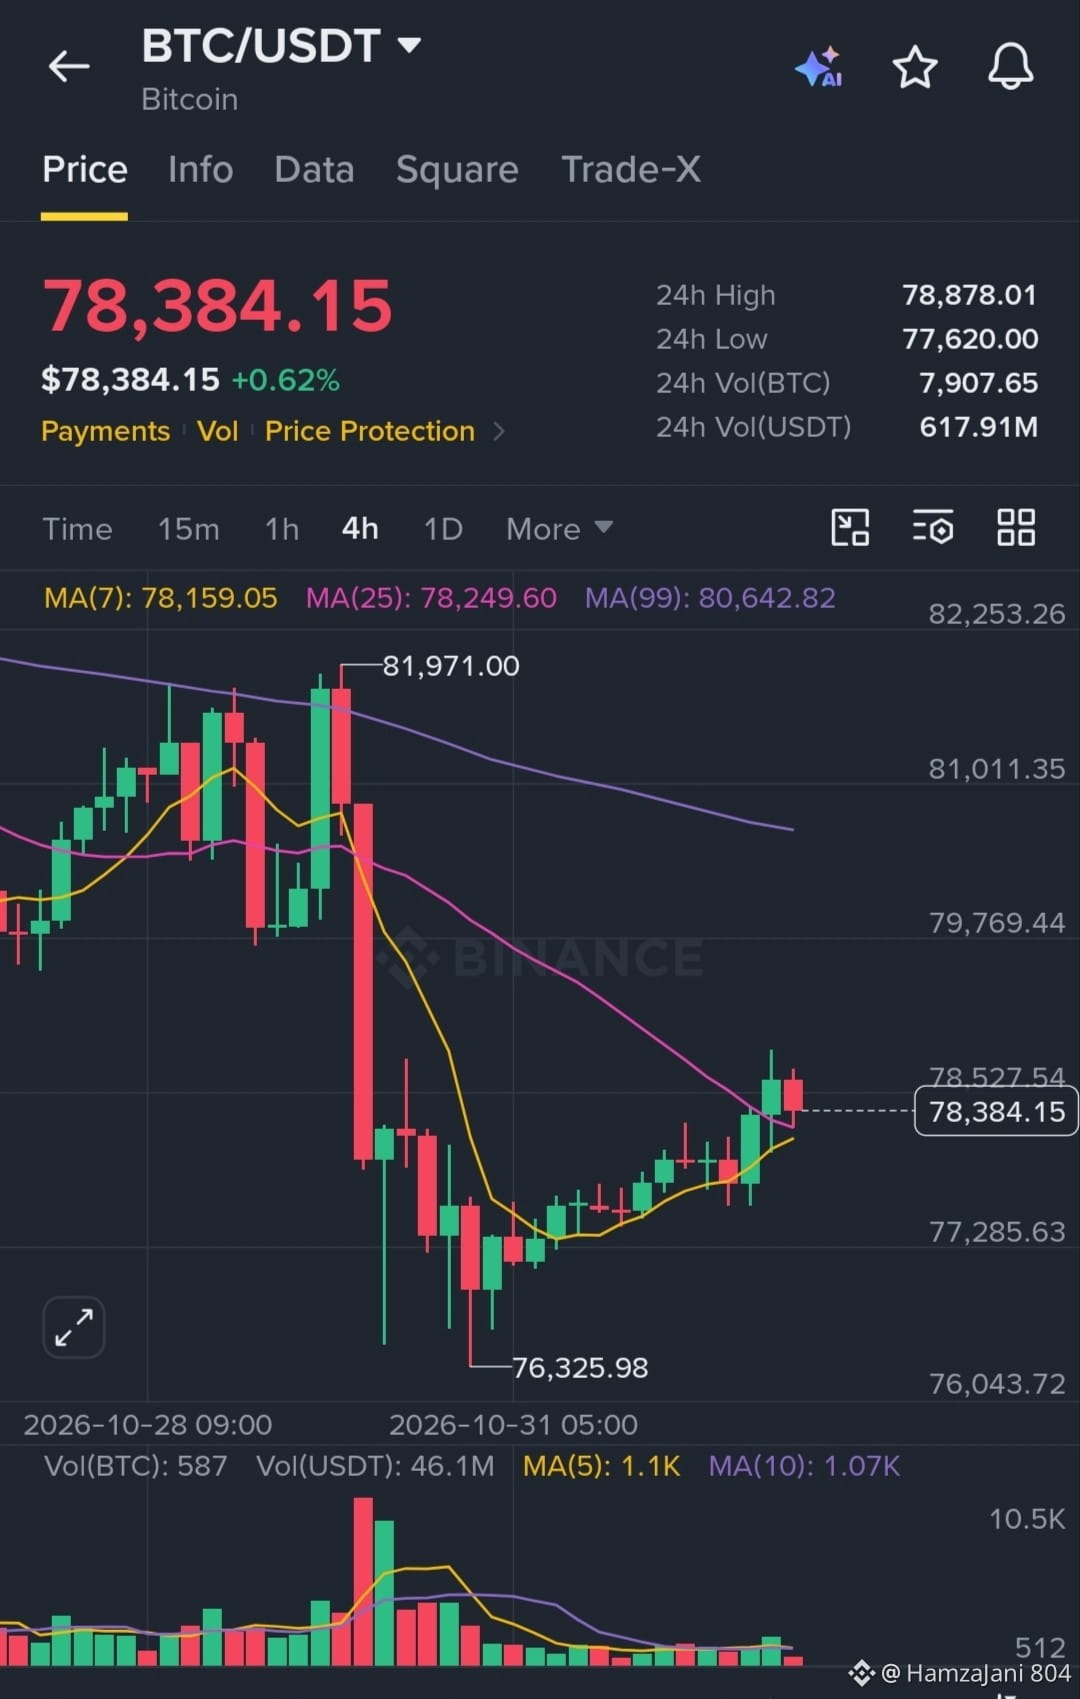
$BTC Bitcoin is currently trading at $78,384.15, showing a modest 24-hour gain of +0.62%. The chart shows a 24-hour high of $78,878.01 and a low of $77,620.00. After testing lows near the $76,325.98 mark, BTC is attempting a steady recovery. Keep a close eye on these moving averages and volume levels for the next breakout!
$BTC Bitcoin is currently trading at $78,384.15, showing a modest 24-hour gain of +0.62%. The chart shows a 24-hour high of $78,878.01 and a low of $77,620.00. After testing lows near the $76,325.98 mark, BTC is attempting a steady recovery. Keep a close eye on these moving averages and volume levels for the next breakout!
79
翻訳参照
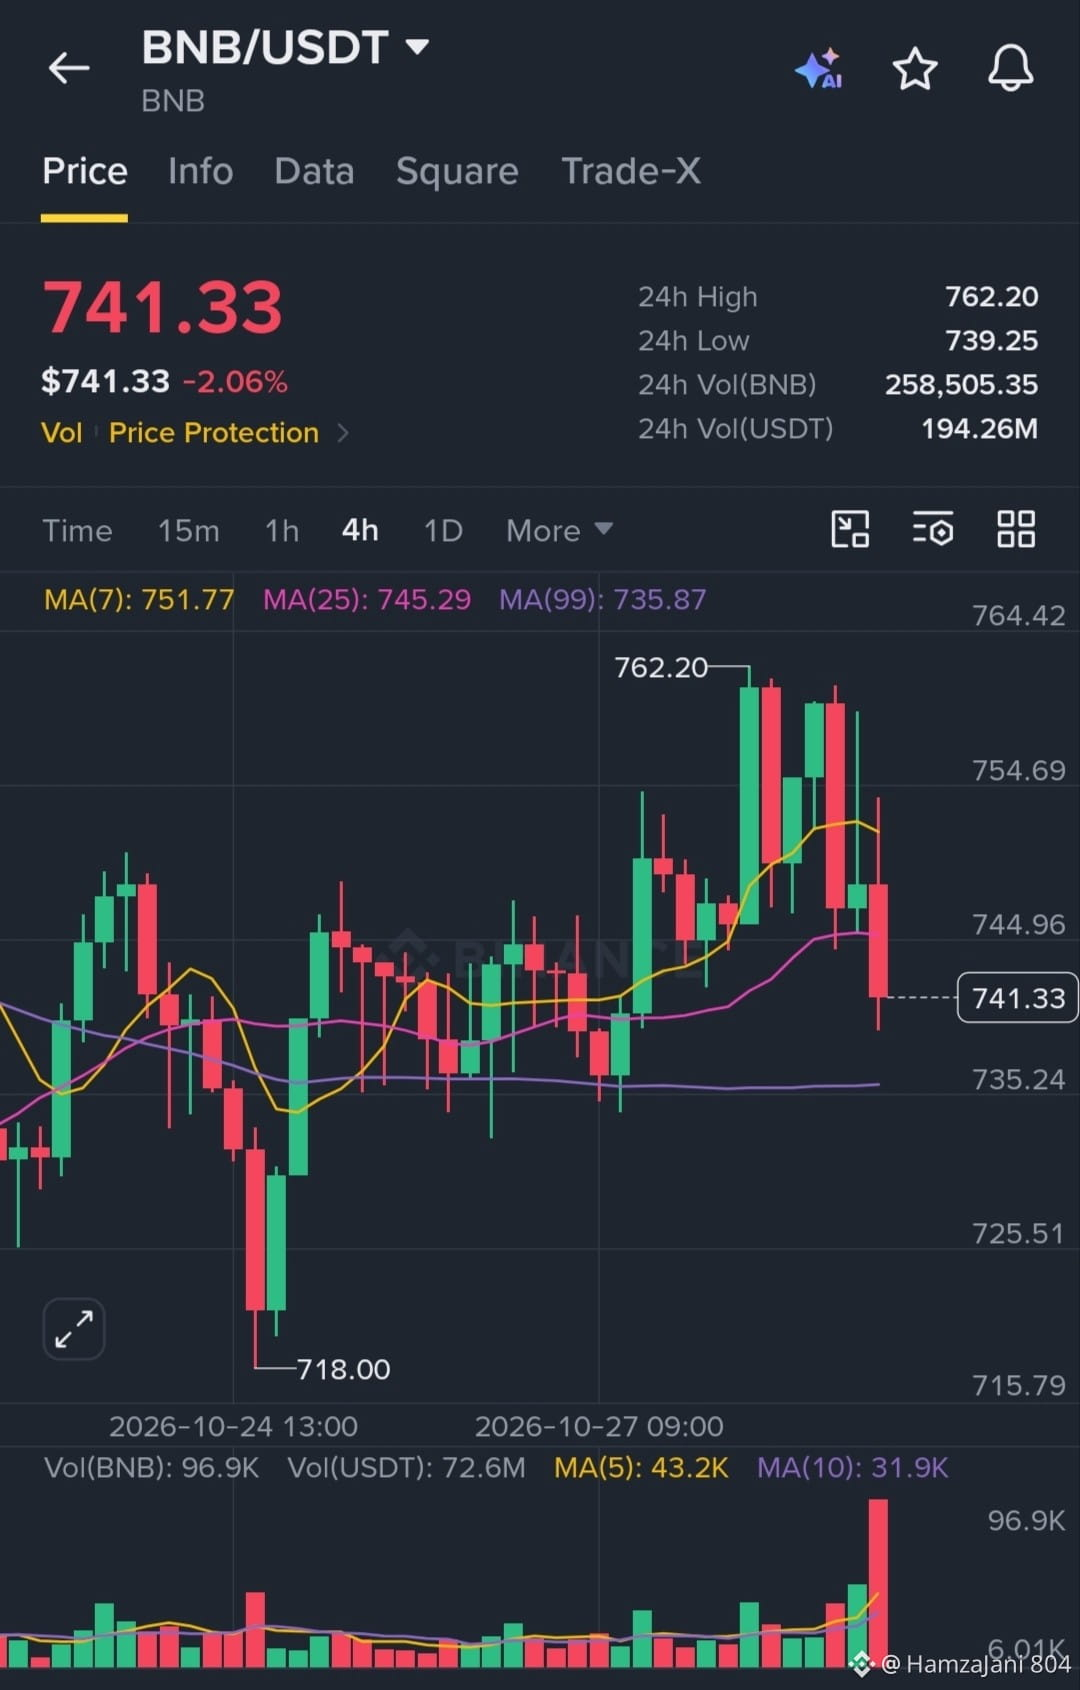
$BNB is currently trading at $741.33, down 2.06% over the last 24 hours. The price has fluctuated within a daily range between a high of $762.20 and a low of $739.25. With increasing short-term selling pressure and notable volume spikes on the chart, traders should closely monitor key support zones near the moving averages for potential trend reversals or further consolidation.
$BNB is currently trading at $741.33, down 2.06% over the last 24 hours. The price has fluctuated within a daily range between a high of $762.20 and a low of $739.25. With increasing short-term selling pressure and notable volume spikes on the chart, traders should closely monitor key support zones near the moving averages for potential trend reversals or further consolidation.
105
·
--
ブリッシュ
翻訳参照
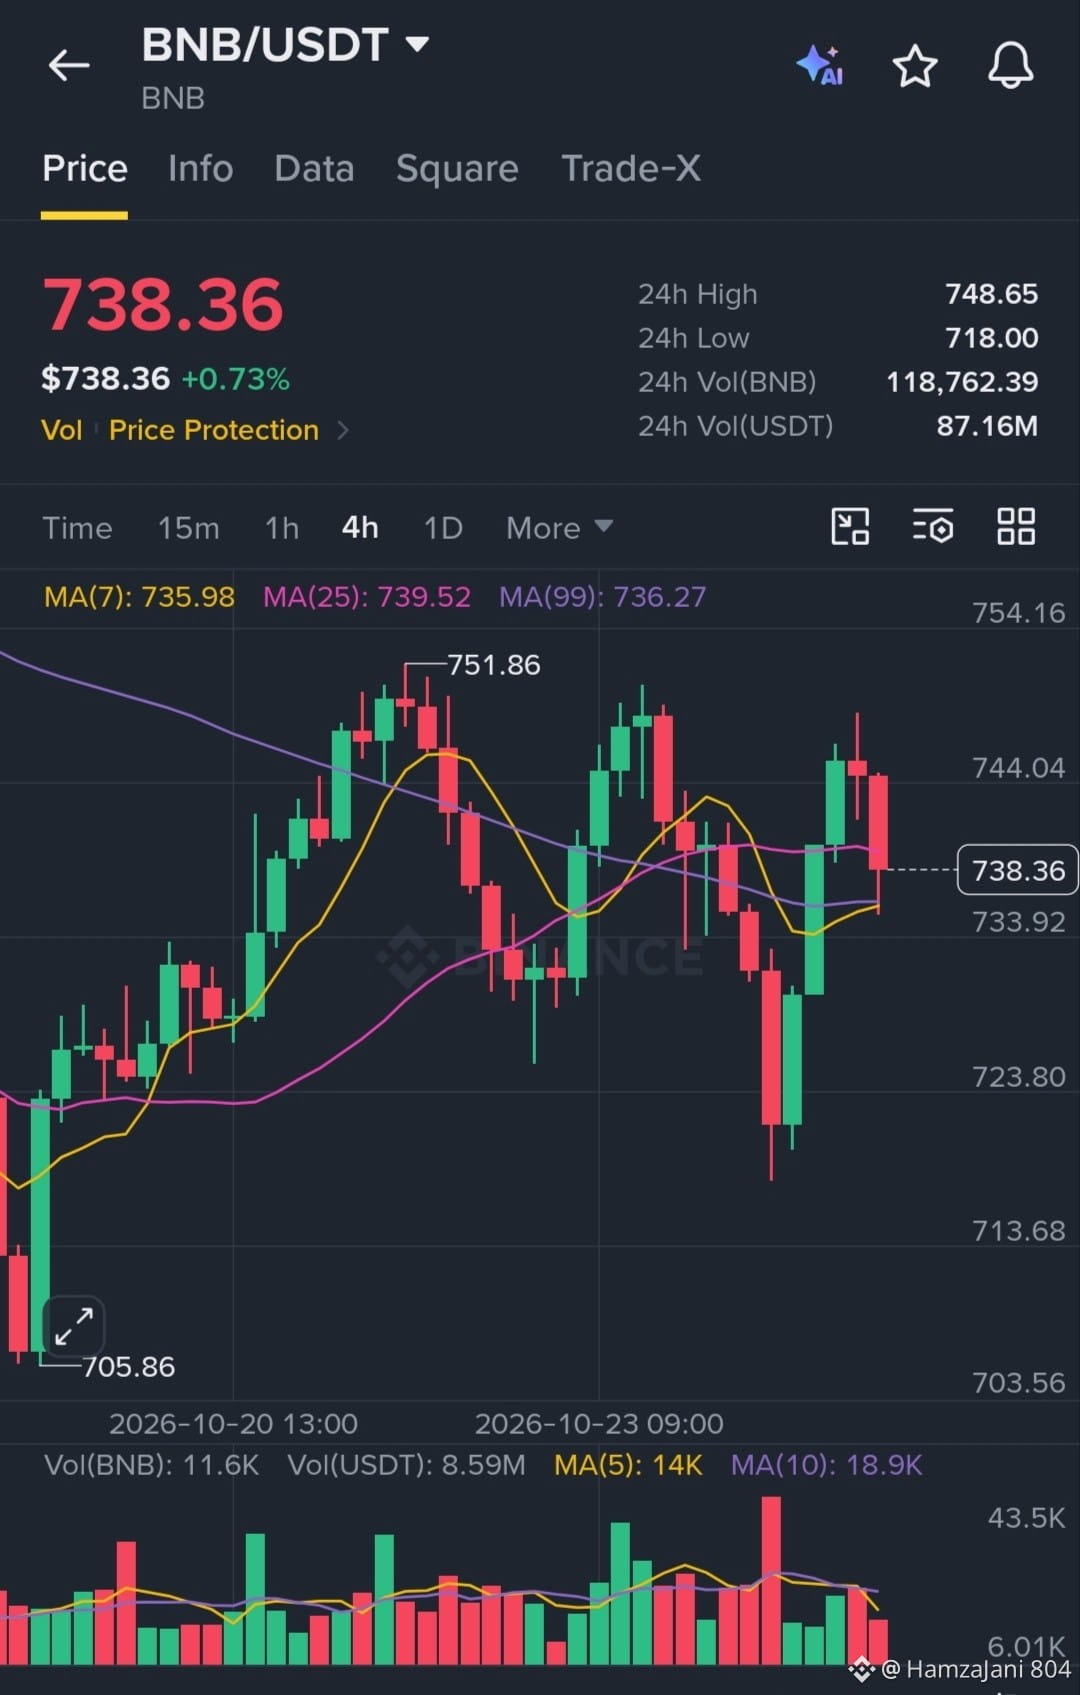
$BNB is currently trading at 738.36 USDT, showing a modest 24-hour gain of 0.73%. The asset has experienced a daily trading range between a low of 718.00 USDT and a high of 748.65 USDT. On the 4-hour chart, price action is consolidating near moving average levels, hovering between immediate support and resistance. Market participants should monitor upcoming momentum shifts closely.
$BNB is currently trading at 738.36 USDT, showing a modest 24-hour gain of 0.73%. The asset has experienced a daily trading range between a low of 718.00 USDT and a high of 748.65 USDT. On the 4-hour chart, price action is consolidating near moving average levels, hovering between immediate support and resistance. Market participants should monitor upcoming momentum shifts closely.
83
·
--
ブリッシュ
翻訳参照
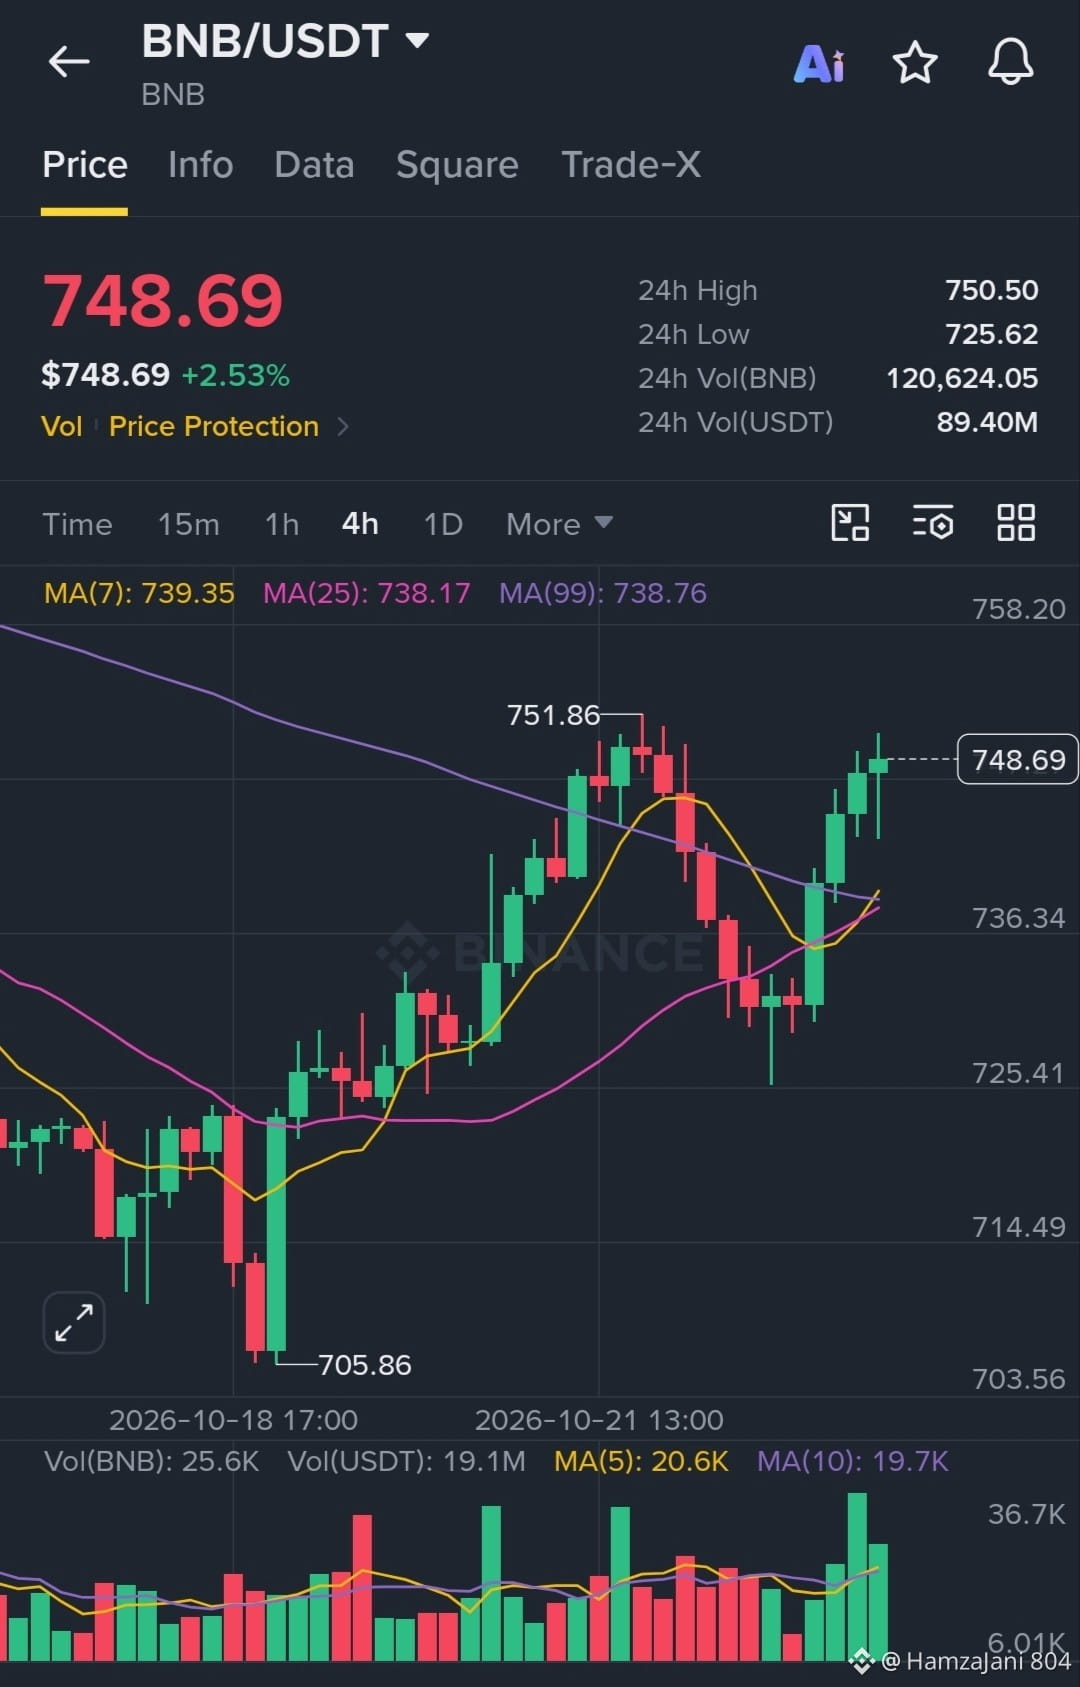
$BNB /USDT is showing strong bullish momentum, trading at $748.69 with a +2.53% daily gain. After testing a low of $705.86, price has broken back above key moving averages (MA7: 739.35, MA25: 738.17, MA99: 738.76). Buyers are pushing toward the $751.86 resistance level. Holding above $740 keeps the upward trend intact for a potential breakout.
$BNB /USDT is showing strong bullish momentum, trading at $748.69 with a +2.53% daily gain. After testing a low of $705.86, price has broken back above key moving averages (MA7: 739.35, MA25: 738.17, MA99: 738.76). Buyers are pushing toward the $751.86 resistance level. Holding above $740 keeps the upward trend intact for a potential breakout.
103
翻訳参照
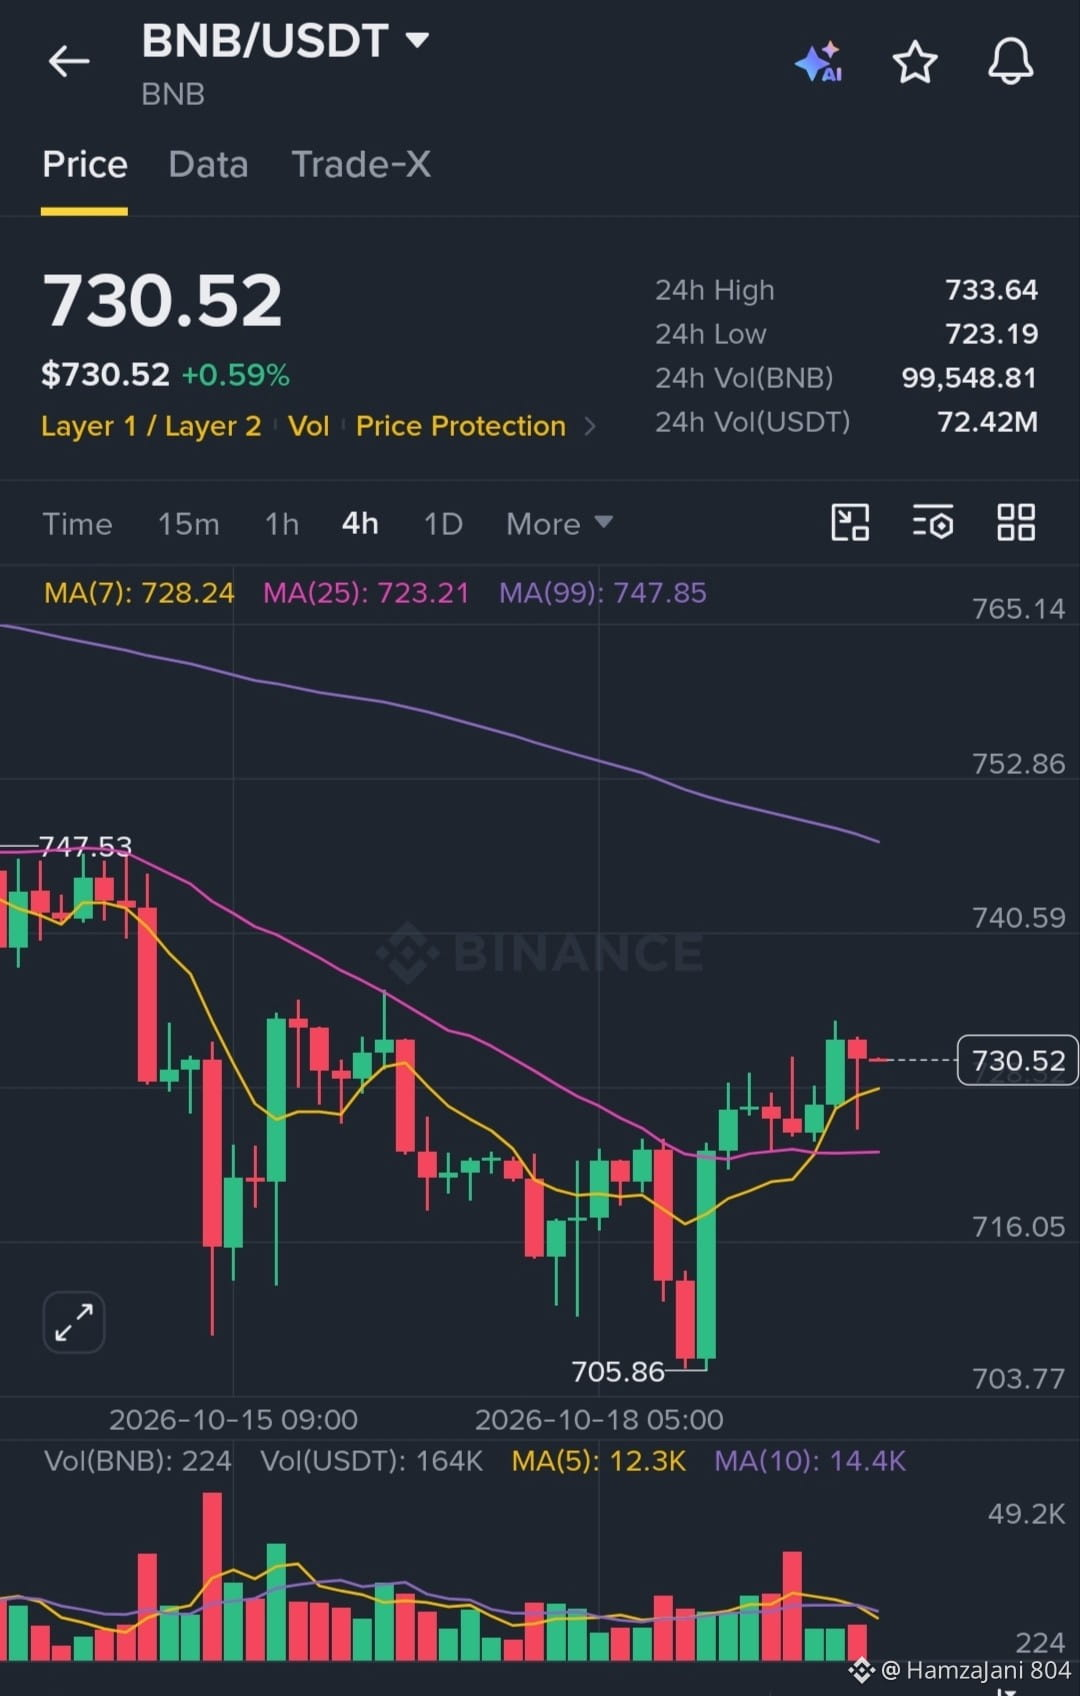
$BNB /USDT is currently trading at $730.52 (+0.59%) on the 4-hour chart. After testing a low of $705.86, price action has shown signs of recovery, holding above short-term moving averages MA(7) at $728.24 and MA(25) at $723.21. However, buyers face overhead resistance near the MA(99) line at $747.85 and recent highs around $733.64.
$BNB /USDT is currently trading at $730.52 (+0.59%) on the 4-hour chart. After testing a low of $705.86, price action has shown signs of recovery, holding above short-term moving averages MA(7) at $728.24 and MA(25) at $723.21. However, buyers face overhead resistance near the MA(99) line at $747.85 and recent highs around $733.64.
80
·
--
ブリッシュ
翻訳参照
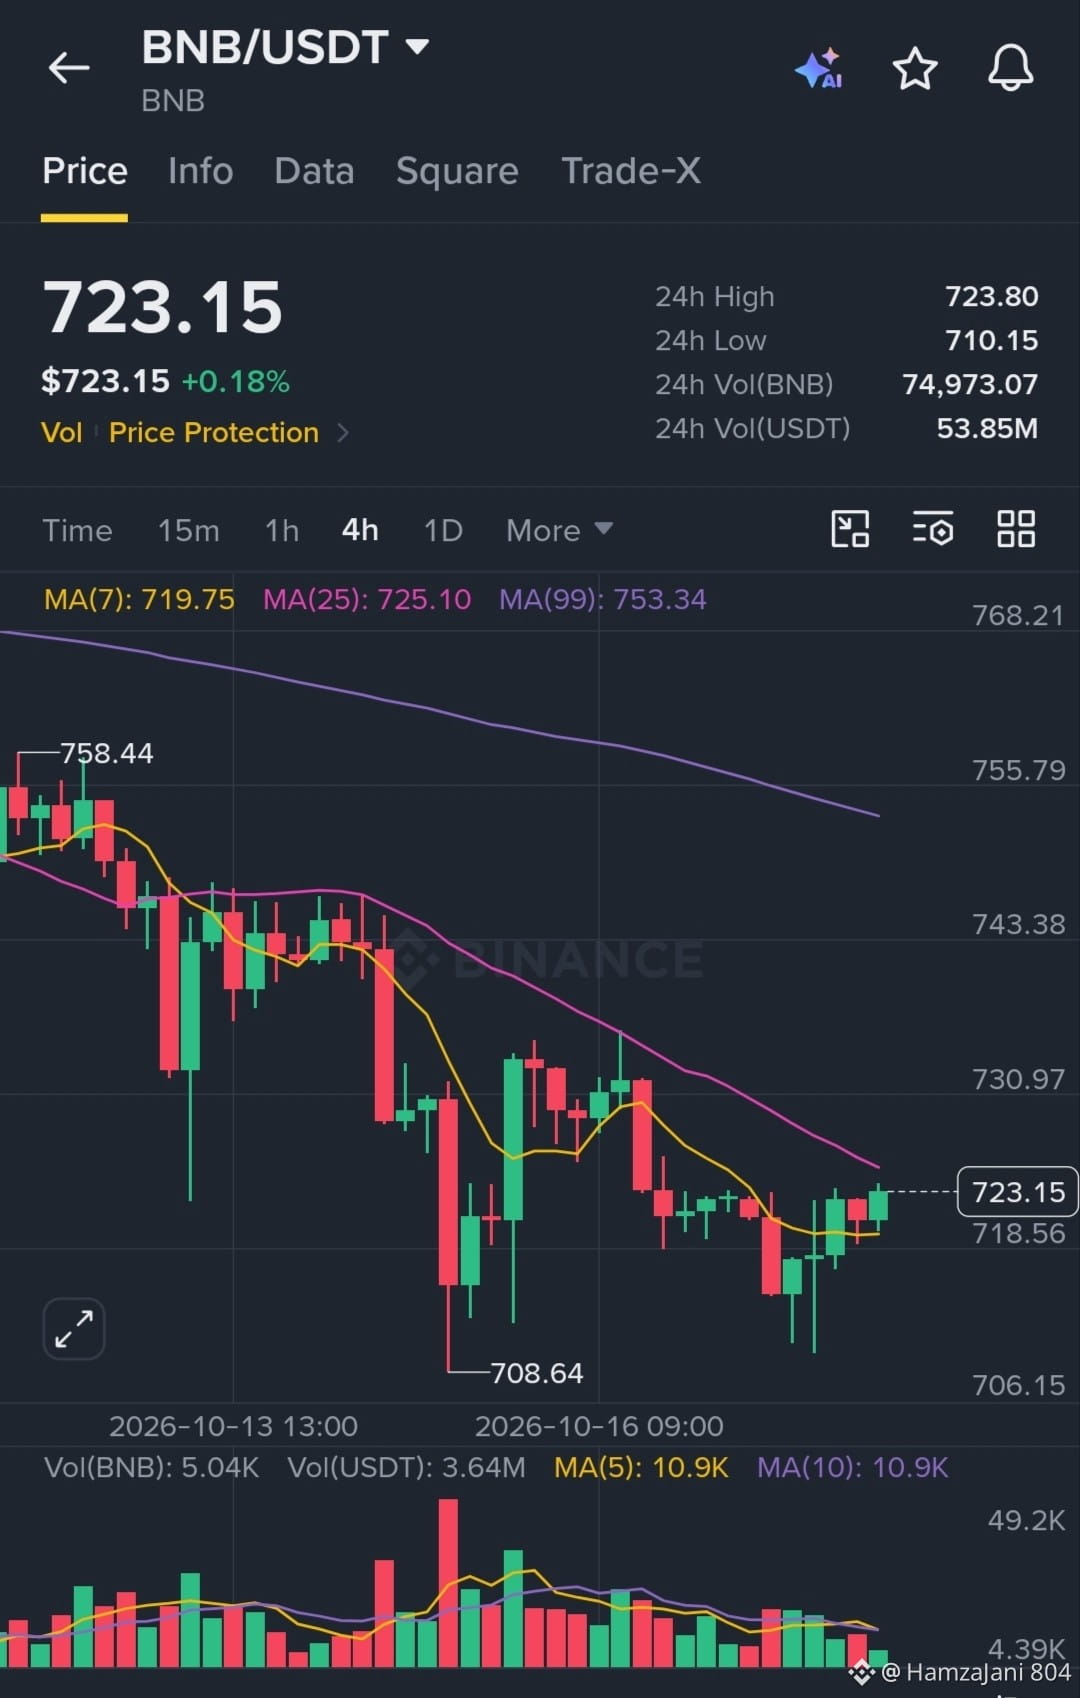
$BNB /USDT is showing signs of recovery, currently trading at $723.15 (+0.18%) after bouncing back from a recent low of $708.64. The price has reclaimed the 7-period moving average ($719.75). However, it faces immediate resistance near the 25-period moving average ($725.10), with the 24-hour high sitting at $723.80. Traders should monitor if momentum holds above $720.
$BNB /USDT is showing signs of recovery, currently trading at $723.15 (+0.18%) after bouncing back from a recent low of $708.64. The price has reclaimed the 7-period moving average ($719.75). However, it faces immediate resistance near the 25-period moving average ($725.10), with the 24-hour high sitting at $723.80. Traders should monitor if momentum holds above $720.
72
翻訳参照
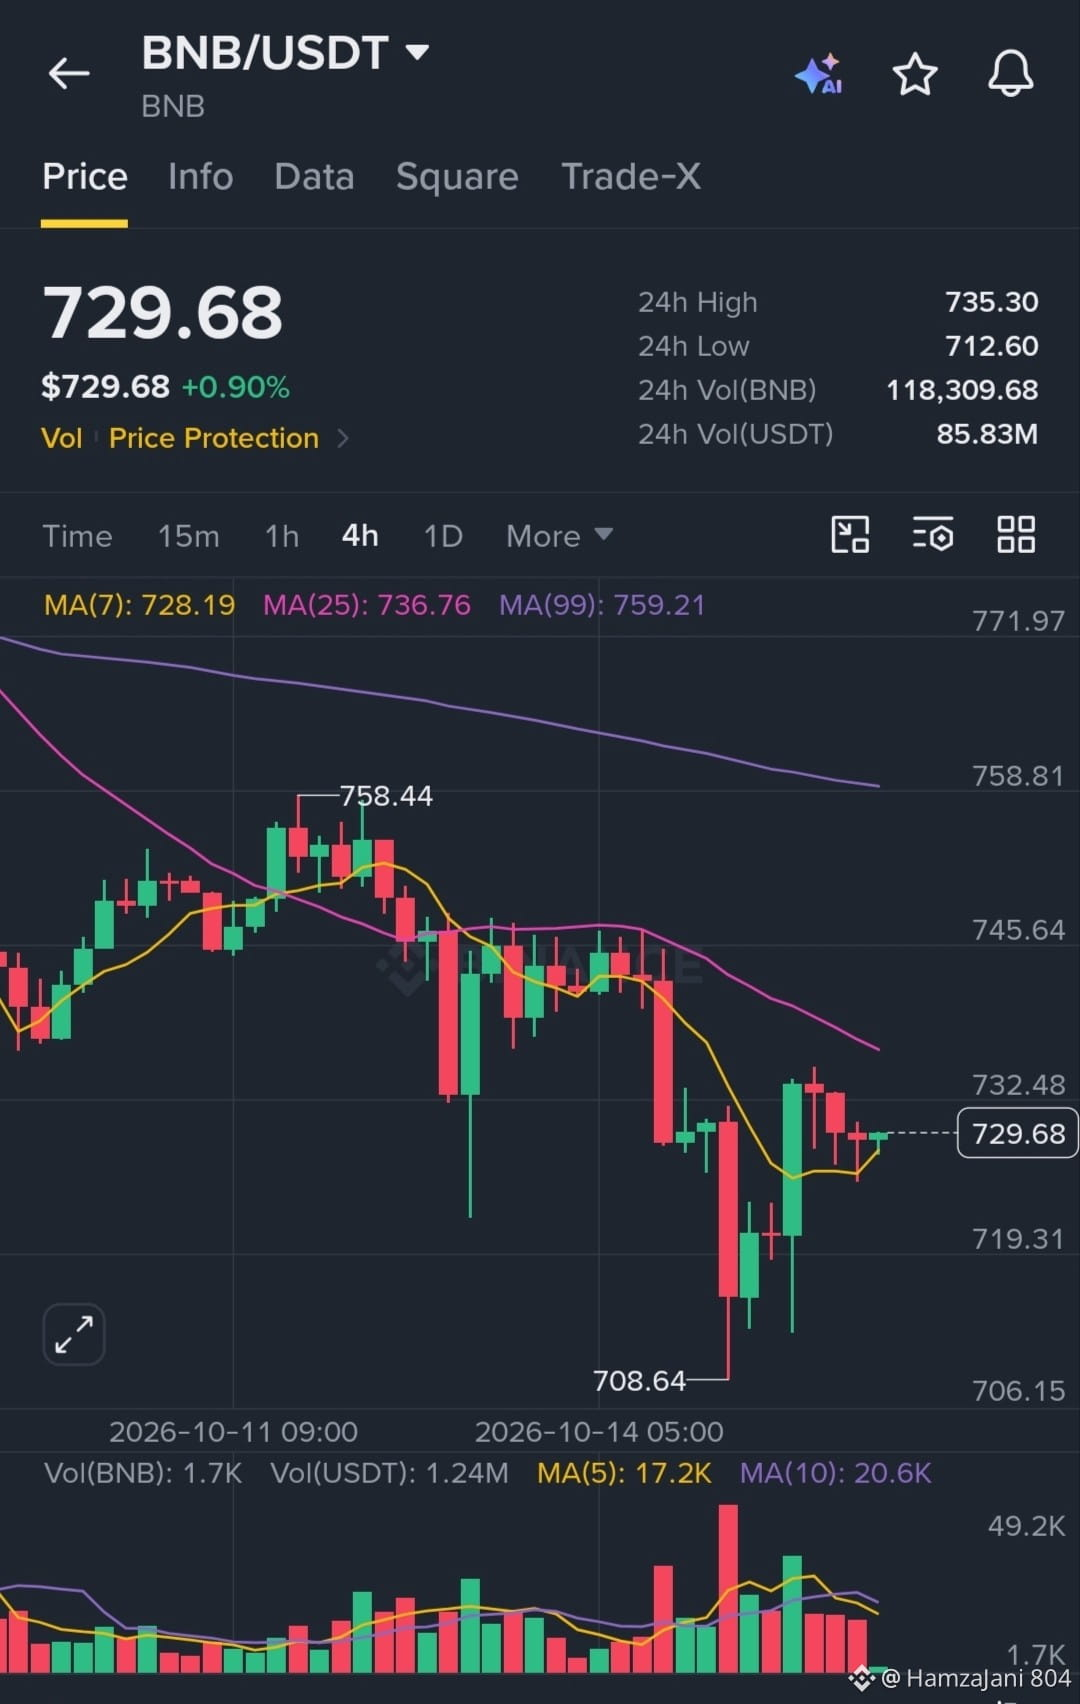
$BNB is currently trading around $729.68, recovering slightly with a 0.90% daily gain after rebounding from a recent low of $708.64. Despite holding above its 7-period moving average ($728.19), price action remains below the 25-period ($736.76) and 99-period ($759.21) moving averages. Traders should monitor whether bulls can push past overhead resistance or if downward pressure resumes.
$BNB is currently trading around $729.68, recovering slightly with a 0.90% daily gain after rebounding from a recent low of $708.64. Despite holding above its 7-period moving average ($728.19), price action remains below the 25-period ($736.76) and 99-period ($759.21) moving averages. Traders should monitor whether bulls can push past overhead resistance or if downward pressure resumes.
81
·
--
ブリッシュ
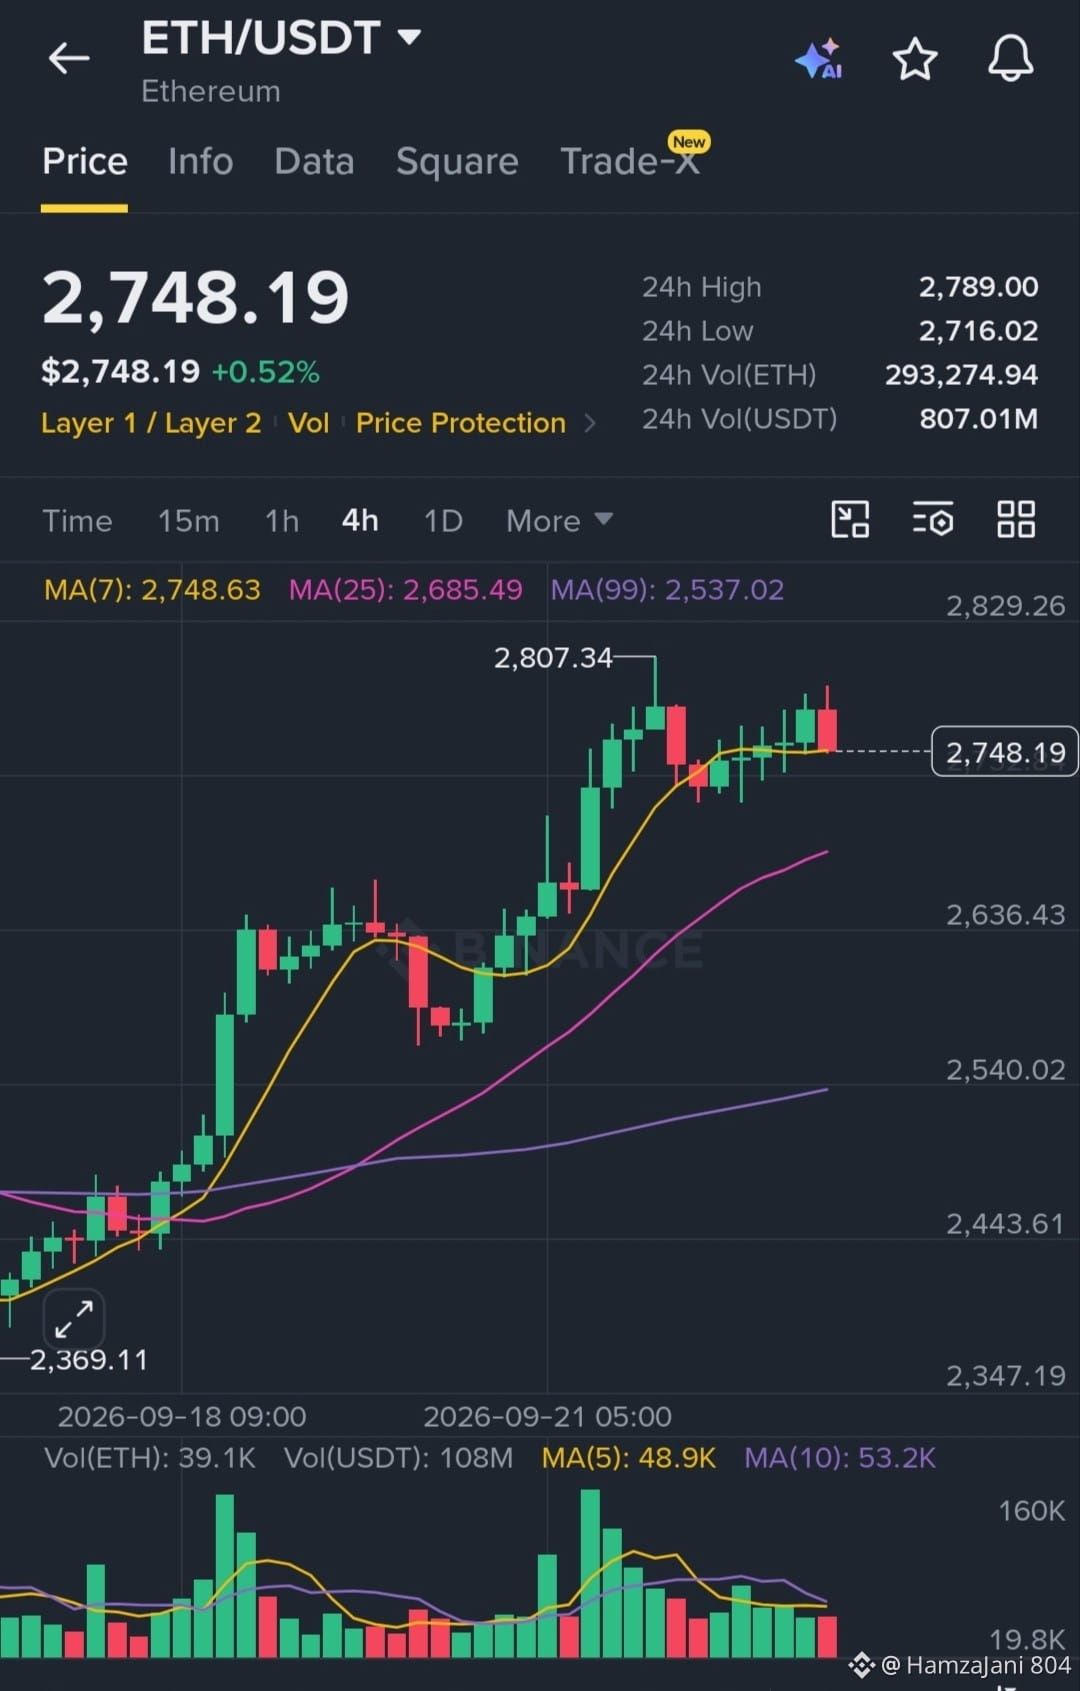
$ETH /USDTは直近高値$2,807.34から後退した後、$2,748.19付近で推移しており、日中はわずか0.52%上昇しています。価格はMA(7)の$2,748.63のすぐ近くで推移しつつ、MA(25)の$2,685.49を上回る強固な構造的サポートを維持しています。24時間レンジは$2,716.02から$2,789.00で、強気派は勢いを取り戻し、$2,800に向けて押し上げる必要があります。
$ETH /USDTは直近高値$2,807.34から後退した後、$2,748.19付近で推移しており、日中はわずか0.52%上昇しています。価格はMA(7)の$2,748.63のすぐ近くで推移しつつ、MA(25)の$2,685.49を上回る強固な構造的サポートを維持しています。24時間レンジは$2,716.02から$2,789.00で、強気派は勢いを取り戻し、$2,800に向けて押し上げる必要があります。
86
·
--
ブリッシュ
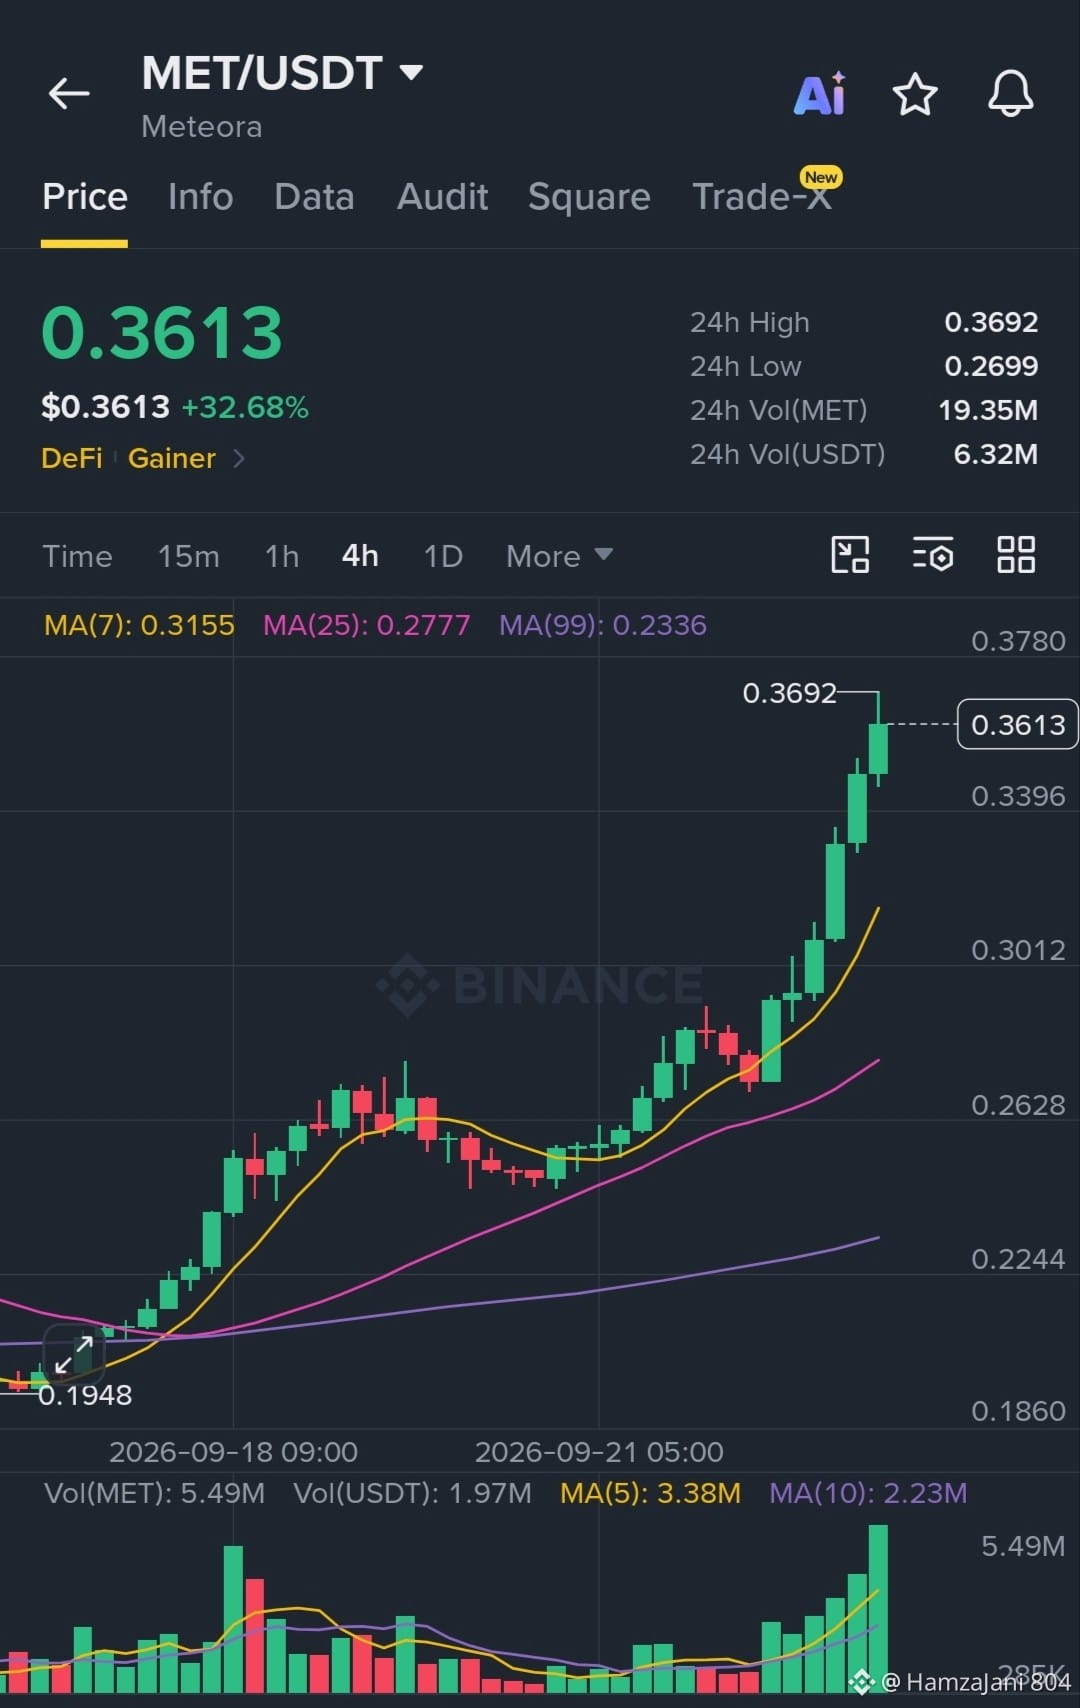
$MET /USDTは強い上昇モメンタムを示しており、24時間高値の$0.3692に到達した後、32.68%急騰して$0.3613付近で取引されています。しっかりした出来高に裏打ちされ、価格は主要指標を大きく上回った状態が続き、7期間移動平均($0.3155)がすぐにダイナミックなサポートとなっています。トレーダーは、買い手がレジスタンスを突破できるか、または$0.3600の水準を上回って推移(統合)できるかに注目すべきです。
$MET /USDTは強い上昇モメンタムを示しており、24時間高値の$0.3692に到達した後、32.68%急騰して$0.3613付近で取引されています。しっかりした出来高に裏打ちされ、価格は主要指標を大きく上回った状態が続き、7期間移動平均($0.3155)がすぐにダイナミックなサポートとなっています。トレーダーは、買い手がレジスタンスを突破できるか、または$0.3600の水準を上回って推移(統合)できるかに注目すべきです。
129
·
--
弱気相場
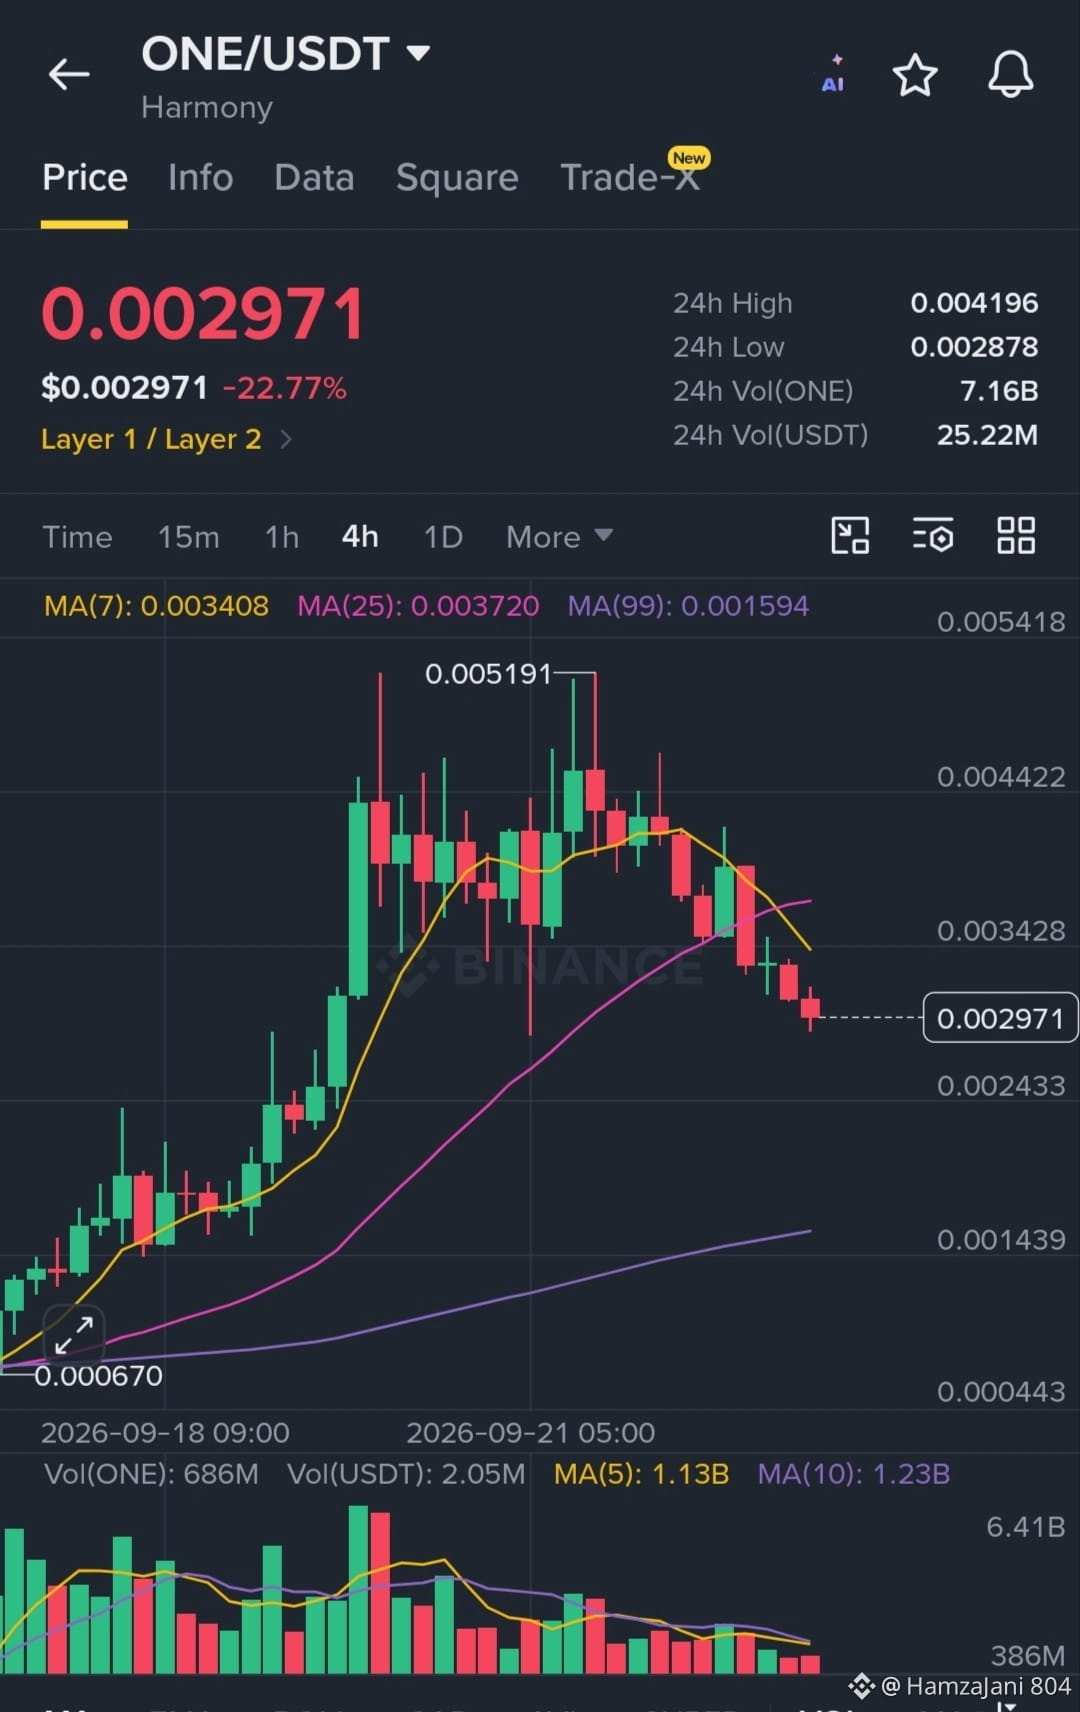
$ONE /USDTは大きな押し目に見舞われており、直近高値の0.004196ドルを試した後、22.77%下落して約0.002971ドルとなっています。価格はMA(7)の0.003408ドルとMA(25)の0.003720ドルの両方を下回り、短期的に弱気が優勢であることを示しています。トレーダーは24時間安値の0.002878ドル付近での安定化の可能性に注目する必要があり、そうでなければ下方向にあるより低い支持ゾーンへ向けてさらなる下落リスクがあります。
$ONE /USDTは大きな押し目に見舞われており、直近高値の0.004196ドルを試した後、22.77%下落して約0.002971ドルとなっています。価格はMA(7)の0.003408ドルとMA(25)の0.003720ドルの両方を下回り、短期的に弱気が優勢であることを示しています。トレーダーは24時間安値の0.002878ドル付近での安定化の可能性に注目する必要があり、そうでなければ下方向にあるより低い支持ゾーンへ向けてさらなる下落リスクがあります。
118
·
--
ブリッシュ
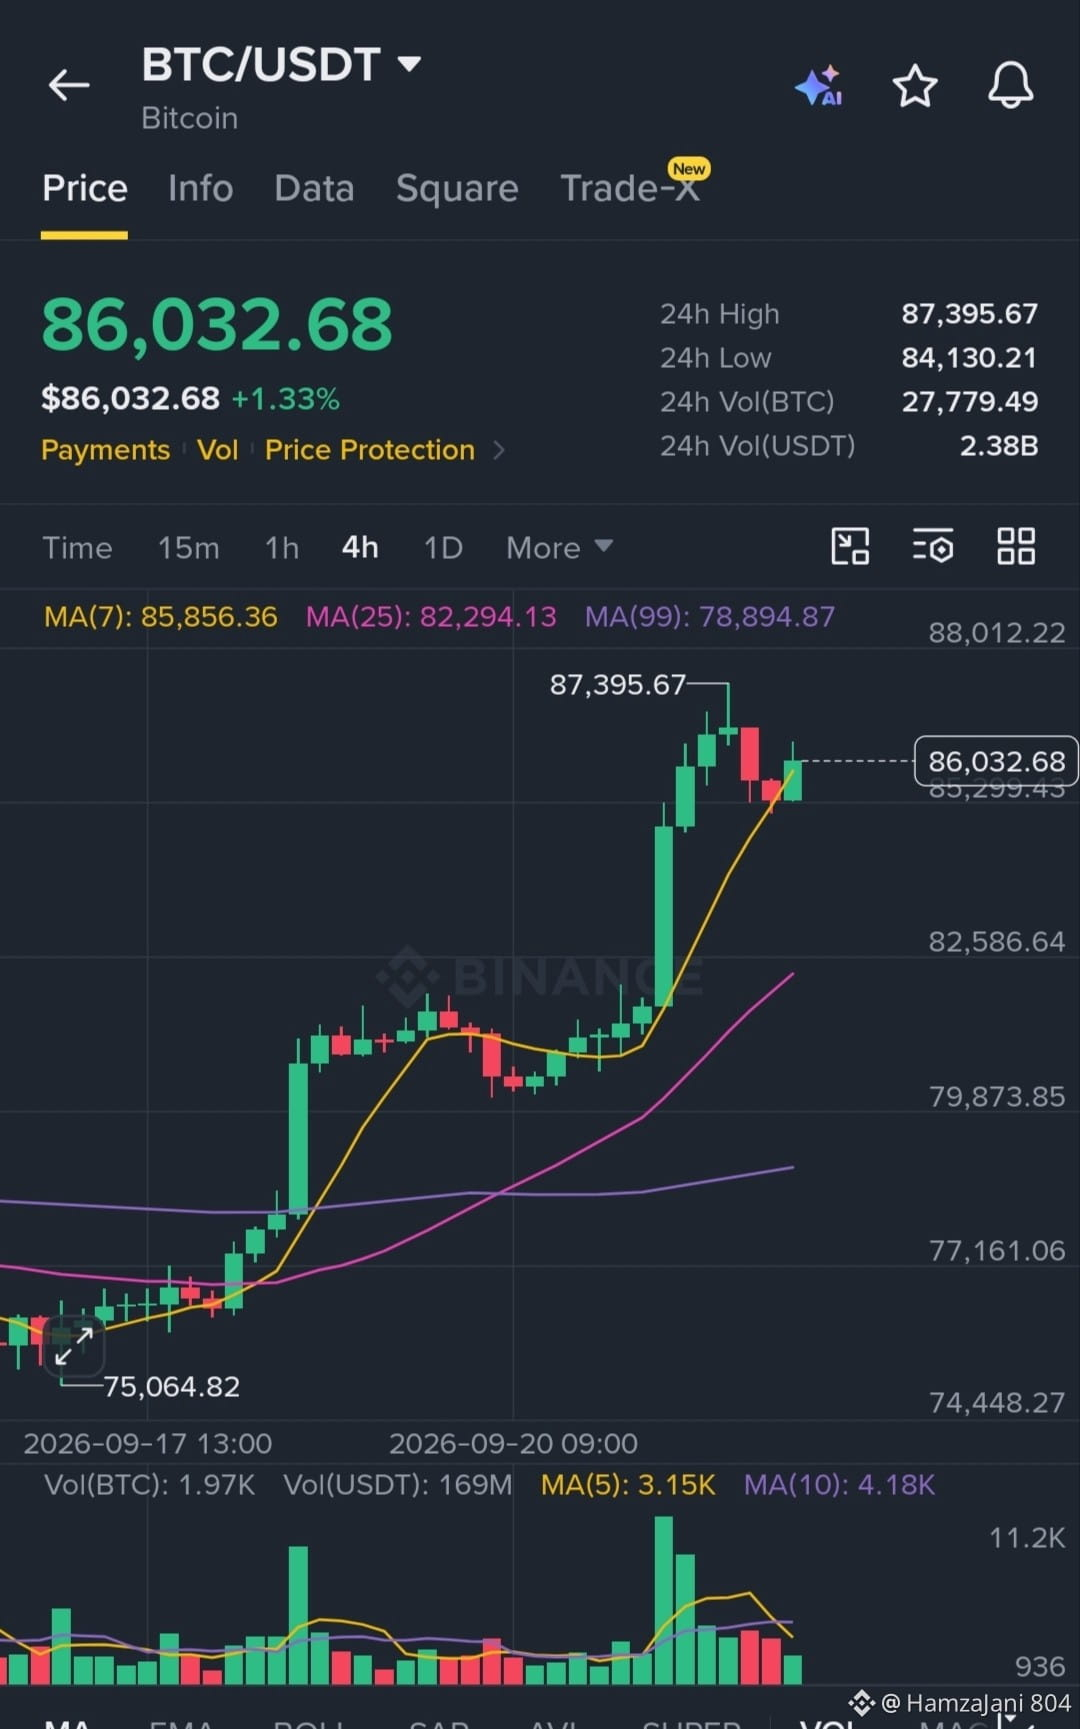
$BTC /USDT は安定した上昇トレンドを維持しており、現在 $86,032.68 で推移、直近24時間で +1.33% の上昇を記録しています。24時間高値の $87,395.67 に到達した後も、主要移動平均線を上回る水準を維持しており、MA(7) は $85,856.36、MA(25) は $82,294.13 です。強いサポート水準は、さらなる強気の勢いの可能性を示唆しています。
$BTC /USDT は安定した上昇トレンドを維持しており、現在 $86,032.68 で推移、直近24時間で +1.33% の上昇を記録しています。24時間高値の $87,395.67 に到達した後も、主要移動平均線を上回る水準を維持しており、MA(7) は $85,856.36、MA(25) は $82,294.13 です。強いサポート水準は、さらなる強気の勢いの可能性を示唆しています。
51
·
--
ブリッシュ
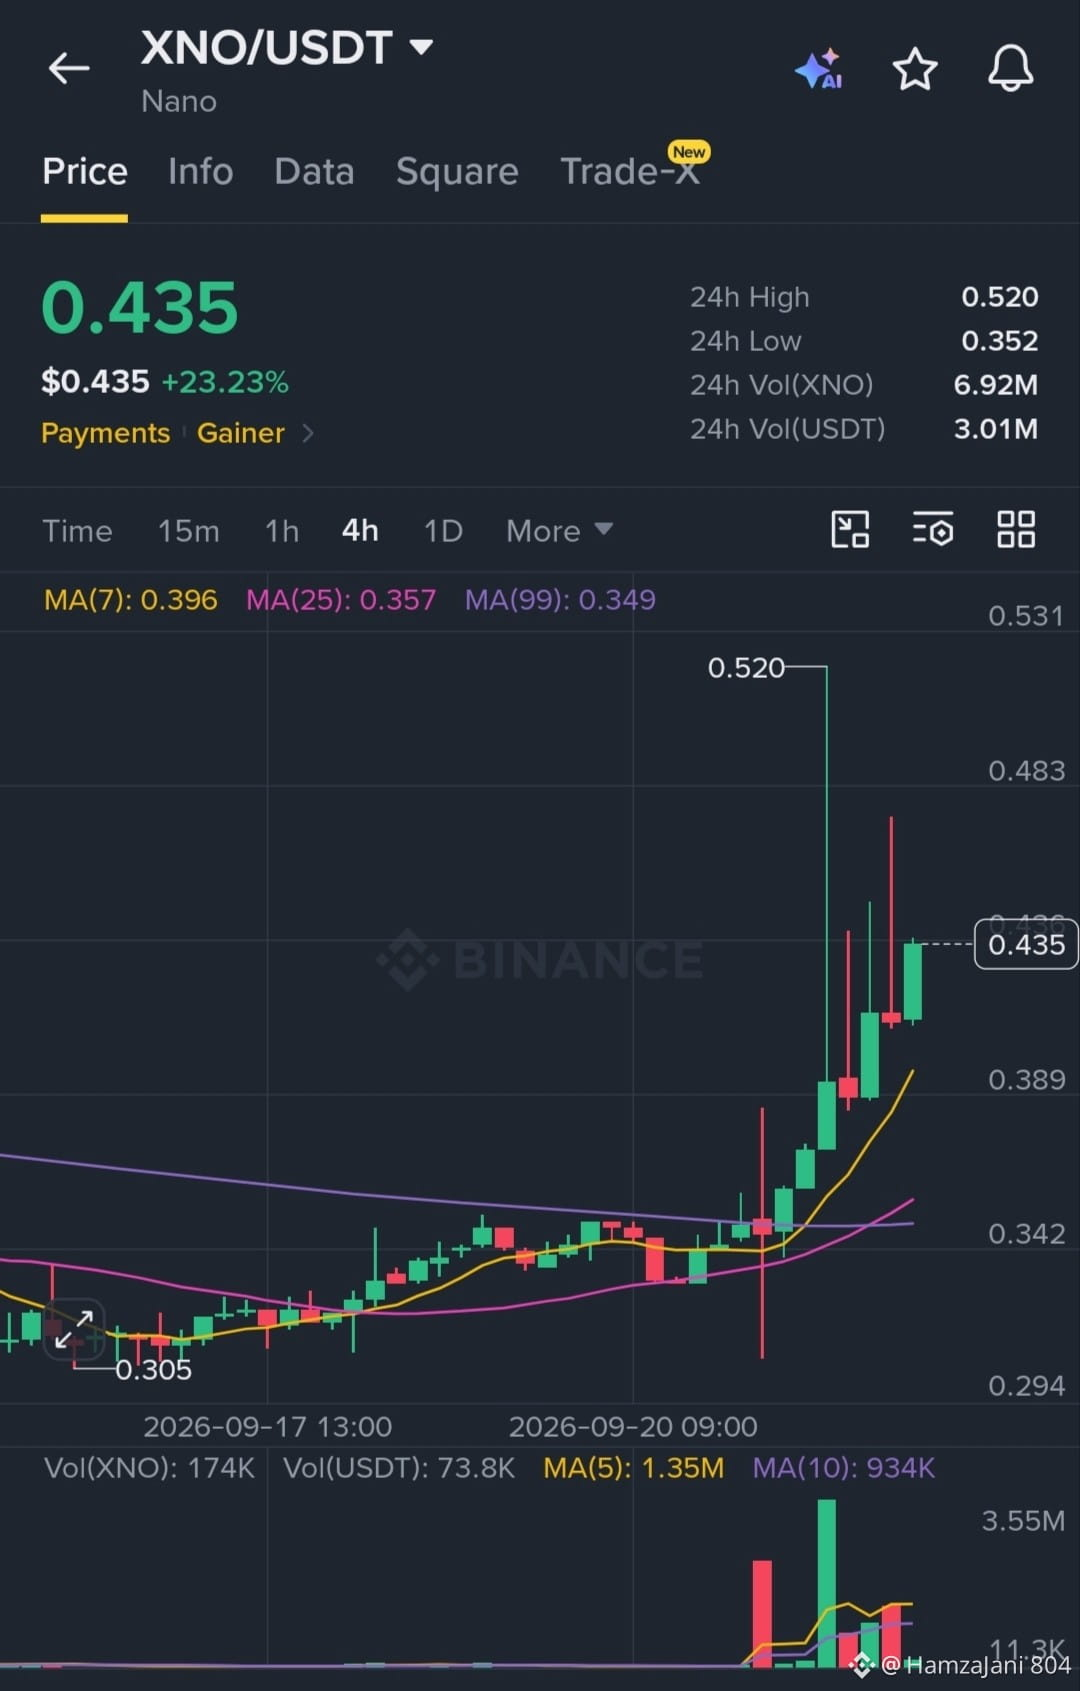
$XNO /USDTは強い上昇トレンドを維持しており、現在$0.435で推移していて、過去24時間で+23.23%の上昇です。$0.520まで急騰した後、価格はMA(7)の$0.396やMA(25)の$0.357などの主要な移動平均を上回った状態で堅調に推移しており、整理(コンソリデーション)が良好です。この高い水準を維持していることは、潜在的な継続に向けた買い需要が続いていることを示唆しています。
$XNO /USDTは強い上昇トレンドを維持しており、現在$0.435で推移していて、過去24時間で+23.23%の上昇です。$0.520まで急騰した後、価格はMA(7)の$0.396やMA(25)の$0.357などの主要な移動平均を上回った状態で堅調に推移しており、整理(コンソリデーション)が良好です。この高い水準を維持していることは、潜在的な継続に向けた買い需要が続いていることを示唆しています。
56
·
--
弱気相場
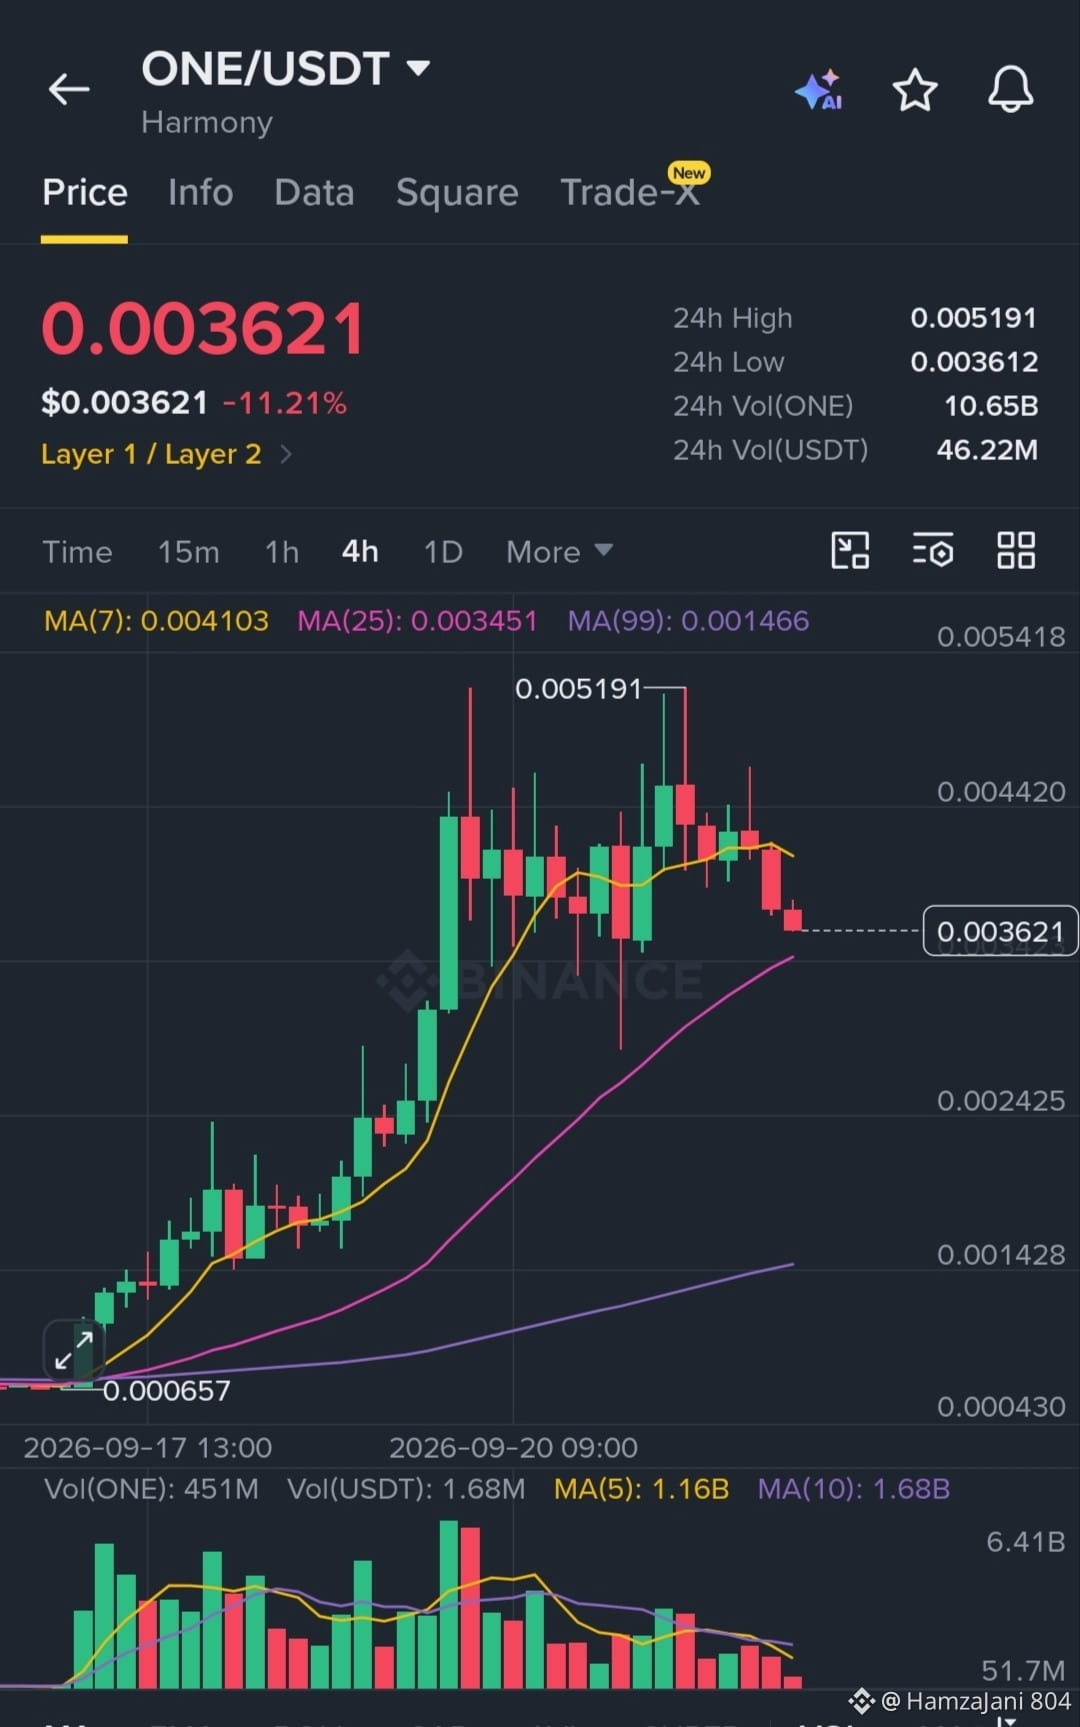
$ONE /USDTは押し目局面にあり、現在$0.003621で取引されています。過去24時間で11.21%下落しています。$0.005191の高値を付けた後、価格は短期MA(7)の$0.004103を下回りました。とはいえ、MA(25)の$0.003451にある重要なサポートを上回った状態を維持しており、トレーダーは同水準での可能なレンジ(持ち合い)に注目しています。
$ONE /USDTは押し目局面にあり、現在$0.003621で取引されています。過去24時間で11.21%下落しています。$0.005191の高値を付けた後、価格は短期MA(7)の$0.004103を下回りました。とはいえ、MA(25)の$0.003451にある重要なサポートを上回った状態を維持しており、トレーダーは同水準での可能なレンジ(持ち合い)に注目しています。
482
·
--
弱気相場
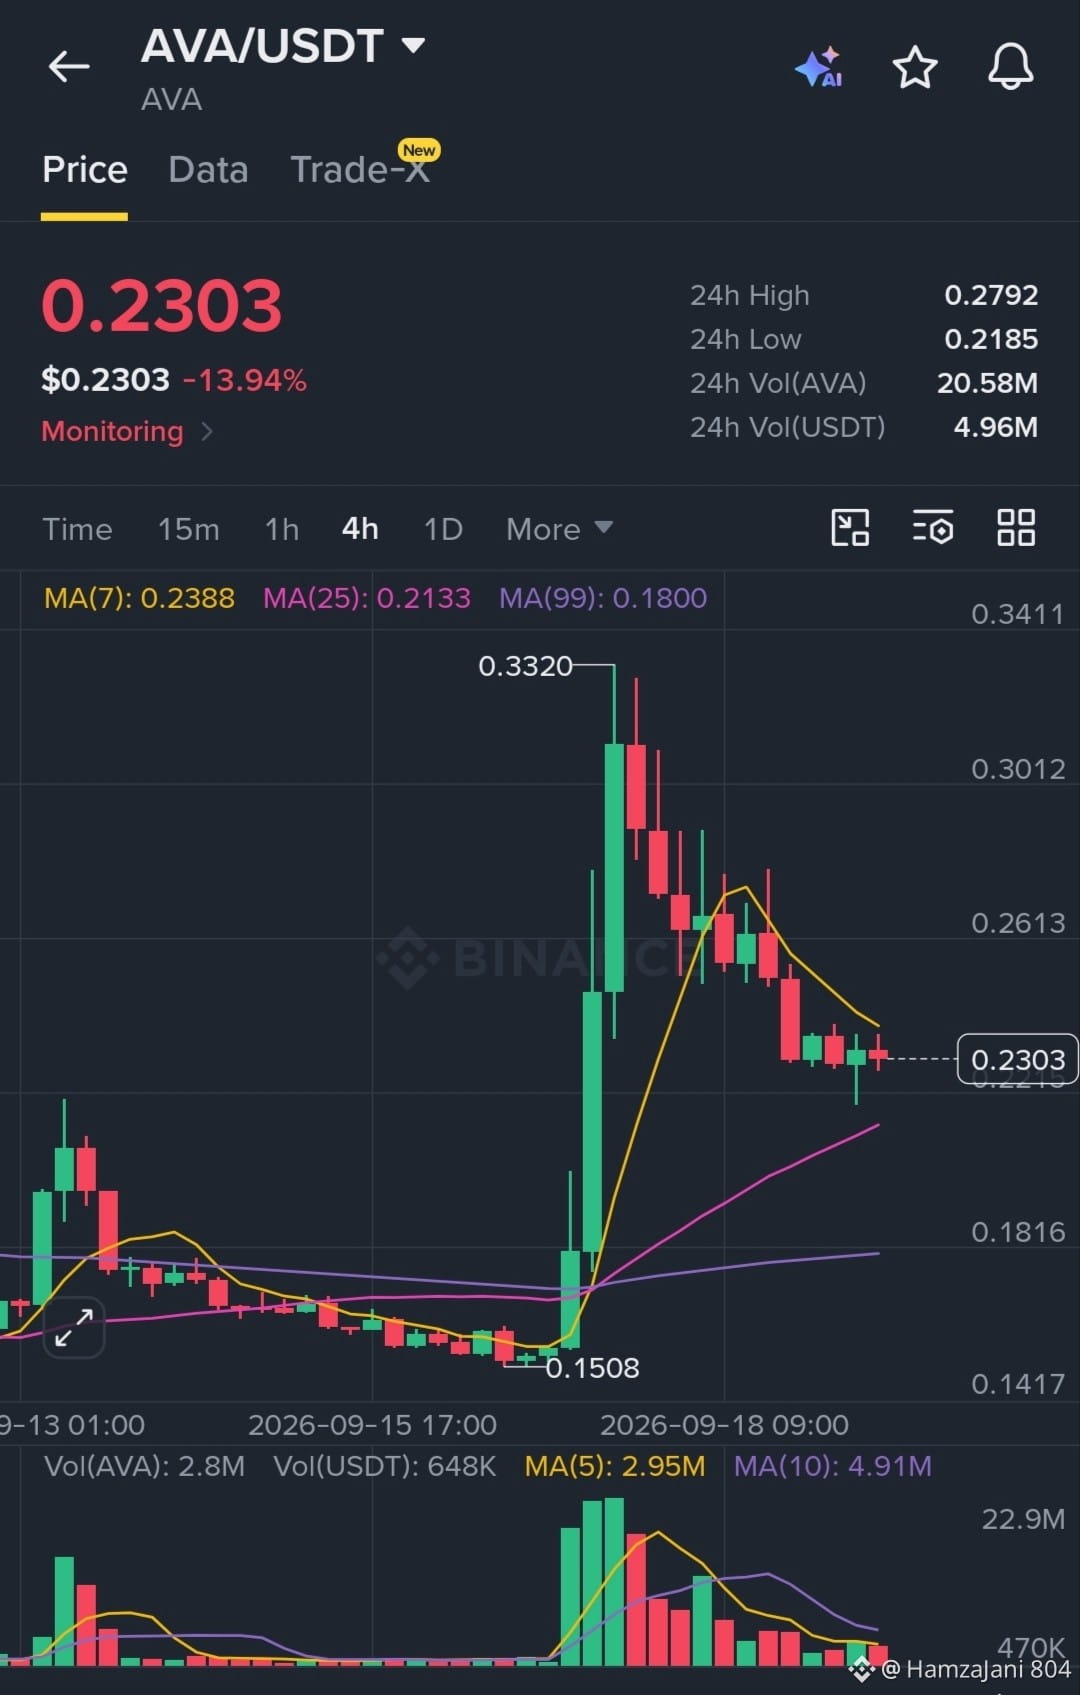
$AVA (トラヴァラ) は調整中で、ローカル高値の $0.3320 から戻した後、-13.94% 下落して $0.2303 で取引されています。現在、価格は $0.2133 の MA(25) 近辺のサポートを試しており、24時間安値の $0.2185 よりも十分に上にあります。トレーダーは、買い手がこの水準を防衛して安定化し、反発につながるかどうかを注視しています。
$AVA (トラヴァラ) は調整中で、ローカル高値の $0.3320 から戻した後、-13.94% 下落して $0.2303 で取引されています。現在、価格は $0.2133 の MA(25) 近辺のサポートを試しており、24時間安値の $0.2185 よりも十分に上にあります。トレーダーは、買い手がこの水準を防衛して安定化し、反発につながるかどうかを注視しています。
215
·
--
ブリッシュ
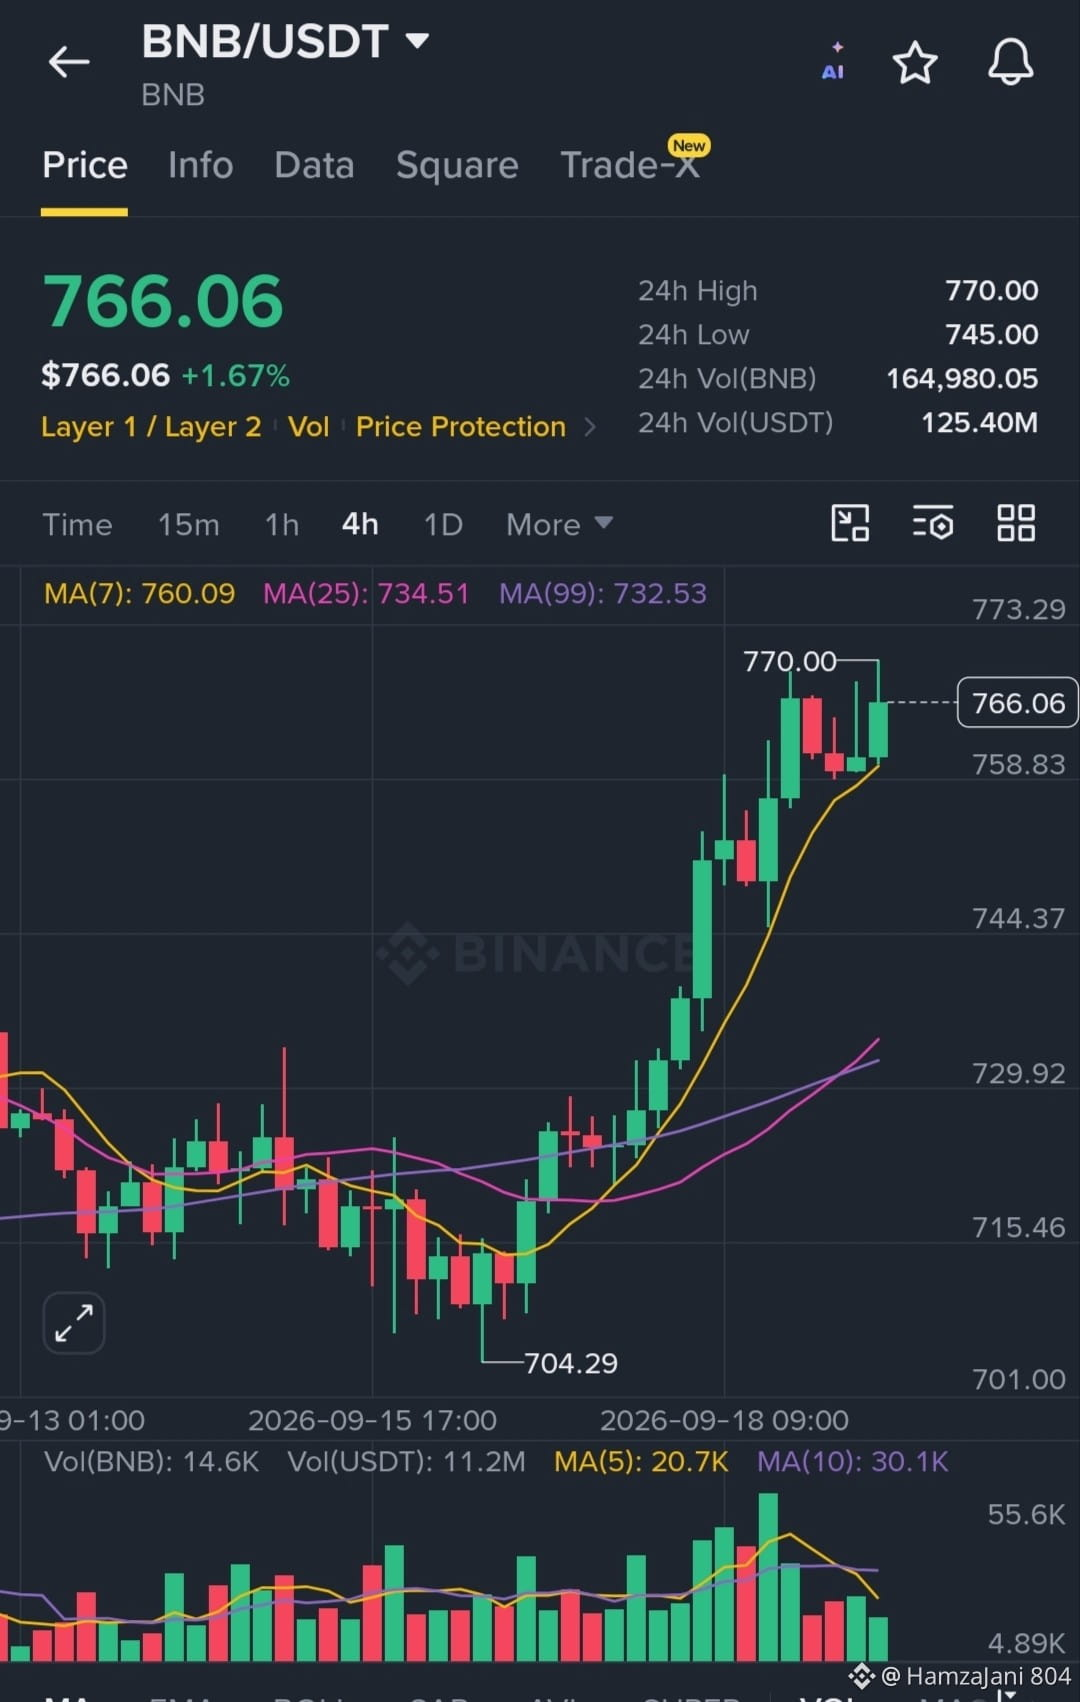
$BNB は強い上昇モメンタムを示しており、$704.29の安値から反発した後、現在$766.06(+1.67%)で取引されています。価格は主要な移動平均線の上をしっかり維持しており、最近では24時間高値の$770.00にタッチしました。堅調な買いの出来高がこの安定した上昇トレンドを支えているため、トレーダーはBNBがレジスタンスを突破してさらに新たな上昇局面を作れるかどうかを注視しています。
$BNB は強い上昇モメンタムを示しており、$704.29の安値から反発した後、現在$766.06(+1.67%)で取引されています。価格は主要な移動平均線の上をしっかり維持しており、最近では24時間高値の$770.00にタッチしました。堅調な買いの出来高がこの安定した上昇トレンドを支えているため、トレーダーはBNBがレジスタンスを突破してさらに新たな上昇局面を作れるかどうかを注視しています。
63
·
--
ブリッシュ
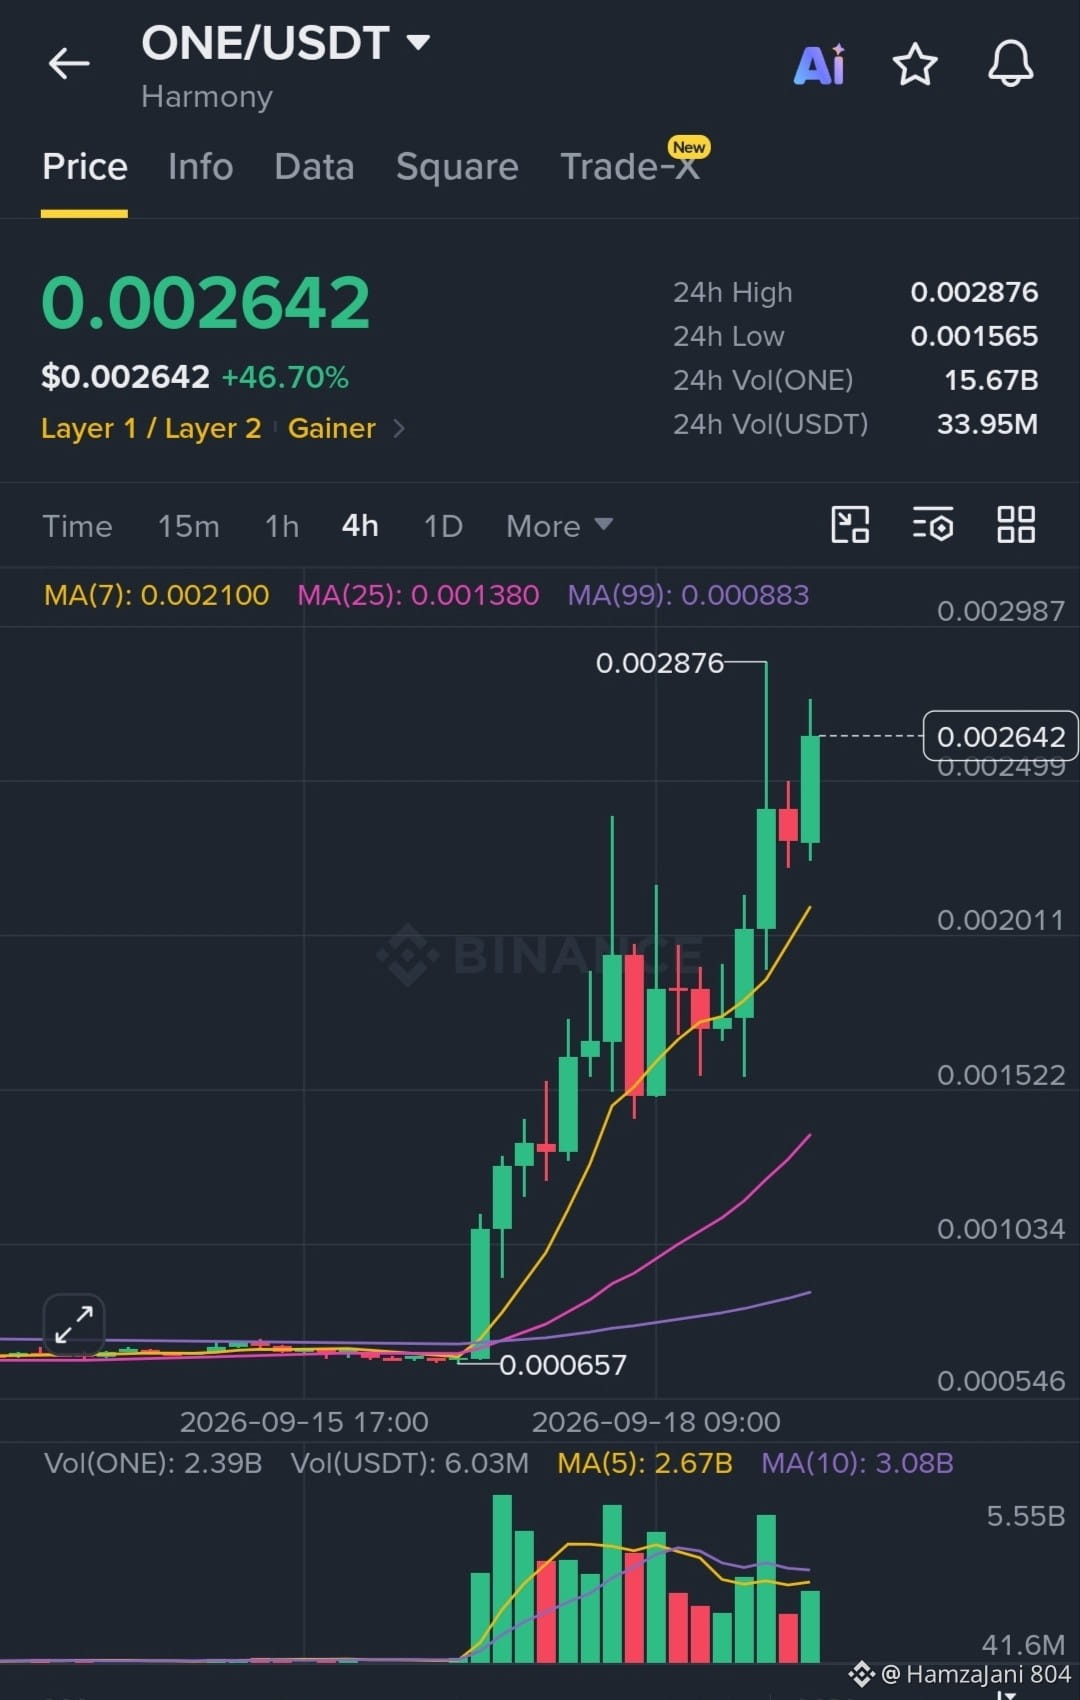
$ONE (ハーモニー)は並外れた勢いを見せており、安値$0.000657から上昇した後、+46.70%上げて取引価格$0.002642まで急騰しています。強い出来高に後押しされ、価格は24時間高値$0.002876まで到達したものの、その後わずかな押し戻しがありました。ONEが主要移動平均線を上回っている限り、強気派は依然として主導権を握っており、より高い抵抗目標に向けた継続の可能性を見込んでいます。
$ONE (ハーモニー)は並外れた勢いを見せており、安値$0.000657から上昇した後、+46.70%上げて取引価格$0.002642まで急騰しています。強い出来高に後押しされ、価格は24時間高値$0.002876まで到達したものの、その後わずかな押し戻しがありました。ONEが主要移動平均線を上回っている限り、強気派は依然として主導権を握っており、より高い抵抗目標に向けた継続の可能性を見込んでいます。
126
·
--
弱気相場
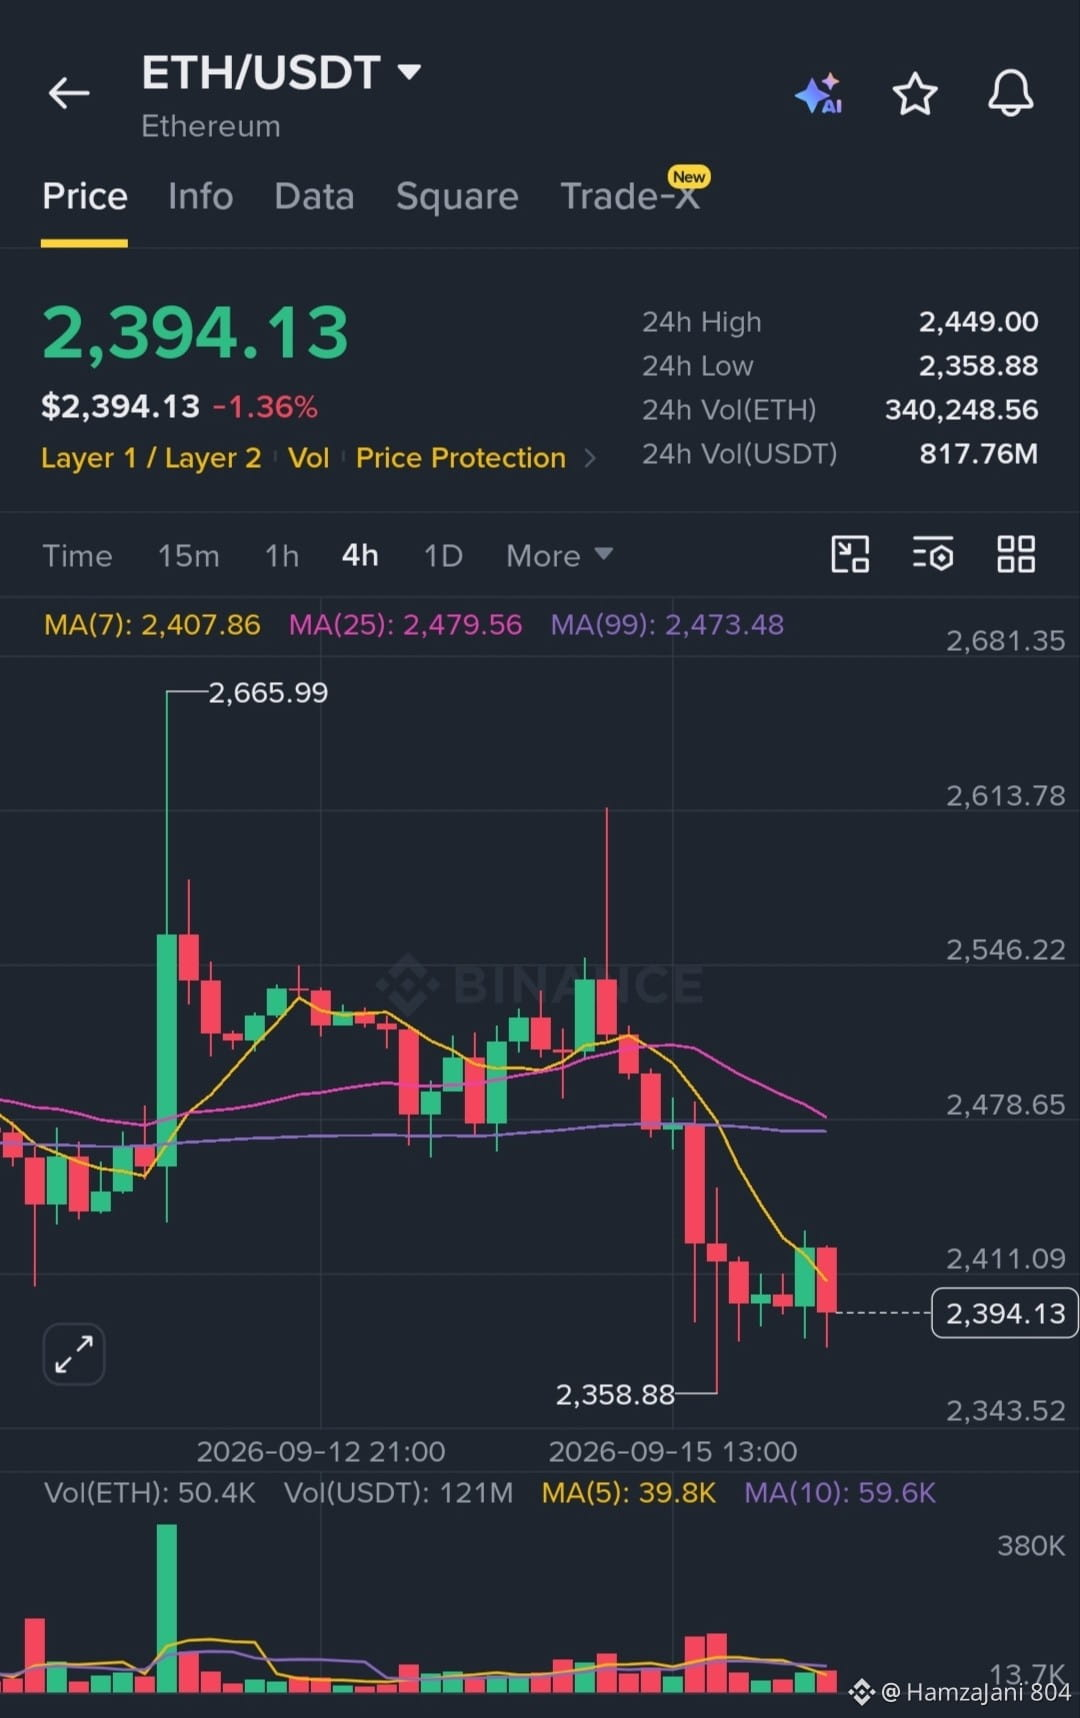
$ETH /USDTは継続的な弱さを示しており、過去24時間で-1.36%下落して、$2,394.13近辺で取引されています。4時間足チャートでは、主要な移動平均を下回った状態で価格が推移していることから、下方への圧力が持続していることが示されています。MA(7)は$2,407.86です。安定のためには、$2,358.88の24時間安値を上回って維持することが重要であり、一方で買い手は$2,408を上抜けて押し上げ、短期的な回復を示す必要があります。
$ETH /USDTは継続的な弱さを示しており、過去24時間で-1.36%下落して、$2,394.13近辺で取引されています。4時間足チャートでは、主要な移動平均を下回った状態で価格が推移していることから、下方への圧力が持続していることが示されています。MA(7)は$2,407.86です。安定のためには、$2,358.88の24時間安値を上回って維持することが重要であり、一方で買い手は$2,408を上抜けて押し上げ、短期的な回復を示す必要があります。
60
·
--
ブリッシュ
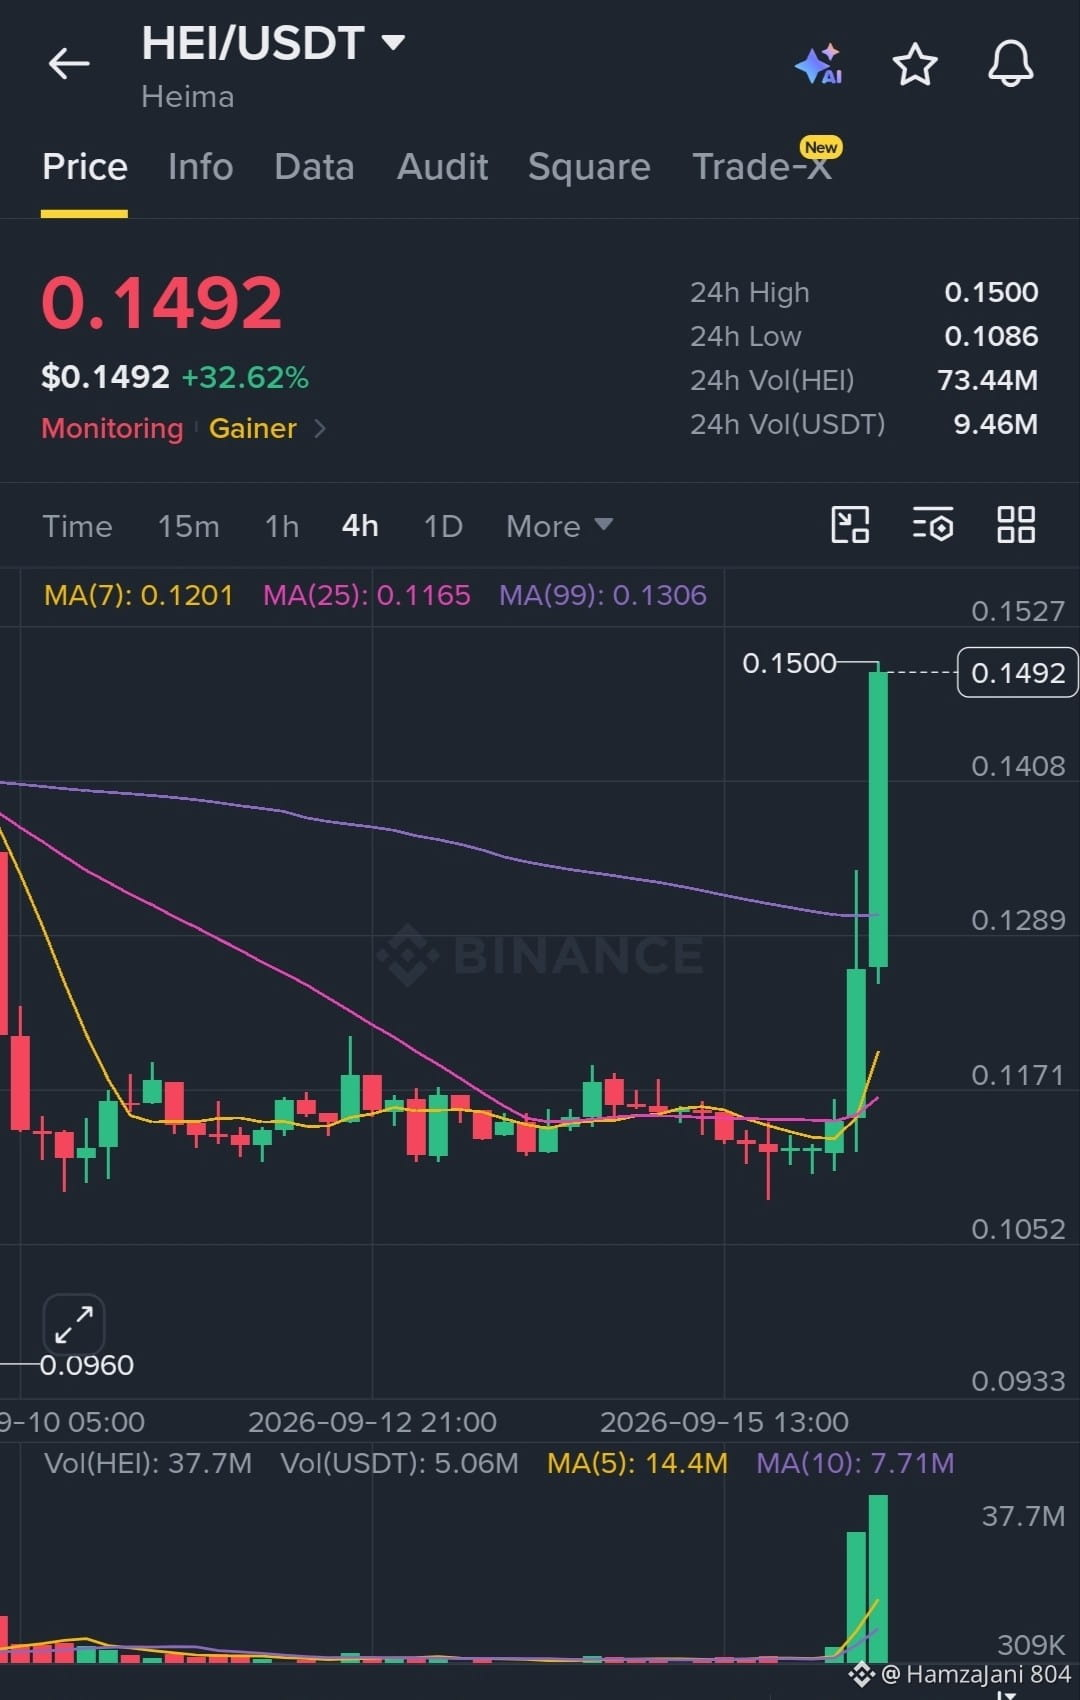
$HEI /USDTは強気の急騰を見せ、+32.62%上昇して24時間高値$0.1500に到達した後、$0.1492近辺で取引されています。出来高の急増を背景に、価格は主要移動平均線をきれいに上抜けし、$0.1306のMA(99)もクリアしました。$0.1500を上回るブレイクアウトがあれば、上昇をさらに伸ばす可能性があります。一方でサポートは現在$0.130近辺にあります。
$HEI /USDTは強気の急騰を見せ、+32.62%上昇して24時間高値$0.1500に到達した後、$0.1492近辺で取引されています。出来高の急増を背景に、価格は主要移動平均線をきれいに上抜けし、$0.1306のMA(99)もクリアしました。$0.1500を上回るブレイクアウトがあれば、上昇をさらに伸ばす可能性があります。一方でサポートは現在$0.130近辺にあります。
165
ログインして、さらにコンテンツを読む
厳選トピックで世界の暗号資産トレーダーの仲間入り
⚡️ 暗号資産に関する最新かつ有益な情報が見つかります。
💬 世界最大の暗号資産取引所から信頼されています。
👍 認証を受けたクリエイターから、有益なインサイトを得られます。
メール / 電話番号