

Liz Ann Sonders Re-poster
1.4k 投稿

Liz Ann Sonders Re-poster
報告
ユーザーをブロック
Chief Investment Strategist, Schwab Center for Financial Research.
0 フォロー
383 フォロワー
901 いいね
投稿
翻訳参照
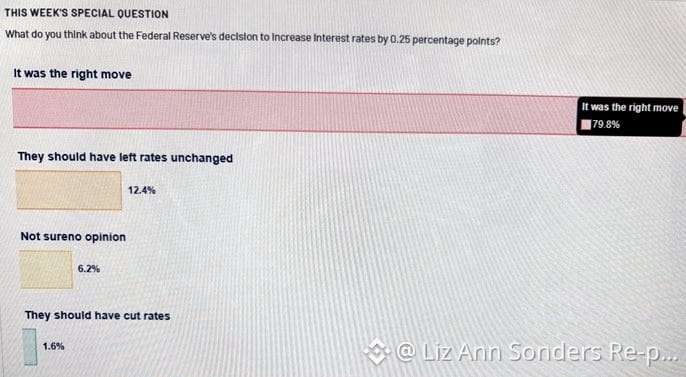
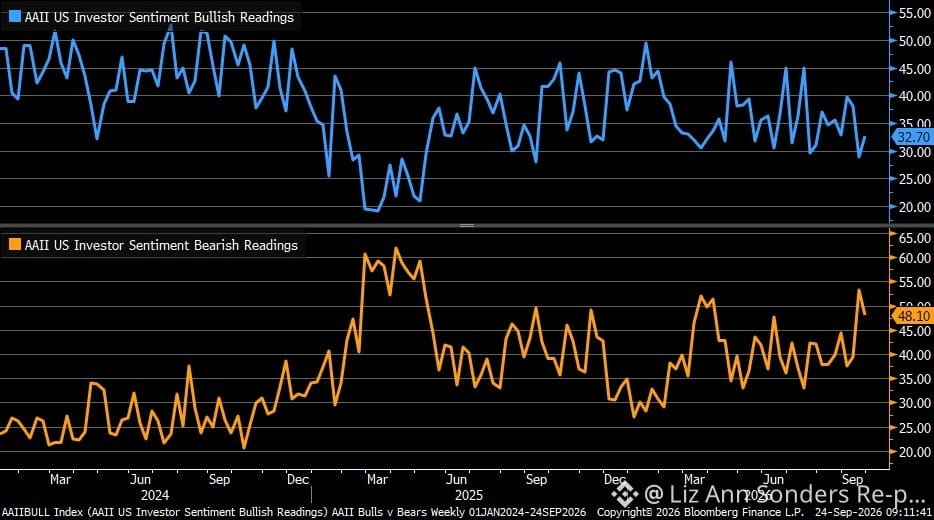
Optimistic investors regained some ground in the most recent @AAIISentiment survey for the week ending 9/23/26, although overall bearish sentiment remains noticeably high. Additionally, the special question this week asks AAII members to share their perspectives on the recent Fed rate hike.
Optimistic investors regained some ground in the most recent @AAIISentiment survey for the week ending 9/23/26, although overall bearish sentiment remains noticeably high. Additionally, the special question this week asks AAII members to share their perspectives on the recent Fed rate hike.
2
翻訳参照
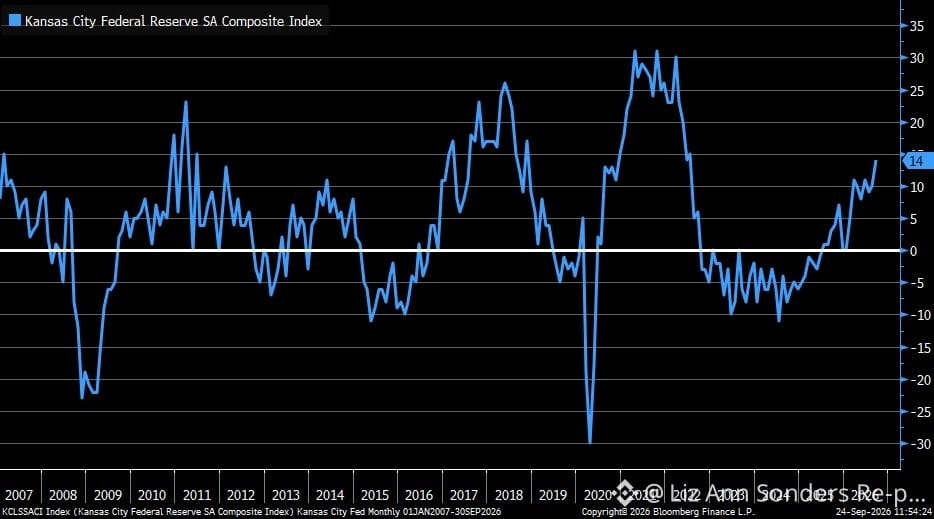
For the month of September, the @KansasCityFed Manufacturing Index reached a level of 14. This result comfortably exceeded the estimated projection of 9 and showed positive movement from the previous reading of 10. Taking a closer look at the specific components of the report, the metric for new orders climbed to 24, moving up from the prior figure of 16. Shipments also experienced an increase, landing at 21 compared to the earlier 17. Additionally, the prices paid measurement jumped to 68 from the preceding 55. Meanwhile, the employment indicator held completely steady, recording a 0 to precisely match the prior result of 0.
For the month of September, the @KansasCityFed Manufacturing Index reached a level of 14. This result comfortably exceeded the estimated projection of 9 and showed positive movement from the previous reading of 10. Taking a closer look at the specific components of the report, the metric for new orders climbed to 24, moving up from the prior figure of 16. Shipments also experienced an increase, landing at 21 compared to the earlier 17. Additionally, the prices paid measurement jumped to 68 from the preceding 55. Meanwhile, the employment indicator held completely steady, recording a 0 to precisely match the prior result of 0.
7
翻訳参照
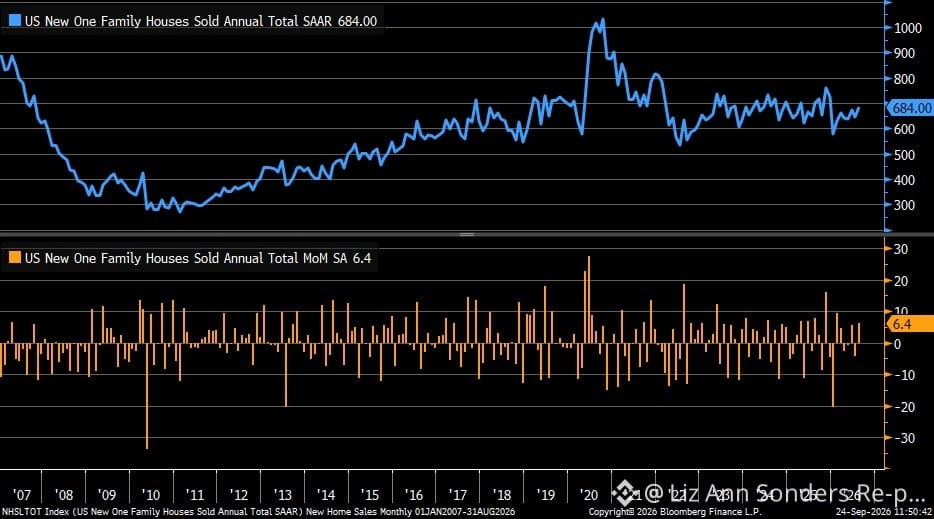
Sales of newly constructed homes experienced a surprisingly strong month in August, climbing 6.4% compared to the previous month. This performance easily beat the anticipated estimate of a 1.3% gain. Furthermore, the previous month's decline was revised upward to just -4.3%, representing a significant improvement from the initial report of a -10.5% drop. On the pricing side, the median cost of a new home saw a modest month-over-month increase of 0.4%, reaching $393,700. Meanwhile, the overall average selling price was recorded at $478,700.
Sales of newly constructed homes experienced a surprisingly strong month in August, climbing 6.4% compared to the previous month. This performance easily beat the anticipated estimate of a 1.3% gain. Furthermore, the previous month's decline was revised upward to just -4.3%, representing a significant improvement from the initial report of a -10.5% drop. On the pricing side, the median cost of a new home saw a modest month-over-month increase of 0.4%, reaching $393,700. Meanwhile, the overall average selling price was recorded at $478,700.
4
翻訳参照
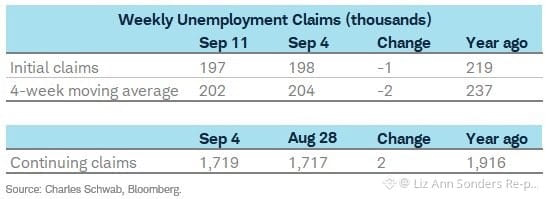
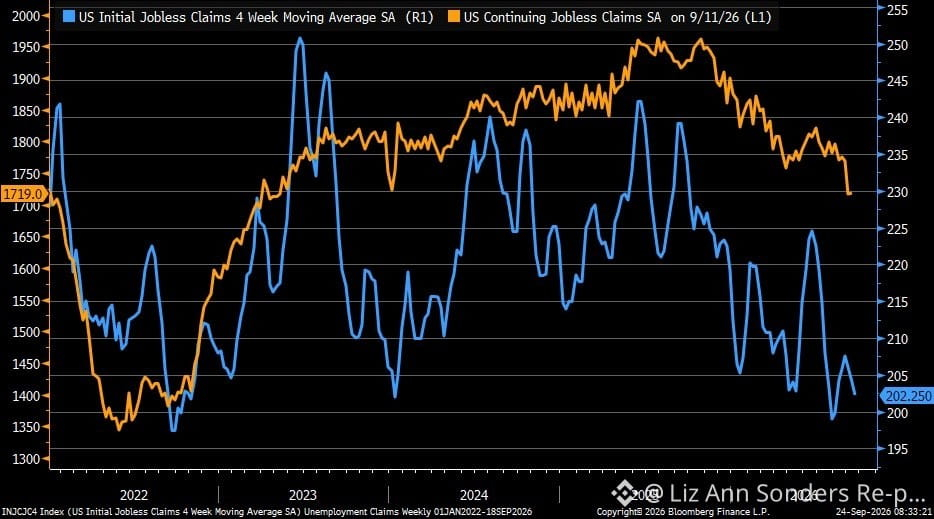
We have an encouraging update on the employment front for you. Recent figures indicate that initial jobless claims have decreased to 197k. This result is better than the estimated 200k and represents a drop from the prior level of 198k. In addition, continuing claims currently stand at 1.719M, which is comfortably below the 1.740M estimate, although it is slightly higher than the previous 1.717 mark.
Looking at the regional breakdown, we can see some distinct variations across the country. The highest jumps were reported by CA with a rise of 2.5k, HI going up by 1.5k, and NY growing by 1.1k. On the other hand, the most noticeable drops occurred in MA with a decline of 0.5k, as well as AR and KY, which both saw a decrease of 0.3k.
We have an encouraging update on the employment front for you. Recent figures indicate that initial jobless claims have decreased to 197k. This result is better than the estimated 200k and represents a drop from the prior level of 198k. In addition, continuing claims currently stand at 1.719M, which is comfortably below the 1.740M estimate, although it is slightly higher than the previous 1.717 mark.
Looking at the regional breakdown, we can see some distinct variations across the country. The highest jumps were reported by CA with a rise of 2.5k, HI going up by 1.5k, and NY growing by 1.1k. On the other hand, the most noticeable drops occurred in MA with a decline of 0.5k, as well as AR and KY, which both saw a decrease of 0.3k.
Looking at the regional breakdown, we can see some distinct variations across the country. The highest jumps were reported by CA with a rise of 2.5k, HI going up by 1.5k, and NY growing by 1.1k. On the other hand, the most noticeable drops occurred in MA with a decline of 0.5k, as well as AR and KY, which both saw a decrease of 0.3k.
翻訳参照
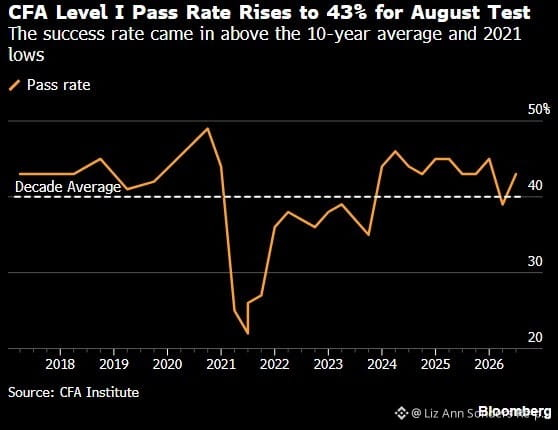
The success rate for the @CFAinstitute Level 1 examination experienced an upward trend in August, reaching 43%. This recent figure reflects an encouraging increase compared to the 39% recorded in May, and it also successfully surpasses the historical 10-year average of 40%.
The success rate for the @CFAinstitute Level 1 examination experienced an upward trend in August, reaching 43%. This recent figure reflects an encouraging increase compared to the 39% recorded in May, and it also successfully surpasses the historical 10-year average of 40%.
3
翻訳参照
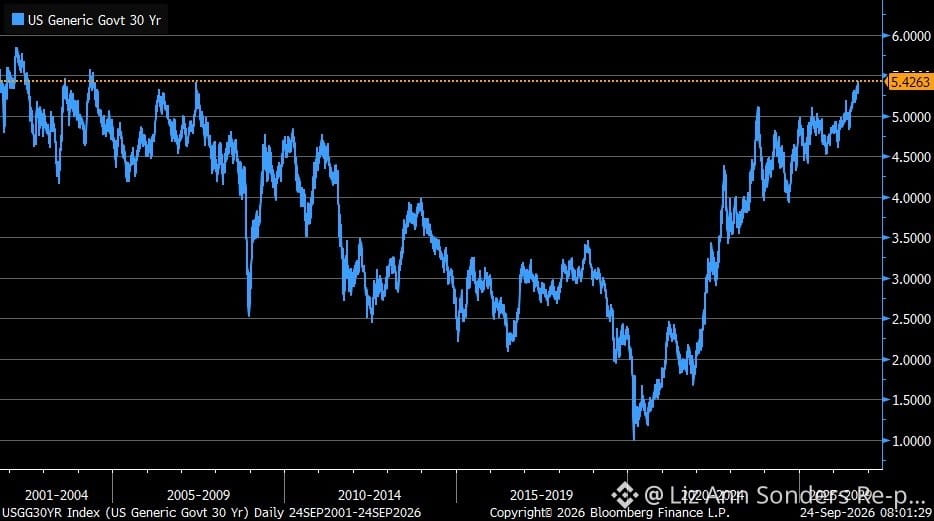
The yield on 30-year Treasury bonds has recently climbed to a peak that we have not witnessed since 2004.
The yield on 30-year Treasury bonds has recently climbed to a peak that we have not witnessed since 2004.
15
翻訳参照
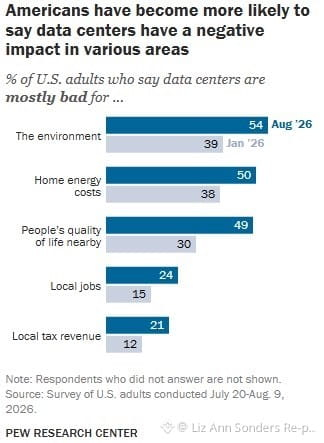
Since the start of the year, public perception in the United States regarding data centers has grown increasingly negative, according to a recent poll conducted by @Pewresearch. The survey findings reveal that at least half of Americans now consider these facilities to be mostly bad, specifically citing their detrimental impact on the environment as well as rising home energy costs.
Since the start of the year, public perception in the United States regarding data centers has grown increasingly negative, according to a recent poll conducted by @Pewresearch. The survey findings reveal that at least half of Americans now consider these facilities to be mostly bad, specifically citing their detrimental impact on the environment as well as rising home energy costs.
2
翻訳参照
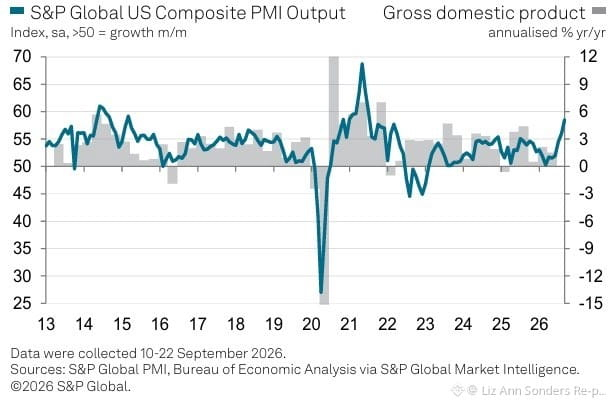
The recent data provided by .@SPGlobalPMI indicates that the US Composite PMI climbed to 58.4 during September. This level of expansion marks a five-year high, a milestone that was largely fueled by robust performance throughout the services sector.
The recent data provided by .@SPGlobalPMI indicates that the US Composite PMI climbed to 58.4 during September. This level of expansion marks a five-year high, a milestone that was largely fueled by robust performance throughout the services sector.
2
翻訳参照
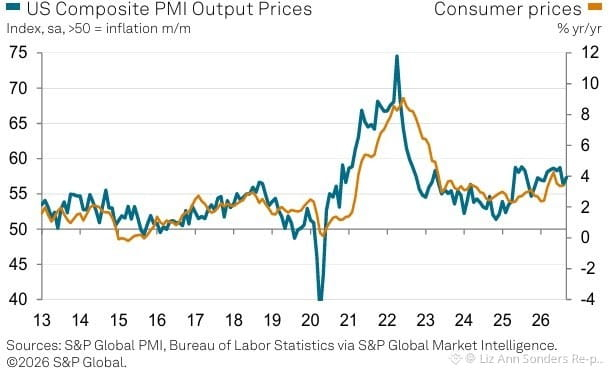
During September, we saw a slight increase in the selling price component of the @SPGlobalPMI US Composite. Despite this recent bump, the figures continue to stay below the higher levels that were documented between March and July.
During September, we saw a slight increase in the selling price component of the @SPGlobalPMI US Composite. Despite this recent bump, the figures continue to stay below the higher levels that were documented between March and July.
1
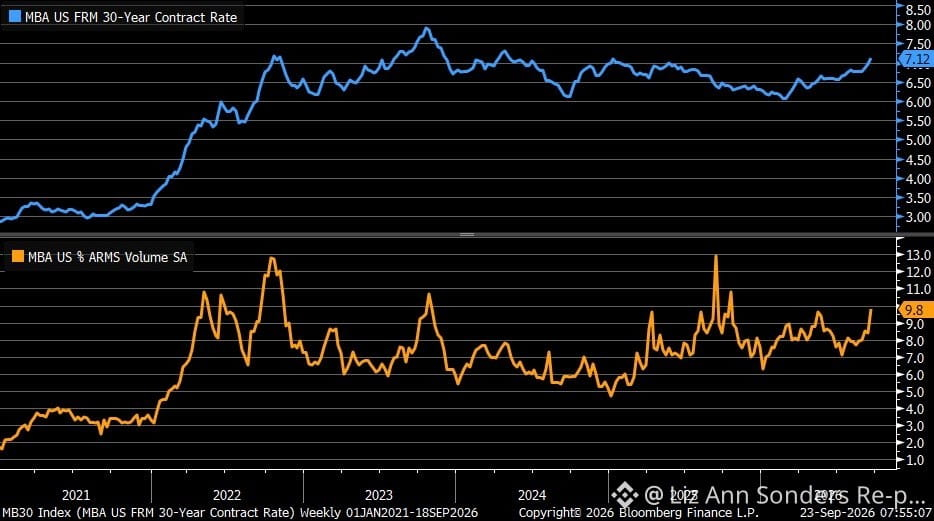
借り手は、最近のARM(変動金利型住宅ローン)取引の増加によって示されるように、より高い財務リスクを引き受ける姿勢を見せています。この目立った住宅購入者の行動の変化は、30年固定の住宅ローン金利が7%の水準を超えて上昇しているのとちょうど同時に進行しています。 @MBAmortgage
借り手は、最近のARM(変動金利型住宅ローン)取引の増加によって示されるように、より高い財務リスクを引き受ける姿勢を見せています。この目立った住宅購入者の行動の変化は、30年固定の住宅ローン金利が7%の水準を超えて上昇しているのとちょうど同時に進行しています。 @MBAmortgage
1
翻訳参照
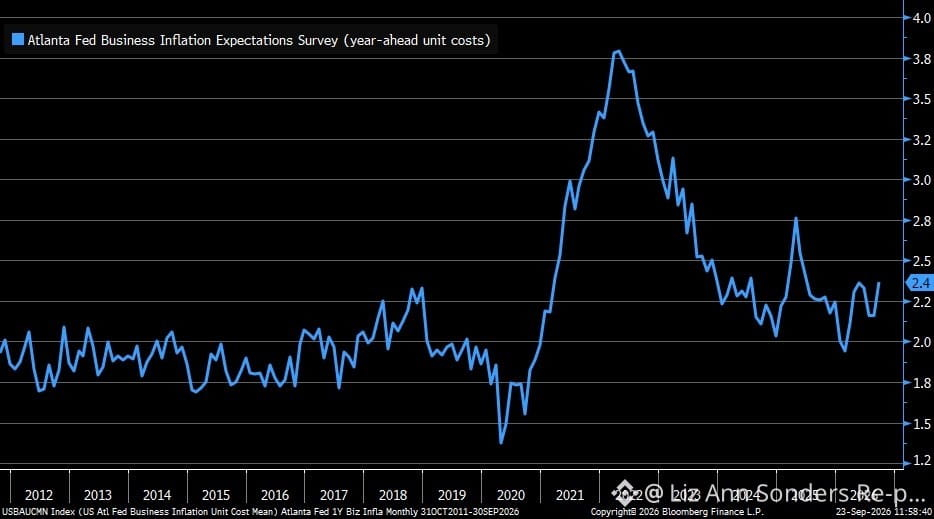
Based on the latest insights from @AtlantaFed, business expectations for inflation over the next year experienced a slight bump in September. The anticipated rate climbed to +2.4%, which is an increase from the previous figure of +2.2%.
Based on the latest insights from @AtlantaFed, business expectations for inflation over the next year experienced a slight bump in September. The anticipated rate climbed to +2.4%, which is an increase from the previous figure of +2.2%.
翻訳参照
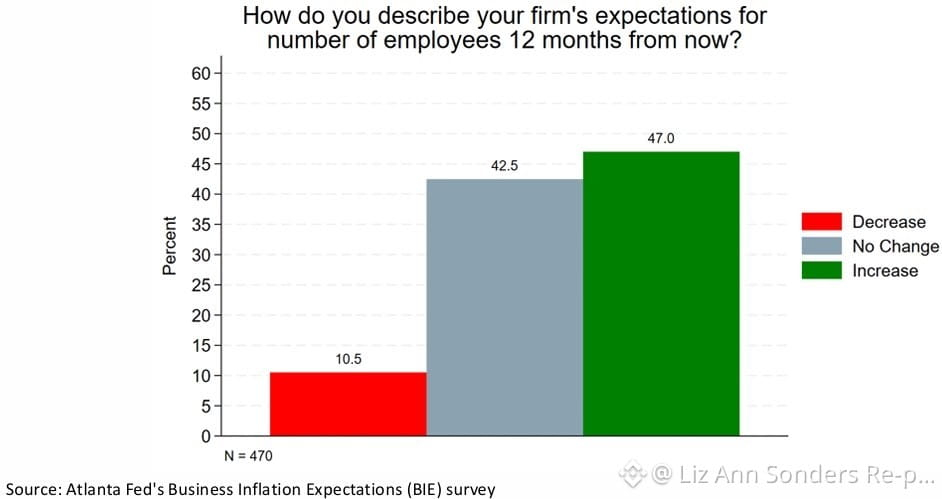
When looking a year into the future, the employment outlook appears quite positive based on recent information from @AtlantaFed. Almost half of all businesses project an expansion of their teams during this timeframe. At the same time, a mere 10% of companies foresee making cuts to their current staff.
When looking a year into the future, the employment outlook appears quite positive based on recent information from @AtlantaFed. Almost half of all businesses project an expansion of their teams during this timeframe. At the same time, a mere 10% of companies foresee making cuts to their current staff.
3
翻訳参照
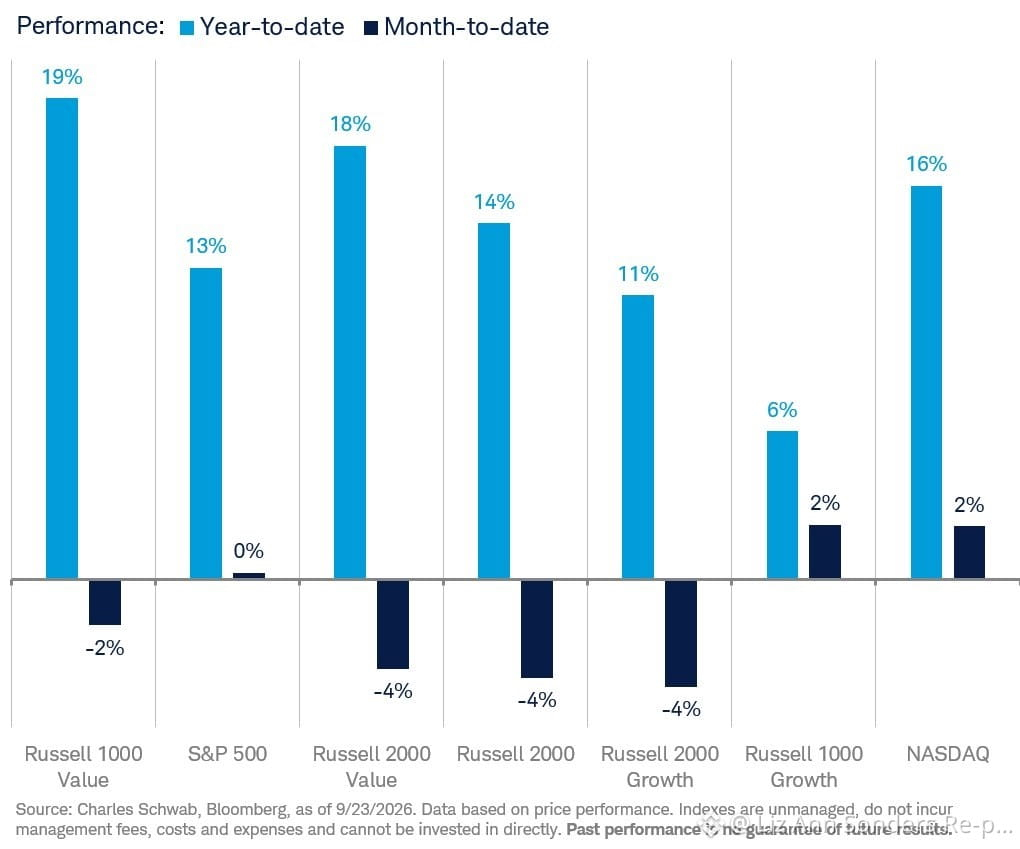
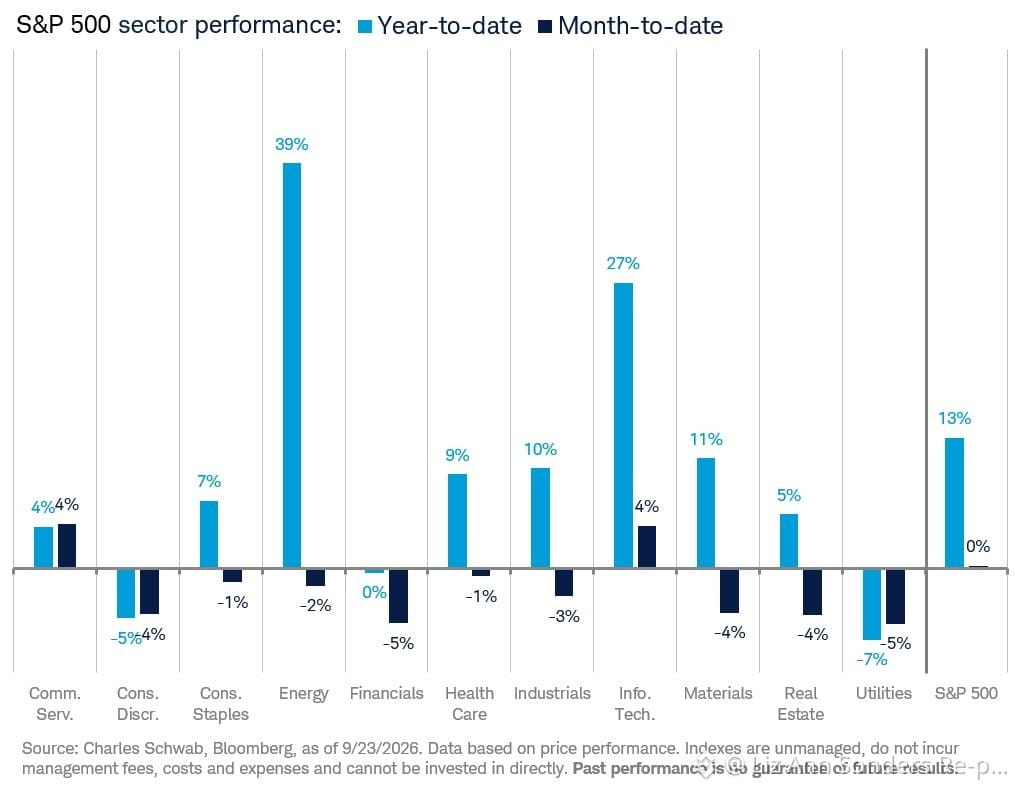
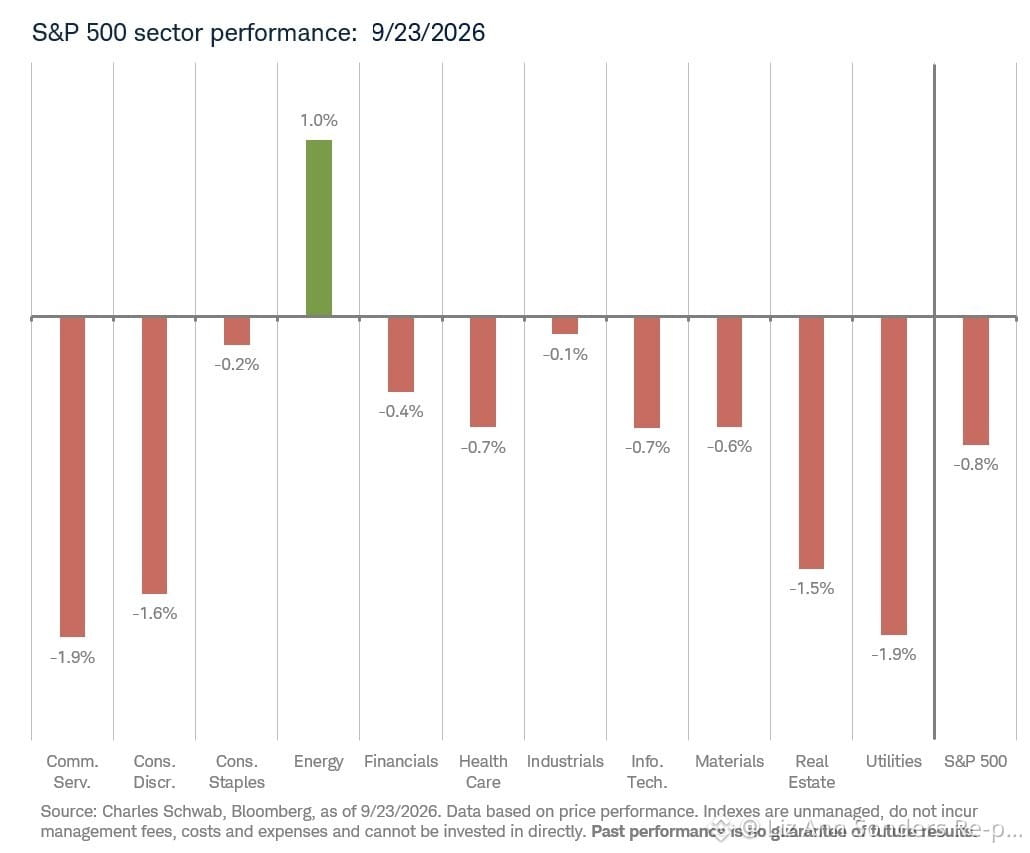
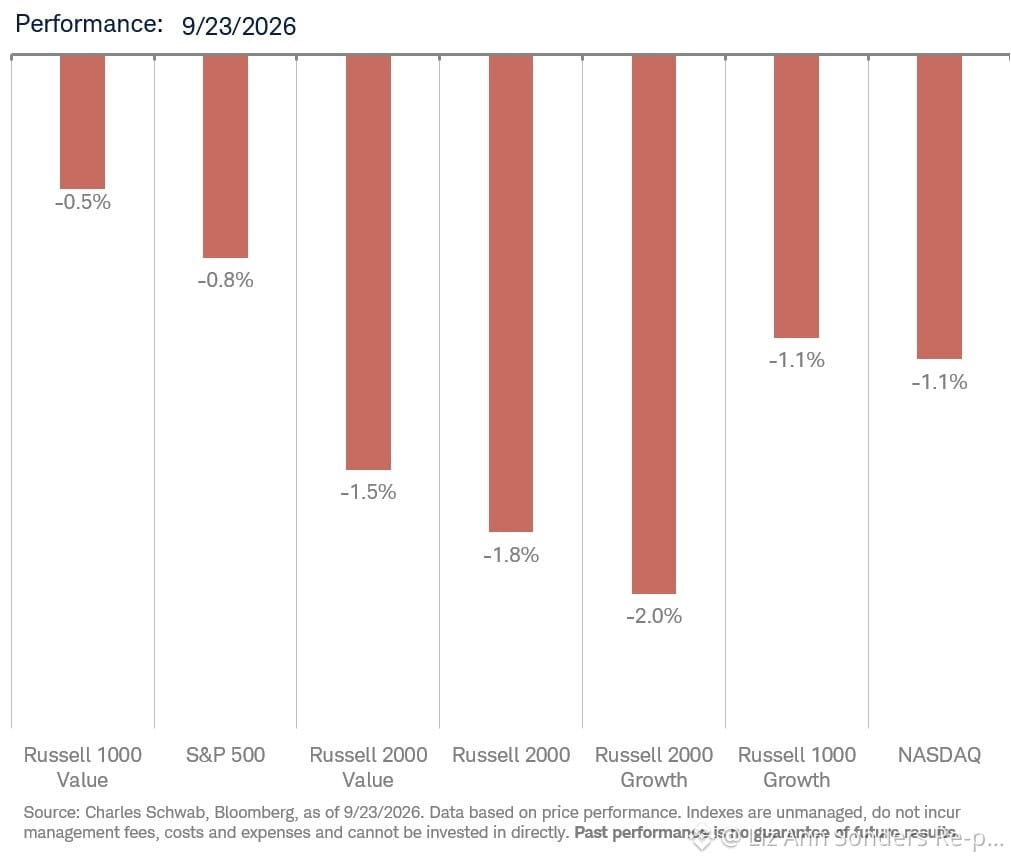
Here is an overview of the performance across various sectors and indexes from yesterday, alongside their MTD and YTD results.
Here is an overview of the performance across various sectors and indexes from yesterday, alongside their MTD and YTD results.
2
28
翻訳参照
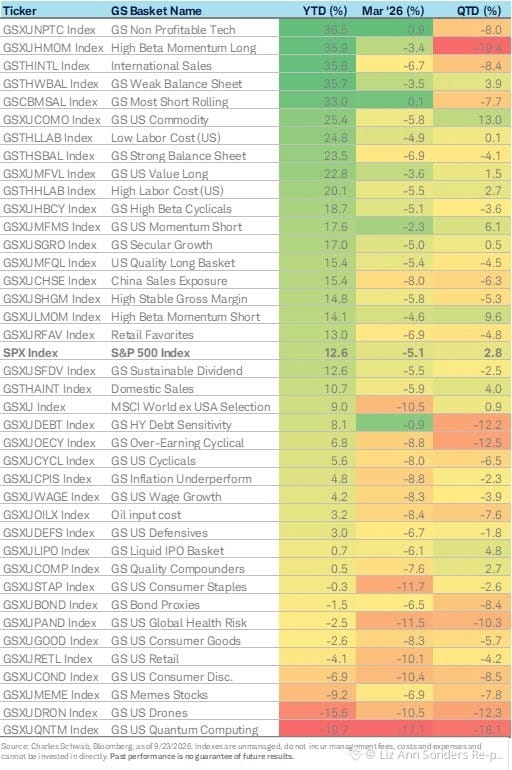
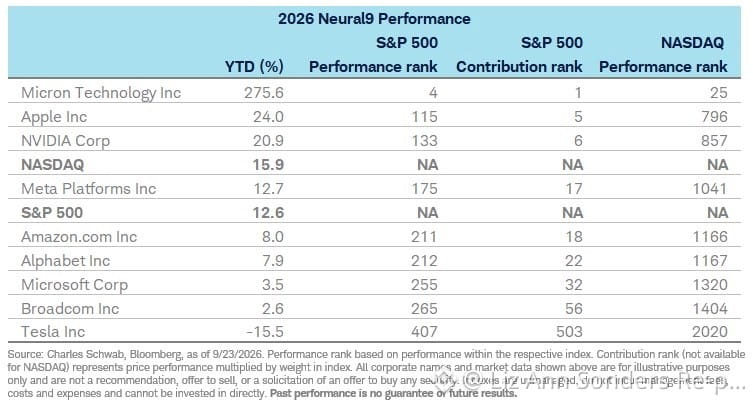
Here is the visual graph and corresponding data table for Neural9.
Here is the visual graph and corresponding data table for Neural9.
28
翻訳参照
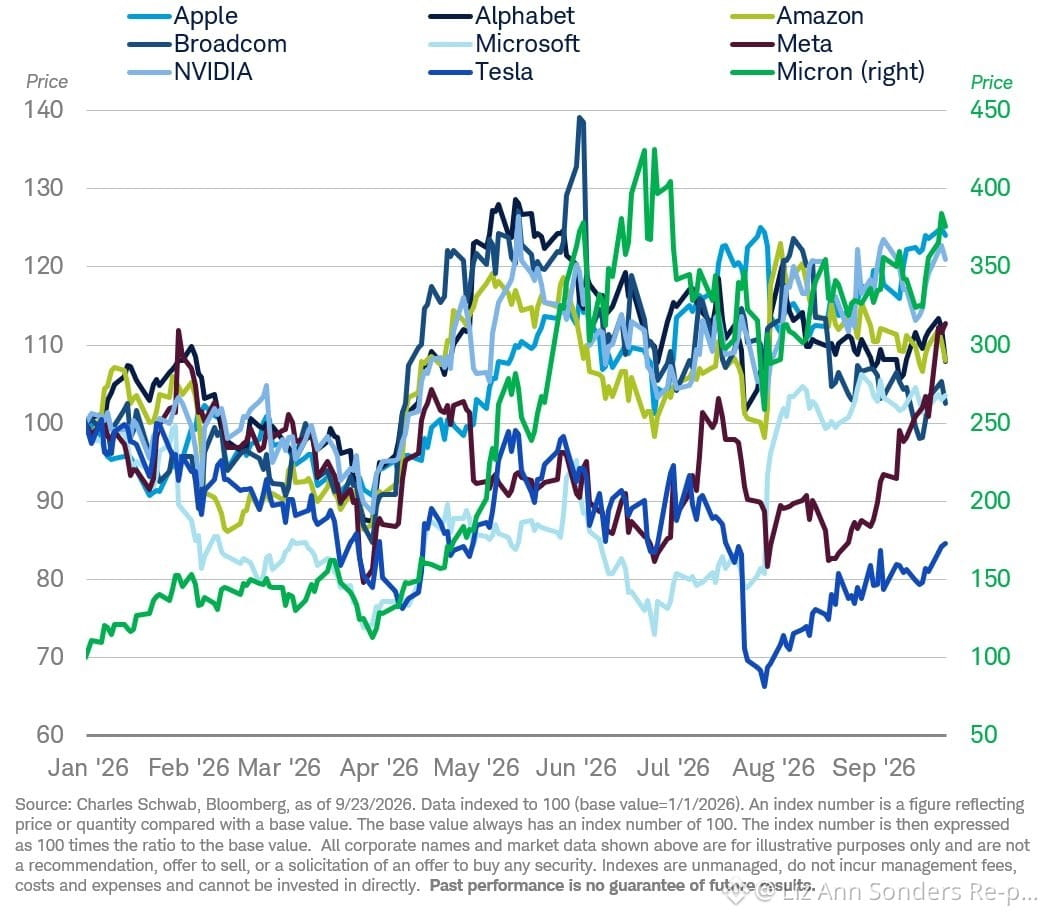
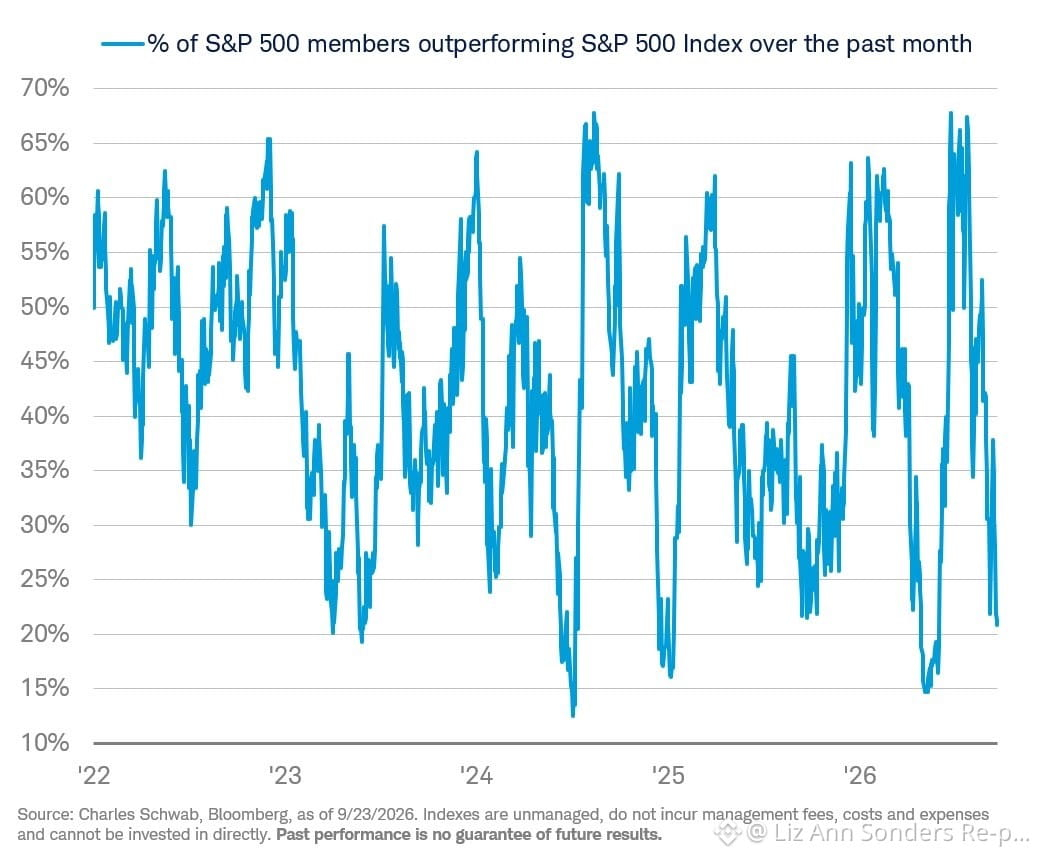
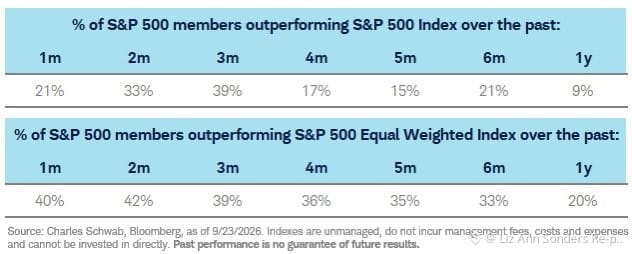
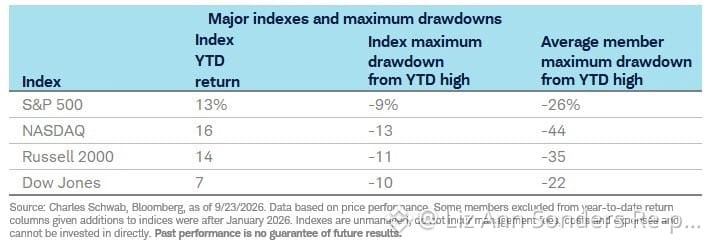
An overview of index declines and the percentage of outperformance
An overview of index declines and the percentage of outperformance
54
さまざまな市場セクターにおいて、4週間および52週間のピークに到達した株式の割合を見てみると、現在どの領域でもゼロが大量に表示されていることに気づくでしょう。
さまざまな市場セクターにおいて、4週間および52週間のピークに到達した株式の割合を見てみると、現在どの領域でもゼロが大量に表示されていることに気づくでしょう。
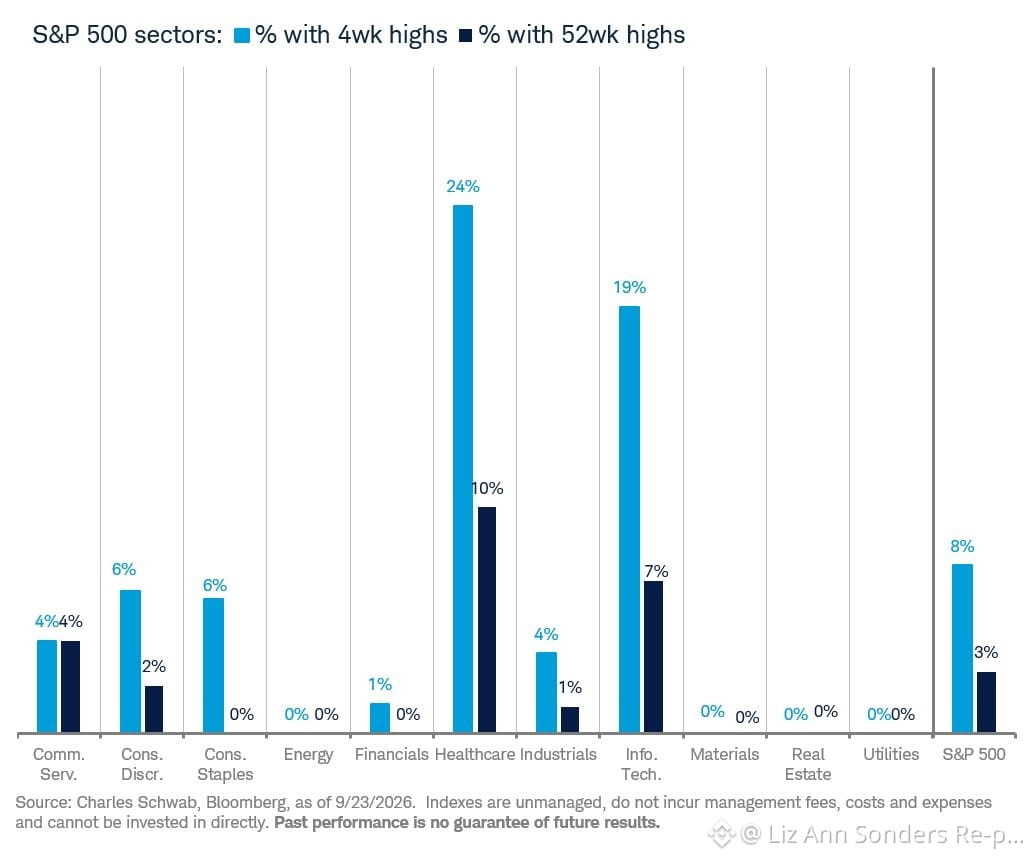
60
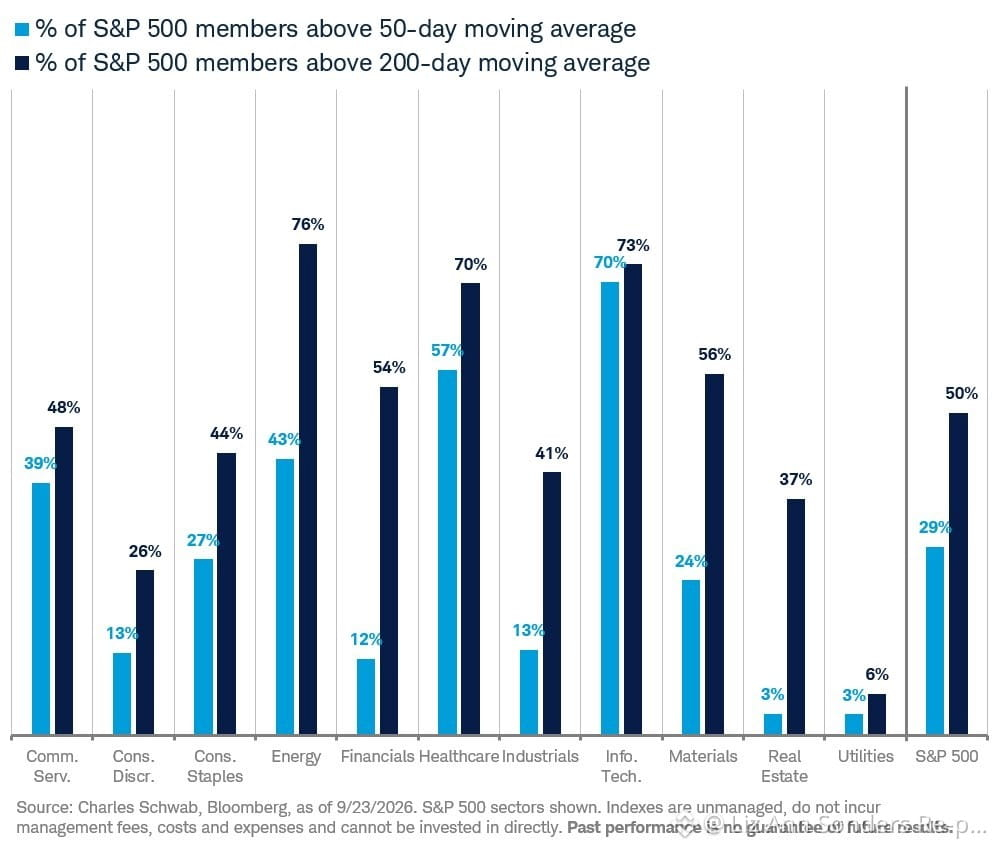
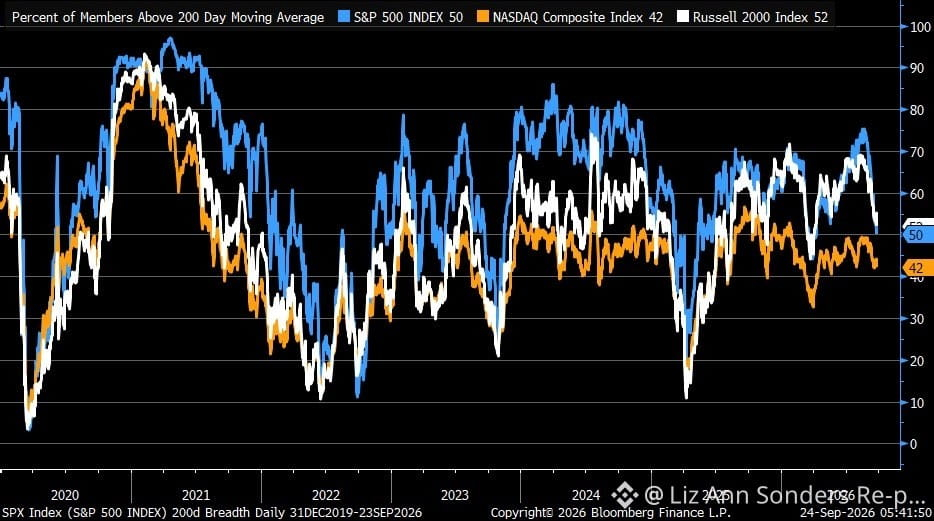
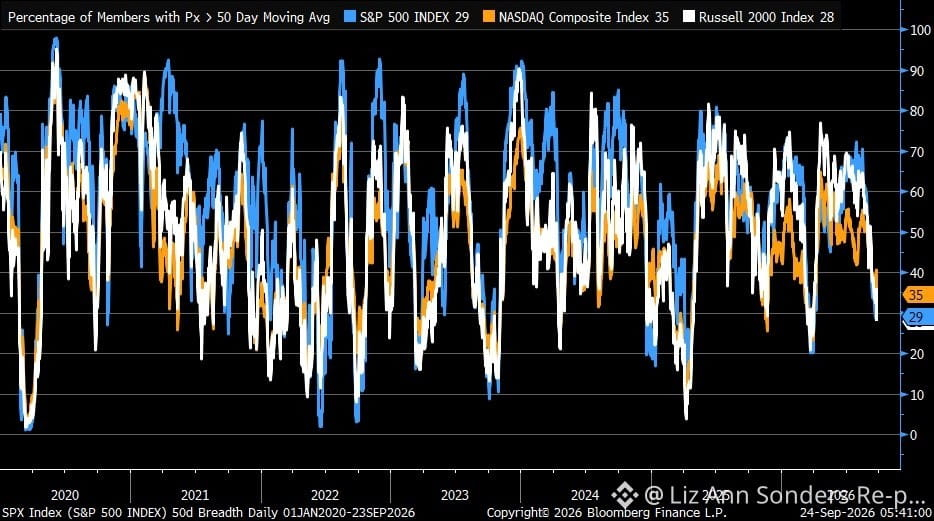
65
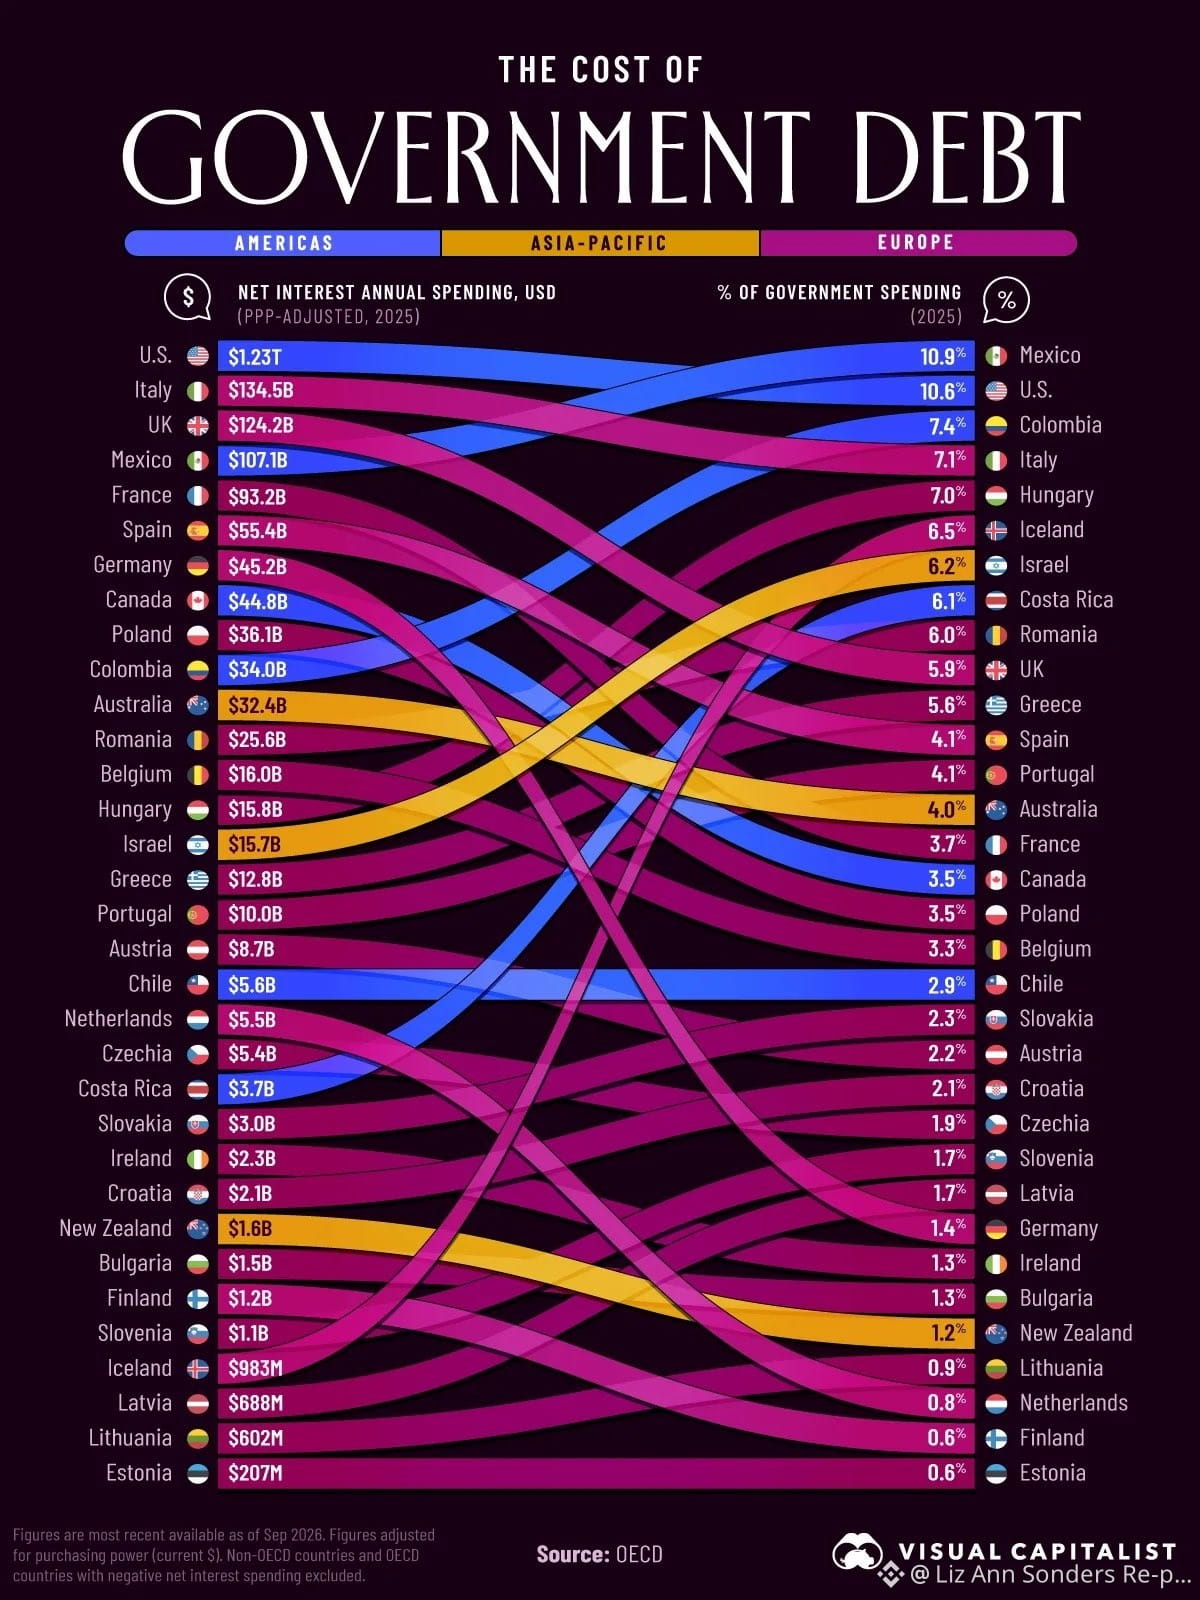
現在、米国に加えて多くの国々が重大な利払い負担に直面しています。@OECDを見てみると、利息費用に充てられる公的資金の割合は大きく変動しており、借入金利や負債が各国の予算に与える影響の特異性が浮き彫りになります。この状況を示すために、@VisualCapによる可視化が、世界各地で政府債務を管理する際の財政的負担を対比しています。この比較は、OECDが公表した最新の情報に基づいています。国境を越えた公平性を確保するため、すべてのドル額は購買力の違いを補正するように変更しており、データは2025年、または直近で記録された年のものを用いています。
現在、米国に加えて多くの国々が重大な利払い負担に直面しています。@OECDを見てみると、利息費用に充てられる公的資金の割合は大きく変動しており、借入金利や負債が各国の予算に与える影響の特異性が浮き彫りになります。この状況を示すために、@VisualCapによる可視化が、世界各地で政府債務を管理する際の財政的負担を対比しています。この比較は、OECDが公表した最新の情報に基づいています。国境を越えた公平性を確保するため、すべてのドル額は購買力の違いを補正するように変更しており、データは2025年、または直近で記録された年のものを用いています。
5
本人確認中
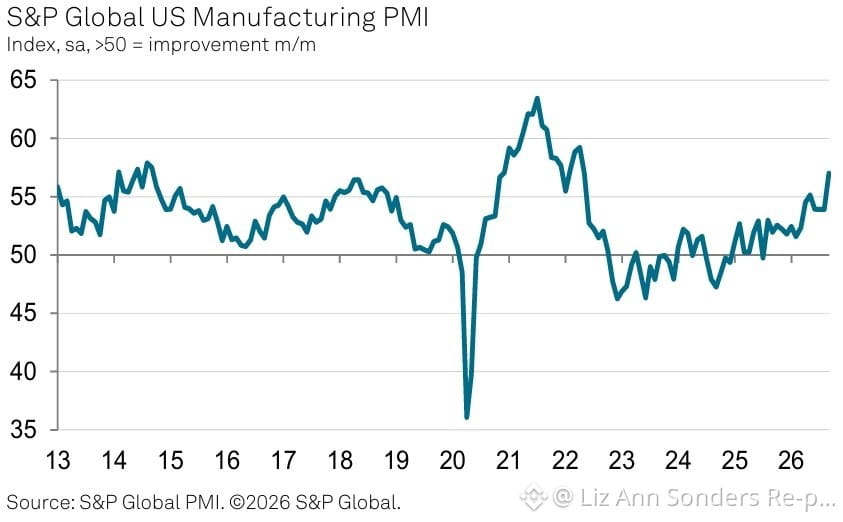
@SPGlobalPMIが9月分として提供した最新の米国の経済指標を見てみましょう。米国の製造業指数は57.0まで上昇し、予想されていた53.7および前回の53.9を上回りました。サービス業のPMIも増加し、推定の55.8およびそれ以前の56.5と比べて58.7となりました。その結果、コンポジットPMIは58.4に進み、見込まれていた55.3や前回の56.0を大きく上回る動きとなりました。
@SPGlobalPMIが9月分として提供した最新の米国の経済指標を見てみましょう。米国の製造業指数は57.0まで上昇し、予想されていた53.7および前回の53.9を上回りました。サービス業のPMIも増加し、推定の55.8およびそれ以前の56.5と比べて58.7となりました。その結果、コンポジットPMIは58.4に進み、見込まれていた55.3や前回の56.0を大きく上回る動きとなりました。
1
1.3k
ログインして、さらにコンテンツを読む
厳選トピックで世界の暗号資産トレーダーの仲間入り
⚡️ 暗号資産に関する最新かつ有益な情報が見つかります。
💬 世界最大の暗号資産取引所から信頼されています。
👍 認証を受けたクリエイターから、有益なインサイトを得られます。
メール / 電話番号
トレンドトピック
CFTCUpdatesGuidanceOnTokenizedAssets
閲覧回数 615
54人が討論中
#CFTCUpdatesGuidanceOnTokenizedAssets CFTCは、暗号資産およびブロックチェーン技術に関するFAQを更新し、顧客資金としての認められた投資のトークン化形式の利用や、一定の記録管理要件におけるブロックチェーン技術の利用に対応しました。
今回の更新は、トークン化された担保およびマージン担保として受け入れられるデジタル資産を扱った、これまでのCFTCのガイダンスを発展させ、市場参加者に対するさらなる規制上の明確性を追加するものです。
#CFTC #TokenizedAssets #RWA #RealWorldAssets #Tokenization #Crypto #CryptoNews #Blockchain #DigitalAssets #DeFi #Web3 #Finance $RWA
Arsalan Official
·いいね:1件
·閲覧回数 12
BitgetSays$352MAffectedInHack
閲覧回数 49
3人が討論中
BinanceWillListHyperliquid(HYPE)
閲覧回数 155,745
2,627人が討論中