

Harvey Lill Yxh9
130 投稿

Harvey Lill Yxh9
報告
ユーザーをブロック
Публікую актуальні дропи Binance, на яких заробляю.Спілкуємось та ділимось темками ми в каналі cryptohornettg
取引を発注

BNBホルダー
高頻度トレーダー
2.7年
22 フォロー
126 フォロワー
541 いいね
投稿
ポートフォリオ
従来の市場では、株式の売却はT+1決済となる場合があります。Binanceは、bStocksについて通常1秒未満で決済される商品だと説明しています。
実用上のメリットは明らかです。約定後、取引が完了したことを確認するために次の決済日まで待つ必要がありません。これにより、資金管理がスピードアップします。
しかし、即時決済でも次の3つは変わりません。
1. 企業の価値が下がることがあります。
2. スプレッドによって、エントリーや決済のコストが高くなることがあります。
3. 資金移動の速さで、分析の甘さを補うことはできません。
技術的な優位性が答えるのは、「取引がいつ完了するのか」という問いです。投資の根拠が答えるのは、別の問い――「そもそも、なぜこのエクスポージャーに意味があるのか」です。
この2つの論点は混同しないほうがよいでしょう。
従来の市場では、株式の売却はT+1決済となる場合があります。Binanceは、bStocksについて通常1秒未満で決済される商品だと説明しています。
実用上のメリットは明らかです。約定後、取引が完了したことを確認するために次の決済日まで待つ必要がありません。これにより、資金管理がスピードアップします。
しかし、即時決済でも次の3つは変わりません。
1. 企業の価値が下がることがあります。
2. スプレッドによって、エントリーや決済のコストが高くなることがあります。
3. 資金移動の速さで、分析の甘さを補うことはできません。
技術的な優位性が答えるのは、「取引がいつ完了するのか」という問いです。投資の根拠が答えるのは、別の問い――「そもそも、なぜこのエクスポージャーに意味があるのか」です。
この2つの論点は混同しないほうがよいでしょう。
実用上のメリットは明らかです。約定後、取引が完了したことを確認するために次の決済日まで待つ必要がありません。これにより、資金管理がスピードアップします。
しかし、即時決済でも次の3つは変わりません。
1. 企業の価値が下がることがあります。
2. スプレッドによって、エントリーや決済のコストが高くなることがあります。
3. 資金移動の速さで、分析の甘さを補うことはできません。
技術的な優位性が答えるのは、「取引がいつ完了するのか」という問いです。投資の根拠が答えるのは、別の問い――「そもそも、なぜこのエクスポージャーに意味があるのか」です。
この2つの論点は混同しないほうがよいでしょう。
1
119
2人のトレーダーが同じ指値価格を設定しているが、意図が異なる。
1人目はできるだけ早い約定を望み、既存の流動性をすぐに取りに行く準備ができている。
2人目は、自分の注文がまずメイカーとして注文帳(オーダーブック)に入ることを望む。そのために Post-Only がある。つまり、注文はすでに存在する注文に対して即座に約定してはならない。
利点は、約定タイプとメイカー手数料のコントロールができること。妥協点は、取引が成立しないまま市場が動く可能性があることだ。
TradFi Perp では、「今すぐポジションを確実に得ること」よりも「緊急性に対して過払いしないこと」の方が重要な場合にのみ、私は Post-Only を選ぶだろう。
「より良い」フラグはない。問いに対して正直に答えるだけだ:私は流動性を提供しているのか、それとも奪っているのか?
2人のトレーダーが同じ指値価格を設定しているが、意図が異なる。
1人目はできるだけ早い約定を望み、既存の流動性をすぐに取りに行く準備ができている。
2人目は、自分の注文がまずメイカーとして注文帳(オーダーブック)に入ることを望む。そのために Post-Only がある。つまり、注文はすでに存在する注文に対して即座に約定してはならない。
利点は、約定タイプとメイカー手数料のコントロールができること。妥協点は、取引が成立しないまま市場が動く可能性があることだ。
TradFi Perp では、「今すぐポジションを確実に得ること」よりも「緊急性に対して過払いしないこと」の方が重要な場合にのみ、私は Post-Only を選ぶだろう。
「より良い」フラグはない。問いに対して正直に答えるだけだ:私は流動性を提供しているのか、それとも奪っているのか?
1人目はできるだけ早い約定を望み、既存の流動性をすぐに取りに行く準備ができている。
2人目は、自分の注文がまずメイカーとして注文帳(オーダーブック)に入ることを望む。そのために Post-Only がある。つまり、注文はすでに存在する注文に対して即座に約定してはならない。
利点は、約定タイプとメイカー手数料のコントロールができること。妥協点は、取引が成立しないまま市場が動く可能性があることだ。
TradFi Perp では、「今すぐポジションを確実に得ること」よりも「緊急性に対して過払いしないこと」の方が重要な場合にのみ、私は Post-Only を選ぶだろう。
「より良い」フラグはない。問いに対して正直に答えるだけだ:私は流動性を提供しているのか、それとも奪っているのか?
261
小さな学習用ケース。
1年目:会社は1億ドルを稼ぎ、1億株の株式を持っていました。EPS = 1ドル。
2年目:利益は1億1,000万ドルに増えましたが、オプションと新規発行の後の株式数は1億1,500万株まで増えました。希薄化後EPSはすでに約0.96ドルです。
総利益は10%増加した一方で、1株あたりに割り当てられる利益の割合は減少しました。
そのため、bStockを評価する前に、純利益だけでなく、平均および希薄化後の株式数も確認します。バイバックは分母を縮める可能性があり、ストックベースの報酬や増資は分母を増やし得ます。
保有者にとって、価値がどれだけ伸びたかだけでなく、そのパイが何分に分けられたかも重要です。
#bStocks
小さな学習用ケース。
1年目:会社は1億ドルを稼ぎ、1億株の株式を持っていました。EPS = 1ドル。
2年目:利益は1億1,000万ドルに増えましたが、オプションと新規発行の後の株式数は1億1,500万株まで増えました。希薄化後EPSはすでに約0.96ドルです。
総利益は10%増加した一方で、1株あたりに割り当てられる利益の割合は減少しました。
そのため、bStockを評価する前に、純利益だけでなく、平均および希薄化後の株式数も確認します。バイバックは分母を縮める可能性があり、ストックベースの報酬や増資は分母を増やし得ます。
保有者にとって、価値がどれだけ伸びたかだけでなく、そのパイが何分に分けられたかも重要です。
#bStocks
1年目:会社は1億ドルを稼ぎ、1億株の株式を持っていました。EPS = 1ドル。
2年目:利益は1億1,000万ドルに増えましたが、オプションと新規発行の後の株式数は1億1,500万株まで増えました。希薄化後EPSはすでに約0.96ドルです。
総利益は10%増加した一方で、1株あたりに割り当てられる利益の割合は減少しました。
そのため、bStockを評価する前に、純利益だけでなく、平均および希薄化後の株式数も確認します。バイバックは分母を縮める可能性があり、ストックベースの報酬や増資は分母を増やし得ます。
保有者にとって、価値がどれだけ伸びたかだけでなく、そのパイが何分に分けられたかも重要です。
#bStocks
145
20ドルのキャンペーンが、200ドルのキャンペーンより必ずしも安いとは限りません。
2つの会社を想像してみましょう:
• 会社A:株価 — $20、発行済み株式数 50億株。時価総額 — $1000億。
• 会社B:株価 — $200、発行済み株式数 1億株。時価総額 — $200億。
1株あたりの価格だけを見ると、Aのほうが10倍安く見えます。ビジネス全体の価値(時価総額)では、Aのほうが5倍大きい。
そのためbStockを分析するとき、トークンの価格だけを見ているわけではありません。最低限必要なのは、発行済み株式数(流通量)、時価総額、利益、そして会社の負債です。
少額からのアクセスにより参入はしやすくなりますが、低い額面価格が有利な評価に変わるわけではありません。
20ドルのキャンペーンが、200ドルのキャンペーンより必ずしも安いとは限りません。
2つの会社を想像してみましょう:
• 会社A:株価 — $20、発行済み株式数 50億株。時価総額 — $1000億。
• 会社B:株価 — $200、発行済み株式数 1億株。時価総額 — $200億。
1株あたりの価格だけを見ると、Aのほうが10倍安く見えます。ビジネス全体の価値(時価総額)では、Aのほうが5倍大きい。
そのためbStockを分析するとき、トークンの価格だけを見ているわけではありません。最低限必要なのは、発行済み株式数(流通量)、時価総額、利益、そして会社の負債です。
少額からのアクセスにより参入はしやすくなりますが、低い額面価格が有利な評価に変わるわけではありません。
2つの会社を想像してみましょう:
• 会社A:株価 — $20、発行済み株式数 50億株。時価総額 — $1000億。
• 会社B:株価 — $200、発行済み株式数 1億株。時価総額 — $200億。
1株あたりの価格だけを見ると、Aのほうが10倍安く見えます。ビジネス全体の価値(時価総額)では、Aのほうが5倍大きい。
そのためbStockを分析するとき、トークンの価格だけを見ているわけではありません。最低限必要なのは、発行済み株式数(流通量)、時価総額、利益、そして会社の負債です。
少額からのアクセスにより参入はしやすくなりますが、低い額面価格が有利な評価に変わるわけではありません。
117
1回の取引で、財務リスクを残したままではありますが、運用上の複雑さを取り除くことができます。
TermMaxでは、レバレッジャーが初期拠出に加えてフラッシュローンを組み合わせ、追加の担保を購入し、それをGearing Tokenの中にロックし、得られたFT/XTの仕組みを使ってフラッシュローンを返済できます—これらを1つの取引の中で完結します。
これは、手作業で次のようにループするのとは本質的に異なります:
deposit collateral → borrow → swap → redeposit → borrow again.
取引回数を減らすことで、実行時の摩擦や、複数ステップのポジションを不完全なまま残してしまう可能性を下げられます。しかし最終的なGTは、レバレッジされた担保と債務を引き続き記録します。担保価値が十分に下落すれば、清算リスクは残ります。
そのため、ワンクリックのレバレッジは2つの別々のチェックリストで評価します:
実行:ルート、スリッページ、ガス、そして最低受領額。
ポジション:レバレッジ、LTVバッファ、LLTV、オラクルリスク、満期。
フラッシュローンは“建設用の道具”であり、恒久的な無担保債務ではありません。それは取引の中で消滅します。レバレッジされたエクスポージャーは消えません。
参照元を確認:TermMax Docs — Leverager; Token.
@termmax #TermMax
1回の取引で、財務リスクを残したままではありますが、運用上の複雑さを取り除くことができます。
TermMaxでは、レバレッジャーが初期拠出に加えてフラッシュローンを組み合わせ、追加の担保を購入し、それをGearing Tokenの中にロックし、得られたFT/XTの仕組みを使ってフラッシュローンを返済できます—これらを1つの取引の中で完結します。
これは、手作業で次のようにループするのとは本質的に異なります:
deposit collateral → borrow → swap → redeposit → borrow again.
取引回数を減らすことで、実行時の摩擦や、複数ステップのポジションを不完全なまま残してしまう可能性を下げられます。しかし最終的なGTは、レバレッジされた担保と債務を引き続き記録します。担保価値が十分に下落すれば、清算リスクは残ります。
そのため、ワンクリックのレバレッジは2つの別々のチェックリストで評価します:
実行:ルート、スリッページ、ガス、そして最低受領額。
ポジション:レバレッジ、LTVバッファ、LLTV、オラクルリスク、満期。
フラッシュローンは“建設用の道具”であり、恒久的な無担保債務ではありません。それは取引の中で消滅します。レバレッジされたエクスポージャーは消えません。
参照元を確認:TermMax Docs — Leverager; Token.
@TermMax #TermMax
TermMaxでは、レバレッジャーが初期拠出に加えてフラッシュローンを組み合わせ、追加の担保を購入し、それをGearing Tokenの中にロックし、得られたFT/XTの仕組みを使ってフラッシュローンを返済できます—これらを1つの取引の中で完結します。
これは、手作業で次のようにループするのとは本質的に異なります:
deposit collateral → borrow → swap → redeposit → borrow again.
取引回数を減らすことで、実行時の摩擦や、複数ステップのポジションを不完全なまま残してしまう可能性を下げられます。しかし最終的なGTは、レバレッジされた担保と債務を引き続き記録します。担保価値が十分に下落すれば、清算リスクは残ります。
そのため、ワンクリックのレバレッジは2つの別々のチェックリストで評価します:
実行:ルート、スリッページ、ガス、そして最低受領額。
ポジション:レバレッジ、LTVバッファ、LLTV、オラクルリスク、満期。
フラッシュローンは“建設用の道具”であり、恒久的な無担保債務ではありません。それは取引の中で消滅します。レバレッジされたエクスポージャーは消えません。
参照元を確認:TermMax Docs — Leverager; Token.
@TermMax #TermMax

1
100
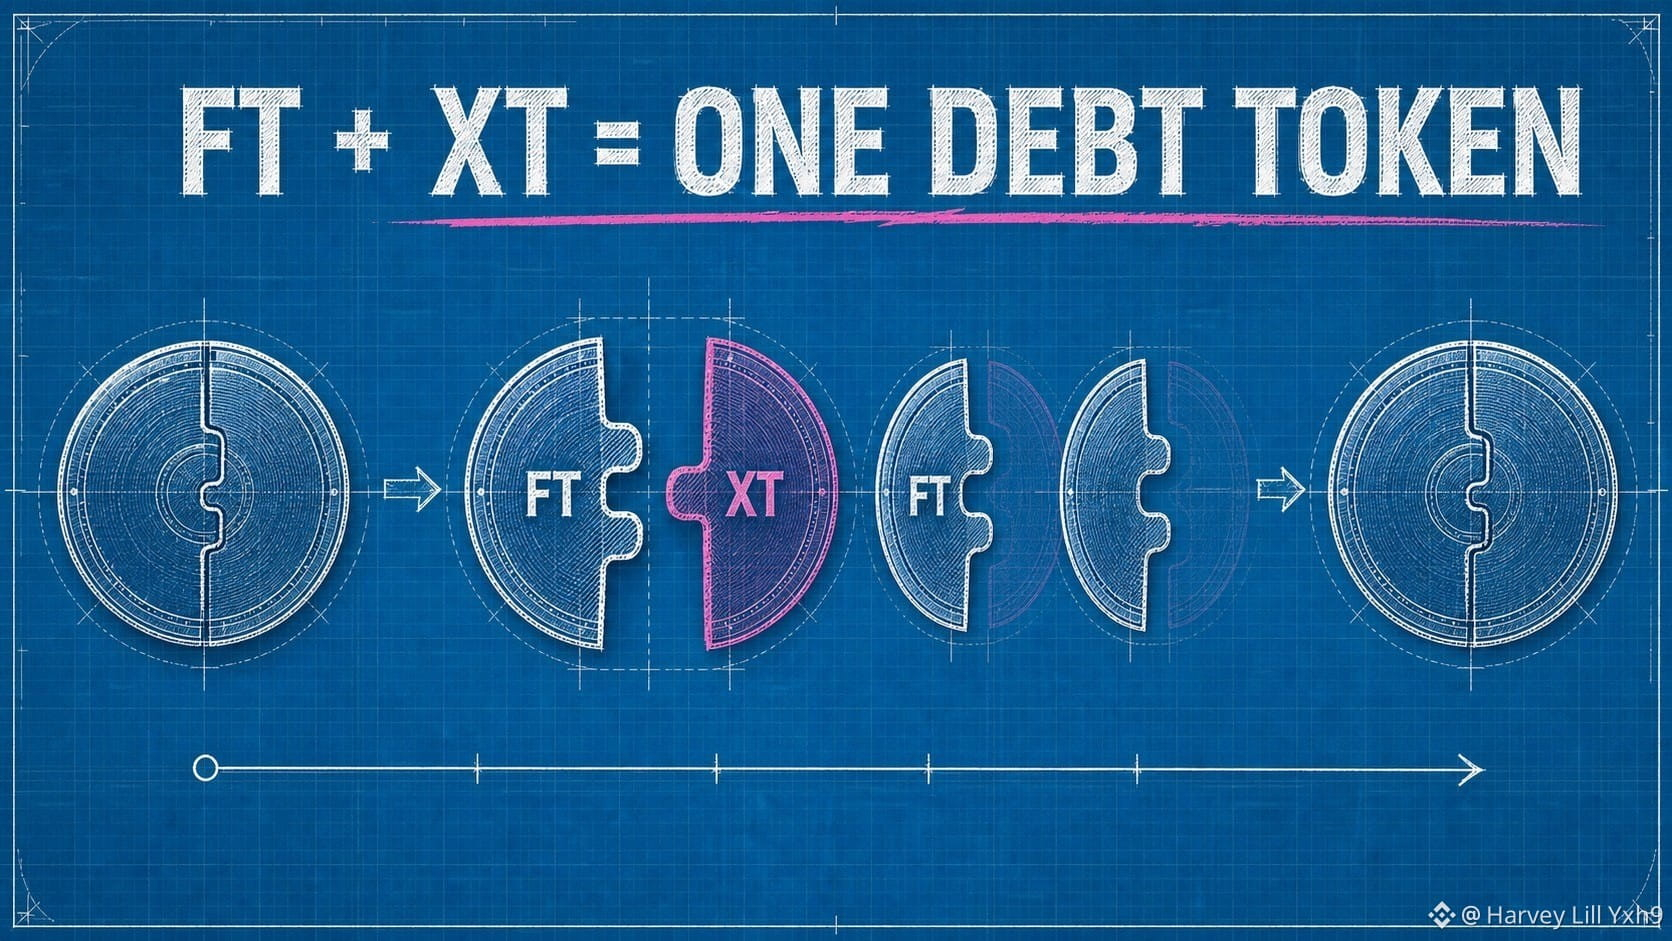
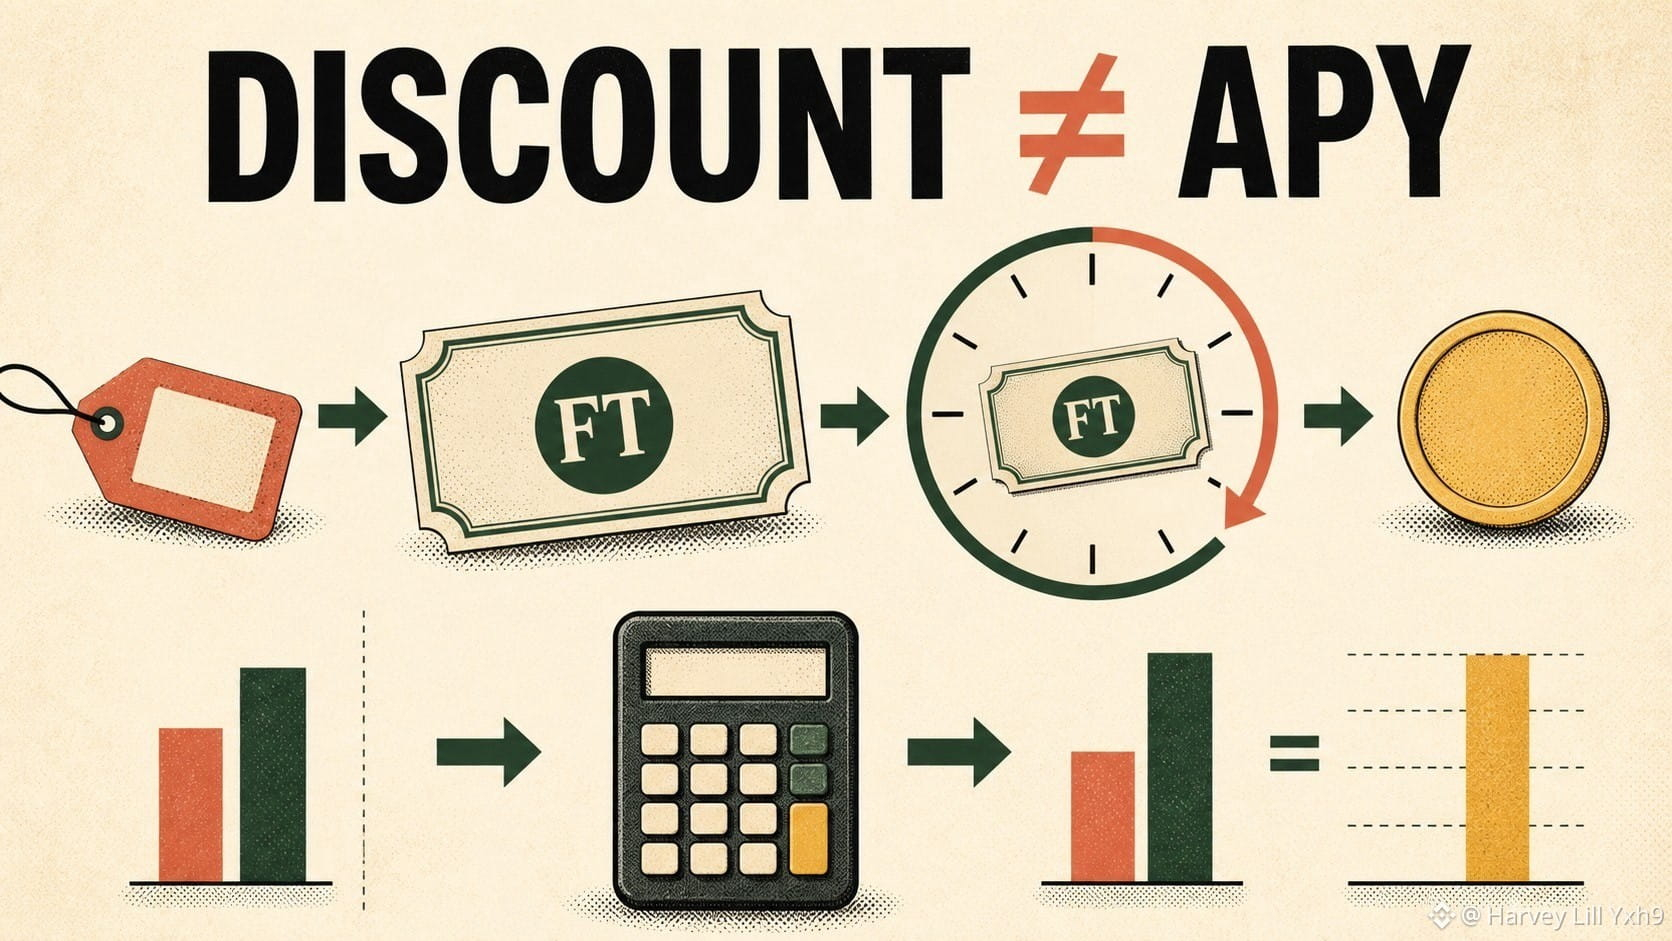
最も役に立つ TermMax の方程式は APY ではありません。これは貸借対照表の恒等式です:
PV(FT) + PV(XT) = 1 つの負債トークン。
FT は、満期時に 1 つの負債トークンへ向かって移行する固定請求権です。XT は補完的な利息成分を表します。満期が近づくにつれて、FT の請求権はその償還価値に収束し、XT はゼロへ近づきます。
仮のスナップショット:
• FT の現在価値:0.94;
• XT の現在価値:0.06;
• 合算値:1.00 つの負債トークン。
この分解により、複数のプロダクト画面の説明が一度にできます。貸し手は FT を割引価格で積み増します。借り手は将来の義務を発行します。AMM は、満期請求権と残余成分の間の分割を価格付けします。
また、FT の価格と APY が逆方向に動く理由も説明します。同じ 1 単位の満期請求権が今日より高価になれば、残りの利回りは小さくなります。
私の頭の中のモデルはシンプルです。TermMax はどこからともなく利回りを作り出しません。将来の負債支払いを受け取るのが誰か、そしてその現在価値が今日どのように価格付けされるかをトークン化するだけです。
参照元で確認済み:TermMax Docs — Token; Fixed Rate Tokenization.
@termmax #TermMax
最も役に立つ TermMax の方程式は APY ではありません。これは貸借対照表の恒等式です:
PV(FT) + PV(XT) = 1 つの負債トークン。
FT は、満期時に 1 つの負債トークンへ向かって移行する固定請求権です。XT は補完的な利息成分を表します。満期が近づくにつれて、FT の請求権はその償還価値に収束し、XT はゼロへ近づきます。
仮のスナップショット:
• FT の現在価値:0.94;
• XT の現在価値:0.06;
• 合算値:1.00 つの負債トークン。
この分解により、複数のプロダクト画面の説明が一度にできます。貸し手は FT を割引価格で積み増します。借り手は将来の義務を発行します。AMM は、満期請求権と残余成分の間の分割を価格付けします。
また、FT の価格と APY が逆方向に動く理由も説明します。同じ 1 単位の満期請求権が今日より高価になれば、残りの利回りは小さくなります。
私の頭の中のモデルはシンプルです。TermMax はどこからともなく利回りを作り出しません。将来の負債支払いを受け取るのが誰か、そしてその現在価値が今日どのように価格付けされるかをトークン化するだけです。
参照元で確認済み:TermMax Docs — Token; Fixed Rate Tokenization.
@TermMax #TermMax
PV(FT) + PV(XT) = 1 つの負債トークン。
FT は、満期時に 1 つの負債トークンへ向かって移行する固定請求権です。XT は補完的な利息成分を表します。満期が近づくにつれて、FT の請求権はその償還価値に収束し、XT はゼロへ近づきます。
仮のスナップショット:
• FT の現在価値:0.94;
• XT の現在価値:0.06;
• 合算値:1.00 つの負債トークン。
この分解により、複数のプロダクト画面の説明が一度にできます。貸し手は FT を割引価格で積み増します。借り手は将来の義務を発行します。AMM は、満期請求権と残余成分の間の分割を価格付けします。
また、FT の価格と APY が逆方向に動く理由も説明します。同じ 1 単位の満期請求権が今日より高価になれば、残りの利回りは小さくなります。
私の頭の中のモデルはシンプルです。TermMax はどこからともなく利回りを作り出しません。将来の負債支払いを受け取るのが誰か、そしてその現在価値が今日どのように価格付けされるかをトークン化するだけです。
参照元で確認済み:TermMax Docs — Token; Fixed Rate Tokenization.
@TermMax #TermMax
3
110
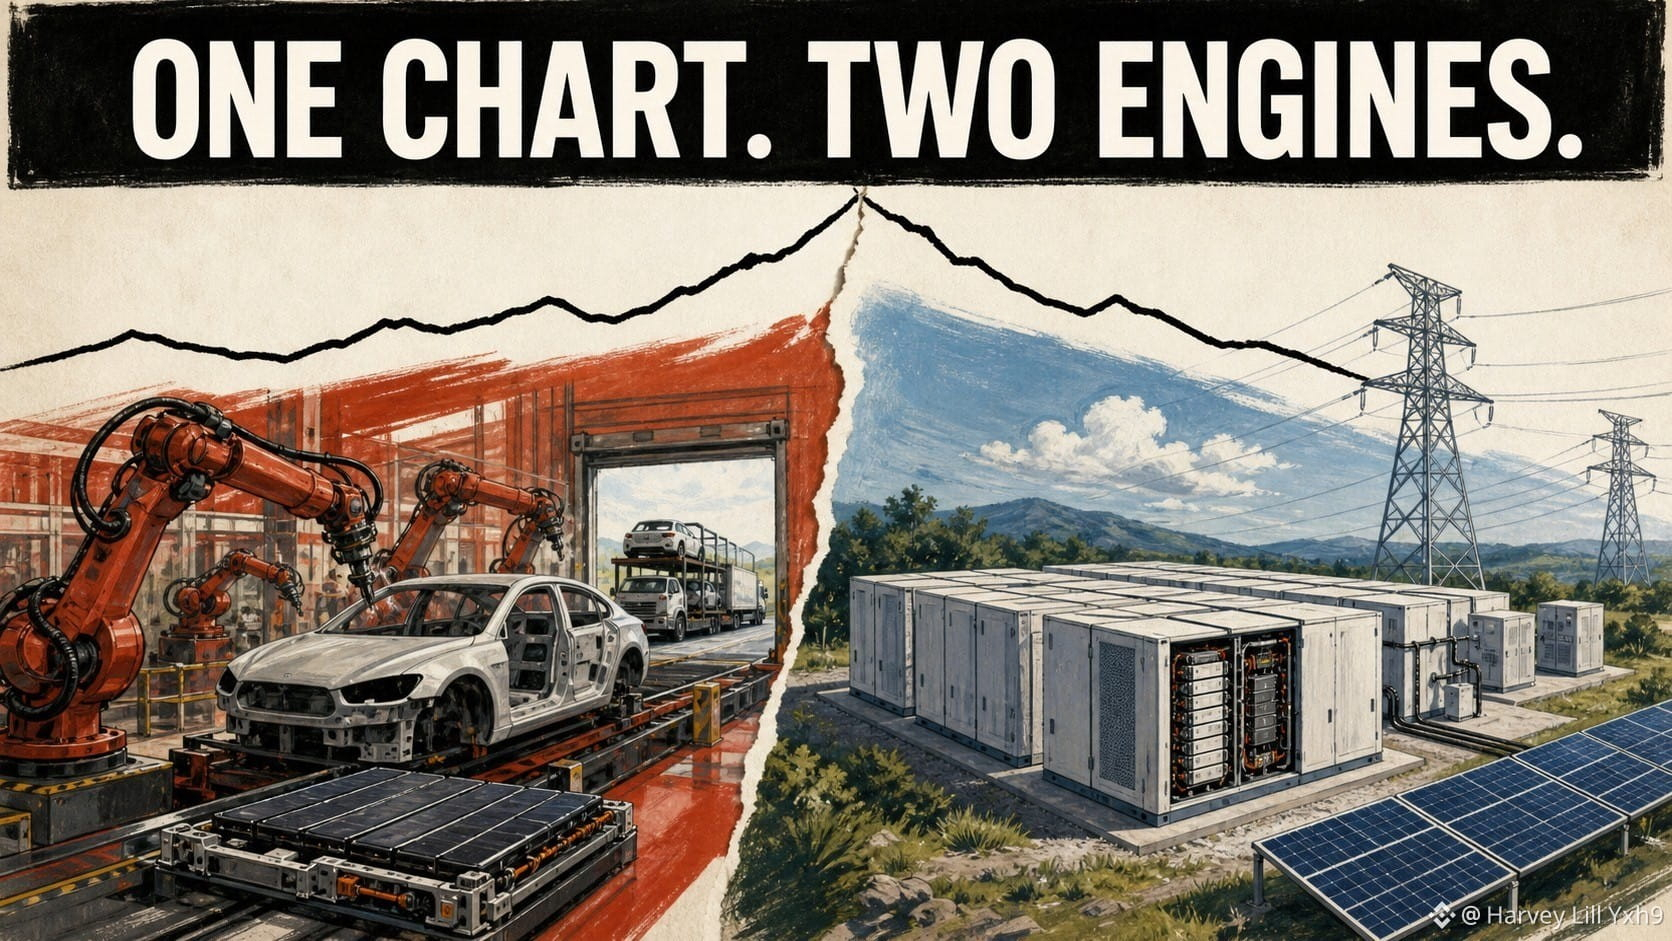
車両の納入に関する見出しだけでは、$TSLABの全ビジネスは説明できません。
Teslaは主に2つの事業セグメントを報告しています。Automotive(自動車)と、Energy Generation and Storage(エネルギーの発電・蓄電)です。
それにより、基本的でありながら役に立つ確認習慣が生まれます。
Automotiveについては、納入台数、価格設定、生産コスト、製品構成、規制クレジットについて尋ねてください。
Energy Generation and Storageについては、導入(デプロイ)、設備容量、製品需要、そしてエネルギー製品の採算性について尋ねてください。
2つのセグメントは進み方(スピード)が異なり得ます。蓄電の好調な結果が、車両のマージンに関する質問への自動的な答えになるわけではありません。車両の見出しが、エネルギー事業を消し去ることもありません。
有名な単一企業のbStockについての私のルールは、価格チャートを開く前に、その会社を「稼働エンジン(運転部分)」に分けることです。
チャートは1本の線です。その下には、事業が2つ以上のシステムとして存在し得ます。
@BinanceCIS #bStocksCIS
車両の納入に関する見出しだけでは、$TSLABの全ビジネスは説明できません。
Teslaは主に2つの事業セグメントを報告しています。Automotive(自動車)と、Energy Generation and Storage(エネルギーの発電・蓄電)です。
それにより、基本的でありながら役に立つ確認習慣が生まれます。
Automotiveについては、納入台数、価格設定、生産コスト、製品構成、規制クレジットについて尋ねてください。
Energy Generation and Storageについては、導入(デプロイ)、設備容量、製品需要、そしてエネルギー製品の採算性について尋ねてください。
2つのセグメントは進み方(スピード)が異なり得ます。蓄電の好調な結果が、車両のマージンに関する質問への自動的な答えになるわけではありません。車両の見出しが、エネルギー事業を消し去ることもありません。
有名な単一企業のbStockについての私のルールは、価格チャートを開く前に、その会社を「稼働エンジン(運転部分)」に分けることです。
チャートは1本の線です。その下には、事業が2つ以上のシステムとして存在し得ます。
@BinanceCIS #bStocksCIS
Teslaは主に2つの事業セグメントを報告しています。Automotive(自動車)と、Energy Generation and Storage(エネルギーの発電・蓄電)です。
それにより、基本的でありながら役に立つ確認習慣が生まれます。
Automotiveについては、納入台数、価格設定、生産コスト、製品構成、規制クレジットについて尋ねてください。
Energy Generation and Storageについては、導入(デプロイ)、設備容量、製品需要、そしてエネルギー製品の採算性について尋ねてください。
2つのセグメントは進み方(スピード)が異なり得ます。蓄電の好調な結果が、車両のマージンに関する質問への自動的な答えになるわけではありません。車両の見出しが、エネルギー事業を消し去ることもありません。
有名な単一企業のbStockについての私のルールは、価格チャートを開く前に、その会社を「稼働エンジン(運転部分)」に分けることです。
チャートは1本の線です。その下には、事業が2つ以上のシステムとして存在し得ます。
@BinanceCIS #bStocksCIS
5
5
101
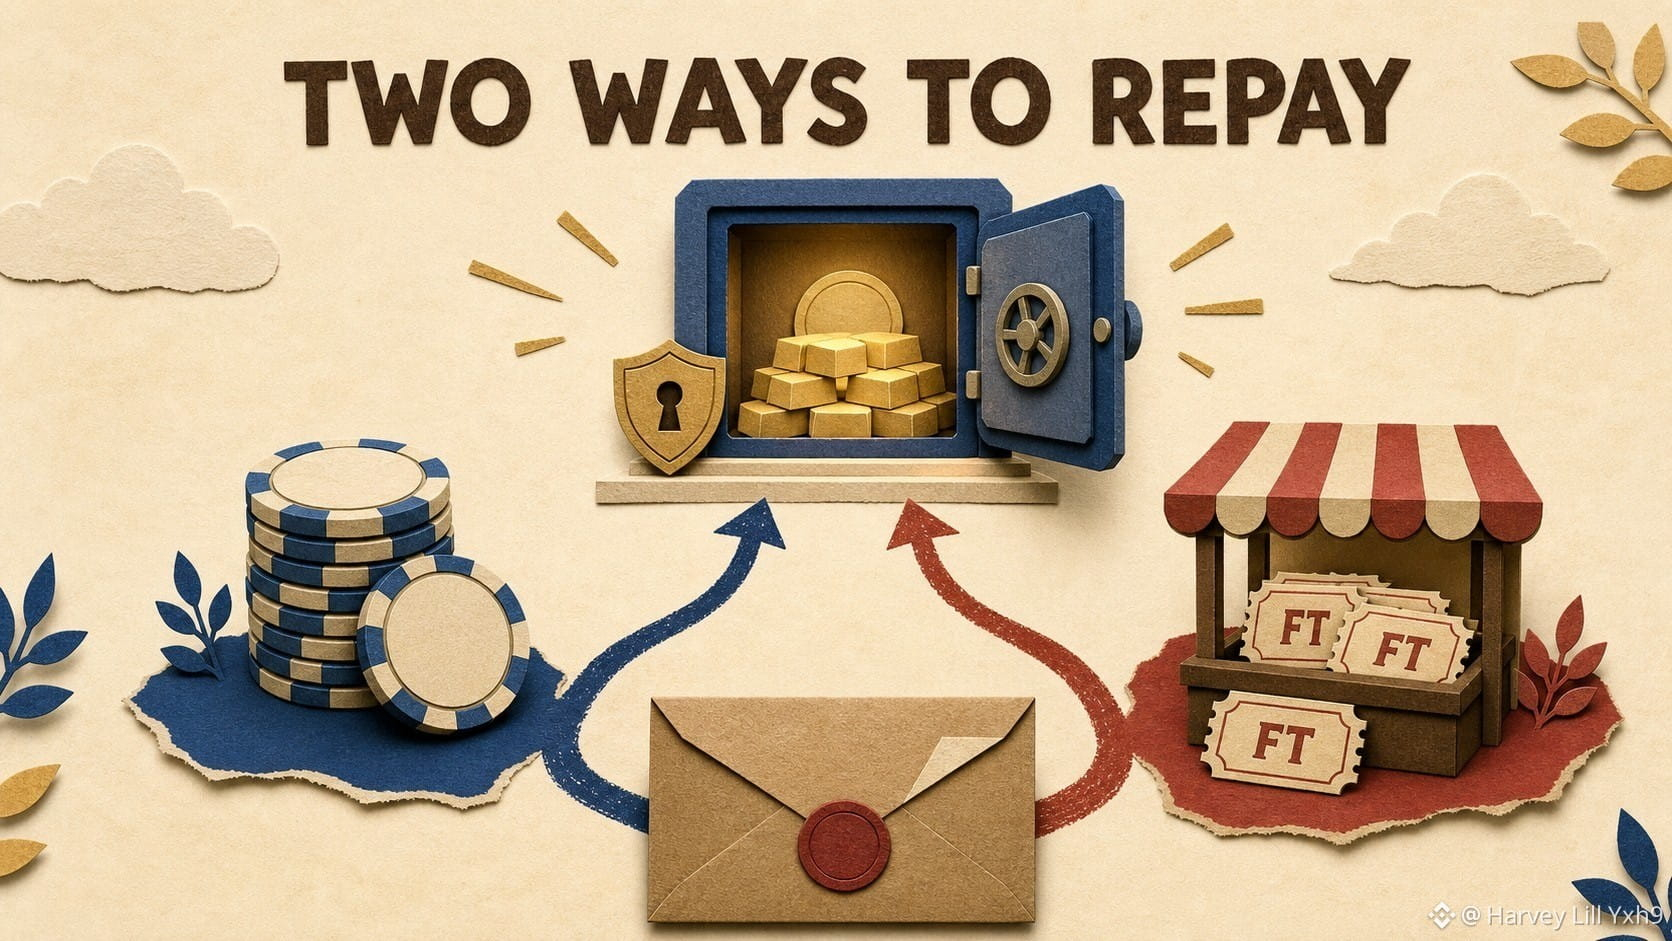
「固定金利」は、借り手に返済手段が1つしかないかのように聞こえます。TermMaxは2つの返済方法を示しています。
借り手は、Gearing Tokenに記録された債務を、その債務トークン自体で返済することもできますし、対応する固定金利(FT)トークンを取得して、それらのFTを返して義務を決済することもできます。
この2つ目のルートが重要なのは、FTが満期前に市場価格を持つためです。
満期時に保有ポジションの債務が1,000ユニットあるとします。債務トークンを1,000支払うのが直接ルートです。もし1,000に対応するFTを970の債務トークンで購入できるなら、FTで返済することで、手数料や価格インパクトの前に総決済コストを970まで下げられる可能性があります。
ただし、これはタダで儲かる話ではありません。必要なFTの流動性は薄いかもしれず、提示価格は数量によって変動する可能性があり、また債務に合った正しいトークンと満期が一致している必要があります。
私は固定金利を、契約上の債務コストに対する上限だと捉えています。一方で、セカンダリーのFT市場によって有利な条件下ではより安い出口ルートが生まれることがあります。
返済の前に、見えている「明白なボタン」を自動で押すのではなく、フルサイズで両方の経路の見積もりを提示します。
参照確認:TermMax Docs — Borrower(借り手); Protocol FAQ(プロトコルFAQ)。
@termmax #TermMax
「固定金利」は、借り手に返済手段が1つしかないかのように聞こえます。TermMaxは2つの返済方法を示しています。
借り手は、Gearing Tokenに記録された債務を、その債務トークン自体で返済することもできますし、対応する固定金利(FT)トークンを取得して、それらのFTを返して義務を決済することもできます。
この2つ目のルートが重要なのは、FTが満期前に市場価格を持つためです。
満期時に保有ポジションの債務が1,000ユニットあるとします。債務トークンを1,000支払うのが直接ルートです。もし1,000に対応するFTを970の債務トークンで購入できるなら、FTで返済することで、手数料や価格インパクトの前に総決済コストを970まで下げられる可能性があります。
ただし、これはタダで儲かる話ではありません。必要なFTの流動性は薄いかもしれず、提示価格は数量によって変動する可能性があり、また債務に合った正しいトークンと満期が一致している必要があります。
私は固定金利を、契約上の債務コストに対する上限だと捉えています。一方で、セカンダリーのFT市場によって有利な条件下ではより安い出口ルートが生まれることがあります。
返済の前に、見えている「明白なボタン」を自動で押すのではなく、フルサイズで両方の経路の見積もりを提示します。
参照確認:TermMax Docs — Borrower(借り手); Protocol FAQ(プロトコルFAQ)。
@TermMax #TermMax
借り手は、Gearing Tokenに記録された債務を、その債務トークン自体で返済することもできますし、対応する固定金利(FT)トークンを取得して、それらのFTを返して義務を決済することもできます。
この2つ目のルートが重要なのは、FTが満期前に市場価格を持つためです。
満期時に保有ポジションの債務が1,000ユニットあるとします。債務トークンを1,000支払うのが直接ルートです。もし1,000に対応するFTを970の債務トークンで購入できるなら、FTで返済することで、手数料や価格インパクトの前に総決済コストを970まで下げられる可能性があります。
ただし、これはタダで儲かる話ではありません。必要なFTの流動性は薄いかもしれず、提示価格は数量によって変動する可能性があり、また債務に合った正しいトークンと満期が一致している必要があります。
私は固定金利を、契約上の債務コストに対する上限だと捉えています。一方で、セカンダリーのFT市場によって有利な条件下ではより安い出口ルートが生まれることがあります。
返済の前に、見えている「明白なボタン」を自動で押すのではなく、フルサイズで両方の経路の見積もりを提示します。
参照確認:TermMax Docs — Borrower(借り手); Protocol FAQ(プロトコルFAQ)。
@TermMax #TermMax
1
3
95
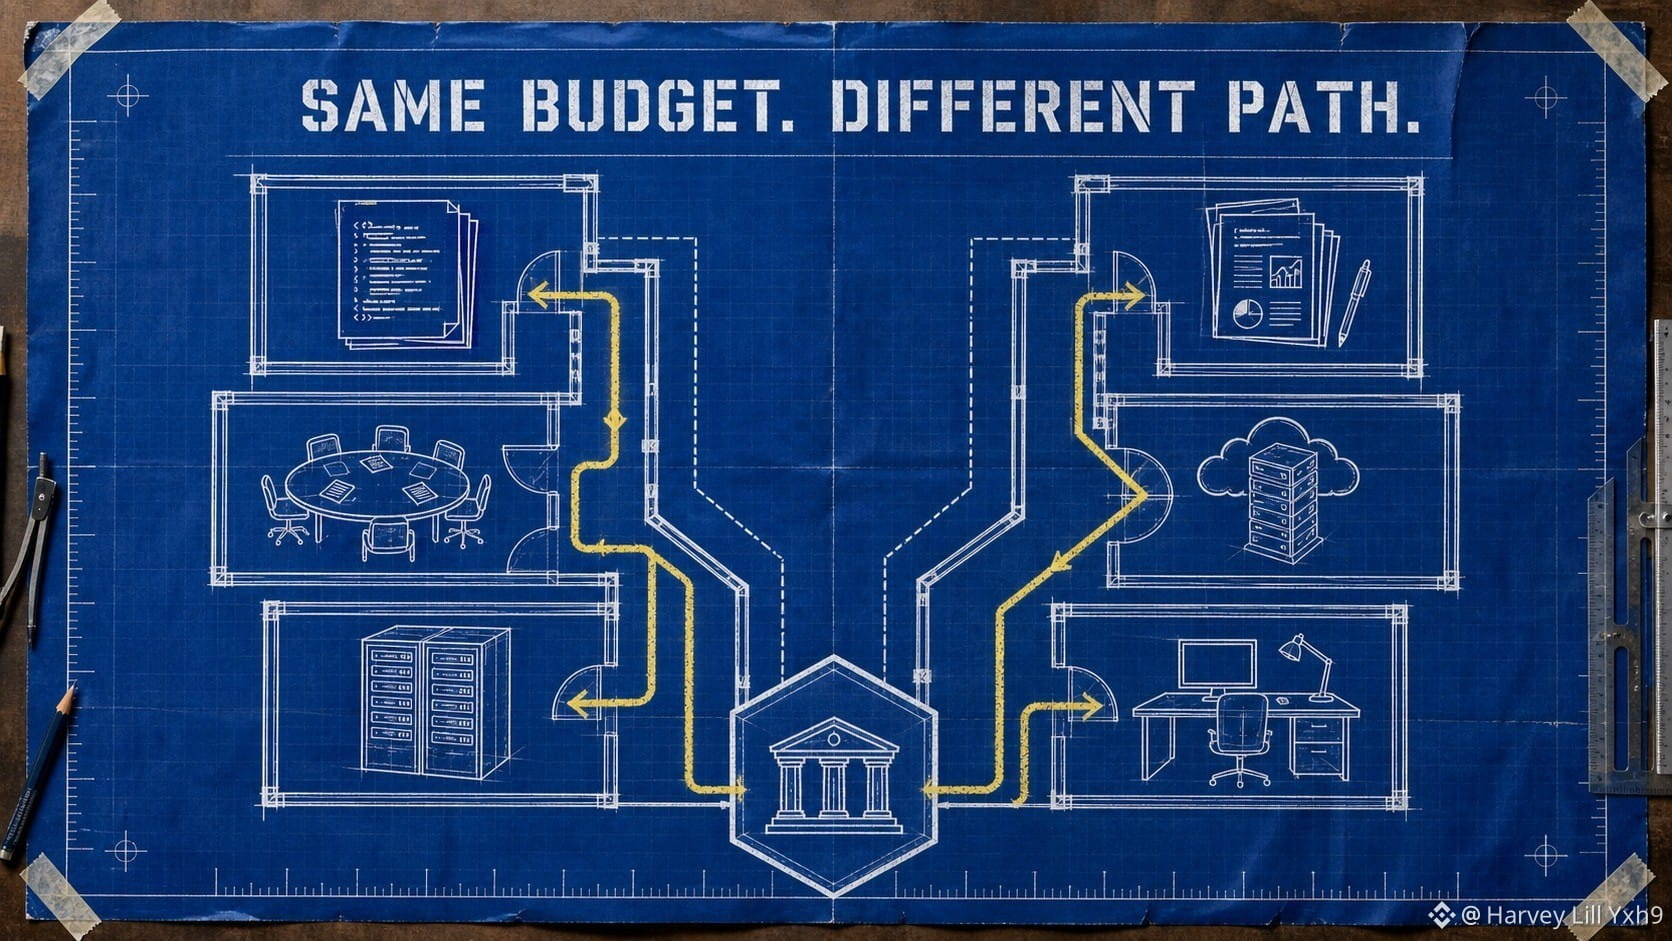
Enterprise AI は $IBMB と $MSFTB の完全な比較ではありません。
IBM は Software、Consulting、Infrastructure、Financing にまたがって報告しています。その構造は、技術製品と導入の専門性、さらに長期にわたるエンタープライズ・システムを組み合わせたものです。
Microsoft は Productivity と Business Processes、Intelligent Cloud、そして More Personal Computing を報告しています。同社のモデルは、ソフトウェアのサブスクリプション、クラウド基盤、そして幅広いコンピューティング・エコシステムを組み合わせたものです。
より良い問いは、顧客との関係がどこに位置しているかです。
IBM はソフトウェア、コンサルティング、またはインフラ変革を通じて参入できます。
Microsoft は日々の生産性ツール、クラウドの利用(消費)、そしてプラットフォームの導入を通じて参入できます。
両者は同じエンタープライズのIT予算に出てくる可能性があります。しかし、収益構成や販売の進め方(セールスのモーション)、デリバリのモデルは依然として異なり得ます。
私の比較ルール:評価ラベルを1つにまとめて両者に適用する前に、製品・サービス・インフラの収益をそれぞれ別々に対応づけます。
テーマは共有されています。契約の道筋は共有されません。
確認した情報源:IBM および Microsoft の FY2025 年次報告書。
@BinanceCIS #bStocksCIS
Enterprise AI は $IBMB と $MSFTB の完全な比較ではありません。
IBM は Software、Consulting、Infrastructure、Financing にまたがって報告しています。その構造は、技術製品と導入の専門性、さらに長期にわたるエンタープライズ・システムを組み合わせたものです。
Microsoft は Productivity と Business Processes、Intelligent Cloud、そして More Personal Computing を報告しています。同社のモデルは、ソフトウェアのサブスクリプション、クラウド基盤、そして幅広いコンピューティング・エコシステムを組み合わせたものです。
より良い問いは、顧客との関係がどこに位置しているかです。
IBM はソフトウェア、コンサルティング、またはインフラ変革を通じて参入できます。
Microsoft は日々の生産性ツール、クラウドの利用(消費)、そしてプラットフォームの導入を通じて参入できます。
両者は同じエンタープライズのIT予算に出てくる可能性があります。しかし、収益構成や販売の進め方(セールスのモーション)、デリバリのモデルは依然として異なり得ます。
私の比較ルール:評価ラベルを1つにまとめて両者に適用する前に、製品・サービス・インフラの収益をそれぞれ別々に対応づけます。
テーマは共有されています。契約の道筋は共有されません。
確認した情報源:IBM および Microsoft の FY2025 年次報告書。
@BinanceCIS #bStocksCIS
IBM は Software、Consulting、Infrastructure、Financing にまたがって報告しています。その構造は、技術製品と導入の専門性、さらに長期にわたるエンタープライズ・システムを組み合わせたものです。
Microsoft は Productivity と Business Processes、Intelligent Cloud、そして More Personal Computing を報告しています。同社のモデルは、ソフトウェアのサブスクリプション、クラウド基盤、そして幅広いコンピューティング・エコシステムを組み合わせたものです。
より良い問いは、顧客との関係がどこに位置しているかです。
IBM はソフトウェア、コンサルティング、またはインフラ変革を通じて参入できます。
Microsoft は日々の生産性ツール、クラウドの利用(消費)、そしてプラットフォームの導入を通じて参入できます。
両者は同じエンタープライズのIT予算に出てくる可能性があります。しかし、収益構成や販売の進め方(セールスのモーション)、デリバリのモデルは依然として異なり得ます。
私の比較ルール:評価ラベルを1つにまとめて両者に適用する前に、製品・サービス・インフラの収益をそれぞれ別々に対応づけます。
テーマは共有されています。契約の道筋は共有されません。
確認した情報源:IBM および Microsoft の FY2025 年次報告書。
@BinanceCIS #bStocksCIS
2
73
固定レート・トークンは、同じ額面まで上昇しても、APYが大きく異なることがあります。
たとえば、純粋に仮想のTermMax FTを考えます。これは60日後に負債トークン1枚で償還します。今日の価格が0.96の場合、「4% APY」ではありません。実際には:
(1 / 0.96 − 1) = 60日間で4.17% です。
TermMaxドキュメントにある単純な年換算方法を使うと:
4.17% × 365 / 60 ≈ 25.35% 年換算。
同じ0.96で購入し、残りが30日しかない場合は、満期時の支払額がやはり1であるにもかかわらず、はるかに高い年換算値が表示されます。
だから私はFTの2つの機会をAPYだけで比較することはしません。入力は4つ記録します:購入価格、償還価値、残存日数、そして総執行コストです。スリッページや早期売却によって、実現結果は満期まで保有した場合の計算と異なることがあります。
実務上のルール:まず実際の期間におけるキャッシュ増加分を計算し、その後に年換算します。
参照確認:TermMax Docs — Token; Fixed Rate Tokenization。
@termmax #TermMax
固定レート・トークンは、同じ額面まで上昇しても、APYが大きく異なることがあります。
たとえば、純粋に仮想のTermMax FTを考えます。これは60日後に負債トークン1枚で償還します。今日の価格が0.96の場合、「4% APY」ではありません。実際には:
(1 / 0.96 − 1) = 60日間で4.17% です。
TermMaxドキュメントにある単純な年換算方法を使うと:
4.17% × 365 / 60 ≈ 25.35% 年換算。
同じ0.96で購入し、残りが30日しかない場合は、満期時の支払額がやはり1であるにもかかわらず、はるかに高い年換算値が表示されます。
だから私はFTの2つの機会をAPYだけで比較することはしません。入力は4つ記録します:購入価格、償還価値、残存日数、そして総執行コストです。スリッページや早期売却によって、実現結果は満期まで保有した場合の計算と異なることがあります。
実務上のルール:まず実際の期間におけるキャッシュ増加分を計算し、その後に年換算します。
参照確認:TermMax Docs — Token; Fixed Rate Tokenization。
@TermMax #TermMax
たとえば、純粋に仮想のTermMax FTを考えます。これは60日後に負債トークン1枚で償還します。今日の価格が0.96の場合、「4% APY」ではありません。実際には:
(1 / 0.96 − 1) = 60日間で4.17% です。
TermMaxドキュメントにある単純な年換算方法を使うと:
4.17% × 365 / 60 ≈ 25.35% 年換算。
同じ0.96で購入し、残りが30日しかない場合は、満期時の支払額がやはり1であるにもかかわらず、はるかに高い年換算値が表示されます。
だから私はFTの2つの機会をAPYだけで比較することはしません。入力は4つ記録します:購入価格、償還価値、残存日数、そして総執行コストです。スリッページや早期売却によって、実現結果は満期まで保有した場合の計算と異なることがあります。
実務上のルール:まず実際の期間におけるキャッシュ増加分を計算し、その後に年換算します。
参照確認:TermMax Docs — Token; Fixed Rate Tokenization。
@TermMax #TermMax
2
85
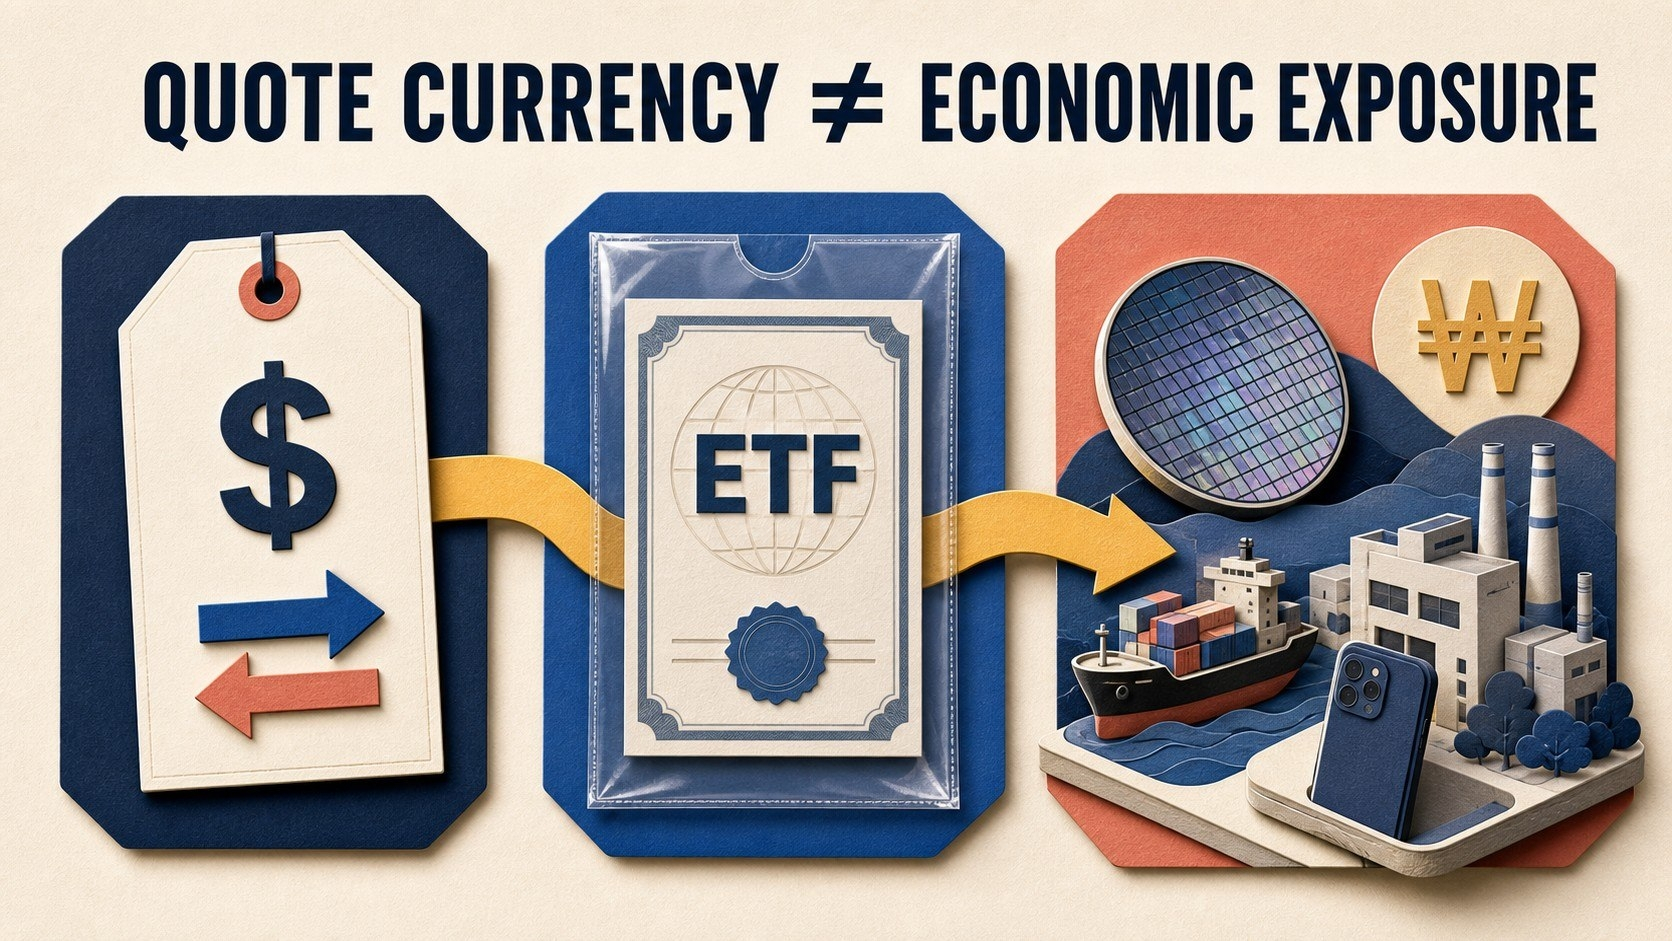
USDTで $EWYB を購入しても、韓国株式へのエクスポージャーが「ドルだけ」のポジションになるわけではありません。
見積通貨(クォート通貨)は、取引がどのように価格設定されているかを教えてくれます。しかし、基礎となる経済(実態)を形作る通貨が何かまでは教えてくれません。
EWY は韓国株式を保有しており、iShares は国際投資のリスクとして、外貨建てのリスクを明確に挙げています。現地で価格が付けられた保有分のUSD価値は、株価と為替の両方の影響を受け得ます。さらに、ポートフォリオ企業が複数通貨で収益を得る可能性もあり、もう一段複雑になります。
私はこのポジションを3つのレベルで整理します:
1. 取引レイヤー:$EWYB は Binance のスポットで USDT に対して提示(クォート)されます。
2. ラッパーレイヤー:bStock は対応する基礎となる有価証券に裏付けられています。
3. 経済レイヤー:ETF は、現地の価格や事業キャッシュフローが USDT によって決まるわけではない韓国企業を保有しています。
トークン化は、アクセス方法、取引時間、カストディ(保管)オプションを変えます。しかし、基礎ポートフォリオ内部にある通貨エクスポージャーが消えるわけではありません。
私のルール:購入ボタン上の通貨は「支払いの単位」であって、「完全なリスク地図」ではありません。
確認した情報源:iShares の EWY ファクトシート、Binance Academy の bStocks ガイド。
@BinanceCIS #bStocksCIS
USDTで $EWYB を購入しても、韓国株式へのエクスポージャーが「ドルだけ」のポジションになるわけではありません。
見積通貨(クォート通貨)は、取引がどのように価格設定されているかを教えてくれます。しかし、基礎となる経済(実態)を形作る通貨が何かまでは教えてくれません。
EWY は韓国株式を保有しており、iShares は国際投資のリスクとして、外貨建てのリスクを明確に挙げています。現地で価格が付けられた保有分のUSD価値は、株価と為替の両方の影響を受け得ます。さらに、ポートフォリオ企業が複数通貨で収益を得る可能性もあり、もう一段複雑になります。
私はこのポジションを3つのレベルで整理します:
1. 取引レイヤー:$EWYB は Binance のスポットで USDT に対して提示(クォート)されます。
2. ラッパーレイヤー:bStock は対応する基礎となる有価証券に裏付けられています。
3. 経済レイヤー:ETF は、現地の価格や事業キャッシュフローが USDT によって決まるわけではない韓国企業を保有しています。
トークン化は、アクセス方法、取引時間、カストディ(保管)オプションを変えます。しかし、基礎ポートフォリオ内部にある通貨エクスポージャーが消えるわけではありません。
私のルール:購入ボタン上の通貨は「支払いの単位」であって、「完全なリスク地図」ではありません。
確認した情報源:iShares の EWY ファクトシート、Binance Academy の bStocks ガイド。
@BinanceCIS #bStocksCIS
見積通貨(クォート通貨)は、取引がどのように価格設定されているかを教えてくれます。しかし、基礎となる経済(実態)を形作る通貨が何かまでは教えてくれません。
EWY は韓国株式を保有しており、iShares は国際投資のリスクとして、外貨建てのリスクを明確に挙げています。現地で価格が付けられた保有分のUSD価値は、株価と為替の両方の影響を受け得ます。さらに、ポートフォリオ企業が複数通貨で収益を得る可能性もあり、もう一段複雑になります。
私はこのポジションを3つのレベルで整理します:
1. 取引レイヤー:$EWYB は Binance のスポットで USDT に対して提示(クォート)されます。
2. ラッパーレイヤー:bStock は対応する基礎となる有価証券に裏付けられています。
3. 経済レイヤー:ETF は、現地の価格や事業キャッシュフローが USDT によって決まるわけではない韓国企業を保有しています。
トークン化は、アクセス方法、取引時間、カストディ(保管)オプションを変えます。しかし、基礎ポートフォリオ内部にある通貨エクスポージャーが消えるわけではありません。
私のルール:購入ボタン上の通貨は「支払いの単位」であって、「完全なリスク地図」ではありません。
確認した情報源:iShares の EWY ファクトシート、Binance Academy の bStocks ガイド。
@BinanceCIS #bStocksCIS
2
5
101
本人確認中
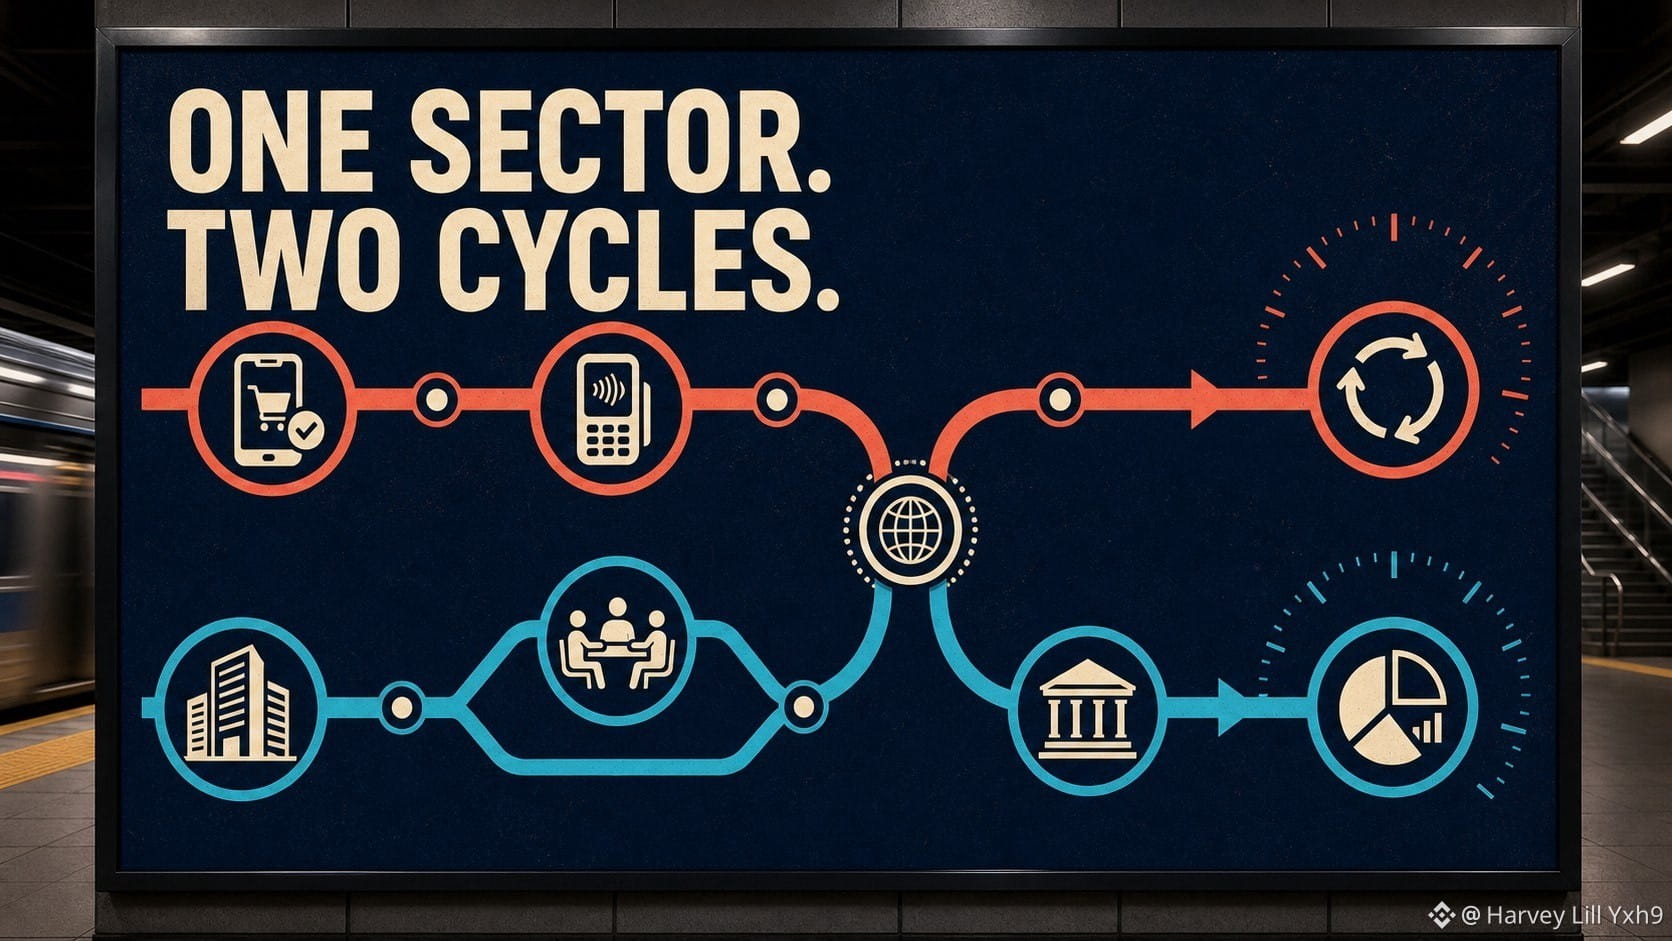
2つの金融セクターのb株は、まったく異なる顧客行動に左右され得ます。
$PYPLB は、消費者と加盟店にサービスする決済プラットフォームと連動しています。焦点は、チェックアウト(決済)活動、ブランド体験、取引の経済性、加盟店の導入にあります。
$GSB はゴールドマン・サックスと連動しており、その中核となる事業は Global Banking & Markets(グローバル・バンキング&マーケッツ)および Asset & Wealth Management(資産&ウェルスマネジメント)です。質問には、アドバイザリー活動、引受、取引フロー、ファイナンス、監督下にある資産が含まれます。
それにより、明確な対比が生まれます。
消費者・加盟店の取引 versus 企業・機関向けの資本活動。
どちらも景気や金利の影響を受け得ますが、伝わり方(伝達経路)は同じではありません。
私の業界ルール: 「ファイナンス(財務)」で止めないでください。顧客が誰なのか、どんな行動が収益を生むのか、そしてその行動を支配する市場サイクルは何かを書き出しなさい。
ひとつのラベルの下に、まったく異なる2つの時計が隠れていることがあります。
確認した出典:PayPal の投資家向け資料および Goldman Sachs の 2025 年次報告書。
@BinanceCIS #bStocksCIS
2つの金融セクターのb株は、まったく異なる顧客行動に左右され得ます。
$PYPLB は、消費者と加盟店にサービスする決済プラットフォームと連動しています。焦点は、チェックアウト(決済)活動、ブランド体験、取引の経済性、加盟店の導入にあります。
$GSB はゴールドマン・サックスと連動しており、その中核となる事業は Global Banking & Markets(グローバル・バンキング&マーケッツ)および Asset & Wealth Management(資産&ウェルスマネジメント)です。質問には、アドバイザリー活動、引受、取引フロー、ファイナンス、監督下にある資産が含まれます。
それにより、明確な対比が生まれます。
消費者・加盟店の取引 versus 企業・機関向けの資本活動。
どちらも景気や金利の影響を受け得ますが、伝わり方(伝達経路)は同じではありません。
私の業界ルール: 「ファイナンス(財務)」で止めないでください。顧客が誰なのか、どんな行動が収益を生むのか、そしてその行動を支配する市場サイクルは何かを書き出しなさい。
ひとつのラベルの下に、まったく異なる2つの時計が隠れていることがあります。
確認した出典:PayPal の投資家向け資料および Goldman Sachs の 2025 年次報告書。
@BinanceCIS #bStocksCIS
$PYPLB は、消費者と加盟店にサービスする決済プラットフォームと連動しています。焦点は、チェックアウト(決済)活動、ブランド体験、取引の経済性、加盟店の導入にあります。
$GSB はゴールドマン・サックスと連動しており、その中核となる事業は Global Banking & Markets(グローバル・バンキング&マーケッツ)および Asset & Wealth Management(資産&ウェルスマネジメント)です。質問には、アドバイザリー活動、引受、取引フロー、ファイナンス、監督下にある資産が含まれます。
それにより、明確な対比が生まれます。
消費者・加盟店の取引 versus 企業・機関向けの資本活動。
どちらも景気や金利の影響を受け得ますが、伝わり方(伝達経路)は同じではありません。
私の業界ルール: 「ファイナンス(財務)」で止めないでください。顧客が誰なのか、どんな行動が収益を生むのか、そしてその行動を支配する市場サイクルは何かを書き出しなさい。
ひとつのラベルの下に、まったく異なる2つの時計が隠れていることがあります。
確認した出典:PayPal の投資家向け資料および Goldman Sachs の 2025 年次報告書。
@BinanceCIS #bStocksCIS
5
7
118
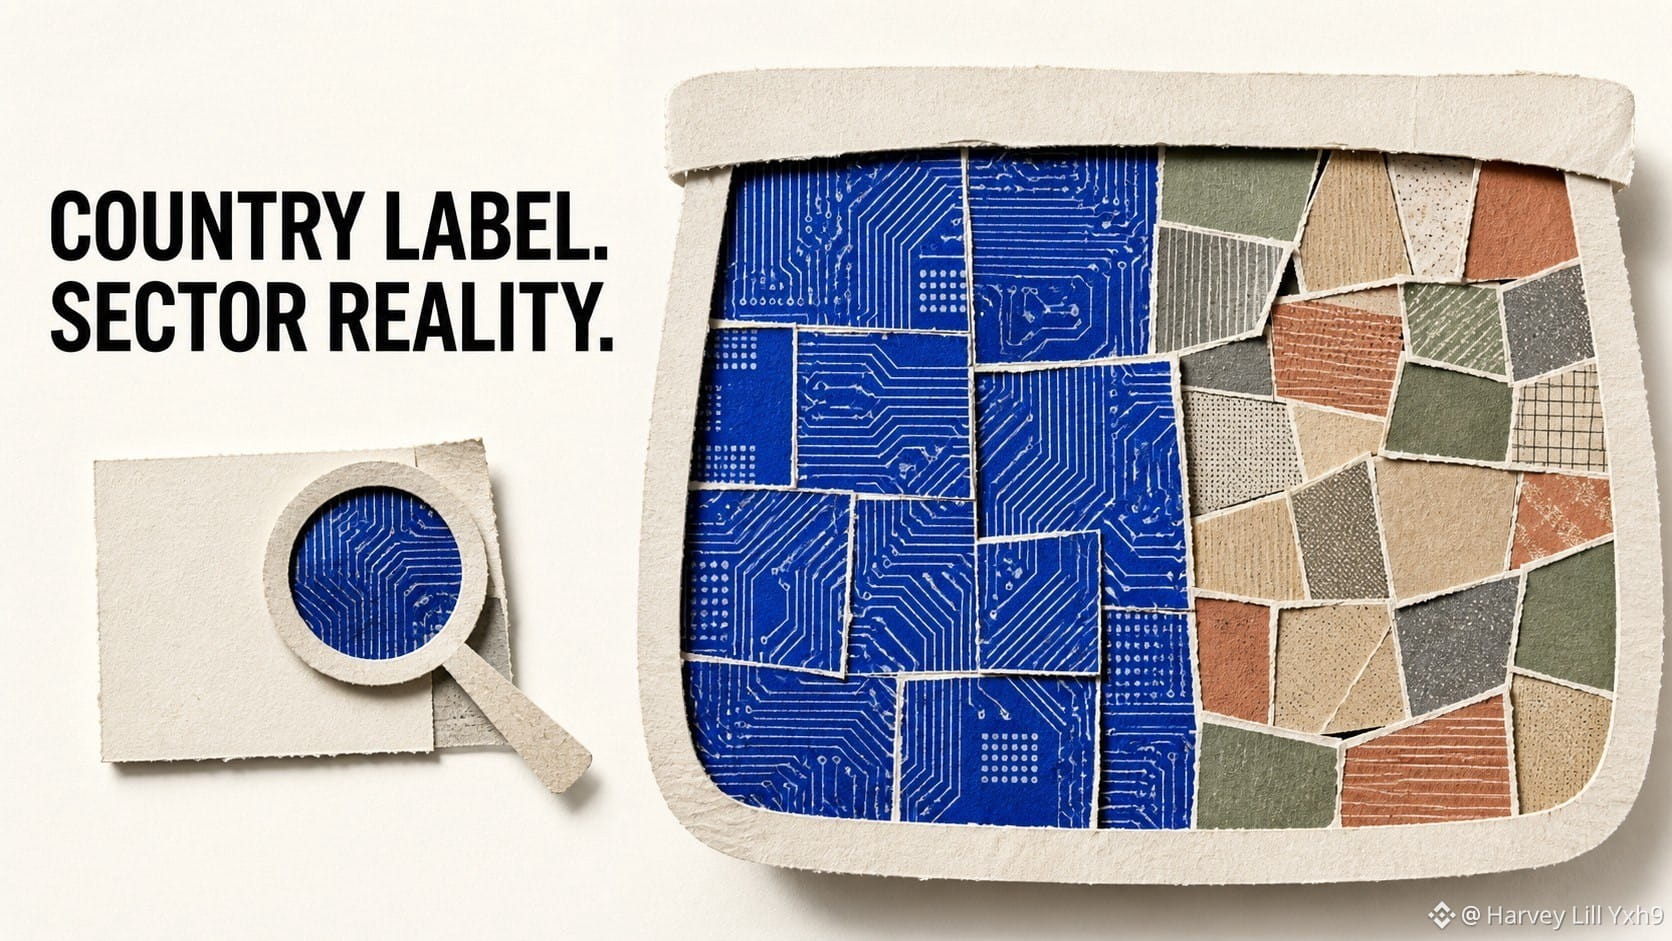
国のラベルを買っても、その国に関してバランスの取れた切り口になることは保証されません。
EWYは韓国株式の指数を追跡することを目指しています。公式のiSharesページでは、当該ファンドは78銘柄を保有しており、情報技術が2026年7月27日時点の市場価値の50.16%を占めていました。
そのため、$EWYBはルックスルー(実態把握)分析の有用な教材になります。
見出しのエクスポージャーは「韓国」です。ポートフォリオの動きを左右する要因は、依然として特定のセクター、大型構成銘柄、そして指数の算出方法によって大きく形成され得ます。
私の国別ETFチェックリスト:
1. 保有銘柄数。
2. 最大セクターの比率。
3. 最大の会社(銘柄)比率。
4. 通貨および国特有のリスク。
この4つの確認を行った後で初めて、そのポジションが実際にポートフォリオに何を加えるのかを説明します。
ETFは単一企業のリスクを分散しつつ、セクターのリスクに集中することもあります。
出典の日付が重要です:保有は変わります。上記の数値は、2026年7月27日時点のiSharesのEWYページからのものです。
@BinanceCIS #bStocksCIS
国のラベルを買っても、その国に関してバランスの取れた切り口になることは保証されません。
EWYは韓国株式の指数を追跡することを目指しています。公式のiSharesページでは、当該ファンドは78銘柄を保有しており、情報技術が2026年7月27日時点の市場価値の50.16%を占めていました。
そのため、$EWYBはルックスルー(実態把握)分析の有用な教材になります。
見出しのエクスポージャーは「韓国」です。ポートフォリオの動きを左右する要因は、依然として特定のセクター、大型構成銘柄、そして指数の算出方法によって大きく形成され得ます。
私の国別ETFチェックリスト:
1. 保有銘柄数。
2. 最大セクターの比率。
3. 最大の会社(銘柄)比率。
4. 通貨および国特有のリスク。
この4つの確認を行った後で初めて、そのポジションが実際にポートフォリオに何を加えるのかを説明します。
ETFは単一企業のリスクを分散しつつ、セクターのリスクに集中することもあります。
出典の日付が重要です:保有は変わります。上記の数値は、2026年7月27日時点のiSharesのEWYページからのものです。
@BinanceCIS #bStocksCIS
EWYは韓国株式の指数を追跡することを目指しています。公式のiSharesページでは、当該ファンドは78銘柄を保有しており、情報技術が2026年7月27日時点の市場価値の50.16%を占めていました。
そのため、$EWYBはルックスルー(実態把握)分析の有用な教材になります。
見出しのエクスポージャーは「韓国」です。ポートフォリオの動きを左右する要因は、依然として特定のセクター、大型構成銘柄、そして指数の算出方法によって大きく形成され得ます。
私の国別ETFチェックリスト:
1. 保有銘柄数。
2. 最大セクターの比率。
3. 最大の会社(銘柄)比率。
4. 通貨および国特有のリスク。
この4つの確認を行った後で初めて、そのポジションが実際にポートフォリオに何を加えるのかを説明します。
ETFは単一企業のリスクを分散しつつ、セクターのリスクに集中することもあります。
出典の日付が重要です:保有は変わります。上記の数値は、2026年7月27日時点のiSharesのEWYページからのものです。
@BinanceCIS #bStocksCIS
3
4
115
本人確認中
ポートフォリオには3つのティッカーを含めても、同じ企業を1つ重複させることはありえます。
私が確認したソースページでは、NVIDIAはSPYとQQQの両方の開示保有銘柄でした。したがって、$SPYB、$QQQB、$NVDABを含むバスケットは、3つの独立したエクスポージャーを作るわけではありません。
それが作るのは次のようなものです:
• $NVDABによる直接のNVIDIAエクスポージャー;
• SPY連動のポートフォリオの中に含まれるNVIDIAの間接エクスポージャー;
• QQQ連動のポートフォリオの中にさらにもう一段重なった間接的な層。
これが自動的に間違いというわけではありません。意図的である可能性があります。誤りは、ティッカーを数えることではなく、基になるドライバーを数えないことです。
私の重複チェックは2分です:
1. 現在のETFの保有銘柄を開く。
2. 単一株の名称を検索する。
3. 重複が意図的かどうかをメモする。
トークン化によりポジションをまとめて配置しやすくなりますが、ポートフォリオ構築には各ラッパーの中身を見通す作業が依然として必要です。
これを分散されていると言いますか?それとも、意図的なNVIDIAのオーバーウェイトですか?
公式ファンドページで確認した保有銘柄です。掲載前にもう一度確認してください。ウェイトや構成銘柄は変わります。
@BinanceCIS #bStocksCIs
ポートフォリオには3つのティッカーを含めても、同じ企業を1つ重複させることはありえます。
私が確認したソースページでは、NVIDIAはSPYとQQQの両方の開示保有銘柄でした。したがって、$SPYB、$QQQB、$NVDABを含むバスケットは、3つの独立したエクスポージャーを作るわけではありません。
それが作るのは次のようなものです:
• $NVDABによる直接のNVIDIAエクスポージャー;
• SPY連動のポートフォリオの中に含まれるNVIDIAの間接エクスポージャー;
• QQQ連動のポートフォリオの中にさらにもう一段重なった間接的な層。
これが自動的に間違いというわけではありません。意図的である可能性があります。誤りは、ティッカーを数えることではなく、基になるドライバーを数えないことです。
私の重複チェックは2分です:
1. 現在のETFの保有銘柄を開く。
2. 単一株の名称を検索する。
3. 重複が意図的かどうかをメモする。
トークン化によりポジションをまとめて配置しやすくなりますが、ポートフォリオ構築には各ラッパーの中身を見通す作業が依然として必要です。
これを分散されていると言いますか?それとも、意図的なNVIDIAのオーバーウェイトですか?
公式ファンドページで確認した保有銘柄です。掲載前にもう一度確認してください。ウェイトや構成銘柄は変わります。
@BinanceCIS #bStocksCIs
私が確認したソースページでは、NVIDIAはSPYとQQQの両方の開示保有銘柄でした。したがって、$SPYB、$QQQB、$NVDABを含むバスケットは、3つの独立したエクスポージャーを作るわけではありません。
それが作るのは次のようなものです:
• $NVDABによる直接のNVIDIAエクスポージャー;
• SPY連動のポートフォリオの中に含まれるNVIDIAの間接エクスポージャー;
• QQQ連動のポートフォリオの中にさらにもう一段重なった間接的な層。
これが自動的に間違いというわけではありません。意図的である可能性があります。誤りは、ティッカーを数えることではなく、基になるドライバーを数えないことです。
私の重複チェックは2分です:
1. 現在のETFの保有銘柄を開く。
2. 単一株の名称を検索する。
3. 重複が意図的かどうかをメモする。
トークン化によりポジションをまとめて配置しやすくなりますが、ポートフォリオ構築には各ラッパーの中身を見通す作業が依然として必要です。
これを分散されていると言いますか?それとも、意図的なNVIDIAのオーバーウェイトですか?
公式ファンドページで確認した保有銘柄です。掲載前にもう一度確認してください。ウェイトや構成銘柄は変わります。
@BinanceCIS #bStocksCIs

3
113
ETFティッカーは、4文字に圧縮されたポートフォリオのルールです。
$SPYB は、S&P 500 を追跡し、11のセクターにまたがって米国の大企業をカバーする SPY に連動したトークン化されたエクスポージャーを提供します。
$QQQB は、Nasdaq-100 を追跡する QQQ に連動しています。Nasdaq-100 は、その手法にもとづき、Nasdaq に上場している最大の非金融企業群です。
つまり、選択肢は単に「総合市場かテックか」ではありません。土台となるルールが、どの企業を組み入れられるか、セクターがどう表現されるか、そして集中がどこで形成され得るかを決めます。
私の3問テスト:
1. 追跡されている指数は何ですか?
2. 設計上除外されるのはどの企業ですか?
3. 上位の保有銘柄のうち、結果により大きく影響するのはどれですか?
トークンの“ラッパー”はアクセスを変えます。ただし、その下にあるETFの構築ルールを消し去るわけではありません。
それぞれのチャートを見比べる前に、ルールブックを比較してください。
参照確認:State Street の SPY と Invesco の QQQ のプロダクトページ。Binance のペア状態は2026年8月6日に検証済み。
@BinanceCIS #bStocksCIS
ETFティッカーは、4文字に圧縮されたポートフォリオのルールです。
$SPYB は、S&P 500 を追跡し、11のセクターにまたがって米国の大企業をカバーする SPY に連動したトークン化されたエクスポージャーを提供します。
$QQQB は、Nasdaq-100 を追跡する QQQ に連動しています。Nasdaq-100 は、その手法にもとづき、Nasdaq に上場している最大の非金融企業群です。
つまり、選択肢は単に「総合市場かテックか」ではありません。土台となるルールが、どの企業を組み入れられるか、セクターがどう表現されるか、そして集中がどこで形成され得るかを決めます。
私の3問テスト:
1. 追跡されている指数は何ですか?
2. 設計上除外されるのはどの企業ですか?
3. 上位の保有銘柄のうち、結果により大きく影響するのはどれですか?
トークンの“ラッパー”はアクセスを変えます。ただし、その下にあるETFの構築ルールを消し去るわけではありません。
それぞれのチャートを見比べる前に、ルールブックを比較してください。
参照確認:State Street の SPY と Invesco の QQQ のプロダクトページ。Binance のペア状態は2026年8月6日に検証済み。
@BinanceCIS #bStocksCIS
$SPYB は、S&P 500 を追跡し、11のセクターにまたがって米国の大企業をカバーする SPY に連動したトークン化されたエクスポージャーを提供します。
$QQQB は、Nasdaq-100 を追跡する QQQ に連動しています。Nasdaq-100 は、その手法にもとづき、Nasdaq に上場している最大の非金融企業群です。
つまり、選択肢は単に「総合市場かテックか」ではありません。土台となるルールが、どの企業を組み入れられるか、セクターがどう表現されるか、そして集中がどこで形成され得るかを決めます。
私の3問テスト:
1. 追跡されている指数は何ですか?
2. 設計上除外されるのはどの企業ですか?
3. 上位の保有銘柄のうち、結果により大きく影響するのはどれですか?
トークンの“ラッパー”はアクセスを変えます。ただし、その下にあるETFの構築ルールを消し去るわけではありません。
それぞれのチャートを見比べる前に、ルールブックを比較してください。
参照確認:State Street の SPY と Invesco の QQQ のプロダクトページ。Binance のペア状態は2026年8月6日に検証済み。
@BinanceCIS #bStocksCIS

4
107
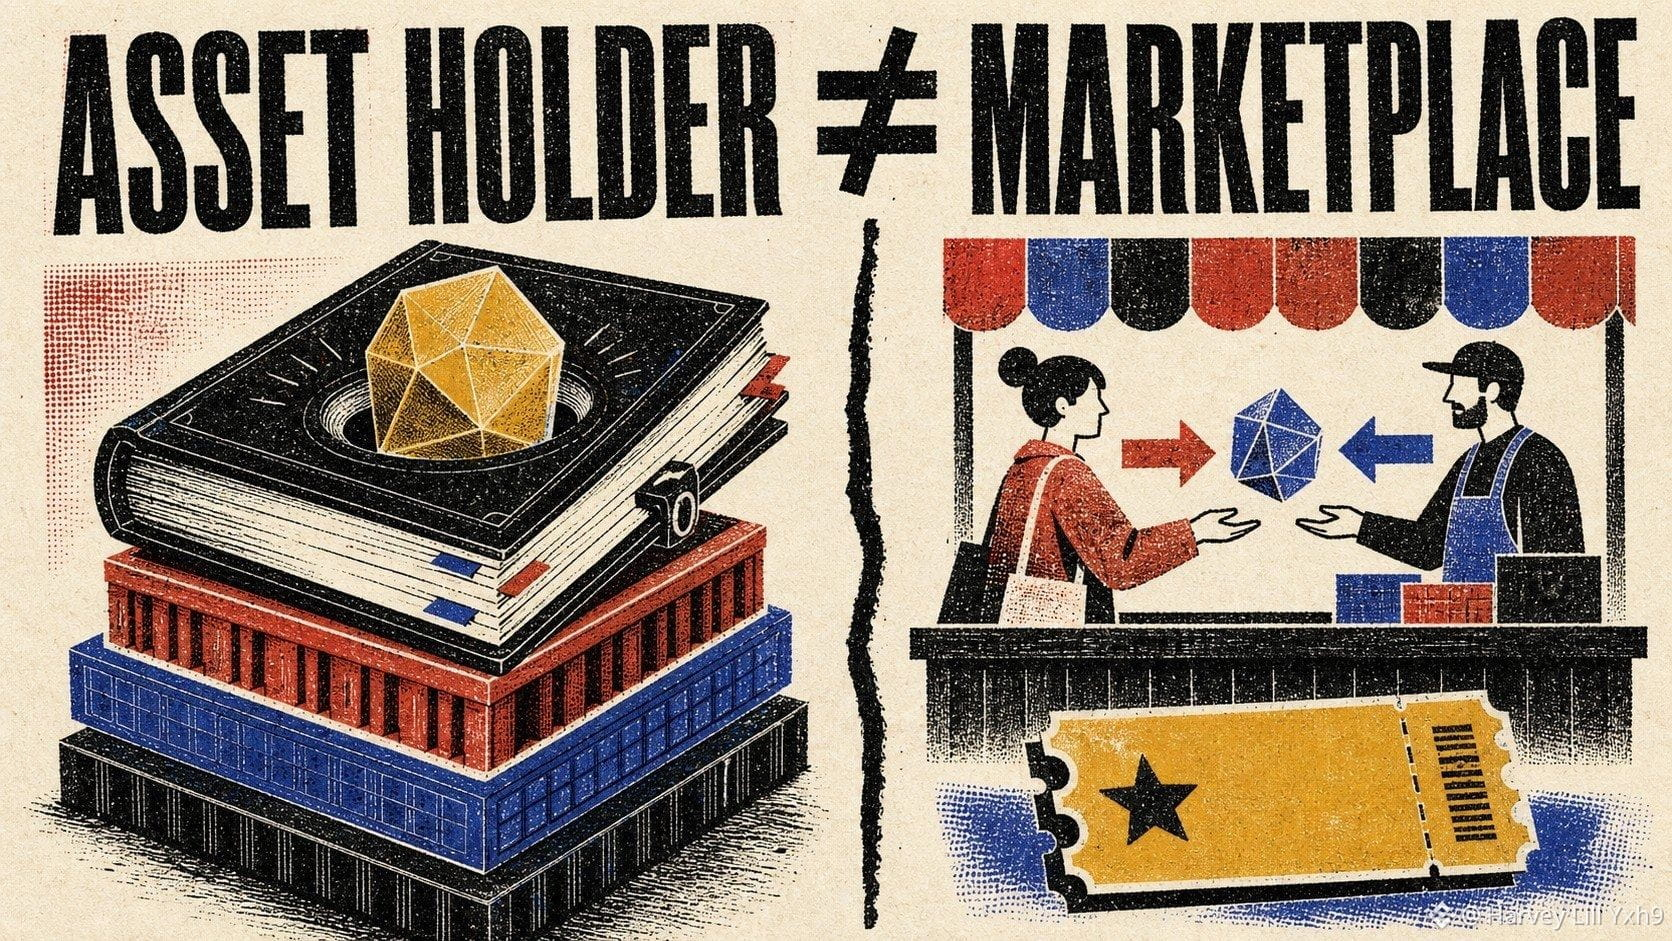
ビットコインが動けば、$MSTRB と $COINB の両方が注目を集める可能性があります。しかし、それで両社のビジネスモデルが同じだということにはなりません。
戦略(Strategy)は、自らをビットコイン・トレジャリー企業だと位置づけつつ、エンタープライズ向け分析ソフトウェア事業も運営しています。論旨の中心は、そのバランスシートと資金調達(ファイナンス)の意思決定です。
コインベース(Coinbase)は暗号資産のプラットフォームを運営しています。取引収益はアクティビティに依存し、一方でサブスクリプションやサービスが別の収益源を追加します。
私が使う対比は次のとおりです。
$MSTRB → バランスシートへのエクスポージャー、資本構成、1株当たりのビットコイン(Bitcoin per share)。
$COINB → 市場への参加、出来高(ボリューム)、プロダクトの採用、サービス。
ビットコイン価格の上昇は両方の物語を後押しし得ますが、作用の仕方は異なります。価格の方向性は分析の第一歩にすぎず、資金調達、ボラティリティ、ユーザーの活動、市場での収益ミックスが次の判断材料になります。
私のルール:2つの銘柄が同じ暗号資産(クリプト)の見出しで語られる場合、その会社がその資産を保有しているのか、市場にサービスを提供しているのか、あるいは両方なのかを特定します。
確認した情報源:Strategyの投資家向け資料およびCoinbaseのFY2025の結果。
@BinanceCIS #bStocksCIS
ビットコインが動けば、$MSTRB と $COINB の両方が注目を集める可能性があります。しかし、それで両社のビジネスモデルが同じだということにはなりません。
戦略(Strategy)は、自らをビットコイン・トレジャリー企業だと位置づけつつ、エンタープライズ向け分析ソフトウェア事業も運営しています。論旨の中心は、そのバランスシートと資金調達(ファイナンス)の意思決定です。
コインベース(Coinbase)は暗号資産のプラットフォームを運営しています。取引収益はアクティビティに依存し、一方でサブスクリプションやサービスが別の収益源を追加します。
私が使う対比は次のとおりです。
$MSTRB → バランスシートへのエクスポージャー、資本構成、1株当たりのビットコイン(Bitcoin per share)。
$COINB → 市場への参加、出来高(ボリューム)、プロダクトの採用、サービス。
ビットコイン価格の上昇は両方の物語を後押しし得ますが、作用の仕方は異なります。価格の方向性は分析の第一歩にすぎず、資金調達、ボラティリティ、ユーザーの活動、市場での収益ミックスが次の判断材料になります。
私のルール:2つの銘柄が同じ暗号資産(クリプト)の見出しで語られる場合、その会社がその資産を保有しているのか、市場にサービスを提供しているのか、あるいは両方なのかを特定します。
確認した情報源:Strategyの投資家向け資料およびCoinbaseのFY2025の結果。
@BinanceCIS #bStocksCIS
戦略(Strategy)は、自らをビットコイン・トレジャリー企業だと位置づけつつ、エンタープライズ向け分析ソフトウェア事業も運営しています。論旨の中心は、そのバランスシートと資金調達(ファイナンス)の意思決定です。
コインベース(Coinbase)は暗号資産のプラットフォームを運営しています。取引収益はアクティビティに依存し、一方でサブスクリプションやサービスが別の収益源を追加します。
私が使う対比は次のとおりです。
$MSTRB → バランスシートへのエクスポージャー、資本構成、1株当たりのビットコイン(Bitcoin per share)。
$COINB → 市場への参加、出来高(ボリューム)、プロダクトの採用、サービス。
ビットコイン価格の上昇は両方の物語を後押しし得ますが、作用の仕方は異なります。価格の方向性は分析の第一歩にすぎず、資金調達、ボラティリティ、ユーザーの活動、市場での収益ミックスが次の判断材料になります。
私のルール:2つの銘柄が同じ暗号資産(クリプト)の見出しで語られる場合、その会社がその資産を保有しているのか、市場にサービスを提供しているのか、あるいは両方なのかを特定します。
確認した情報源:Strategyの投資家向け資料およびCoinbaseのFY2025の結果。
@BinanceCIS #bStocksCIS
1
2
95
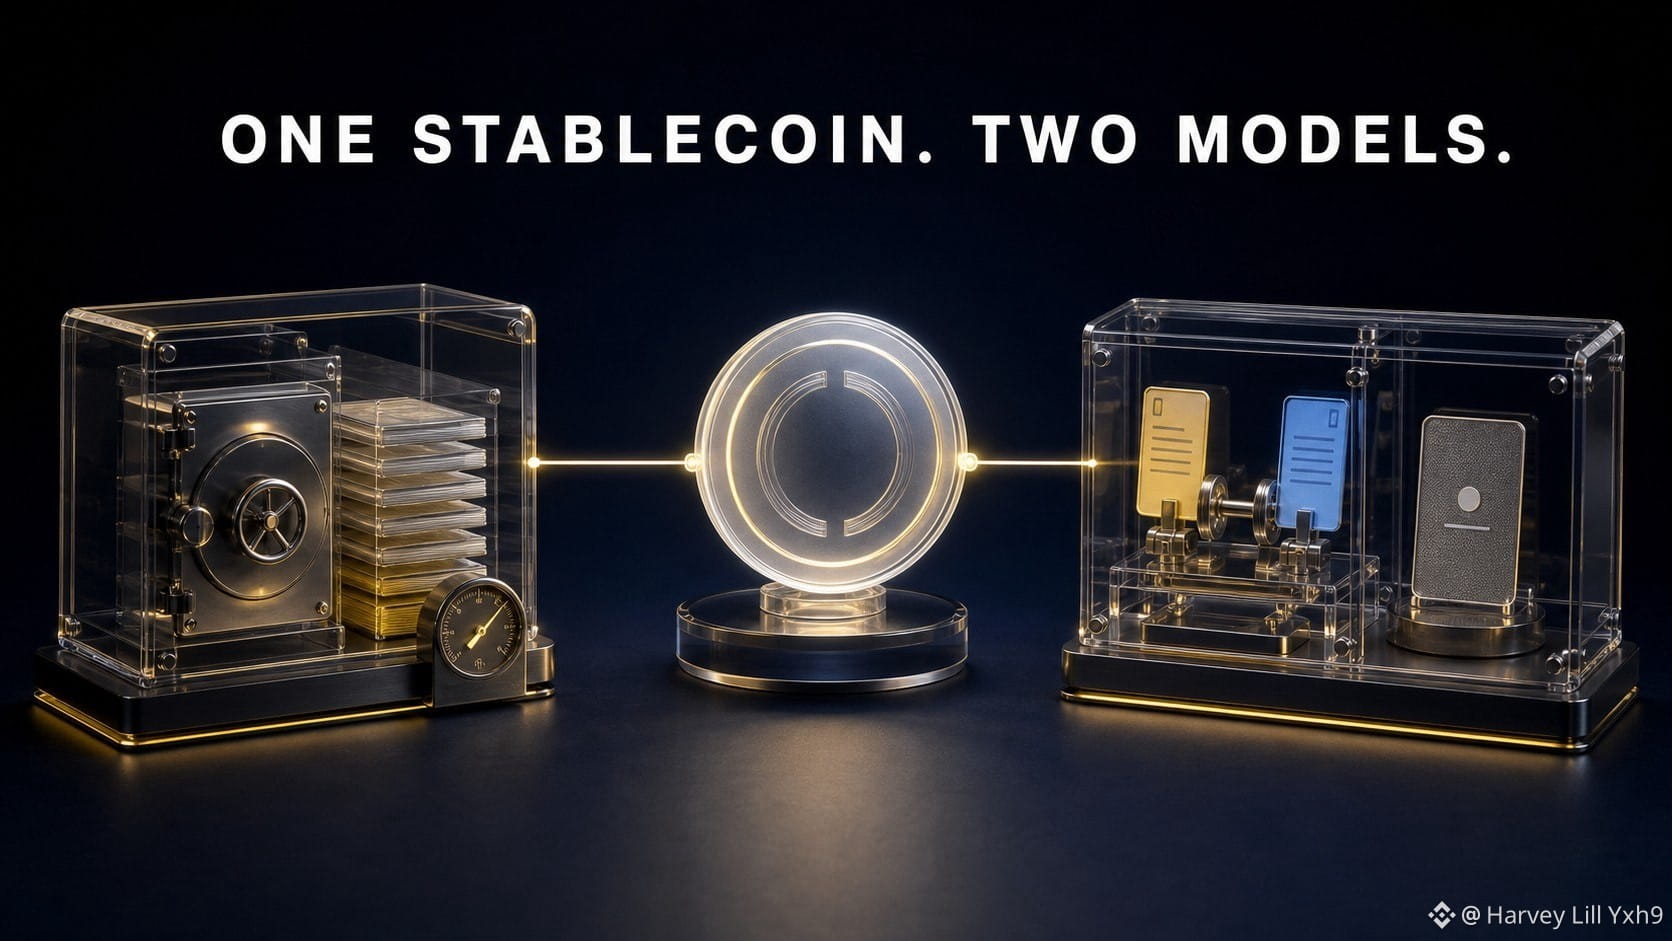
共有プロダクトは、同一のエクスポージャーを生み出すことなく2つの企業を結びつけることができます。
CircleはUSDCを扱っています。2025年の提出書類では、準備(リザーブ)収入が収益の大部分を占め続けていたことが示されており、流通しているUSDCと、準備資産のリターン(収益)へのモデルのつながりが分かります。
Coinbaseはマーケットプレイスおよびプラットフォームです。その収益には、取引アクティビティに加えて、サブスクリプションおよびサービス事業が含まれます。これらには、他の複数の業務ラインと並んで、ステーブルコイン関連の収益も含まれます。
つまり$CRCLBと$COINBはいずれもUSDCを軸に対応しているように見えますが、経済的な道筋は異なります。
Circle:ステーブルコインの規模 → 準備資産 → 準備収入(分配やその他のコストを控除した後)。
Coinbase:取引アクティビティ+サブスクリプション/サービス+エコシステム参加。
これは、あらゆるテーマ型バスケットにとって有用なテストです。まず共有プロダクトを特定し、次にそこから誰が何を得ているのかをマッピングします。
相関は「つながり」から生じ得ます。乖離は「ビジネスモデル」から生じ得ます。
これらを、1つのステーブルコイントレード(取引)と分類しますか、それとも2つの異なる収益化モデルと見なしますか?
@BinanceCIS #bStocksCIs
共有プロダクトは、同一のエクスポージャーを生み出すことなく2つの企業を結びつけることができます。
CircleはUSDCを扱っています。2025年の提出書類では、準備(リザーブ)収入が収益の大部分を占め続けていたことが示されており、流通しているUSDCと、準備資産のリターン(収益)へのモデルのつながりが分かります。
Coinbaseはマーケットプレイスおよびプラットフォームです。その収益には、取引アクティビティに加えて、サブスクリプションおよびサービス事業が含まれます。これらには、他の複数の業務ラインと並んで、ステーブルコイン関連の収益も含まれます。
つまり$CRCLBと$COINBはいずれもUSDCを軸に対応しているように見えますが、経済的な道筋は異なります。
Circle:ステーブルコインの規模 → 準備資産 → 準備収入(分配やその他のコストを控除した後)。
Coinbase:取引アクティビティ+サブスクリプション/サービス+エコシステム参加。
これは、あらゆるテーマ型バスケットにとって有用なテストです。まず共有プロダクトを特定し、次にそこから誰が何を得ているのかをマッピングします。
相関は「つながり」から生じ得ます。乖離は「ビジネスモデル」から生じ得ます。
これらを、1つのステーブルコイントレード(取引)と分類しますか、それとも2つの異なる収益化モデルと見なしますか?
@BinanceCIS #bStocksCIs
CircleはUSDCを扱っています。2025年の提出書類では、準備(リザーブ)収入が収益の大部分を占め続けていたことが示されており、流通しているUSDCと、準備資産のリターン(収益)へのモデルのつながりが分かります。
Coinbaseはマーケットプレイスおよびプラットフォームです。その収益には、取引アクティビティに加えて、サブスクリプションおよびサービス事業が含まれます。これらには、他の複数の業務ラインと並んで、ステーブルコイン関連の収益も含まれます。
つまり$CRCLBと$COINBはいずれもUSDCを軸に対応しているように見えますが、経済的な道筋は異なります。
Circle:ステーブルコインの規模 → 準備資産 → 準備収入(分配やその他のコストを控除した後)。
Coinbase:取引アクティビティ+サブスクリプション/サービス+エコシステム参加。
これは、あらゆるテーマ型バスケットにとって有用なテストです。まず共有プロダクトを特定し、次にそこから誰が何を得ているのかをマッピングします。
相関は「つながり」から生じ得ます。乖離は「ビジネスモデル」から生じ得ます。
これらを、1つのステーブルコイントレード(取引)と分類しますか、それとも2つの異なる収益化モデルと見なしますか?
@BinanceCIS #bStocksCIs
1
5
225
本人確認中
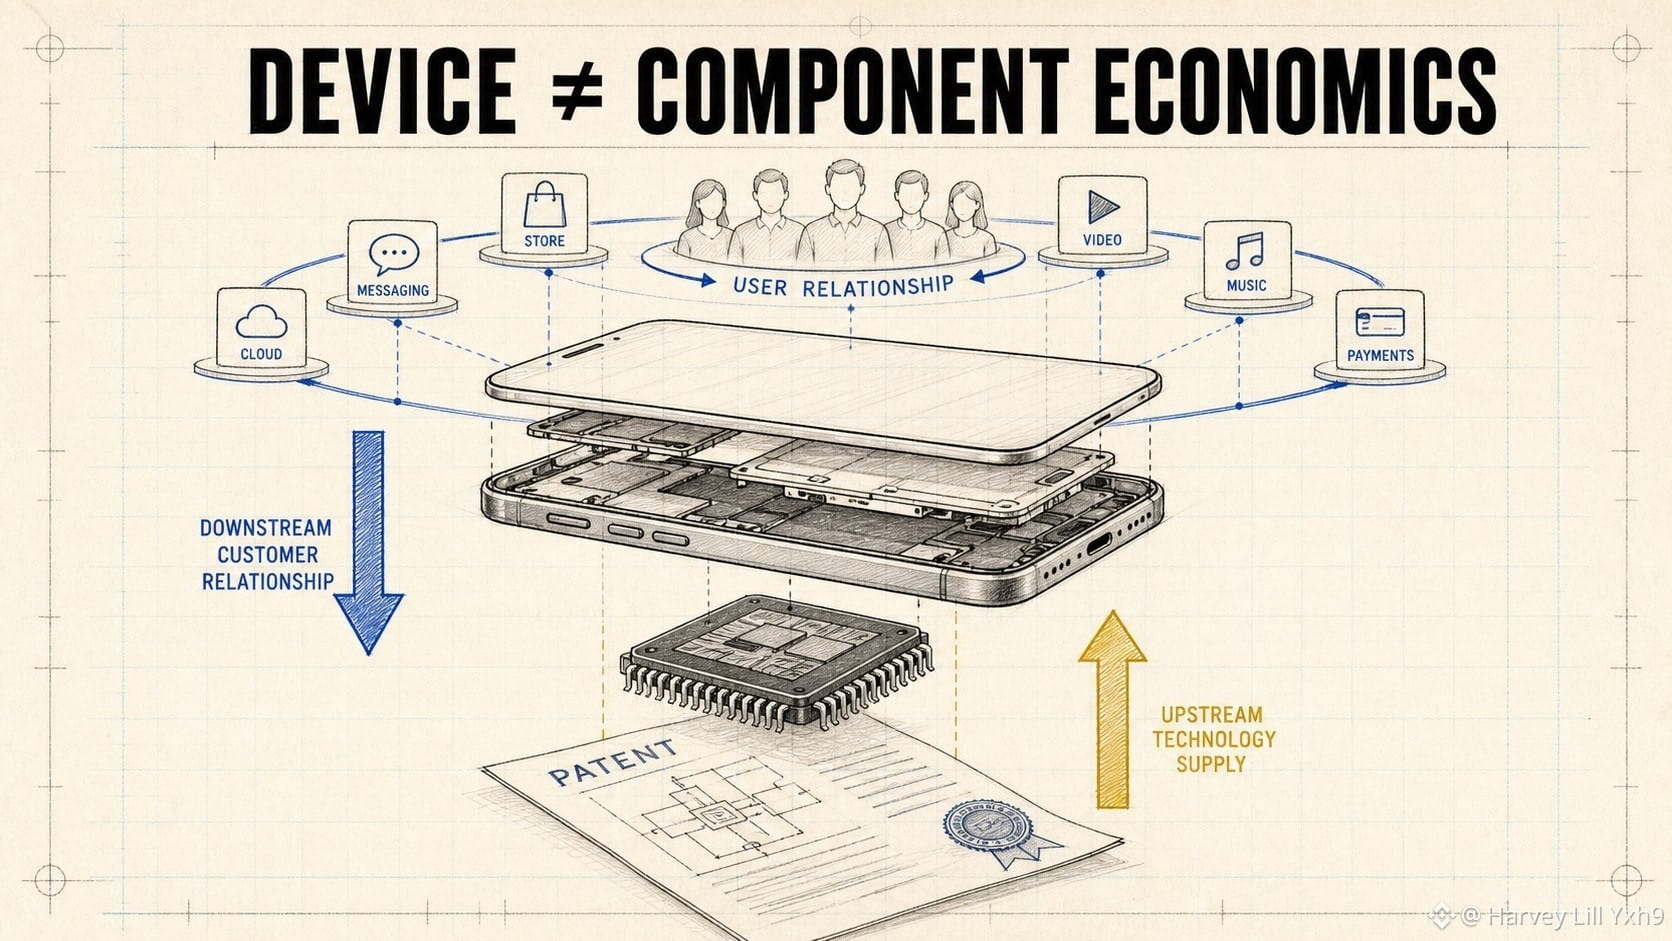
AppleとQualcommは、同じ層を自社で保有しなくても、強いデバイス・サイクルから双方が恩恵を受けることができます。
$AAPLBは統合型の製品およびサービスのエコシステムを表します。同社はデバイス体験をコントロールし、自社の導入済みベースを軸にハードウェアとサービスの両方から収益化しています。
$QCOMBは半導体とテクノロジー・ライセンスのモデルを表します。Qualcommは自社の製品事業をQCTで報告し、ライセンス事業をQTLで報告しています。
それにより、2つの異なる問いが生まれます。
Apple:ユーザーはどれだけエコシステムに入ってくるのか、または留まり続けるのか。そしてプロダクト構成はどのように変化するのか。
Qualcomm:そのチップ・プラットフォームはどこに採用されるのか。そして製品出荷とライセンスの経済性はどのように進化するのか。
デバイスは、顧客の手の中では同じ“物”かもしれません。しかし、上流と下流で獲得される価値は異なります。
私のウォッチリストのルール:顧客との関係を持つ会社と、デバイスに技術を供給する会社を分けて考えること。
@BinanceCIS #bStocksCIS
AppleとQualcommは、同じ層を自社で保有しなくても、強いデバイス・サイクルから双方が恩恵を受けることができます。
$AAPLBは統合型の製品およびサービスのエコシステムを表します。同社はデバイス体験をコントロールし、自社の導入済みベースを軸にハードウェアとサービスの両方から収益化しています。
$QCOMBは半導体とテクノロジー・ライセンスのモデルを表します。Qualcommは自社の製品事業をQCTで報告し、ライセンス事業をQTLで報告しています。
それにより、2つの異なる問いが生まれます。
Apple:ユーザーはどれだけエコシステムに入ってくるのか、または留まり続けるのか。そしてプロダクト構成はどのように変化するのか。
Qualcomm:そのチップ・プラットフォームはどこに採用されるのか。そして製品出荷とライセンスの経済性はどのように進化するのか。
デバイスは、顧客の手の中では同じ“物”かもしれません。しかし、上流と下流で獲得される価値は異なります。
私のウォッチリストのルール:顧客との関係を持つ会社と、デバイスに技術を供給する会社を分けて考えること。
@BinanceCIS #bStocksCIS
$AAPLBは統合型の製品およびサービスのエコシステムを表します。同社はデバイス体験をコントロールし、自社の導入済みベースを軸にハードウェアとサービスの両方から収益化しています。
$QCOMBは半導体とテクノロジー・ライセンスのモデルを表します。Qualcommは自社の製品事業をQCTで報告し、ライセンス事業をQTLで報告しています。
それにより、2つの異なる問いが生まれます。
Apple:ユーザーはどれだけエコシステムに入ってくるのか、または留まり続けるのか。そしてプロダクト構成はどのように変化するのか。
Qualcomm:そのチップ・プラットフォームはどこに採用されるのか。そして製品出荷とライセンスの経済性はどのように進化するのか。
デバイスは、顧客の手の中では同じ“物”かもしれません。しかし、上流と下流で獲得される価値は異なります。
私のウォッチリストのルール:顧客との関係を持つ会社と、デバイスに技術を供給する会社を分けて考えること。
@BinanceCIS #bStocksCIS
3
99
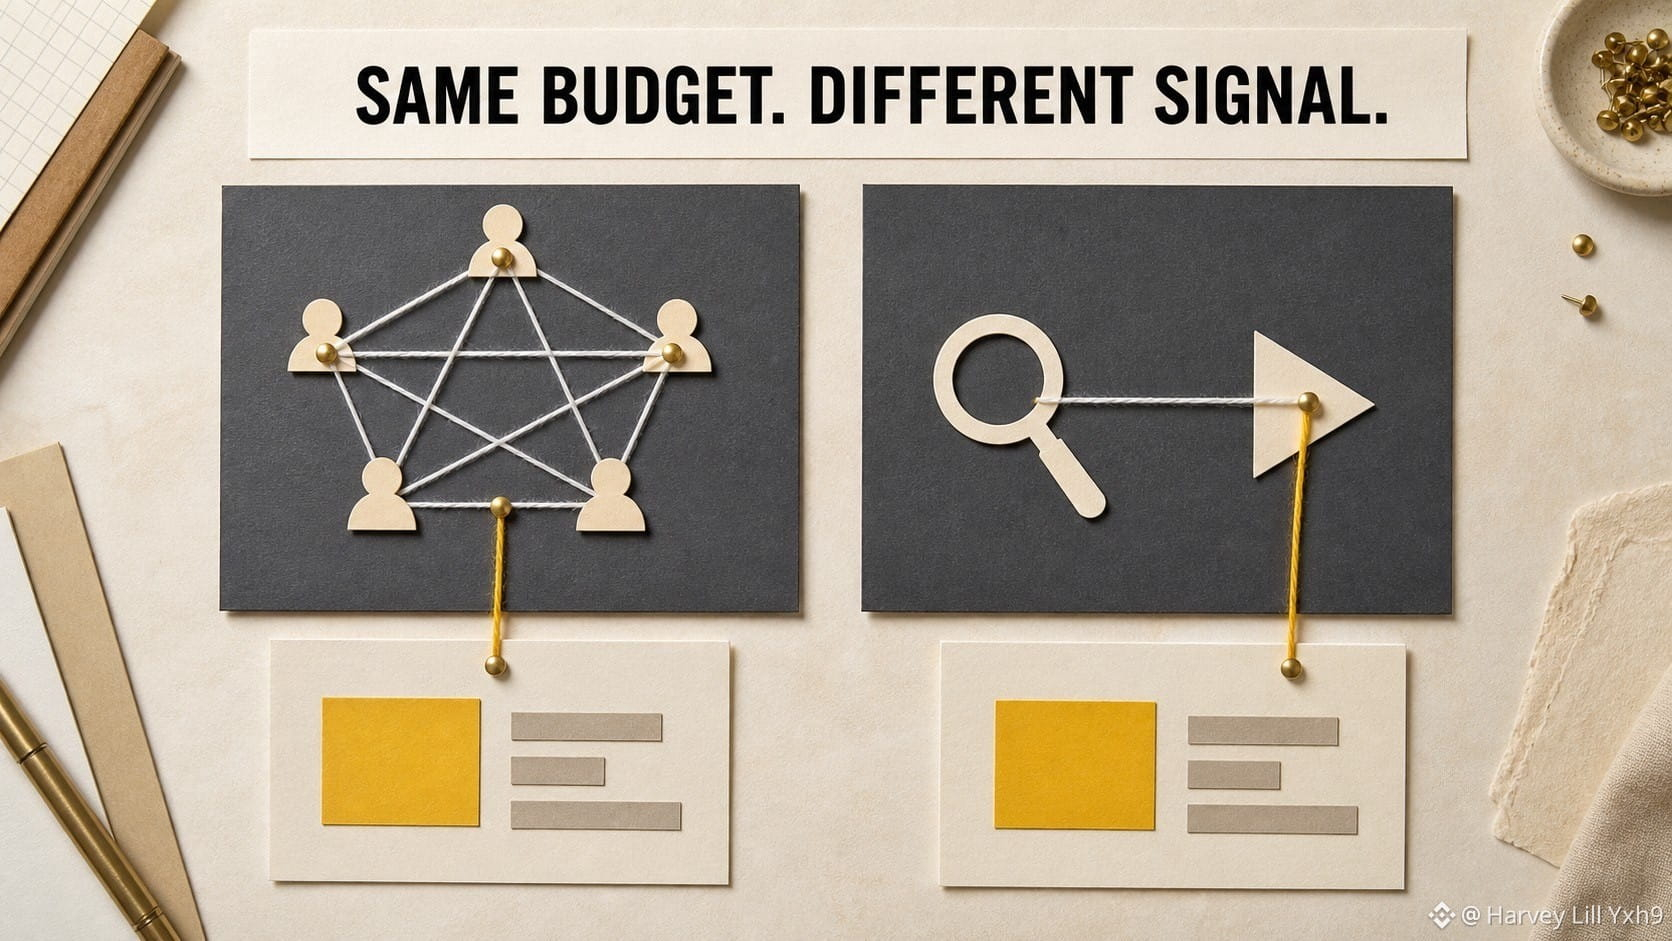
メタとアルファベットはどちらもデジタル広告を販売していますが、収益化する「注目」は同一ではありません。
$METABの場合、中核となる広告エンジンは、アプリ群(ファミリー・オブ・アプリ)全体での活動に結び付いています。$GOOGLBの場合、広告は検索、YouTube、そしてその他のGoogleの各プロパティにまたがり、さらにGoogle Cloudがもう一つの主要な事業ラインを加えます。
それにより、チャートの背後にある問いが変わります。
メタでは、エンゲージメント、広告表示回数(インプレッション)、価格設定、そして将来のプラットフォームを構築するコストを見たいです。
アルファベットでは、「あらゆる結果を“広告の成長”として扱う」のではなく、検索の意図、動画への注目、そしてクラウド需要を分けて見ます。
役に立つ対比は、どちらの会社が優れているかではありません。重要なのは、ユーザーの信号がどこから始まるかです。
ソーシャルのつながり → フィードおよびメッセージングの広告;
検索または動画の意図 → 検索広告とYouTube広告。
同じ広告予算でも、顧客への道筋が異なる。
$METABと$GOOGLBを比較する前に、各プラットフォームが捉えようとして設計された行動を比べるでしょう。
@BinanceCIS #bStocksCIS
メタとアルファベットはどちらもデジタル広告を販売していますが、収益化する「注目」は同一ではありません。
$METABの場合、中核となる広告エンジンは、アプリ群(ファミリー・オブ・アプリ)全体での活動に結び付いています。$GOOGLBの場合、広告は検索、YouTube、そしてその他のGoogleの各プロパティにまたがり、さらにGoogle Cloudがもう一つの主要な事業ラインを加えます。
それにより、チャートの背後にある問いが変わります。
メタでは、エンゲージメント、広告表示回数(インプレッション)、価格設定、そして将来のプラットフォームを構築するコストを見たいです。
アルファベットでは、「あらゆる結果を“広告の成長”として扱う」のではなく、検索の意図、動画への注目、そしてクラウド需要を分けて見ます。
役に立つ対比は、どちらの会社が優れているかではありません。重要なのは、ユーザーの信号がどこから始まるかです。
ソーシャルのつながり → フィードおよびメッセージングの広告;
検索または動画の意図 → 検索広告とYouTube広告。
同じ広告予算でも、顧客への道筋が異なる。
$METABと$GOOGLBを比較する前に、各プラットフォームが捉えようとして設計された行動を比べるでしょう。
@BinanceCIS #bStocksCIS
$METABの場合、中核となる広告エンジンは、アプリ群(ファミリー・オブ・アプリ)全体での活動に結び付いています。$GOOGLBの場合、広告は検索、YouTube、そしてその他のGoogleの各プロパティにまたがり、さらにGoogle Cloudがもう一つの主要な事業ラインを加えます。
それにより、チャートの背後にある問いが変わります。
メタでは、エンゲージメント、広告表示回数(インプレッション)、価格設定、そして将来のプラットフォームを構築するコストを見たいです。
アルファベットでは、「あらゆる結果を“広告の成長”として扱う」のではなく、検索の意図、動画への注目、そしてクラウド需要を分けて見ます。
役に立つ対比は、どちらの会社が優れているかではありません。重要なのは、ユーザーの信号がどこから始まるかです。
ソーシャルのつながり → フィードおよびメッセージングの広告;
検索または動画の意図 → 検索広告とYouTube広告。
同じ広告予算でも、顧客への道筋が異なる。
$METABと$GOOGLBを比較する前に、各プラットフォームが捉えようとして設計された行動を比べるでしょう。
@BinanceCIS #bStocksCIS
4
100
本人確認中
「メモリ」は、製品が分離するまで1つの取引に聞こえます。
Micronは、メモリおよびストレージ市場においてDRAM、NAND、NOR製品を展開しています。Sandiskは、フラッシュメモリとデータ保存ソリューションに焦点を当てています。
そのため、$SNDKB に対する$MUB は、「AIメモリ」という単純なティッカーの組としてよりも、プロダクトマップとしてのほうが有用です。
DRAMは作業用メモリです。プロセッサがアクティブなワークロードを処理するのを助けます。NANDフラッシュは永続ストレージです。電源を落としてもデータを保持します。どちらもデータの成長の恩恵を受け得ますが、価格サイクル、在庫、顧客需要、供給規律は、必ずしも同じように動く必要はありません。
私の初心者向けチェックリストは次のとおりです:
1. 見出しはどのメモリタイプの話か?
2. シグナルは、ユニットなのか価格なのか在庫なのか?
3. そのプロダクトへの直接的なエクスポージャーが大きいのはどの企業か?
「メモリ」という言葉はセクターのラベルです。実際の経済的ドライバーは、その下にある製品です。
確認した情報源:MicronおよびSandiskの提出資料。アクティブなBinanceのペアは2026年8月6日に検証済み。
@BinanceCIS #bStocksCIS
「メモリ」は、製品が分離するまで1つの取引に聞こえます。
Micronは、メモリおよびストレージ市場においてDRAM、NAND、NOR製品を展開しています。Sandiskは、フラッシュメモリとデータ保存ソリューションに焦点を当てています。
そのため、$SNDKB に対する$MUB は、「AIメモリ」という単純なティッカーの組としてよりも、プロダクトマップとしてのほうが有用です。
DRAMは作業用メモリです。プロセッサがアクティブなワークロードを処理するのを助けます。NANDフラッシュは永続ストレージです。電源を落としてもデータを保持します。どちらもデータの成長の恩恵を受け得ますが、価格サイクル、在庫、顧客需要、供給規律は、必ずしも同じように動く必要はありません。
私の初心者向けチェックリストは次のとおりです:
1. 見出しはどのメモリタイプの話か?
2. シグナルは、ユニットなのか価格なのか在庫なのか?
3. そのプロダクトへの直接的なエクスポージャーが大きいのはどの企業か?
「メモリ」という言葉はセクターのラベルです。実際の経済的ドライバーは、その下にある製品です。
確認した情報源:MicronおよびSandiskの提出資料。アクティブなBinanceのペアは2026年8月6日に検証済み。
@BinanceCIS #bStocksCIS
Micronは、メモリおよびストレージ市場においてDRAM、NAND、NOR製品を展開しています。Sandiskは、フラッシュメモリとデータ保存ソリューションに焦点を当てています。
そのため、$SNDKB に対する$MUB は、「AIメモリ」という単純なティッカーの組としてよりも、プロダクトマップとしてのほうが有用です。
DRAMは作業用メモリです。プロセッサがアクティブなワークロードを処理するのを助けます。NANDフラッシュは永続ストレージです。電源を落としてもデータを保持します。どちらもデータの成長の恩恵を受け得ますが、価格サイクル、在庫、顧客需要、供給規律は、必ずしも同じように動く必要はありません。
私の初心者向けチェックリストは次のとおりです:
1. 見出しはどのメモリタイプの話か?
2. シグナルは、ユニットなのか価格なのか在庫なのか?
3. そのプロダクトへの直接的なエクスポージャーが大きいのはどの企業か?
「メモリ」という言葉はセクターのラベルです。実際の経済的ドライバーは、その下にある製品です。
確認した情報源:MicronおよびSandiskの提出資料。アクティブなBinanceのペアは2026年8月6日に検証済み。
@BinanceCIS #bStocksCIS
5
149
ログインして、さらにコンテンツを読む
厳選トピックで世界の暗号資産トレーダーの仲間入り
⚡️ 暗号資産に関する最新かつ有益な情報が見つかります。
💬 世界最大の暗号資産取引所から信頼されています。
👍 認証を受けたクリエイターから、有益なインサイトを得られます。
メール / 電話番号
トレンドトピック
FedMinutesFocusOnOctoberPause
閲覧回数 77,751
906人が討論中
⚡ FRBのひとつの決定が市場を動かす可能性
10月には、再び重要なFRBの決定が下されるかもしれません。
最新の議事要旨では、利上げの一時停止が焦点となっています。
株式、債券、暗号資産に影響を与える可能性があります。
決定後、リスク選好が急速に変化するかもしれません。
ビットコインが最大の恩恵を受けるのでしょうか? 🚀
$BTC $ETH $BNB
#fedminutesfocusonoctoberpause
CryptoMahibaloch
·いいね:8件
·閲覧回数 12.1k
BinanceLaunchesBinanceIntelligence
閲覧回数 1M
6,169人が討論中
EvernorthDelaysNasdaqDebutToOct12
閲覧回数 3,884
167人が討論中