
RCipheR
25 投稿

RCipheR
報告
ユーザーをブロック
加密貨幣及幣安市場分析 | 技術洞察與價格趨勢 | 僅供教 請注意:本帳號分享的所有內容僅供教育、資訊和分析之用。我並非財務顧問,此處發布的任何內容均不應被視為財務建議。在做出任何交易決策之前,請務必自行研究(DYOR)並妥善管理風險。歡迎加入我的行列,一同追蹤圖表形態、分析市場變化,探索不斷發展的 Web3 世界!
15 フォロー
5 フォロワー
30 いいね
投稿
·
--
記事
翻訳参照
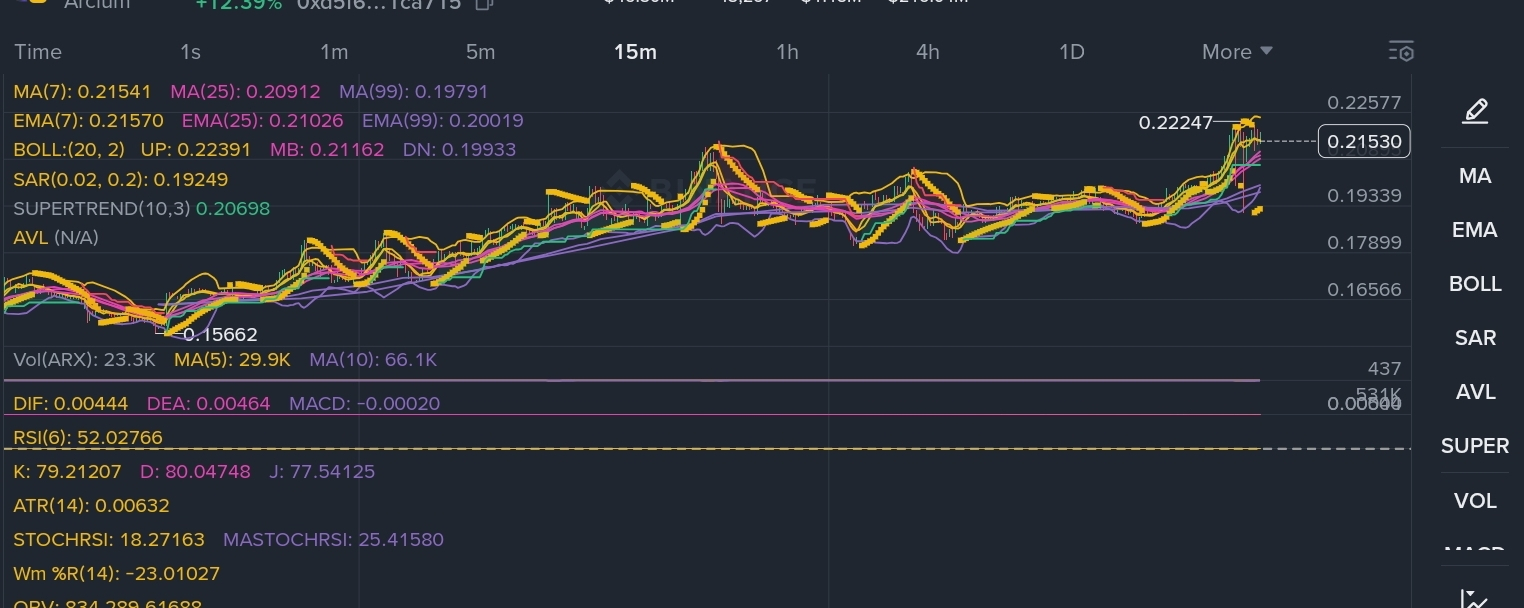
Deep Dive Market Analysis: Arcium ARX Parabolic Surge and Technical OutlookArcium has recently emerged as a standout performer in the digital asset market, blending a powerful narrative in confidential computing with exceptional price action. As a parallelized confidential computing network built on Solana, Arcium utilizes Multi-Party Computation to process encrypted data for Web3 and artificial intelligence applications. The native ARX token is clearly responding to this strong fundamental backdrop, recording double-digit daily percentage gains and pushing past key psychological barriers.
A careful examination of the recent market data reveals intense bullish momentum, alongside structural signals that demand strict risk management from active market participants.
Fundamentally, Arcium boasts a fixed total supply of one billion tokens with a current circulating market capitalization of approximately 46 million dollars. The position of the project at the intersection of Solana infrastructure, zero-knowledge privacy, and AI data processing makes it a highly attractive narrative play.
Technically, ARX is in a dominant uptrend but is flashing overheating signals on the highest timeframes. Traders should watch the 0.222 local high as the immediate breakout trigger. A decisive flip of this resistance into support opens the door for further price discovery. Alternatively, a breakdown below the 15-minute dynamic support could send the token to retest the 0.190 to 0.200 accumulation zones. Patience, proper position sizing, and waiting for confirmed support tests are the optimal strategies in this highly volatile environment.
$ARX #altcoins #Arcium
{alpha}(560xd5f6ef5deabe61e6d5cdb49bfb6f156f2c1ca715)
Deep Dive Market Analysis: Arcium ARX Parabolic Surge and Technical Outlook
Arcium has recently emerged as a standout performer in the digital asset market, blending a powerful narrative in confidential computing with exceptional price action. As a parallelized confidential computing network built on Solana, Arcium utilizes Multi-Party Computation to process encrypted data for Web3 and artificial intelligence applications. The native ARX token is clearly responding to this strong fundamental backdrop, recording double-digit daily percentage gains and pushing past key psychological barriers.
A careful examination of the recent market data reveals intense bullish momentum, alongside structural signals that demand strict risk management from active market participants.
Fundamentally, Arcium boasts a fixed total supply of one billion tokens with a current circulating market capitalization of approximately 46 million dollars. The position of the project at the intersection of Solana infrastructure, zero-knowledge privacy, and AI data processing makes it a highly attractive narrative play.
Technically, ARX is in a dominant uptrend but is flashing overheating signals on the highest timeframes. Traders should watch the 0.222 local high as the immediate breakout trigger. A decisive flip of this resistance into support opens the door for further price discovery. Alternatively, a breakdown below the 15-minute dynamic support could send the token to retest the 0.190 to 0.200 accumulation zones. Patience, proper position sizing, and waiting for confirmed support tests are the optimal strategies in this highly volatile environment.
$ARX #altcoins #Arcium
A careful examination of the recent market data reveals intense bullish momentum, alongside structural signals that demand strict risk management from active market participants.
Fundamentally, Arcium boasts a fixed total supply of one billion tokens with a current circulating market capitalization of approximately 46 million dollars. The position of the project at the intersection of Solana infrastructure, zero-knowledge privacy, and AI data processing makes it a highly attractive narrative play.
Technically, ARX is in a dominant uptrend but is flashing overheating signals on the highest timeframes. Traders should watch the 0.222 local high as the immediate breakout trigger. A decisive flip of this resistance into support opens the door for further price discovery. Alternatively, a breakdown below the 15-minute dynamic support could send the token to retest the 0.190 to 0.200 accumulation zones. Patience, proper position sizing, and waiting for confirmed support tests are the optimal strategies in this highly volatile environment.
$ARX #altcoins #Arcium
1
309
·
--
記事
翻訳参照
$BANK: Can It Build Momentum in the Next Market Cycle?$BANK is drawing attention as traders look for smaller-cap tokens with strong community engagement and room for volatility-driven moves. Like many emerging altcoins, its price action can shift quickly as liquidity, sentiment, and broader market conditions change.
What matters most for $BANK
Liquidity and trading volume
A growing volume trend can signal increasing market participation, while thin liquidity may amplify both rallies and sell-offs. Large price moves are not always a sign of sustainable demand.
Community narrative
For community-led tokens, visibility on social platforms, holder activity, and ecosystem updates can strongly influence sentiment. Momentum may strengthen when attention is backed by consistent engagement rather than short-lived hype.
Broader crypto market direction
$BANK is likely to remain sensitive to Bitcoin’s trend and overall altcoin risk appetite. When market conditions weaken, higher-volatility tokens can experience sharper pullbacks.
Key technical structure
Instead of focusing on a single price target, watch whether BANK can form higher lows, sustain volume during advances, and hold important support areas after any breakout. A move without follow-through volume can lose momentum quickly.
Balanced outlook
The bullish case depends on sustained community growth, improving liquidity, and a supportive altcoin market. On the other hand, rapid profit-taking, low liquidity, and changing sentiment could lead to sudden volatility.
BANK may offer an interesting narrative for traders watching emerging community tokens, but it remains a high-risk asset. Focus on verified information, token liquidity, supply dynamics, and your own risk tolerance before making any trading decision.
#Crypto #Altcoins #BinanceSquare #CryptoAnalysis
$BANK: Can It Build Momentum in the Next Market Cycle?
$BANK is drawing attention as traders look for smaller-cap tokens with strong community engagement and room for volatility-driven moves. Like many emerging altcoins, its price action can shift quickly as liquidity, sentiment, and broader market conditions change.
What matters most for $BANK
Liquidity and trading volume
A growing volume trend can signal increasing market participation, while thin liquidity may amplify both rallies and sell-offs. Large price moves are not always a sign of sustainable demand.
Community narrative
For community-led tokens, visibility on social platforms, holder activity, and ecosystem updates can strongly influence sentiment. Momentum may strengthen when attention is backed by consistent engagement rather than short-lived hype.
Broader crypto market direction
$BANK is likely to remain sensitive to Bitcoin’s trend and overall altcoin risk appetite. When market conditions weaken, higher-volatility tokens can experience sharper pullbacks.
Key technical structure
Instead of focusing on a single price target, watch whether BANK can form higher lows, sustain volume during advances, and hold important support areas after any breakout. A move without follow-through volume can lose momentum quickly.
Balanced outlook
The bullish case depends on sustained community growth, improving liquidity, and a supportive altcoin market. On the other hand, rapid profit-taking, low liquidity, and changing sentiment could lead to sudden volatility.
BANK may offer an interesting narrative for traders watching emerging community tokens, but it remains a high-risk asset. Focus on verified information, token liquidity, supply dynamics, and your own risk tolerance before making any trading decision.
#Crypto #Altcoins #BinanceSquare #CryptoAnalysis
What matters most for $BANK
Liquidity and trading volume
A growing volume trend can signal increasing market participation, while thin liquidity may amplify both rallies and sell-offs. Large price moves are not always a sign of sustainable demand.
Community narrative
For community-led tokens, visibility on social platforms, holder activity, and ecosystem updates can strongly influence sentiment. Momentum may strengthen when attention is backed by consistent engagement rather than short-lived hype.
Broader crypto market direction
$BANK is likely to remain sensitive to Bitcoin’s trend and overall altcoin risk appetite. When market conditions weaken, higher-volatility tokens can experience sharper pullbacks.
Key technical structure
Instead of focusing on a single price target, watch whether BANK can form higher lows, sustain volume during advances, and hold important support areas after any breakout. A move without follow-through volume can lose momentum quickly.
Balanced outlook
The bullish case depends on sustained community growth, improving liquidity, and a supportive altcoin market. On the other hand, rapid profit-taking, low liquidity, and changing sentiment could lead to sudden volatility.
BANK may offer an interesting narrative for traders watching emerging community tokens, but it remains a high-risk asset. Focus on verified information, token liquidity, supply dynamics, and your own risk tolerance before making any trading decision.
#Crypto #Altcoins #BinanceSquare #CryptoAnalysis
2
371
·
--
記事
翻訳参照
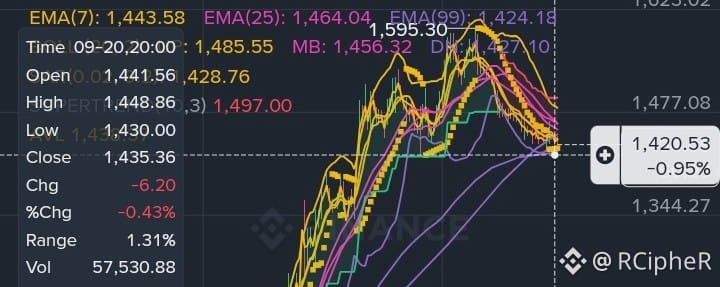
ZEC Alert: Oversold or Freefall? Zcash Tests Critical $1,428 SupportZcash ($ZEC) has faced a sharp correction today, shedding nearly 6% and sliding toward the $1,434 mark. As bears dominate the session, traders are watching closely to see if the 24-hour low can hold.
Technical Snapshot (1H & 15M Timeframes)
Bearish Grip: Price remains firmly below the MA7 and MA25, confirming the aggressive downtrend. The "waterfall" action along the lower Bollinger Band indicates strong selling volume.Oversold Signals: The RSI on the 1-hour chart is hovering near 31, dangerously close to oversold territory. This typically suggests selling exhaustion could be near, potentially triggering a relief bounce back toward $1,445 - $1,450.Momentum: MACD remains negative, though the 15-minute histogram shows slight deceleration in selling pressure.
Key Levels to Watch
Critical Support: $1,428 (24h Low). A breakdown below this level could open the door for further downside discovery.
Immediate Resistance: $1,442 (MA7) and $1,465 (MA25). Bulls need to reclaim these levels to invalidate the immediate bearish structure.
Trade Idea
Conservative traders may wait for a confirmed candle close above $1,445 before considering long positions. Aggressive traders might look for scalps off the $1,428 support, but be wary of "catching a falling knife."
Disclaimer: This content is for educational purposes only and does not constitute financial advice. Always do your own research (DYOR) before trading.
#ZEC #Zcash #CryptoTrading #TechnicalAnalysis #BinanceSquare
ZEC Alert: Oversold or Freefall? Zcash Tests Critical $1,428 Support
Zcash ($ZEC) has faced a sharp correction today, shedding nearly 6% and sliding toward the $1,434 mark. As bears dominate the session, traders are watching closely to see if the 24-hour low can hold.
Technical Snapshot (1H & 15M Timeframes)
Bearish Grip: Price remains firmly below the MA7 and MA25, confirming the aggressive downtrend. The "waterfall" action along the lower Bollinger Band indicates strong selling volume.Oversold Signals: The RSI on the 1-hour chart is hovering near 31, dangerously close to oversold territory. This typically suggests selling exhaustion could be near, potentially triggering a relief bounce back toward $1,445 - $1,450.Momentum: MACD remains negative, though the 15-minute histogram shows slight deceleration in selling pressure.
Key Levels to Watch
Critical Support: $1,428 (24h Low). A breakdown below this level could open the door for further downside discovery.
Immediate Resistance: $1,442 (MA7) and $1,465 (MA25). Bulls need to reclaim these levels to invalidate the immediate bearish structure.
Trade Idea
Conservative traders may wait for a confirmed candle close above $1,445 before considering long positions. Aggressive traders might look for scalps off the $1,428 support, but be wary of "catching a falling knife."
Disclaimer: This content is for educational purposes only and does not constitute financial advice. Always do your own research (DYOR) before trading.
#ZEC #Zcash #CryptoTrading #TechnicalAnalysis #BinanceSquare
Technical Snapshot (1H & 15M Timeframes)
Bearish Grip: Price remains firmly below the MA7 and MA25, confirming the aggressive downtrend. The "waterfall" action along the lower Bollinger Band indicates strong selling volume.Oversold Signals: The RSI on the 1-hour chart is hovering near 31, dangerously close to oversold territory. This typically suggests selling exhaustion could be near, potentially triggering a relief bounce back toward $1,445 - $1,450.Momentum: MACD remains negative, though the 15-minute histogram shows slight deceleration in selling pressure.
Key Levels to Watch
Critical Support: $1,428 (24h Low). A breakdown below this level could open the door for further downside discovery.
Immediate Resistance: $1,442 (MA7) and $1,465 (MA25). Bulls need to reclaim these levels to invalidate the immediate bearish structure.
Trade Idea
Conservative traders may wait for a confirmed candle close above $1,445 before considering long positions. Aggressive traders might look for scalps off the $1,428 support, but be wary of "catching a falling knife."
Disclaimer: This content is for educational purposes only and does not constitute financial advice. Always do your own research (DYOR) before trading.
#ZEC #Zcash #CryptoTrading #TechnicalAnalysis #BinanceSquare
1
289
·
--
記事
翻訳参照
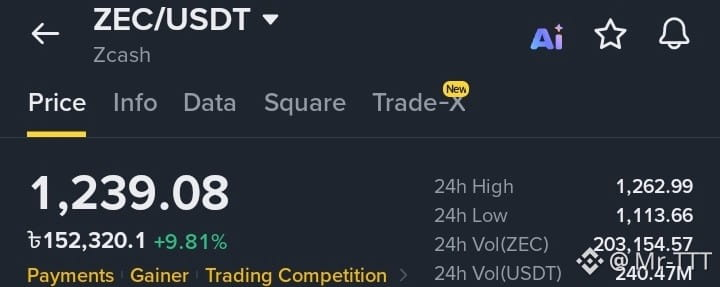
ZEC/USDT Multi-Timeframe Market Analysis$ZEC The ZEC/USDT trading pair is currently exhibiting a strong parabolic breakout and is trading at approximately $1,239.08, marking a rise of over 9.8% in the last 24 hours. Price action indicates a robust bullish trend; however, multi-timeframe analysis reveals that after touching a recent local peak of $1,262.99, the market is approaching a critical pivot point.
Market Depth and Order Book Imbalance
Dominance of the 'Buy Wall': The market depth chart reveals a significant bullish imbalance, with 'bids' (buy orders) accounting for 84.01% of the total order book volume, while 'asks' (sell orders) make up only 15.99%.
Liquidity Support: This high concentration of bids has established a strong structural price floor. A substantial volume of 'buy limit orders' is positioned to absorb potential selling pressure, effectively limiting the risk of an immediate price drop.
Technical Indicator Analysis
1-Day (Macro Trend): The daily chart shows a vertical price expansion. The RSI(6) indicator stands at 79.98, signaling an 'overbought' condition, while the MACD (DIF: 151.88, DEA: 120.61) displays a significant positive separation. While this confirms immense buying momentum, from a mathematical perspective, it also suggests the need for a 'cooling-off period' or a phase of temporary stabilization. 4-Hour (Medium-term): A market consolidation phase has begun. Although the RSI remains high at 73.52, the MACD histogram has turned slightly negative (MACD: -4.13); this indicates a slowdown in medium-term momentum as traders lock in profits just below the $1,260 resistance level.
1-Hour & 15-Minute (Micro-trend): Short-term momentum is attempting to stabilize. The 1-hour MACD is positive (6.75), and 15-minute price action is hugging the 'Upper Bollinger Band,' with the $1,230 zone acting as a new local support level. The 'SuperTrend' indicator is flashing a strong green (positive) signal.
Key Levels and Forecasts
Immediate Resistance: $1,262.99 (24-hour high). Breaking this ceiling requires a price increase of $23.91 (+1.93%).
Primary Support: $1,170.32 (Middle Bollinger Band on the 4-hour chart).
Macro Support Floor: $1,113.66 (24-hour low). A drop to this level would represent a 10.1% decline from the current trading price.
Driven by massive spot market demand and a robust order book, the current market trend is clearly bullish. However, the RSI indicator on both the 1-day and 4-hour charts signals 'overbought' conditions; consequently, opening new 'long positions' at the current $1,239 level carries a high risk of a price retracement. Before any further attempts at price discovery, the asset is most likely to maintain a stable or sideways consolidation pattern in the short term, trading between the $1,170 support and the $1,260 resistance levels.
#zec #Binance #TrendingTopic
ZEC/USDT Multi-Timeframe Market Analysis
$ZEC The ZEC/USDT trading pair is currently exhibiting a strong parabolic breakout and is trading at approximately $1,239.08, marking a rise of over 9.8% in the last 24 hours. Price action indicates a robust bullish trend; however, multi-timeframe analysis reveals that after touching a recent local peak of $1,262.99, the market is approaching a critical pivot point.
Market Depth and Order Book Imbalance
Dominance of the 'Buy Wall': The market depth chart reveals a significant bullish imbalance, with 'bids' (buy orders) accounting for 84.01% of the total order book volume, while 'asks' (sell orders) make up only 15.99%.
Liquidity Support: This high concentration of bids has established a strong structural price floor. A substantial volume of 'buy limit orders' is positioned to absorb potential selling pressure, effectively limiting the risk of an immediate price drop.
Technical Indicator Analysis
1-Day (Macro Trend): The daily chart shows a vertical price expansion. The RSI(6) indicator stands at 79.98, signaling an 'overbought' condition, while the MACD (DIF: 151.88, DEA: 120.61) displays a significant positive separation. While this confirms immense buying momentum, from a mathematical perspective, it also suggests the need for a 'cooling-off period' or a phase of temporary stabilization. 4-Hour (Medium-term): A market consolidation phase has begun. Although the RSI remains high at 73.52, the MACD histogram has turned slightly negative (MACD: -4.13); this indicates a slowdown in medium-term momentum as traders lock in profits just below the $1,260 resistance level.
1-Hour & 15-Minute (Micro-trend): Short-term momentum is attempting to stabilize. The 1-hour MACD is positive (6.75), and 15-minute price action is hugging the 'Upper Bollinger Band,' with the $1,230 zone acting as a new local support level. The 'SuperTrend' indicator is flashing a strong green (positive) signal.
Key Levels and Forecasts
Immediate Resistance: $1,262.99 (24-hour high). Breaking this ceiling requires a price increase of $23.91 (+1.93%).
Primary Support: $1,170.32 (Middle Bollinger Band on the 4-hour chart).
Macro Support Floor: $1,113.66 (24-hour low). A drop to this level would represent a 10.1% decline from the current trading price.
Driven by massive spot market demand and a robust order book, the current market trend is clearly bullish. However, the RSI indicator on both the 1-day and 4-hour charts signals 'overbought' conditions; consequently, opening new 'long positions' at the current $1,239 level carries a high risk of a price retracement. Before any further attempts at price discovery, the asset is most likely to maintain a stable or sideways consolidation pattern in the short term, trading between the $1,170 support and the $1,260 resistance levels.
#zec #Binance #TrendingTopic
Market Depth and Order Book Imbalance
Dominance of the 'Buy Wall': The market depth chart reveals a significant bullish imbalance, with 'bids' (buy orders) accounting for 84.01% of the total order book volume, while 'asks' (sell orders) make up only 15.99%.
Liquidity Support: This high concentration of bids has established a strong structural price floor. A substantial volume of 'buy limit orders' is positioned to absorb potential selling pressure, effectively limiting the risk of an immediate price drop.
Technical Indicator Analysis
1-Day (Macro Trend): The daily chart shows a vertical price expansion. The RSI(6) indicator stands at 79.98, signaling an 'overbought' condition, while the MACD (DIF: 151.88, DEA: 120.61) displays a significant positive separation. While this confirms immense buying momentum, from a mathematical perspective, it also suggests the need for a 'cooling-off period' or a phase of temporary stabilization. 4-Hour (Medium-term): A market consolidation phase has begun. Although the RSI remains high at 73.52, the MACD histogram has turned slightly negative (MACD: -4.13); this indicates a slowdown in medium-term momentum as traders lock in profits just below the $1,260 resistance level.
1-Hour & 15-Minute (Micro-trend): Short-term momentum is attempting to stabilize. The 1-hour MACD is positive (6.75), and 15-minute price action is hugging the 'Upper Bollinger Band,' with the $1,230 zone acting as a new local support level. The 'SuperTrend' indicator is flashing a strong green (positive) signal.
Key Levels and Forecasts
Immediate Resistance: $1,262.99 (24-hour high). Breaking this ceiling requires a price increase of $23.91 (+1.93%).
Primary Support: $1,170.32 (Middle Bollinger Band on the 4-hour chart).
Macro Support Floor: $1,113.66 (24-hour low). A drop to this level would represent a 10.1% decline from the current trading price.
Driven by massive spot market demand and a robust order book, the current market trend is clearly bullish. However, the RSI indicator on both the 1-day and 4-hour charts signals 'overbought' conditions; consequently, opening new 'long positions' at the current $1,239 level carries a high risk of a price retracement. Before any further attempts at price discovery, the asset is most likely to maintain a stable or sideways consolidation pattern in the short term, trading between the $1,170 support and the $1,260 resistance levels.
#zec #Binance #TrendingTopic
1
208
·
--
記事
翻訳参照
ARX (Arcium) Technical Analysis: Is a Bullish Relief Rally Incoming?Technical Indicator Breakdown
1. Price Action & Bollinger Bands
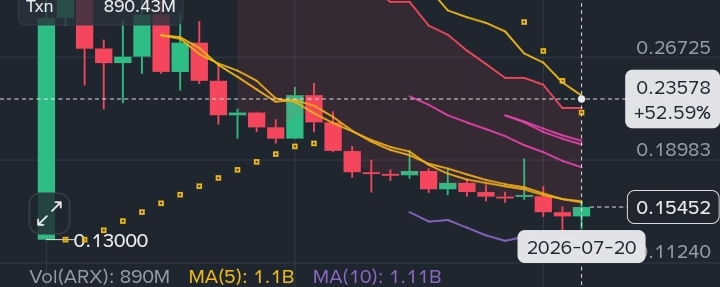
Support Bounce: ARX price found strong support at its recent bottom at $0.13000. As per the chart, the price successfully bounced back by touching the lower band of the Bollinger Band ($0.13057).
Moving Averages: The price is currently trading just below the MA(7) - $0.15793. If this level is broken, the next target will be the MA(25) - $0.20161.
2. Momentum Indicators (Oversold Recovery)
RSI (6): The RSI is currently at 31.93. This indicates that the market was in a severely oversold zone and now buyers are returning to the market from there.
Stochastic RSI: Stochastic RSI is reversing from the oversold zone (17.35), which is a clear signal of bullish momentum.
KDJ Indicator: KDJ is showing a positive crossover (J line has risen to 39.22), which increases the possibility of a price pump in the short-term.
Trading Strategy & Targets
Quick Note: The market is trying to create a bottom, so proper stop-loss must be used before taking any trade.
Immediate Resistance (Target 1): $0.15793 (MA 7 Breakout Confirmation)
Major Resistance (Target 2): $0.18448 (Bollinger Middle Band)
Bullish Target (Target 3): $0.20161 (MA 25)
Stop Loss (Invalidation Zone): If the daily candle closes below $0.13000, this bullish theory will be invalidated.
Conclusion
According to the overall indicator analysis, ARX is currently showing Seller Exhaustion. If the market remains stable with Bitcoin (BTC) movement, we can see a good Bullish Relief Rally or bounce back from ARX very soon.
Disclaimer: This analysis is for educational and informational purposes only and should not be considered as financial, investment, or trading advice. Cryptocurrency markets are highly volatile and carry a significant level of risk. Always DYOR (Do Your Own Research) and consult with a professional financial advisor before making any investment decisions. The author is not responsible for any financial losses incurred from trading based on this information.
#Write2Earn #WIF #Binance #TrendingTopic $BNB $ETH
{spot}(BNBUSDT)
ARX (Arcium) Technical Analysis: Is a Bullish Relief Rally Incoming?
Technical Indicator Breakdown
1. Price Action & Bollinger Bands
Support Bounce: ARX price found strong support at its recent bottom at $0.13000. As per the chart, the price successfully bounced back by touching the lower band of the Bollinger Band ($0.13057).
Moving Averages: The price is currently trading just below the MA(7) - $0.15793. If this level is broken, the next target will be the MA(25) - $0.20161.
2. Momentum Indicators (Oversold Recovery)
RSI (6): The RSI is currently at 31.93. This indicates that the market was in a severely oversold zone and now buyers are returning to the market from there.
Stochastic RSI: Stochastic RSI is reversing from the oversold zone (17.35), which is a clear signal of bullish momentum.
KDJ Indicator: KDJ is showing a positive crossover (J line has risen to 39.22), which increases the possibility of a price pump in the short-term.
Trading Strategy & Targets
Quick Note: The market is trying to create a bottom, so proper stop-loss must be used before taking any trade.
Immediate Resistance (Target 1): $0.15793 (MA 7 Breakout Confirmation)
Major Resistance (Target 2): $0.18448 (Bollinger Middle Band)
Bullish Target (Target 3): $0.20161 (MA 25)
Stop Loss (Invalidation Zone): If the daily candle closes below $0.13000, this bullish theory will be invalidated.
Conclusion
According to the overall indicator analysis, ARX is currently showing Seller Exhaustion. If the market remains stable with Bitcoin (BTC) movement, we can see a good Bullish Relief Rally or bounce back from ARX very soon.
Disclaimer: This analysis is for educational and informational purposes only and should not be considered as financial, investment, or trading advice. Cryptocurrency markets are highly volatile and carry a significant level of risk. Always DYOR (Do Your Own Research) and consult with a professional financial advisor before making any investment decisions. The author is not responsible for any financial losses incurred from trading based on this information.
#Write2Earn #WIF #Binance #TrendingTopic $BNB $ETH
1. Price Action & Bollinger Bands
Support Bounce: ARX price found strong support at its recent bottom at $0.13000. As per the chart, the price successfully bounced back by touching the lower band of the Bollinger Band ($0.13057).
Moving Averages: The price is currently trading just below the MA(7) - $0.15793. If this level is broken, the next target will be the MA(25) - $0.20161.
2. Momentum Indicators (Oversold Recovery)
RSI (6): The RSI is currently at 31.93. This indicates that the market was in a severely oversold zone and now buyers are returning to the market from there.
Stochastic RSI: Stochastic RSI is reversing from the oversold zone (17.35), which is a clear signal of bullish momentum.
KDJ Indicator: KDJ is showing a positive crossover (J line has risen to 39.22), which increases the possibility of a price pump in the short-term.
Trading Strategy & Targets
Quick Note: The market is trying to create a bottom, so proper stop-loss must be used before taking any trade.
Immediate Resistance (Target 1): $0.15793 (MA 7 Breakout Confirmation)
Major Resistance (Target 2): $0.18448 (Bollinger Middle Band)
Bullish Target (Target 3): $0.20161 (MA 25)
Stop Loss (Invalidation Zone): If the daily candle closes below $0.13000, this bullish theory will be invalidated.
Conclusion
According to the overall indicator analysis, ARX is currently showing Seller Exhaustion. If the market remains stable with Bitcoin (BTC) movement, we can see a good Bullish Relief Rally or bounce back from ARX very soon.
Disclaimer: This analysis is for educational and informational purposes only and should not be considered as financial, investment, or trading advice. Cryptocurrency markets are highly volatile and carry a significant level of risk. Always DYOR (Do Your Own Research) and consult with a professional financial advisor before making any investment decisions. The author is not responsible for any financial losses incurred from trading based on this information.
#Write2Earn #WIF #Binance #TrendingTopic $BNB $ETH
1
438
·
--
記事
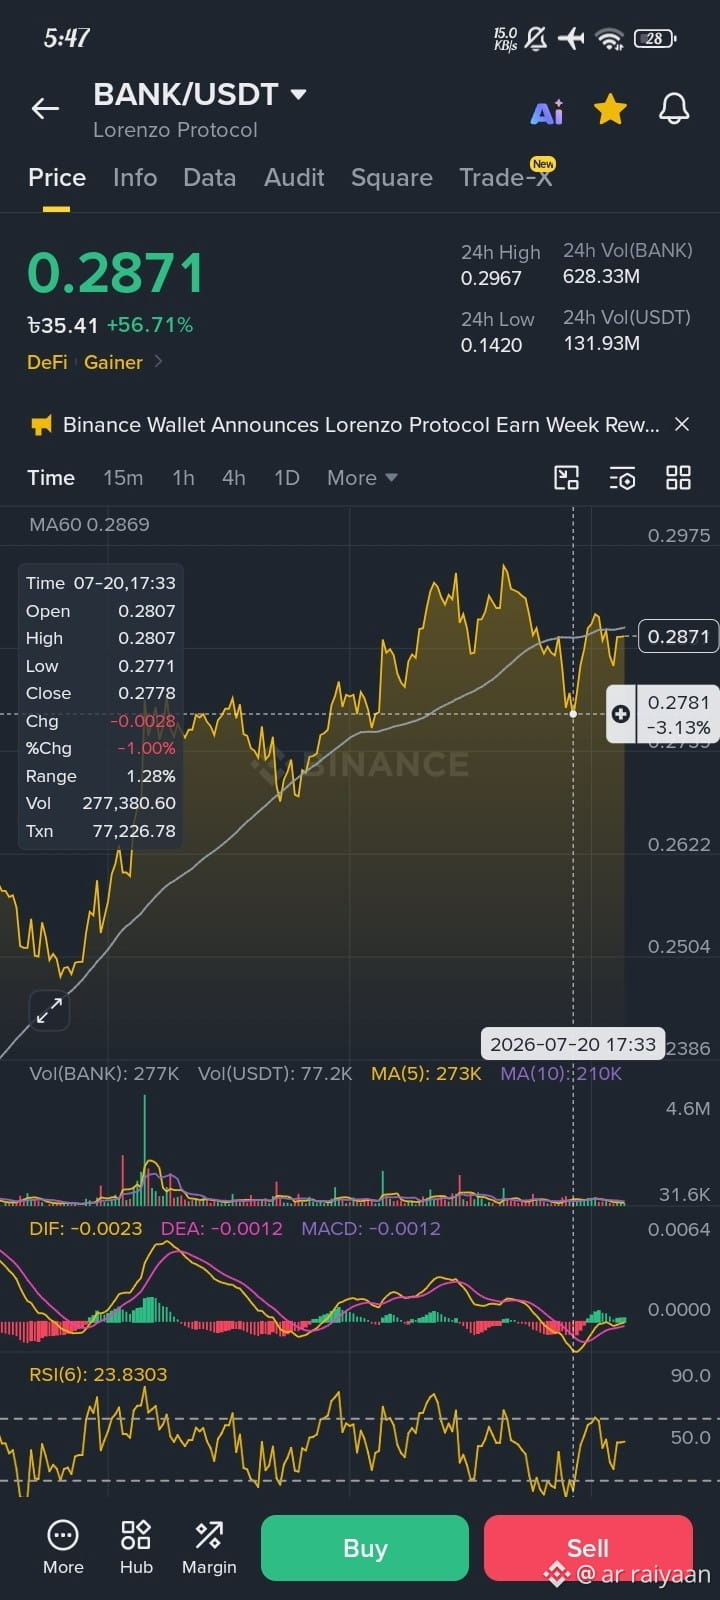
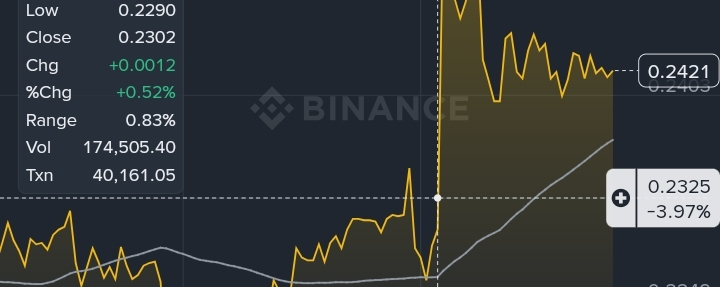
$BANK/USDT ブレイクアウト:テクニカル指標とオンチェーンデータは何を示しているのか?現在のBANK/USDTペアの値動きは、本当に驚くべきものです!過去24時間で約129%も上昇し、市場の上昇銘柄トップの一つとして確固たる地位を築いています。これほど大きな値動きの後は、トレーダーが利益確定をするのは自然なことです。だからこそ、価格は現在少し回復しており、0.24ドルに近づいています。
しかし、私にとって最も前向きな点は、価格がクラッシュしていないことです。むしろ、MA60(移動平均60)のすぐ上でその水準を維持しています。これは、買い手が依然として市場を完全に支配していることをはっきり示しています。
$BANK/USDT ブレイクアウト:テクニカル指標とオンチェーンデータは何を示しているのか?
現在のBANK/USDTペアの値動きは、本当に驚くべきものです!過去24時間で約129%も上昇し、市場の上昇銘柄トップの一つとして確固たる地位を築いています。これほど大きな値動きの後は、トレーダーが利益確定をするのは自然なことです。だからこそ、価格は現在少し回復しており、0.24ドルに近づいています。
しかし、私にとって最も前向きな点は、価格がクラッシュしていないことです。むしろ、MA60(移動平均60)のすぐ上でその水準を維持しています。これは、買い手が依然として市場を完全に支配していることをはっきり示しています。
しかし、私にとって最も前向きな点は、価格がクラッシュしていないことです。むしろ、MA60(移動平均60)のすぐ上でその水準を維持しています。これは、買い手が依然として市場を完全に支配していることをはっきり示しています。
1
290
·
--
記事
翻訳参照
ARX (Arcium) Technical Analysis: Is the Oversold RSI Signaling a Short-Term Bounce?Today, we will do an in-depth analysis of the ARX (Arcium) token based on on-chain data and daily (1D) charts from Binance Web3 Wallet.
The token is currently in an important price zone, which may attract the attention of short-term traders.
🔍 ARX On-Chain Metrics at a Glance
Before moving on to the trading charts, let’s take a look at the fundamentals and on-chain status of the token:
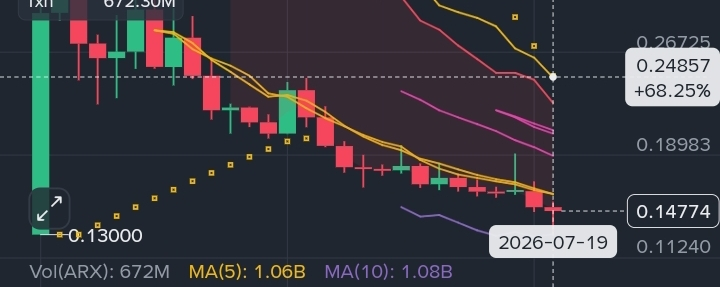
Current Price: $0.14774 (down about 1.11% to 1.35% in the last 24 hours)
Market Cap: $30.83M (A micro-cap gem, so expect some wild price actions!)
Fully Diluted Valuation (FDV): (Huge gap here, meaning massive token unlocks could dilute the supply later. Keep an eye on it!)
Chain Liquidity: $1.24M (Liquidity is a bit tight, so expect higher slippage if you are throwing in big orders.)
Total Chain Holders: 47,107 (Its holder base is quite strong as a low-cap token)
📉 Technical Analysis (1D Chart Analysis)
1. Trend and Moving Average (MA)
According to the daily chart (1D), ARX has been bleeding heavily in a strong bearish trend over the past few days.
MA(7) indicator is currently at $0.16056 and MA(25) is currently at $0.20595.
Since the current price ($0.14774) is below these two moving averages, bears are clearly dominating the short to medium-term action.
2. Deeply Oversold RSI
The most important and interesting part of this chart is its RSI (6) indicator. Currently, the RSI has dropped to the 18.10 level.
💡 Note: As a general rule, when the RSI falls below 30, it is considered 'oversold'. An RSI falling to 18.10 means that the selling pressure has reached its peak and the market may show a relief rally or price rebound at any time.
3. Important Support and Resistance Levels
Main Support: According to the chart, $0.13000 is a very important psychological and technical support level just below the current level.
Nearby Resistance: If the price bounces from here, the first hurdle will be $0.16056 (MA 7). If it can be overcome, the next target could be $0.20595 (MA 25).
🎯 Conclusion & Strategy
Technically, ARX is currently at the bottom or oversold zone, which can be a good entry zone for risk-takers or short-term bounce traders. However, keep in mind that such coins are very risky due to low liquidity and high FDV.
Bullish Scenario: If the price can hold the $0.13000 support, a quick bounce to $0.160 - $0.200 can be seen due to the oversold RSI.
Bearish Scenario: If the price closes the daily candle below $0.13000, the downtrend may be prolonged.
⚠️ Disclaimer: This is not financial advice. Crypto markets are extremely risky, so please do your own research (DYOR) before taking any trades.
#TrendingTopic #Write2Earn #WIF #Binance #altcoins
ARX (Arcium) Technical Analysis: Is the Oversold RSI Signaling a Short-Term Bounce?
Today, we will do an in-depth analysis of the ARX (Arcium) token based on on-chain data and daily (1D) charts from Binance Web3 Wallet.
The token is currently in an important price zone, which may attract the attention of short-term traders.
🔍 ARX On-Chain Metrics at a Glance
Before moving on to the trading charts, let’s take a look at the fundamentals and on-chain status of the token:
Current Price: $0.14774 (down about 1.11% to 1.35% in the last 24 hours)
Market Cap: $30.83M (A micro-cap gem, so expect some wild price actions!)
Fully Diluted Valuation (FDV): (Huge gap here, meaning massive token unlocks could dilute the supply later. Keep an eye on it!)
Chain Liquidity: $1.24M (Liquidity is a bit tight, so expect higher slippage if you are throwing in big orders.)
Total Chain Holders: 47,107 (Its holder base is quite strong as a low-cap token)
📉 Technical Analysis (1D Chart Analysis)
1. Trend and Moving Average (MA)
According to the daily chart (1D), ARX has been bleeding heavily in a strong bearish trend over the past few days.
MA(7) indicator is currently at $0.16056 and MA(25) is currently at $0.20595.
Since the current price ($0.14774) is below these two moving averages, bears are clearly dominating the short to medium-term action.
2. Deeply Oversold RSI
The most important and interesting part of this chart is its RSI (6) indicator. Currently, the RSI has dropped to the 18.10 level.
💡 Note: As a general rule, when the RSI falls below 30, it is considered 'oversold'. An RSI falling to 18.10 means that the selling pressure has reached its peak and the market may show a relief rally or price rebound at any time.
3. Important Support and Resistance Levels
Main Support: According to the chart, $0.13000 is a very important psychological and technical support level just below the current level.
Nearby Resistance: If the price bounces from here, the first hurdle will be $0.16056 (MA 7). If it can be overcome, the next target could be $0.20595 (MA 25).
🎯 Conclusion & Strategy
Technically, ARX is currently at the bottom or oversold zone, which can be a good entry zone for risk-takers or short-term bounce traders. However, keep in mind that such coins are very risky due to low liquidity and high FDV.
Bullish Scenario: If the price can hold the $0.13000 support, a quick bounce to $0.160 - $0.200 can be seen due to the oversold RSI.
Bearish Scenario: If the price closes the daily candle below $0.13000, the downtrend may be prolonged.
⚠️ Disclaimer: This is not financial advice. Crypto markets are extremely risky, so please do your own research (DYOR) before taking any trades.
#TrendingTopic #Write2Earn #WIF #Binance #altcoins
The token is currently in an important price zone, which may attract the attention of short-term traders.
🔍 ARX On-Chain Metrics at a Glance
Before moving on to the trading charts, let’s take a look at the fundamentals and on-chain status of the token:
Current Price: $0.14774 (down about 1.11% to 1.35% in the last 24 hours)
Market Cap: $30.83M (A micro-cap gem, so expect some wild price actions!)
Fully Diluted Valuation (FDV): (Huge gap here, meaning massive token unlocks could dilute the supply later. Keep an eye on it!)
Chain Liquidity: $1.24M (Liquidity is a bit tight, so expect higher slippage if you are throwing in big orders.)
Total Chain Holders: 47,107 (Its holder base is quite strong as a low-cap token)
📉 Technical Analysis (1D Chart Analysis)
1. Trend and Moving Average (MA)
According to the daily chart (1D), ARX has been bleeding heavily in a strong bearish trend over the past few days.
MA(7) indicator is currently at $0.16056 and MA(25) is currently at $0.20595.
Since the current price ($0.14774) is below these two moving averages, bears are clearly dominating the short to medium-term action.
2. Deeply Oversold RSI
The most important and interesting part of this chart is its RSI (6) indicator. Currently, the RSI has dropped to the 18.10 level.
💡 Note: As a general rule, when the RSI falls below 30, it is considered 'oversold'. An RSI falling to 18.10 means that the selling pressure has reached its peak and the market may show a relief rally or price rebound at any time.
3. Important Support and Resistance Levels
Main Support: According to the chart, $0.13000 is a very important psychological and technical support level just below the current level.
Nearby Resistance: If the price bounces from here, the first hurdle will be $0.16056 (MA 7). If it can be overcome, the next target could be $0.20595 (MA 25).
🎯 Conclusion & Strategy
Technically, ARX is currently at the bottom or oversold zone, which can be a good entry zone for risk-takers or short-term bounce traders. However, keep in mind that such coins are very risky due to low liquidity and high FDV.
Bullish Scenario: If the price can hold the $0.13000 support, a quick bounce to $0.160 - $0.200 can be seen due to the oversold RSI.
Bearish Scenario: If the price closes the daily candle below $0.13000, the downtrend may be prolonged.
⚠️ Disclaimer: This is not financial advice. Crypto markets are extremely risky, so please do your own research (DYOR) before taking any trades.
#TrendingTopic #Write2Earn #WIF #Binance #altcoins
1
629
ログインして、さらにコンテンツを読む
厳選トピックで世界の暗号資産トレーダーの仲間入り
⚡️ 暗号資産に関する最新かつ有益な情報が見つかります。
💬 世界最大の暗号資産取引所から信頼されています。
👍 認証を受けたクリエイターから、有益なインサイトを得られます。
メール / 電話番号
トレンドトピック
CardanoAddedToX402KitForADAPayments
閲覧回数 2
20人が討論中
#cardanoaddedtox402kitforadapayments
🚨 カルダノがAI決済レースに参入! 🤖🔥
$ADA は、公式の x402 SDK の一員となり、アプリやAIエージェント向けに新しい決済レールを開きました。
💥 何が変わった?
• アプリは ADA または Cardano ネイティブトークンで API 呼び出しの支払いが可能
• 決済は標準的なWebリクエストを通じて直接行える
• アカウント、APIキー、従来のチェックアウトは不要
• カルダノは拡大するマシン・ツー・マシン決済エコシステムに参加
• x402 ファシリテーターはすでに、カルダノのプレ・プロダクション・ネットワーク上で実トランザクションを完了済み
これにより、$ADA は、自律エージェントがデータやオンラインサービスの支払いをますます必要とする中で、新しいAI+決済ユーティリティの語り口を得られる可能性があります。
⚠️ メインネットの採用と実際の決済ボリュームは、まだ育っていく必要があります。
🔥 これは新しい ADA の物語の始まりなのでしょうか?
#Cardano #ADA #AI
Faizan Crypto Learner
·いいね:0件
·閲覧回数 18
XRPRises8%
閲覧回数 6,032
370人が討論中
AMDHits$1TrillionMarketCap
閲覧回数 5
11人が討論中