
Muhamamd Adeel
634 投稿

Muhamamd Adeel
報告
ユーザーをブロック
Daily provide Latest News.
10 フォロー
52 フォロワー
59 いいね
投稿
すべて
引用
記事
翻訳参照
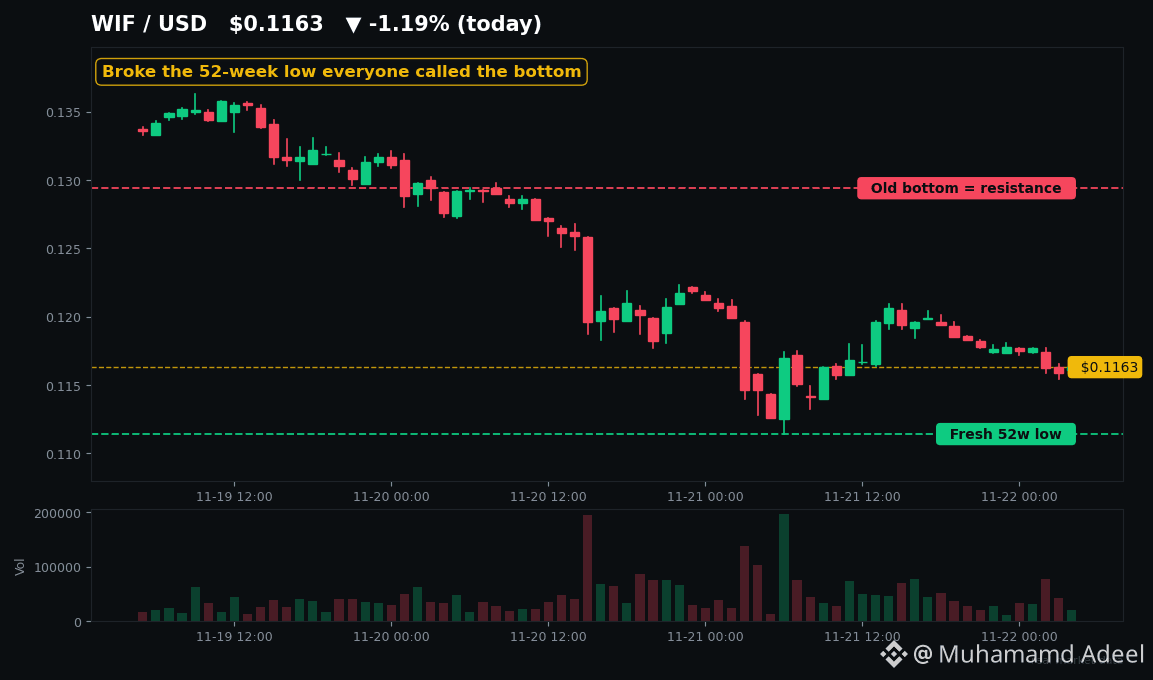
WIF Just Broke the "Bottom" Everyone TrustedEveryone called $0.1294 the bottom last week. $WIF just smashed through it.
WIF is trading near $0.116 today — a fresh 52-week low, down roughly 40% in 30 days, and 97.6% below its $4.83 all-time high from March 2024. Of the six big memes, it's the weakest performer this month. Even today's bounce tells the story: $WIF is up about 1.5% while DOGE and SHIB are up 5%. The dog in the hat is lagging its own bounce.
Here's what this really means. Last week, $0.1294 was the line everyone pointed at — "52-week low, RSI oversold, this is the floor." The floor didn't hold. Price stepped down through it to $0.111, and that old low is now resistance. That's how downtrends work: every "bottom" becomes the next ceiling until buyers actually prove otherwise.
The oversold case is real, though. Daily RSI is near 23 — deeply oversold territory. History says WIF bounces violently from extremes like this: +90% in two weeks in August 2024, +350% in spring 2025. But here's the catch nobody mentions — since December 2024, every single bounce made a lower high and rolled over. Oversold describes the downtrend. It doesn't end it.
And the structure underneath is ugly. There's no WIF-specific bad news — this is pure market drag after BTC flushed to $55.1K on Saturday, with Fear & Greed at 11. But WIF has extra problems: Binance put it on the Monitoring Tag back in March and it's still there nine months later, Bitfinex already delisted it, and the top 10 wallets hold somewhere between a third and nearly half of all supply. On-chain liquidity is only about $3.8M. $BONK — its Solana rival — is now worth roughly 50% more. The rotation left the hat behind.
So what matters now? Two levels. Support is $0.111, the fresh low — lose that and $0.10 is next, with nothing much below. Resistance is $0.124 first, then the $0.129-$0.132 zone that just broke. A reclaim of $0.124 is the first hint the bleeding is stopping; until then, every bounce is guilty until proven innocent. Watch $SOL too — WIF doesn't move alone, it moves with Solana risk appetite.
Tap $WIF and look at that $0.111 level yourself — capitulation bottom, or one more leg down?
#WIF #Solana
Not financial advice. DYOR.
WIF Just Broke the "Bottom" Everyone Trusted
Everyone called $0.1294 the bottom last week. $WIF just smashed through it.
WIF is trading near $0.116 today — a fresh 52-week low, down roughly 40% in 30 days, and 97.6% below its $4.83 all-time high from March 2024. Of the six big memes, it's the weakest performer this month. Even today's bounce tells the story: $WIF is up about 1.5% while DOGE and SHIB are up 5%. The dog in the hat is lagging its own bounce.
Here's what this really means. Last week, $0.1294 was the line everyone pointed at — "52-week low, RSI oversold, this is the floor." The floor didn't hold. Price stepped down through it to $0.111, and that old low is now resistance. That's how downtrends work: every "bottom" becomes the next ceiling until buyers actually prove otherwise.
The oversold case is real, though. Daily RSI is near 23 — deeply oversold territory. History says WIF bounces violently from extremes like this: +90% in two weeks in August 2024, +350% in spring 2025. But here's the catch nobody mentions — since December 2024, every single bounce made a lower high and rolled over. Oversold describes the downtrend. It doesn't end it.
And the structure underneath is ugly. There's no WIF-specific bad news — this is pure market drag after BTC flushed to $55.1K on Saturday, with Fear & Greed at 11. But WIF has extra problems: Binance put it on the Monitoring Tag back in March and it's still there nine months later, Bitfinex already delisted it, and the top 10 wallets hold somewhere between a third and nearly half of all supply. On-chain liquidity is only about $3.8M. $BONK — its Solana rival — is now worth roughly 50% more. The rotation left the hat behind.
So what matters now? Two levels. Support is $0.111, the fresh low — lose that and $0.10 is next, with nothing much below. Resistance is $0.124 first, then the $0.129-$0.132 zone that just broke. A reclaim of $0.124 is the first hint the bleeding is stopping; until then, every bounce is guilty until proven innocent. Watch $SOL too — WIF doesn't move alone, it moves with Solana risk appetite.
Tap $WIF and look at that $0.111 level yourself — capitulation bottom, or one more leg down?
#WIF #Solana
Not financial advice. DYOR.
WIF is trading near $0.116 today — a fresh 52-week low, down roughly 40% in 30 days, and 97.6% below its $4.83 all-time high from March 2024. Of the six big memes, it's the weakest performer this month. Even today's bounce tells the story: $WIF is up about 1.5% while DOGE and SHIB are up 5%. The dog in the hat is lagging its own bounce.
Here's what this really means. Last week, $0.1294 was the line everyone pointed at — "52-week low, RSI oversold, this is the floor." The floor didn't hold. Price stepped down through it to $0.111, and that old low is now resistance. That's how downtrends work: every "bottom" becomes the next ceiling until buyers actually prove otherwise.
The oversold case is real, though. Daily RSI is near 23 — deeply oversold territory. History says WIF bounces violently from extremes like this: +90% in two weeks in August 2024, +350% in spring 2025. But here's the catch nobody mentions — since December 2024, every single bounce made a lower high and rolled over. Oversold describes the downtrend. It doesn't end it.
And the structure underneath is ugly. There's no WIF-specific bad news — this is pure market drag after BTC flushed to $55.1K on Saturday, with Fear & Greed at 11. But WIF has extra problems: Binance put it on the Monitoring Tag back in March and it's still there nine months later, Bitfinex already delisted it, and the top 10 wallets hold somewhere between a third and nearly half of all supply. On-chain liquidity is only about $3.8M. $BONK — its Solana rival — is now worth roughly 50% more. The rotation left the hat behind.
So what matters now? Two levels. Support is $0.111, the fresh low — lose that and $0.10 is next, with nothing much below. Resistance is $0.124 first, then the $0.129-$0.132 zone that just broke. A reclaim of $0.124 is the first hint the bleeding is stopping; until then, every bounce is guilty until proven innocent. Watch $SOL too — WIF doesn't move alone, it moves with Solana risk appetite.
Tap $WIF and look at that $0.111 level yourself — capitulation bottom, or one more leg down?
#WIF #Solana
Not financial advice. DYOR.
52
記事
翻訳参照
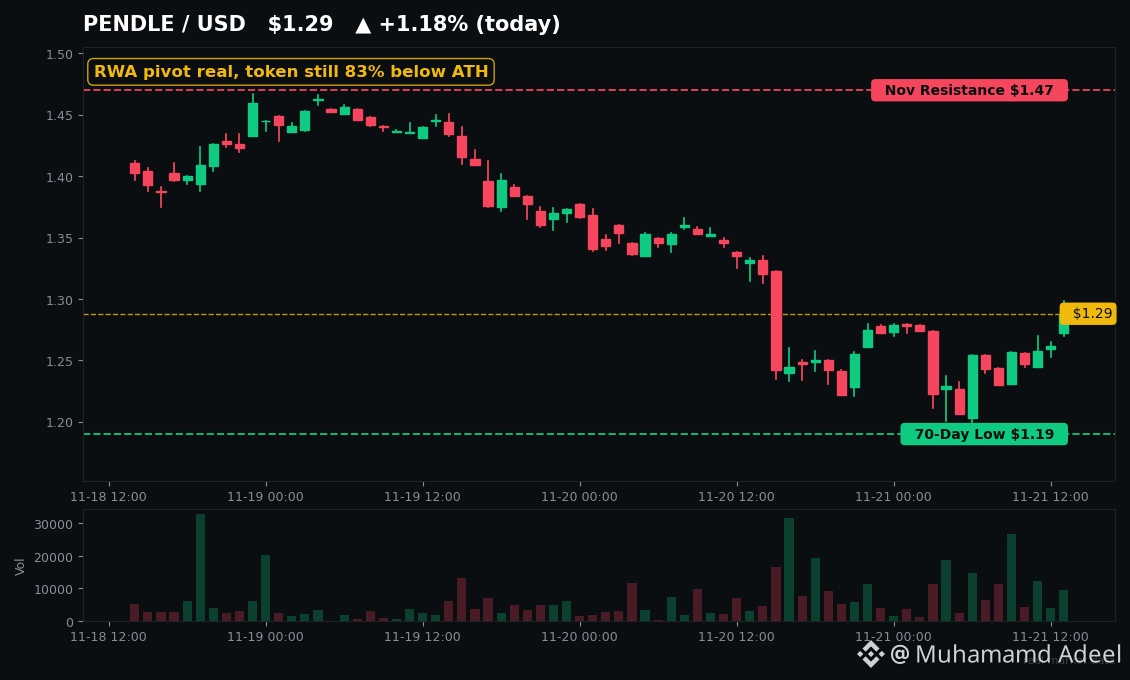
Fear at 12. $PENDLE Is Down 83% — But Its RWA Pivot Is RealBTC just tagged $55K and fear is sitting at 12.
So why is tokenized yield quietly rebuilding instead of dying? Tap $PENDLE and look closer — the chart and the business are telling two different stories.
Here's the split nobody is posting about. Pendle lets you split yield into two tradable pieces: PT (principal, locks a fixed rate) and YT (the yield itself). New York Life's team translated it for TradFi last week: PT is basically a zero-coupon bond, YT is an interest-only strip. Structures Wall Street has traded for decades — now onchain.
And the pivot is real. In Q3, RWA-backed dollars on Pendle grew $395M to $949M, and TVL rose 43% — its first quarterly gain in a year. By Nov 10, Pendle was the largest DeFi venue for tokenized stocks at $53.5M. Its first fixed-rate RWA market with Centrifuge on Base (deJAAA) matures Nov 26 — that's the next real test of whether this capital sticks. Ethena's new fixed-term PT-USDe markets went live Nov 10 at 5.24%–6.00% implied.
Now the honest part. $PENDLE trades near $1.29 — down about 37% in 30 days and 83% below its $7.50 ATH. TVL is $923M, a shadow of the $13.4B peak in Sep 2025. Q3 revenue was $1.86M, down 80% year-on-year. This protocol has seen mercenary capital before: TVL halved in two days in Sep 2025 when incentives ended. Add the $27.3M Penpie hack in Sep 2026 and real regulatory risk on tokenized securities, and the bear case writes itself.
One on-chain clue worth watching: on Nov 14, a whale withdrew ~770,000 PENDLE (~$1.17M) from Binance. That's an exchange outflow, not a confirmed buy — but it's not selling into fear either.
What to watch on the chart: $1.19 is the 70-day low — lose it and there's air below. Reclaim $1.47, the November resistance cluster, and the washed-out narrative gets questioned. The wider RWA market is ~$39.5B (rwa.xyz, Nov 16) with tokenized Treasuries near $13.9B — check $ONDO for the issuer side and $LINK for the oracle plumbing behind it.
BlackRock's digital assets head put it plainly this week: only ~0.01% of global stocks and bonds are tokenized. The question isn't whether yield goes onchain. It's whether $PENDLE holders capture any of it.
Not financial advice. DYOR.
Fear at 12. $PENDLE Is Down 83% — But Its RWA Pivot Is Real
BTC just tagged $55K and fear is sitting at 12.
So why is tokenized yield quietly rebuilding instead of dying? Tap $PENDLE and look closer — the chart and the business are telling two different stories.
Here's the split nobody is posting about. Pendle lets you split yield into two tradable pieces: PT (principal, locks a fixed rate) and YT (the yield itself). New York Life's team translated it for TradFi last week: PT is basically a zero-coupon bond, YT is an interest-only strip. Structures Wall Street has traded for decades — now onchain.
And the pivot is real. In Q3, RWA-backed dollars on Pendle grew $395M to $949M, and TVL rose 43% — its first quarterly gain in a year. By Nov 10, Pendle was the largest DeFi venue for tokenized stocks at $53.5M. Its first fixed-rate RWA market with Centrifuge on Base (deJAAA) matures Nov 26 — that's the next real test of whether this capital sticks. Ethena's new fixed-term PT-USDe markets went live Nov 10 at 5.24%–6.00% implied.
Now the honest part. $PENDLE trades near $1.29 — down about 37% in 30 days and 83% below its $7.50 ATH. TVL is $923M, a shadow of the $13.4B peak in Sep 2025. Q3 revenue was $1.86M, down 80% year-on-year. This protocol has seen mercenary capital before: TVL halved in two days in Sep 2025 when incentives ended. Add the $27.3M Penpie hack in Sep 2026 and real regulatory risk on tokenized securities, and the bear case writes itself.
One on-chain clue worth watching: on Nov 14, a whale withdrew ~770,000 PENDLE (~$1.17M) from Binance. That's an exchange outflow, not a confirmed buy — but it's not selling into fear either.
What to watch on the chart: $1.19 is the 70-day low — lose it and there's air below. Reclaim $1.47, the November resistance cluster, and the washed-out narrative gets questioned. The wider RWA market is ~$39.5B (rwa.xyz, Nov 16) with tokenized Treasuries near $13.9B — check $ONDO for the issuer side and $LINK for the oracle plumbing behind it.
BlackRock's digital assets head put it plainly this week: only ~0.01% of global stocks and bonds are tokenized. The question isn't whether yield goes onchain. It's whether $PENDLE holders capture any of it.
Not financial advice. DYOR.
So why is tokenized yield quietly rebuilding instead of dying? Tap $PENDLE and look closer — the chart and the business are telling two different stories.
Here's the split nobody is posting about. Pendle lets you split yield into two tradable pieces: PT (principal, locks a fixed rate) and YT (the yield itself). New York Life's team translated it for TradFi last week: PT is basically a zero-coupon bond, YT is an interest-only strip. Structures Wall Street has traded for decades — now onchain.
And the pivot is real. In Q3, RWA-backed dollars on Pendle grew $395M to $949M, and TVL rose 43% — its first quarterly gain in a year. By Nov 10, Pendle was the largest DeFi venue for tokenized stocks at $53.5M. Its first fixed-rate RWA market with Centrifuge on Base (deJAAA) matures Nov 26 — that's the next real test of whether this capital sticks. Ethena's new fixed-term PT-USDe markets went live Nov 10 at 5.24%–6.00% implied.
Now the honest part. $PENDLE trades near $1.29 — down about 37% in 30 days and 83% below its $7.50 ATH. TVL is $923M, a shadow of the $13.4B peak in Sep 2025. Q3 revenue was $1.86M, down 80% year-on-year. This protocol has seen mercenary capital before: TVL halved in two days in Sep 2025 when incentives ended. Add the $27.3M Penpie hack in Sep 2026 and real regulatory risk on tokenized securities, and the bear case writes itself.
One on-chain clue worth watching: on Nov 14, a whale withdrew ~770,000 PENDLE (~$1.17M) from Binance. That's an exchange outflow, not a confirmed buy — but it's not selling into fear either.
What to watch on the chart: $1.19 is the 70-day low — lose it and there's air below. Reclaim $1.47, the November resistance cluster, and the washed-out narrative gets questioned. The wider RWA market is ~$39.5B (rwa.xyz, Nov 16) with tokenized Treasuries near $13.9B — check $ONDO for the issuer side and $LINK for the oracle plumbing behind it.
BlackRock's digital assets head put it plainly this week: only ~0.01% of global stocks and bonds are tokenized. The question isn't whether yield goes onchain. It's whether $PENDLE holders capture any of it.
Not financial advice. DYOR.
1
記事
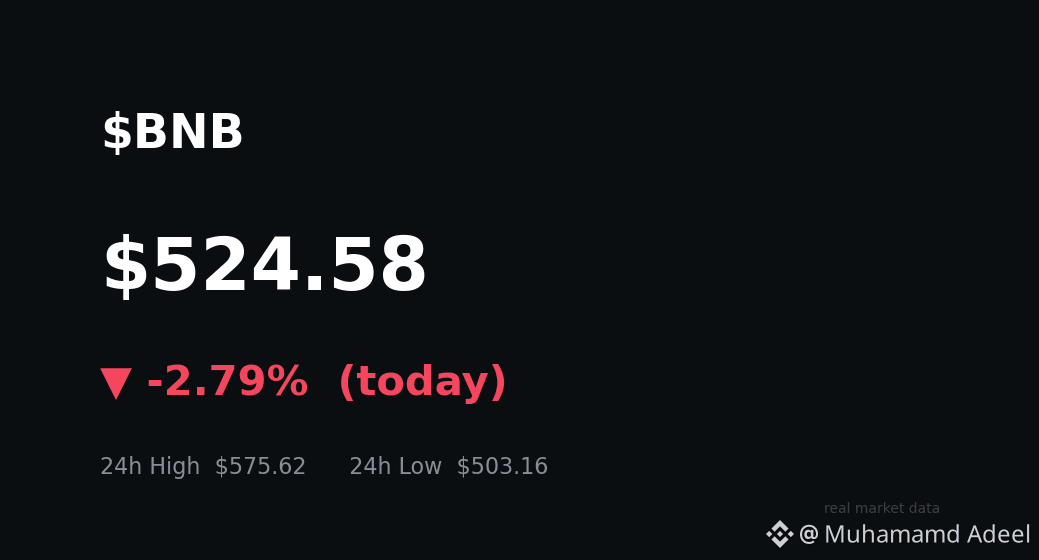
$BNBは503ドルをつけ、恐怖指数は12に——週末の節目は500ドルか?恐怖指数は12、そして$BNB は503.16ドルをつけました。今週ずっと注目されていた566ドルの下値支持線は崩れました。では、今週末の行方を決めるのは500ドルでしょうか?
何が起きたのか、率直に見てみましょう。BNBは525ドル付近で取引されており、過去1日で約8%下落。市場全体よりも大きく値を下げました。$BTC は金曜日に6万ドルを失い、現在は5万8,000ドル付近にあるため、これはBNBだけの話ではありません。それでもBNBは市場を下回るパフォーマンスでした。この差こそが重要なポイントです。
誰も無視できない矛盾があります。市場参加者は弱気相場でも依然としてロングに傾いており、建玉が減少し、ロングの清算が優勢ななか、約70%の口座がロングです。RSIは19付近と大幅な売られ過ぎで、価格はすべての主要移動平均線を下回っています。売られ過ぎから反発することもあります。一方で、売られ過ぎの状態が続くこともあります。あなたはどちらに賭けますか?
$BNBは503ドルをつけ、恐怖指数は12に——週末の節目は500ドルか?
恐怖指数は12、そして$BNB は503.16ドルをつけました。今週ずっと注目されていた566ドルの下値支持線は崩れました。では、今週末の行方を決めるのは500ドルでしょうか?
何が起きたのか、率直に見てみましょう。BNBは525ドル付近で取引されており、過去1日で約8%下落。市場全体よりも大きく値を下げました。$BTC は金曜日に6万ドルを失い、現在は5万8,000ドル付近にあるため、これはBNBだけの話ではありません。それでもBNBは市場を下回るパフォーマンスでした。この差こそが重要なポイントです。
誰も無視できない矛盾があります。市場参加者は弱気相場でも依然としてロングに傾いており、建玉が減少し、ロングの清算が優勢ななか、約70%の口座がロングです。RSIは19付近と大幅な売られ過ぎで、価格はすべての主要移動平均線を下回っています。売られ過ぎから反発することもあります。一方で、売られ過ぎの状態が続くこともあります。あなたはどちらに賭けますか?
何が起きたのか、率直に見てみましょう。BNBは525ドル付近で取引されており、過去1日で約8%下落。市場全体よりも大きく値を下げました。$BTC は金曜日に6万ドルを失い、現在は5万8,000ドル付近にあるため、これはBNBだけの話ではありません。それでもBNBは市場を下回るパフォーマンスでした。この差こそが重要なポイントです。
誰も無視できない矛盾があります。市場参加者は弱気相場でも依然としてロングに傾いており、建玉が減少し、ロングの清算が優勢ななか、約70%の口座がロングです。RSIは19付近と大幅な売られ過ぎで、価格はすべての主要移動平均線を下回っています。売られ過ぎから反発することもあります。一方で、売られ過ぎの状態が続くこともあります。あなたはどちらに賭けますか?
5
記事
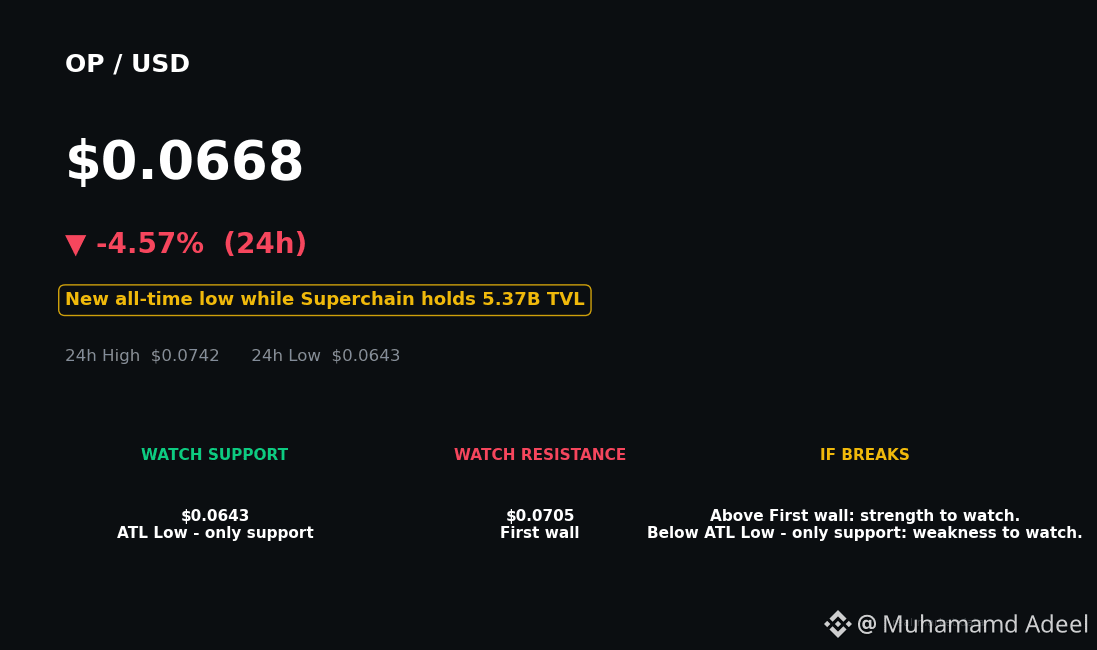
$OPが過去最安値を更新——一方、Superchainは53億ドルを維持$OP は0.0643ドルで、過去最安値を更新しました。それを支えるチェーンは、その知らせを受け取っていないようです。
これがすべてを一言で表しています。Optimismのトークンは、2024年3月につけた4.84ドルのピークから現在98.6%下落し、約0.067ドルで取引されています。恐怖・強欲指数は12です。一方、Superchainは33のチェーン全体で、依然として約53.7億ドルのDeFi TVLを維持しています。2つの現実、1つのティッカー。あなたが実際に買っているのはどちらですか?
見出しにはまず載らない意外な事実があります。その53.7億ドルの大半はOP Mainnetのものではありません。そのうち44.3億ドルはBaseだけで占めています。OP Mainnet自体のDeFi TVLは約3億5,900万ドルで、30日間で約18%減少しています。帝国は健在です。ただ、首都は縮小しています。
$OPが過去最安値を更新——一方、Superchainは53億ドルを維持
$OP は0.0643ドルで、過去最安値を更新しました。それを支えるチェーンは、その知らせを受け取っていないようです。
これがすべてを一言で表しています。Optimismのトークンは、2024年3月につけた4.84ドルのピークから現在98.6%下落し、約0.067ドルで取引されています。恐怖・強欲指数は12です。一方、Superchainは33のチェーン全体で、依然として約53.7億ドルのDeFi TVLを維持しています。2つの現実、1つのティッカー。あなたが実際に買っているのはどちらですか?
見出しにはまず載らない意外な事実があります。その53.7億ドルの大半はOP Mainnetのものではありません。そのうち44.3億ドルはBaseだけで占めています。OP Mainnet自体のDeFi TVLは約3億5,900万ドルで、30日間で約18%減少しています。帝国は健在です。ただ、首都は縮小しています。
これがすべてを一言で表しています。Optimismのトークンは、2024年3月につけた4.84ドルのピークから現在98.6%下落し、約0.067ドルで取引されています。恐怖・強欲指数は12です。一方、Superchainは33のチェーン全体で、依然として約53.7億ドルのDeFi TVLを維持しています。2つの現実、1つのティッカー。あなたが実際に買っているのはどちらですか?
見出しにはまず載らない意外な事実があります。その53.7億ドルの大半はOP Mainnetのものではありません。そのうち44.3億ドルはBaseだけで占めています。OP Mainnet自体のDeFi TVLは約3億5,900万ドルで、30日間で約18%減少しています。帝国は健在です。ただ、首都は縮小しています。
16
記事
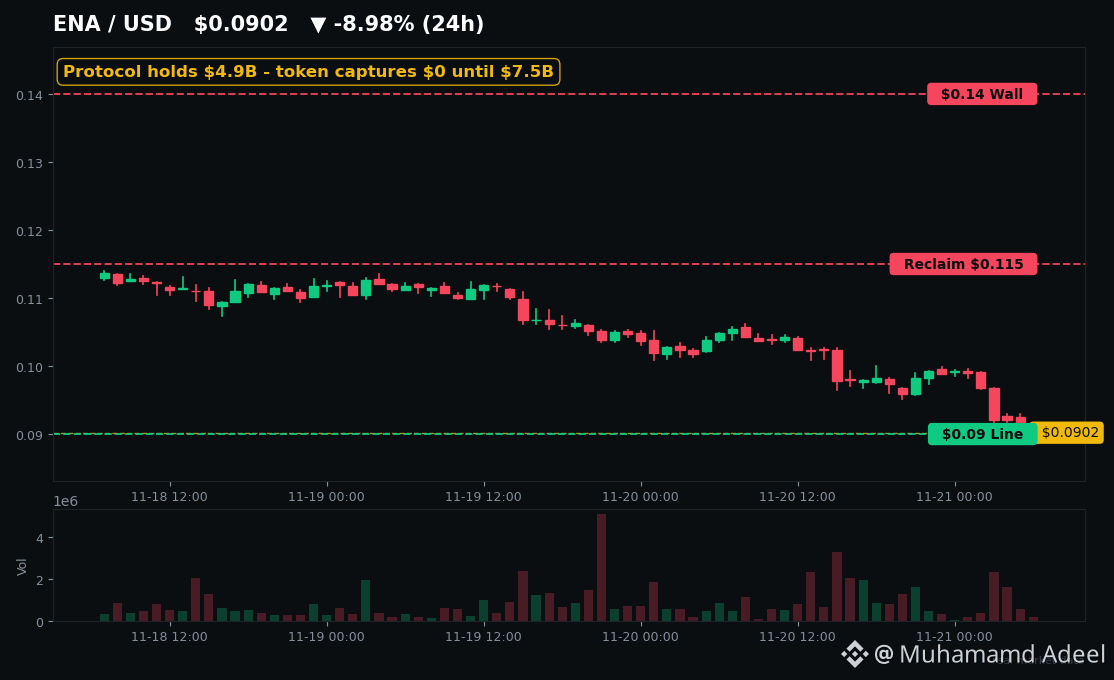
$ENAは1か月で55%下落。それでもUSDeは49億ドルを維持。先に崩れるのはどちら?$BTC はたった今6万ドルを失い、恐怖・強欲指数は12、$ENA は1か月で55%下落している。それでもEthenaの49億ドル規模の合成ドルは、依然として0.999ドルを保っている。どちらかがあなたを欺いている。
誰も値付けしていない乖離がある。ENAは0.0903ドルで取引されており、24時間で13%、1週間で31%下落、2024年4月につけた史上最高値1.52ドルを94%下回っている。一方、その基盤となるプロトコルは縮小していない。TVLは51.8億ドル、直近30日間の手数料収入は2,260万ドル、USDeの供給量は約48.7億ドルを維持し、sUSDeの利回りも約4.87%。Ethenaは暴落のさなか、11月19日にStellar上でUSDeとsUSDeをローンチさえした。
$ENAは1か月で55%下落。それでもUSDeは49億ドルを維持。先に崩れるのはどちら?
$BTC はたった今6万ドルを失い、恐怖・強欲指数は12、$ENA は1か月で55%下落している。それでもEthenaの49億ドル規模の合成ドルは、依然として0.999ドルを保っている。どちらかがあなたを欺いている。
誰も値付けしていない乖離がある。ENAは0.0903ドルで取引されており、24時間で13%、1週間で31%下落、2024年4月につけた史上最高値1.52ドルを94%下回っている。一方、その基盤となるプロトコルは縮小していない。TVLは51.8億ドル、直近30日間の手数料収入は2,260万ドル、USDeの供給量は約48.7億ドルを維持し、sUSDeの利回りも約4.87%。Ethenaは暴落のさなか、11月19日にStellar上でUSDeとsUSDeをローンチさえした。
誰も値付けしていない乖離がある。ENAは0.0903ドルで取引されており、24時間で13%、1週間で31%下落、2024年4月につけた史上最高値1.52ドルを94%下回っている。一方、その基盤となるプロトコルは縮小していない。TVLは51.8億ドル、直近30日間の手数料収入は2,260万ドル、USDeの供給量は約48.7億ドルを維持し、sUSDeの利回りも約4.87%。Ethenaは暴落のさなか、11月19日にStellar上でUSDeとsUSDeをローンチさえした。
42
記事
Schrodersは$CFGを選んだ。Coinbaseは取引を停止する。両方が正しいはずはない1兆1000億ドルの資産運用会社は、債券の$CFG トークン化を選びました。一方、Coinbaseは取引停止を選びました。両方が正しいはずはありません。
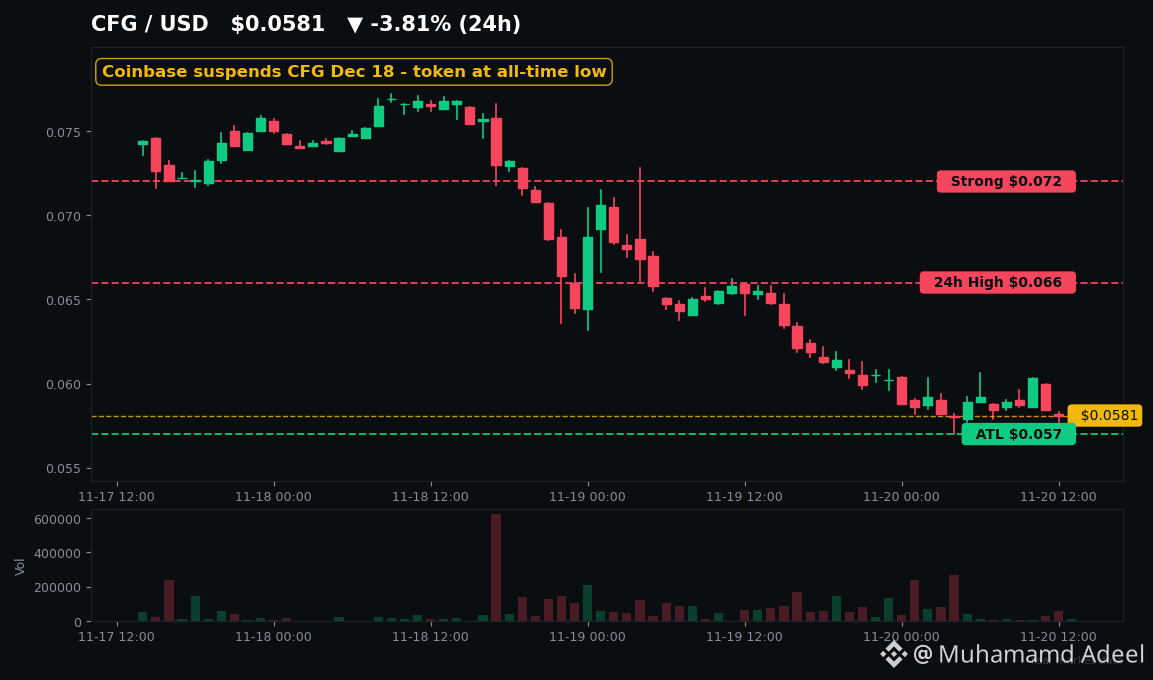
これが現時点でのCentrifugeの全貌です。11月4日、SchrodersはCentrifugeを活用し、Solana上で初のトークン化新興国債券ファンドを立ち上げました。その2週間前には、Janus HendersonとCentrifugeがトークン化Nasdaq-100ファンド「JQQQ」を立ち上げています。実在する機関投資家。実際の資金。そしてトークンは?今日、$CFG 史上最安値となる0.057ドルを記録しました。30日間で約50%下落し、2025年8月につけた0.40ドルの高値からはおよそ85%下落しています。
Schrodersは$CFGを選んだ。Coinbaseは取引を停止する。両方が正しいはずはない
1兆1000億ドルの資産運用会社は、債券の$CFG トークン化を選びました。一方、Coinbaseは取引停止を選びました。両方が正しいはずはありません。
これが現時点でのCentrifugeの全貌です。11月4日、SchrodersはCentrifugeを活用し、Solana上で初のトークン化新興国債券ファンドを立ち上げました。その2週間前には、Janus HendersonとCentrifugeがトークン化Nasdaq-100ファンド「JQQQ」を立ち上げています。実在する機関投資家。実際の資金。そしてトークンは?今日、$CFG 史上最安値となる0.057ドルを記録しました。30日間で約50%下落し、2025年8月につけた0.40ドルの高値からはおよそ85%下落しています。
これが現時点でのCentrifugeの全貌です。11月4日、SchrodersはCentrifugeを活用し、Solana上で初のトークン化新興国債券ファンドを立ち上げました。その2週間前には、Janus HendersonとCentrifugeがトークン化Nasdaq-100ファンド「JQQQ」を立ち上げています。実在する機関投資家。実際の資金。そしてトークンは?今日、$CFG 史上最安値となる0.057ドルを記録しました。30日間で約50%下落し、2025年8月につけた0.40ドルの高値からはおよそ85%下落しています。
19
記事
翻訳参照
GRT at $0.0166 Is 99.4% Below Its $2.84 ATH — Dead or Mispriced?AI hype is everywhere. So why is one of crypto's oldest data tokens sitting 99.4% below its high?
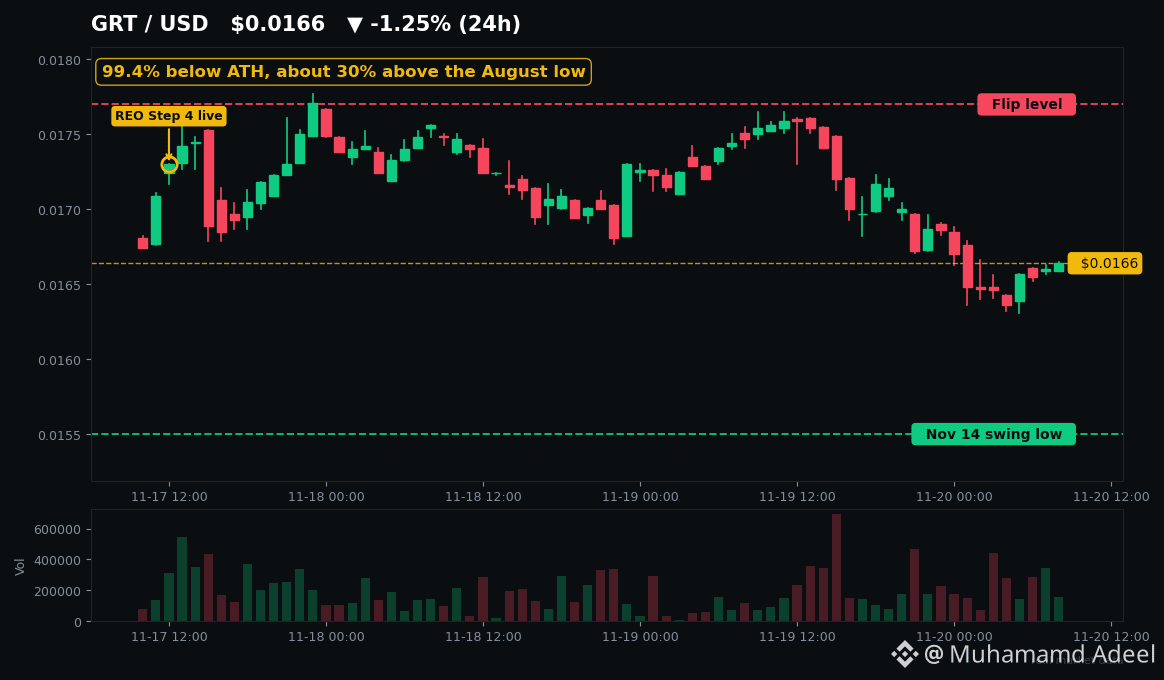
$GRT is trading around $0.0166 on Kraken as I write this. That is down about 33% in 30 days, and under 30% above its August 18 all-time low near $0.0130. The all-time high was about $2.84 in February 2021. Dead, or just brutally mispriced?
Here is the tension. On November 17, The Graph switched on REO Step 4, its stake-based scaling rule. Indexers with more than 40M GRT staked now must serve qualifying queries on at least 10 subgraphs, or 1 per 4M GRT staked, to keep earning rewards. The end goal is 1 per 1M, with full effect around December 1.
Why does that matter? The top 10 indexers held about 70% of stake and took about 71% of rewards from August 2 to October 29. This raises the quality bar for the biggest operators. Real protocol change, not a partnership headline.
But it is not an instant price catalyst. No fresh GRT-specific catalyst explains today's slide, and the market is not helping. $BTC sits near $61,700, below $62K, with the Alternative.me Fear & Greed Index at 12, Extreme Fear, on November 20. Tap $TAO and compare the AI charts yourself before you call this only a GRT story.
The honest bear case is about money, not usage. The Graph processes billions of queries, yet Messari put Q4 2025 query fees at only $98,700 in dollar terms. Issuance is targeted around 3% a year, and burns offset only part of that. Add thin liquidity, about $6.5M traded in 24 hours, price below its 50 and 200-day averages, and daily RSI in the mid-30s, and you see why bounces keep struggling.
History cuts both ways. GRT bottomed near $0.052 in December 2022, then ripped more than 270% in about five weeks into February 2023 as the ChatGPT narrative hit, then faded hard. Phemex Research counted 17 similar 30-day falls since late 2020: GRT was higher 30 days later in 10, but higher 90 days later in only 5. Cheap has worked fast before. Cheap has also kept getting cheaper.
So watch levels, not slogans. Tap $GRT and check two lines: $0.0177 above, the recent flip level, and $0.0155 below, the November 14 swing low. A close above the first would be the first sign sellers are losing their grip. Lose the second and that August low near $0.013 is back in the conversation.
One flag: reports on November 17-18 ranked GRT high for Binance outflows on a CryptoQuant metric, with no token amount disclosed, and the analyst warned outflows alone do not prove buying. No confirmed whale buy showed up in the last seven days.
GRT is data infrastructure AI apps could query, not an AI model itself. That distinction is the whole trade. Until fees prove agent demand pays here, you are watching a quality upgrade fight a brutal tape.
Not financial advice. DYOR.
GRT at $0.0166 Is 99.4% Below Its $2.84 ATH — Dead or Mispriced?
AI hype is everywhere. So why is one of crypto's oldest data tokens sitting 99.4% below its high?
$GRT is trading around $0.0166 on Kraken as I write this. That is down about 33% in 30 days, and under 30% above its August 18 all-time low near $0.0130. The all-time high was about $2.84 in February 2021. Dead, or just brutally mispriced?
Here is the tension. On November 17, The Graph switched on REO Step 4, its stake-based scaling rule. Indexers with more than 40M GRT staked now must serve qualifying queries on at least 10 subgraphs, or 1 per 4M GRT staked, to keep earning rewards. The end goal is 1 per 1M, with full effect around December 1.
Why does that matter? The top 10 indexers held about 70% of stake and took about 71% of rewards from August 2 to October 29. This raises the quality bar for the biggest operators. Real protocol change, not a partnership headline.
But it is not an instant price catalyst. No fresh GRT-specific catalyst explains today's slide, and the market is not helping. $BTC sits near $61,700, below $62K, with the Alternative.me Fear & Greed Index at 12, Extreme Fear, on November 20. Tap $TAO and compare the AI charts yourself before you call this only a GRT story.
The honest bear case is about money, not usage. The Graph processes billions of queries, yet Messari put Q4 2025 query fees at only $98,700 in dollar terms. Issuance is targeted around 3% a year, and burns offset only part of that. Add thin liquidity, about $6.5M traded in 24 hours, price below its 50 and 200-day averages, and daily RSI in the mid-30s, and you see why bounces keep struggling.
History cuts both ways. GRT bottomed near $0.052 in December 2022, then ripped more than 270% in about five weeks into February 2023 as the ChatGPT narrative hit, then faded hard. Phemex Research counted 17 similar 30-day falls since late 2020: GRT was higher 30 days later in 10, but higher 90 days later in only 5. Cheap has worked fast before. Cheap has also kept getting cheaper.
So watch levels, not slogans. Tap $GRT and check two lines: $0.0177 above, the recent flip level, and $0.0155 below, the November 14 swing low. A close above the first would be the first sign sellers are losing their grip. Lose the second and that August low near $0.013 is back in the conversation.
One flag: reports on November 17-18 ranked GRT high for Binance outflows on a CryptoQuant metric, with no token amount disclosed, and the analyst warned outflows alone do not prove buying. No confirmed whale buy showed up in the last seven days.
GRT is data infrastructure AI apps could query, not an AI model itself. That distinction is the whole trade. Until fees prove agent demand pays here, you are watching a quality upgrade fight a brutal tape.
Not financial advice. DYOR.
$GRT is trading around $0.0166 on Kraken as I write this. That is down about 33% in 30 days, and under 30% above its August 18 all-time low near $0.0130. The all-time high was about $2.84 in February 2021. Dead, or just brutally mispriced?
Here is the tension. On November 17, The Graph switched on REO Step 4, its stake-based scaling rule. Indexers with more than 40M GRT staked now must serve qualifying queries on at least 10 subgraphs, or 1 per 4M GRT staked, to keep earning rewards. The end goal is 1 per 1M, with full effect around December 1.
Why does that matter? The top 10 indexers held about 70% of stake and took about 71% of rewards from August 2 to October 29. This raises the quality bar for the biggest operators. Real protocol change, not a partnership headline.
But it is not an instant price catalyst. No fresh GRT-specific catalyst explains today's slide, and the market is not helping. $BTC sits near $61,700, below $62K, with the Alternative.me Fear & Greed Index at 12, Extreme Fear, on November 20. Tap $TAO and compare the AI charts yourself before you call this only a GRT story.
The honest bear case is about money, not usage. The Graph processes billions of queries, yet Messari put Q4 2025 query fees at only $98,700 in dollar terms. Issuance is targeted around 3% a year, and burns offset only part of that. Add thin liquidity, about $6.5M traded in 24 hours, price below its 50 and 200-day averages, and daily RSI in the mid-30s, and you see why bounces keep struggling.
History cuts both ways. GRT bottomed near $0.052 in December 2022, then ripped more than 270% in about five weeks into February 2023 as the ChatGPT narrative hit, then faded hard. Phemex Research counted 17 similar 30-day falls since late 2020: GRT was higher 30 days later in 10, but higher 90 days later in only 5. Cheap has worked fast before. Cheap has also kept getting cheaper.
So watch levels, not slogans. Tap $GRT and check two lines: $0.0177 above, the recent flip level, and $0.0155 below, the November 14 swing low. A close above the first would be the first sign sellers are losing their grip. Lose the second and that August low near $0.013 is back in the conversation.
One flag: reports on November 17-18 ranked GRT high for Binance outflows on a CryptoQuant metric, with no token amount disclosed, and the analyst warned outflows alone do not prove buying. No confirmed whale buy showed up in the last seven days.
GRT is data infrastructure AI apps could query, not an AI model itself. That distinction is the whole trade. Until fees prove agent demand pays here, you are watching a quality upgrade fight a brutal tape.
Not financial advice. DYOR.
5
記事
Anthropicの無期限先物がETHを上回る。BTC ETFは過去最高の5億4,100万ドル流出AI株がイーサリアムを上回る無期限先物の出来高を記録しました。よく考えてみてください。
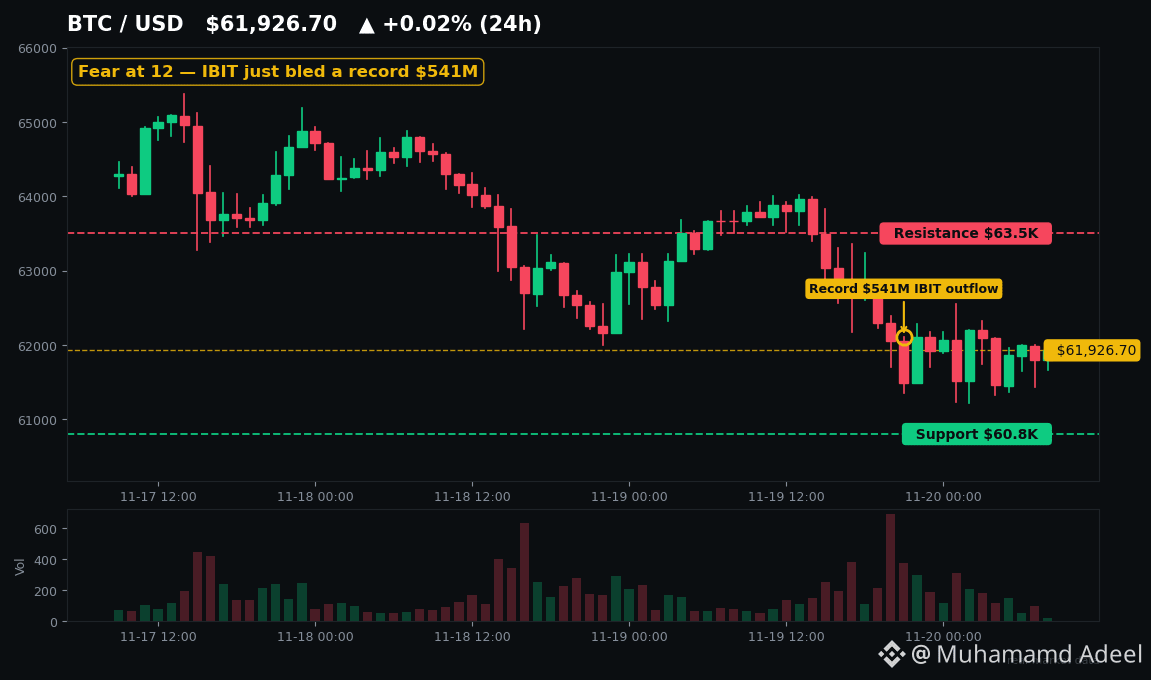
ビットコインが6万1,900ドルまで下落する一方、トレーダーはAnthropicの無期限先物に殺到し、規制当局も数時間以内に反応しました。この24時間で暗号資産市場を実際に動かしたものは何か、そしてあなたの保有資産にとって何を意味するのかを解説します。
**1. AnthropicのIPOが暗号資産の資金をさらった**
Anthropicは1株83ドルで価格設定され、約813億ドルを調達しました——過去最大のIPOです。初値は111.50ドルで、初日の終値は17%高でした。HyperliquidではANTの無期限先物が24時間で約19億ドルの出来高を記録し、ETHの無期限先物の2倍を超えました。CoinSharesのCEO、Jean-Marie Mognetti氏は、AIが暗号資産から「限界的な資金を一ドル残らず吸い上げている」と述べました。私の見方はこうです。流動性は話題の対象を追いかけます。そして今、話題の対象はコインではありません。$HYPE をタップして、出来高がどこへ向かったか見てください——このチャートは、どんな見出しよりもよく物語っています。
Anthropicの無期限先物がETHを上回る。BTC ETFは過去最高の5億4,100万ドル流出
AI株がイーサリアムを上回る無期限先物の出来高を記録しました。よく考えてみてください。
ビットコインが6万1,900ドルまで下落する一方、トレーダーはAnthropicの無期限先物に殺到し、規制当局も数時間以内に反応しました。この24時間で暗号資産市場を実際に動かしたものは何か、そしてあなたの保有資産にとって何を意味するのかを解説します。
**1. AnthropicのIPOが暗号資産の資金をさらった**
Anthropicは1株83ドルで価格設定され、約813億ドルを調達しました——過去最大のIPOです。初値は111.50ドルで、初日の終値は17%高でした。HyperliquidではANTの無期限先物が24時間で約19億ドルの出来高を記録し、ETHの無期限先物の2倍を超えました。CoinSharesのCEO、Jean-Marie Mognetti氏は、AIが暗号資産から「限界的な資金を一ドル残らず吸い上げている」と述べました。私の見方はこうです。流動性は話題の対象を追いかけます。そして今、話題の対象はコインではありません。$HYPE をタップして、出来高がどこへ向かったか見てください——このチャートは、どんな見出しよりもよく物語っています。
ビットコインが6万1,900ドルまで下落する一方、トレーダーはAnthropicの無期限先物に殺到し、規制当局も数時間以内に反応しました。この24時間で暗号資産市場を実際に動かしたものは何か、そしてあなたの保有資産にとって何を意味するのかを解説します。
**1. AnthropicのIPOが暗号資産の資金をさらった**
Anthropicは1株83ドルで価格設定され、約813億ドルを調達しました——過去最大のIPOです。初値は111.50ドルで、初日の終値は17%高でした。HyperliquidではANTの無期限先物が24時間で約19億ドルの出来高を記録し、ETHの無期限先物の2倍を超えました。CoinSharesのCEO、Jean-Marie Mognetti氏は、AIが暗号資産から「限界的な資金を一ドル残らず吸い上げている」と述べました。私の見方はこうです。流動性は話題の対象を追いかけます。そして今、話題の対象はコインではありません。$HYPE をタップして、出来高がどこへ向かったか見てください——このチャートは、どんな見出しよりもよく物語っています。
3
記事
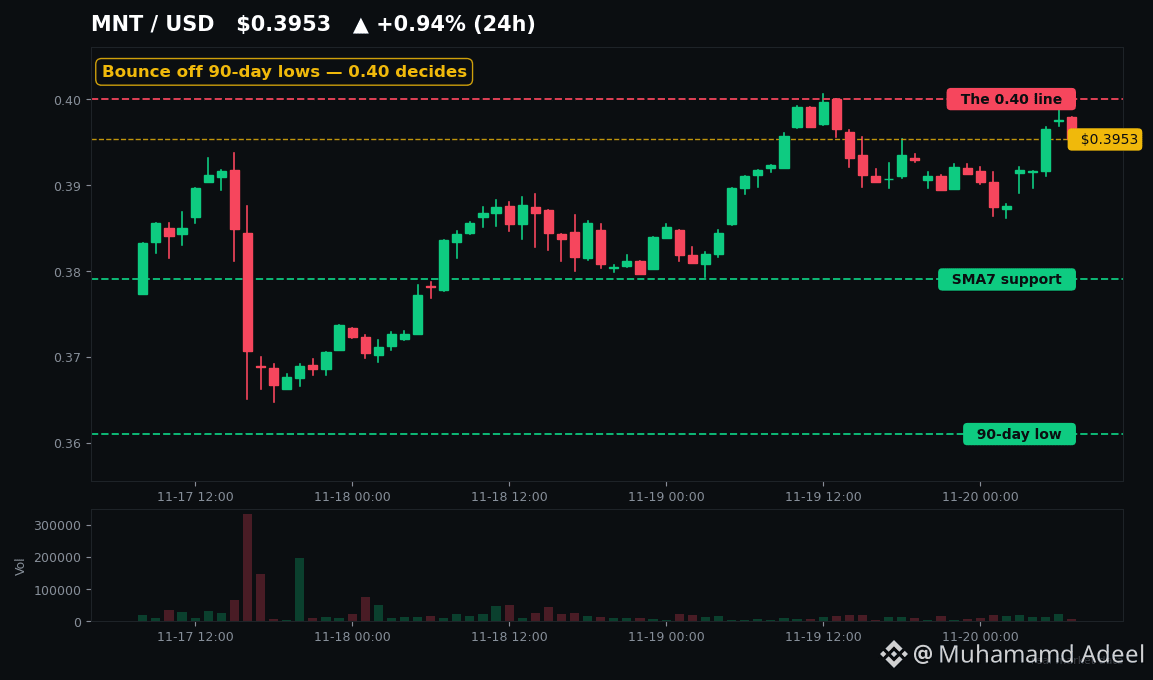
$MNT、90日安値から反発 日本とAnthropicが登場ビットコインが下落していた一方で、$MNTは90日安値から約8%反発。そして同じ週に、日本での取扱いが始まり、Anthropic株もオンチェーンに登場しました。それなのに、なぜまだ0.39ドルにとどまっているのでしょうか?
見出しと価格の間にある隔たりこそが、すべてを物語っています。順を追って説明します。
**何が起きたのか**
Mantleが日本の取引所に初めて上場しました。金融庁登録のGMOコインで、口座数は82万5,000超です。発表は11月18日でした(実際の取扱開始は10月31日なので、この点は押さえておきましょう)。日本の規制下でアクセスできるようになったことは、決して小さなことではありません。日本の厳格な資産審査制度を通過したのです。
$MNT、90日安値から反発 日本とAnthropicが登場
ビットコインが下落していた一方で、$MNTは90日安値から約8%反発。そして同じ週に、日本での取扱いが始まり、Anthropic株もオンチェーンに登場しました。それなのに、なぜまだ0.39ドルにとどまっているのでしょうか?
見出しと価格の間にある隔たりこそが、すべてを物語っています。順を追って説明します。
**何が起きたのか**
Mantleが日本の取引所に初めて上場しました。金融庁登録のGMOコインで、口座数は82万5,000超です。発表は11月18日でした(実際の取扱開始は10月31日なので、この点は押さえておきましょう)。日本の規制下でアクセスできるようになったことは、決して小さなことではありません。日本の厳格な資産審査制度を通過したのです。
見出しと価格の間にある隔たりこそが、すべてを物語っています。順を追って説明します。
**何が起きたのか**
Mantleが日本の取引所に初めて上場しました。金融庁登録のGMOコインで、口座数は82万5,000超です。発表は11月18日でした(実際の取扱開始は10月31日なので、この点は押さえておきましょう)。日本の規制下でアクセスできるようになったことは、決して小さなことではありません。日本の厳格な資産審査制度を通過したのです。
ログインして、さらにコンテンツを読む
厳選トピックで世界の暗号資産トレーダーの仲間入り
⚡️ 暗号資産に関する最新かつ有益な情報が見つかります。
💬 世界最大の暗号資産取引所から信頼されています。
👍 認証を受けたクリエイターから、有益なインサイトを得られます。
メール / 電話番号