
market tren
25 投稿

market tren
報告
ユーザーをブロック
2 フォロー
0 フォロワー
1 いいね
投稿
すべて
動画
·
--
ブリッシュ
翻訳参照
$#BitcoinShortTermHoldersReach4.08MBTC The news article, dated October 16, 2026, discusses Bitcoin's market outlook.
1. Market pressure: Better-than-expected US economic data has increased selling pressure in the cryptocurrency market.
2. Interest rates: Changing expectations about the US Federal Reserve's interest rate policy may affect Bitcoin's price.
3. Price target: An analyst predicts that Bitcoin could reach $250,000 in the future.
4. Bear market: A bear market means prices are generally falling. The headline suggests that Bitcoin's future may be different from what people expect.
5. Important warning: The $250,000 target is an analyst's prediction, not a guaranteed price. Bitcoin can rise or fall significantly.
$#BitcoinShortTermHoldersReach4.08MBTC The news article, dated October 16, 2026, discusses Bitcoin's market outlook.
1. Market pressure: Better-than-expected US economic data has increased selling pressure in the cryptocurrency market.
2. Interest rates: Changing expectations about the US Federal Reserve's interest rate policy may affect Bitcoin's price.
3. Price target: An analyst predicts that Bitcoin could reach $250,000 in the future.
4. Bear market: A bear market means prices are generally falling. The headline suggests that Bitcoin's future may be different from what people expect.
5. Important warning: The $250,000 target is an analyst's prediction, not a guaranteed price. Bitcoin can rise or fall significantly.
1. Market pressure: Better-than-expected US economic data has increased selling pressure in the cryptocurrency market.
2. Interest rates: Changing expectations about the US Federal Reserve's interest rate policy may affect Bitcoin's price.
3. Price target: An analyst predicts that Bitcoin could reach $250,000 in the future.
4. Bear market: A bear market means prices are generally falling. The headline suggests that Bitcoin's future may be different from what people expect.
5. Important warning: The $250,000 target is an analyst's prediction, not a guaranteed price. Bitcoin can rise or fall significantly.

92


·
--
今すぐDashを買えええええええええ!DashとXRPとSUIを買って。2034年に感謝してくれ。
今すぐDashを買えええええええええ!DashとXRPとSUIを買って。2034年に感謝してくれ。

1
368
·
--
翻訳参照
#buyxrp bcz it is going to to hit 100 $ each coin thank me later in 2030
#buyxrp bcz it is going to to hit 100 $ each coin thank me later in 2030
122
·
--
翻訳参照
#EtherETFsExtendOutflowsToNineDays etheretfsextendoutflowstoninedays 🚨📉 ETHEREUM ETFs EXTEND OUTFLOW STREAK TO 9 DAYS — IS INSTITUTIONAL CONFIDENCE FADING?
Ethereum is facing another test as US spot ETH ETFs continue to record withdrawals. According to data reported on October 10, 2026, investors pulled approximately $697 million from these funds over nine consecutive trading sessions. 🔍
📊 THE NUMBERS BEHIND THE TREND
💸 $697.2M in Outflows: The withdrawal streak began on September 29, highlighting sustained selling pressure across spot Ethereum investment products.
🏦 $542.1M Lost in One Week: The five trading sessions ending October 9 accounted for the majority of recent outflows, making it the funds’ worst week since January. BlackRock Leads Withdrawals: Its ETHA fund recorded approximately $477 million in weekly outflows, accounting for the bulk of the sector’s losses.
⚠️ WHAT ABOUT ETH PRICE?
Ether fell below the $2,500 level during the period, adding to concerns about short-term market momentum. Some traders are watching lower support zones, but $1,400 should be treated as a speculative scenario—not a confirmed target or guaranteed support level.
🔍 DO ETF OUTFLOWS MEAN ETHEREUM IS LOSING ITS FUNDAMENTALS?
Not necessarily. ETF flows reflect investor activity in specific investment products. They do not independently measure Ethereum’s network usage, developer activity, or long-term technological progress.
💡 MY TAKE
Persistent withdrawals are a signal worth monitoring, but they do not guarantee further declines. A sustained return to positive ETF flows could improve sentiment, while continued redemptions may keep pressure on the market.
💬 Is this a temporary institutional rotation or a deeper warning for ETH investors? Share your analysis below!
#Ethereum #ETH #CryptoMarket #BinanceSquare
$ETH $BTC $AERO
#EtherETFsExtendOutflowsToNineDays etheretfsextendoutflowstoninedays 🚨📉 ETHEREUM ETFs EXTEND OUTFLOW STREAK TO 9 DAYS — IS INSTITUTIONAL CONFIDENCE FADING?
Ethereum is facing another test as US spot ETH ETFs continue to record withdrawals. According to data reported on October 10, 2026, investors pulled approximately $697 million from these funds over nine consecutive trading sessions. 🔍
📊 THE NUMBERS BEHIND THE TREND
💸 $697.2M in Outflows: The withdrawal streak began on September 29, highlighting sustained selling pressure across spot Ethereum investment products.
🏦 $542.1M Lost in One Week: The five trading sessions ending October 9 accounted for the majority of recent outflows, making it the funds’ worst week since January. BlackRock Leads Withdrawals: Its ETHA fund recorded approximately $477 million in weekly outflows, accounting for the bulk of the sector’s losses.
⚠️ WHAT ABOUT ETH PRICE?
Ether fell below the $2,500 level during the period, adding to concerns about short-term market momentum. Some traders are watching lower support zones, but $1,400 should be treated as a speculative scenario—not a confirmed target or guaranteed support level.
🔍 DO ETF OUTFLOWS MEAN ETHEREUM IS LOSING ITS FUNDAMENTALS?
Not necessarily. ETF flows reflect investor activity in specific investment products. They do not independently measure Ethereum’s network usage, developer activity, or long-term technological progress.
💡 MY TAKE
Persistent withdrawals are a signal worth monitoring, but they do not guarantee further declines. A sustained return to positive ETF flows could improve sentiment, while continued redemptions may keep pressure on the market.
💬 Is this a temporary institutional rotation or a deeper warning for ETH investors? Share your analysis below!
#Ethereum #ETH #CryptoMarket #BinanceSquare
$ETH $BTC $AERO
Ethereum is facing another test as US spot ETH ETFs continue to record withdrawals. According to data reported on October 10, 2026, investors pulled approximately $697 million from these funds over nine consecutive trading sessions. 🔍
📊 THE NUMBERS BEHIND THE TREND
💸 $697.2M in Outflows: The withdrawal streak began on September 29, highlighting sustained selling pressure across spot Ethereum investment products.
🏦 $542.1M Lost in One Week: The five trading sessions ending October 9 accounted for the majority of recent outflows, making it the funds’ worst week since January. BlackRock Leads Withdrawals: Its ETHA fund recorded approximately $477 million in weekly outflows, accounting for the bulk of the sector’s losses.
⚠️ WHAT ABOUT ETH PRICE?
Ether fell below the $2,500 level during the period, adding to concerns about short-term market momentum. Some traders are watching lower support zones, but $1,400 should be treated as a speculative scenario—not a confirmed target or guaranteed support level.
🔍 DO ETF OUTFLOWS MEAN ETHEREUM IS LOSING ITS FUNDAMENTALS?
Not necessarily. ETF flows reflect investor activity in specific investment products. They do not independently measure Ethereum’s network usage, developer activity, or long-term technological progress.
💡 MY TAKE
Persistent withdrawals are a signal worth monitoring, but they do not guarantee further declines. A sustained return to positive ETF flows could improve sentiment, while continued redemptions may keep pressure on the market.
💬 Is this a temporary institutional rotation or a deeper warning for ETH investors? Share your analysis below!
#Ethereum #ETH #CryptoMarket #BinanceSquare
$ETH $BTC $AERO

76
·
--
翻訳参照
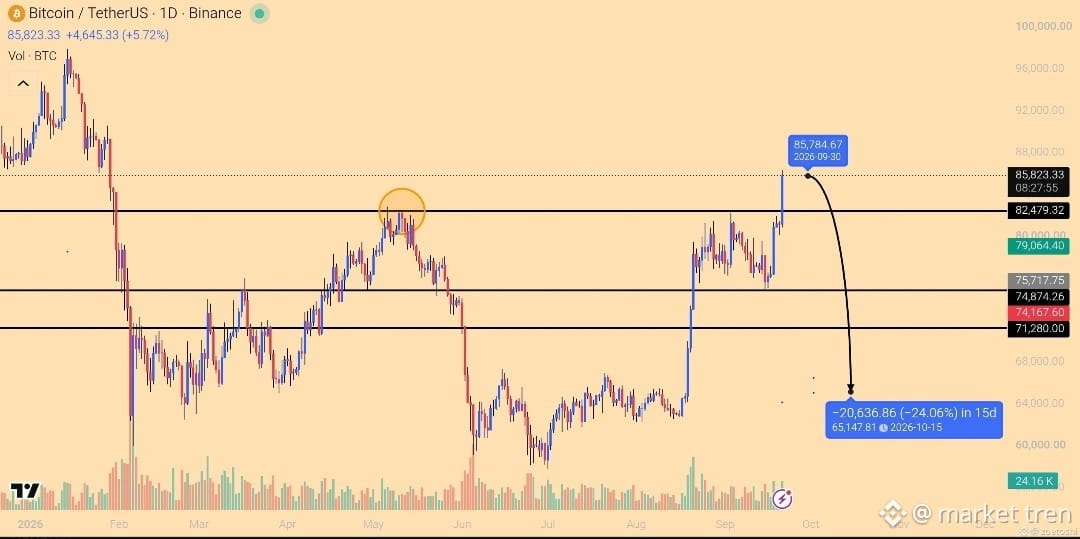
#AIStocksWhatNext Bitcoin has broken the most imp resistance as of now which is the previous may high.
still it needs to close above it , retest it and continue for upward movement.
market can behave silly sometime. what if this is a bull trap ?
what are your thoughts ?
{spot}(BTCUSDT)
#AIStocksWhatNext Bitcoin has broken the most imp resistance as of now which is the previous may high.
still it needs to close above it , retest it and continue for upward movement.
market can behave silly sometime. what if this is a bull trap ?
what are your thoughts ?
still it needs to close above it , retest it and continue for upward movement.
market can behave silly sometime. what if this is a bull trap ?
what are your thoughts ?
53
·
--
翻訳参照
{spot}(DASHUSDT)
#DASH/USDT buy now it is going to break the higest 498 $ and will go to 1500 so in 2028
{future}(HEMIUSDT)
buy hemi also because it is going to 1 $ each coin...buy bcz it controls security of btc and eth.. thank me later in 2028
{spot}(SOLUSDT)
buy sol buy it will go to 3500 $ in 2028 buy now... thank me later
#DASH/USDT buy now it is going to break the higest 498 $ and will go to 1500 so in 2028
buy hemi also because it is going to 1 $ each coin...buy bcz it controls security of btc and eth.. thank me later in 2028
buy sol buy it will go to 3500 $ in 2028 buy now... thank me later
buy hemi also because it is going to 1 $ each coin...buy bcz it controls security of btc and eth.. thank me later in 2028
buy sol buy it will go to 3500 $ in 2028 buy now... thank me later
302
·
--
翻訳参照
$ETH
{spot}(ETHUSDT)
buy eth bcz it is the next btc in 5 years
$ETH
buy eth bcz it is the next btc in 5 years
buy eth bcz it is the next btc in 5 years
3
·
--
分析
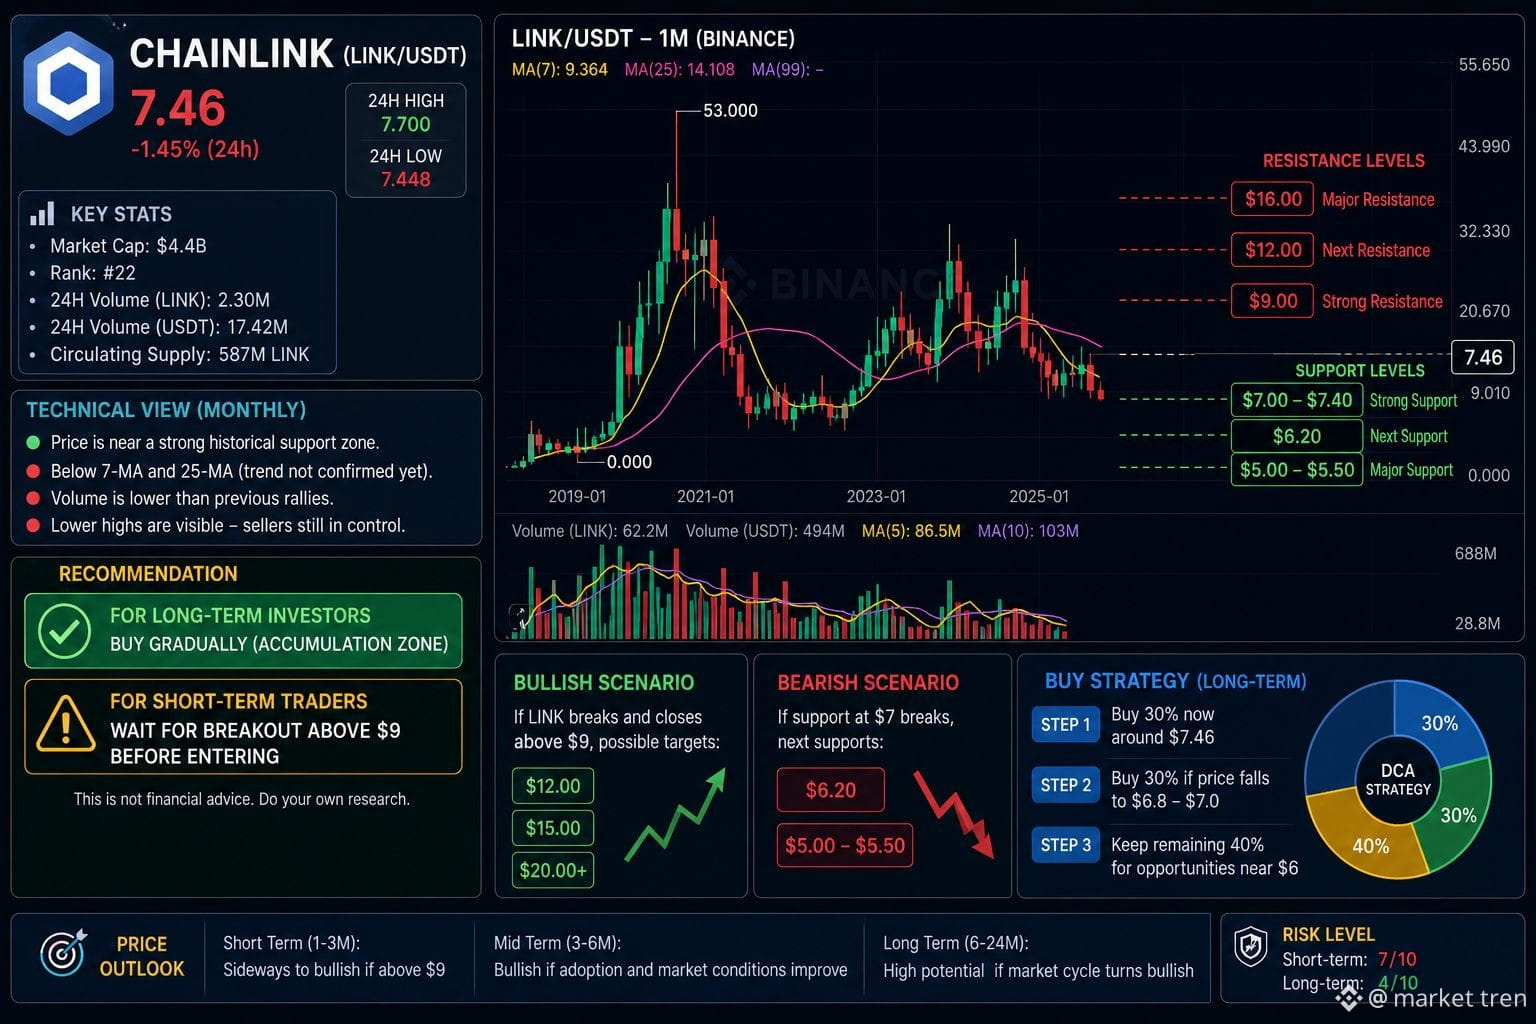
現在の価格: ¥7.46
主要サポートゾーン: ¥7.00 - ¥7.40
強力なレジスタンス: ¥9.00
次のレジスタンス: ¥12.00
主要レジスタンス: ¥15.00 - ¥16.00
#ChainlinkUpdate
{future}(LINKUSDT)
分析
現在の価格: ¥7.46
主要サポートゾーン: ¥7.00 - ¥7.40
強力なレジスタンス: ¥9.00
次のレジスタンス: ¥12.00
主要レジスタンス: ¥15.00 - ¥16.00
#ChainlinkUpdate
現在の価格: ¥7.46
主要サポートゾーン: ¥7.00 - ¥7.40
強力なレジスタンス: ¥9.00
次のレジスタンス: ¥12.00
主要レジスタンス: ¥15.00 - ¥16.00
#ChainlinkUpdate
98
·
--
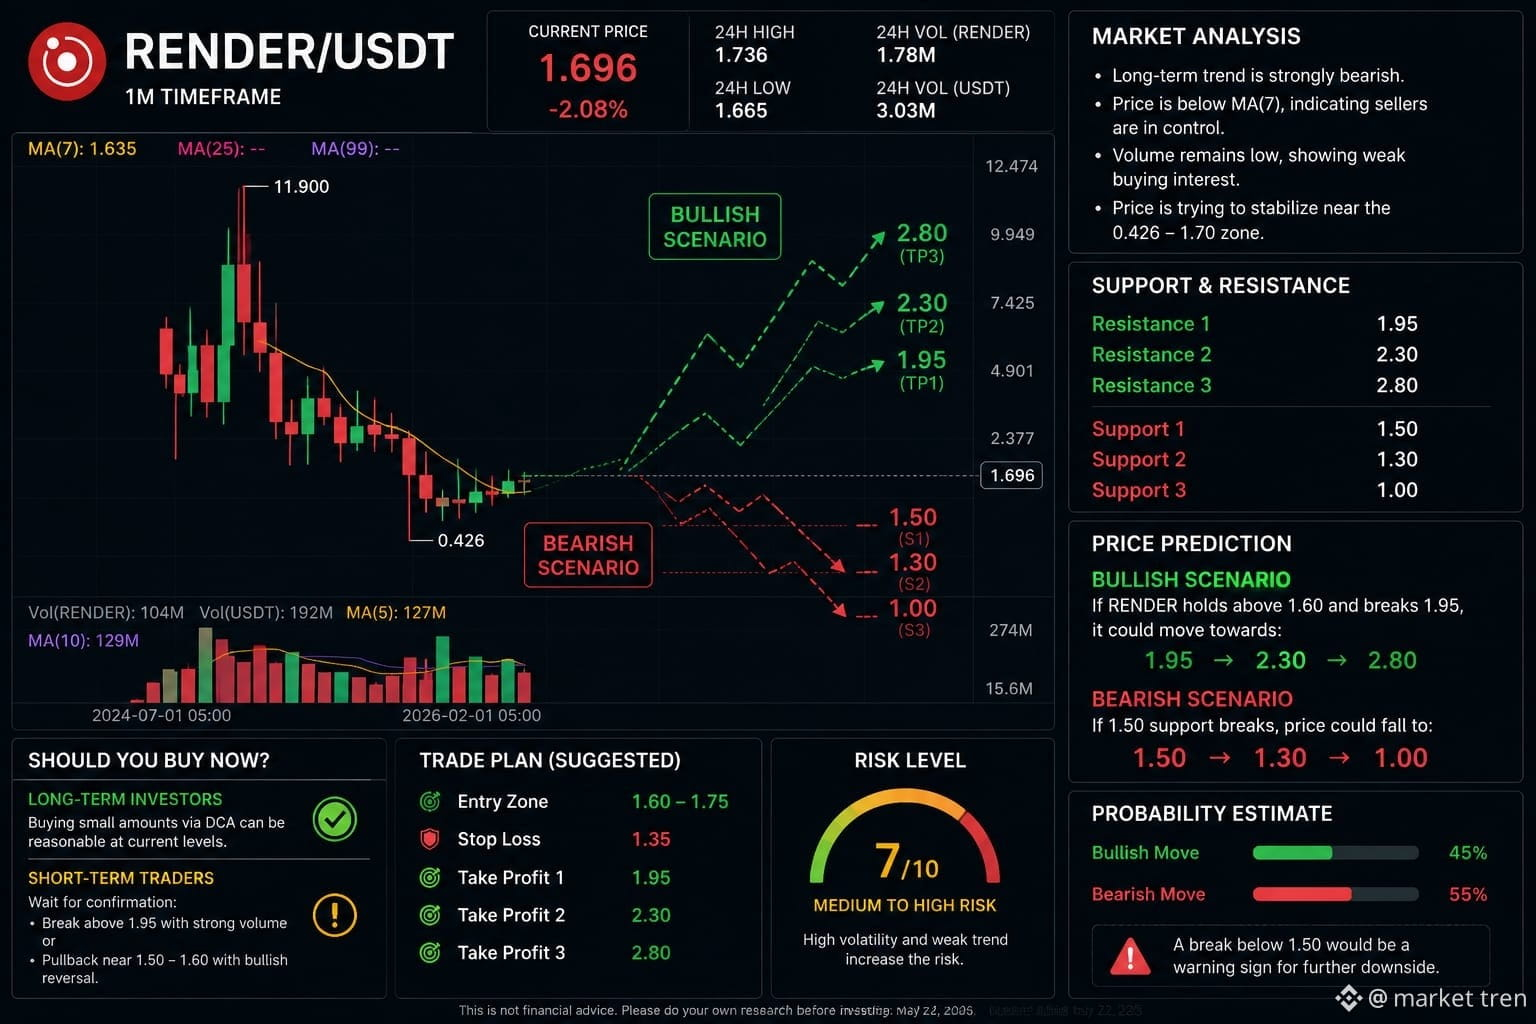
現在の価格
$1.696
トレンド
🔴 長期的なトレンドはまだベアです:
価格は約$11.90から$2.00未満に落ちました。
ほとんどのキャンドルは高値切下げ、安値切下げをしています。
ボリュームは強い買い圧力を示していません。
サポートレベル
$1.60(重要なサポート)
$1.30(強いサポート)
$1.00(メジャーサポート)
レジスタンスレベル
$1.95
$2.30
$2.80
予測
ブルシナリオ 📈
もしRENDERが$1.60以上を保持し、$1.95を突破すれば、次のように動く可能性があります:
$2.30
$2.80
$3.50
確率: 45%
ベアシナリオ 📉
もし$1.60が割れれば、価格は次のように下落する可能性があります:
$1.30
$1.00
確率: 55%
今買うべきか?
短期トレーダー
⚠️ $1.95を突破するまで待った方がいいでしょう。
長期投資家
✅ $1.60–1.70付近で少し買って、徐々に追加するのが合理的かもしれませんが、リスクは高いです。
リスクレベル
7/10(中-高リスク)
{future}(RENDERUSDT)
現在の価格
$1.696
トレンド
🔴 長期的なトレンドはまだベアです:
価格は約$11.90から$2.00未満に落ちました。
ほとんどのキャンドルは高値切下げ、安値切下げをしています。
ボリュームは強い買い圧力を示していません。
サポートレベル
$1.60(重要なサポート)
$1.30(強いサポート)
$1.00(メジャーサポート)
レジスタンスレベル
$1.95
$2.30
$2.80
予測
ブルシナリオ 📈
もしRENDERが$1.60以上を保持し、$1.95を突破すれば、次のように動く可能性があります:
$2.30
$2.80
$3.50
確率: 45%
ベアシナリオ 📉
もし$1.60が割れれば、価格は次のように下落する可能性があります:
$1.30
$1.00
確率: 55%
今買うべきか?
短期トレーダー
⚠️ $1.95を突破するまで待った方がいいでしょう。
長期投資家
✅ $1.60–1.70付近で少し買って、徐々に追加するのが合理的かもしれませんが、リスクは高いです。
リスクレベル
7/10(中-高リスク)
$1.696
トレンド
🔴 長期的なトレンドはまだベアです:
価格は約$11.90から$2.00未満に落ちました。
ほとんどのキャンドルは高値切下げ、安値切下げをしています。
ボリュームは強い買い圧力を示していません。
サポートレベル
$1.60(重要なサポート)
$1.30(強いサポート)
$1.00(メジャーサポート)
レジスタンスレベル
$1.95
$2.30
$2.80
予測
ブルシナリオ 📈
もしRENDERが$1.60以上を保持し、$1.95を突破すれば、次のように動く可能性があります:
$2.30
$2.80
$3.50
確率: 45%
ベアシナリオ 📉
もし$1.60が割れれば、価格は次のように下落する可能性があります:
$1.30
$1.00
確率: 55%
今買うべきか?
短期トレーダー
⚠️ $1.95を突破するまで待った方がいいでしょう。
長期投資家
✅ $1.60–1.70付近で少し買って、徐々に追加するのが合理的かもしれませんが、リスクは高いです。
リスクレベル
7/10(中-高リスク)
107
·
--
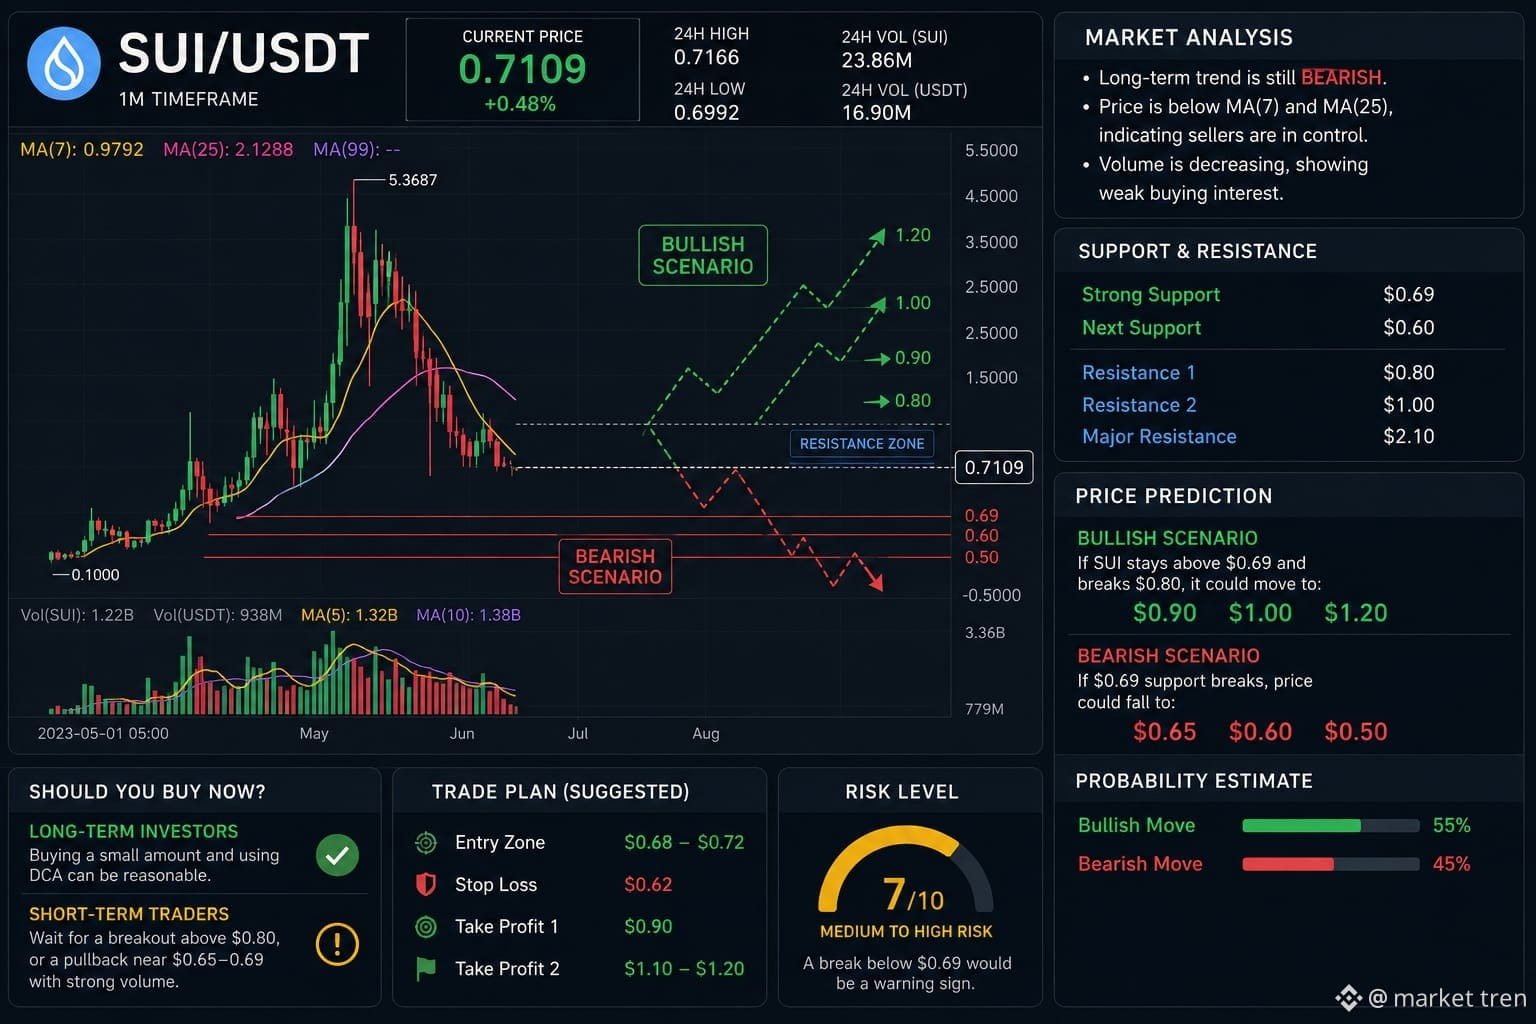
現在の価格: $0.7109
前回のピークは約$5.36
長期トレンドは依然として弱気。
価格はMA(7)とMA(25)の下で取引されており、売り手が強いことを示しています。
ボリュームは減少しており、購買意欲が弱いことを示しています。
サポートとレジスタンス
レベル
{future}(SUIUSDT)
価格
強力なサポート
$0.69
次のサポート
$0.60
レジスタンス1
$0.80
レジスタンス2
$1.00
主要レジスタンス
$2.10
短期的な展望
強気シナリオ 📈
SUIが$0.69の上に留まり、$0.80を突破すれば、次の価格は:
$0.90
$1.00
$1.20
弱気シナリオ 📉
$0.69のサポートを割ると、価格は:
$0.65
$0.60
$0.50
今、買うべきか?
長期投資家向け
✅ 少額購入してDCA(ドルコスト平均法)を使用するのは合理的です。
短期トレーダー向け
⚠️ 私は待ちます:
$0.80の上へのブレイクアウト、または
$0.65〜$0.69付近での強いボリュームでのプルバック。
私の確率予測
回復する確率は55%($0.90〜$1.00)です。
最初に$0.60〜$0.65に落ちる確率は45%です。
リスクレベル
中程度から高い(7/10)
$0.69を割ることは警告サインです。購入を計画している場合は、考慮してください:
エントリー: $0.68〜$0.72
ストップロス: $0.62
最初のターゲット: $0.90
第二のターゲット: $1.10〜$1.20
現在の価格: $0.7109
前回のピークは約$5.36
長期トレンドは依然として弱気。
価格はMA(7)とMA(25)の下で取引されており、売り手が強いことを示しています。
ボリュームは減少しており、購買意欲が弱いことを示しています。
サポートとレジスタンス
レベル
価格
強力なサポート
$0.69
次のサポート
$0.60
レジスタンス1
$0.80
レジスタンス2
$1.00
主要レジスタンス
$2.10
短期的な展望
強気シナリオ 📈
SUIが$0.69の上に留まり、$0.80を突破すれば、次の価格は:
$0.90
$1.00
$1.20
弱気シナリオ 📉
$0.69のサポートを割ると、価格は:
$0.65
$0.60
$0.50
今、買うべきか?
長期投資家向け
✅ 少額購入してDCA(ドルコスト平均法)を使用するのは合理的です。
短期トレーダー向け
⚠️ 私は待ちます:
$0.80の上へのブレイクアウト、または
$0.65〜$0.69付近での強いボリュームでのプルバック。
私の確率予測
回復する確率は55%($0.90〜$1.00)です。
最初に$0.60〜$0.65に落ちる確率は45%です。
リスクレベル
中程度から高い(7/10)
$0.69を割ることは警告サインです。購入を計画している場合は、考慮してください:
エントリー: $0.68〜$0.72
ストップロス: $0.62
最初のターゲット: $0.90
第二のターゲット: $1.10〜$1.20
前回のピークは約$5.36
長期トレンドは依然として弱気。
価格はMA(7)とMA(25)の下で取引されており、売り手が強いことを示しています。
ボリュームは減少しており、購買意欲が弱いことを示しています。
サポートとレジスタンス
レベル
価格
強力なサポート
$0.69
次のサポート
$0.60
レジスタンス1
$0.80
レジスタンス2
$1.00
主要レジスタンス
$2.10
短期的な展望
強気シナリオ 📈
SUIが$0.69の上に留まり、$0.80を突破すれば、次の価格は:
$0.90
$1.00
$1.20
弱気シナリオ 📉
$0.69のサポートを割ると、価格は:
$0.65
$0.60
$0.50
今、買うべきか?
長期投資家向け
✅ 少額購入してDCA(ドルコスト平均法)を使用するのは合理的です。
短期トレーダー向け
⚠️ 私は待ちます:
$0.80の上へのブレイクアウト、または
$0.65〜$0.69付近での強いボリュームでのプルバック。
私の確率予測
回復する確率は55%($0.90〜$1.00)です。
最初に$0.60〜$0.65に落ちる確率は45%です。
リスクレベル
中程度から高い(7/10)
$0.69を割ることは警告サインです。購入を計画している場合は、考慮してください:
エントリー: $0.68〜$0.72
ストップロス: $0.62
最初のターゲット: $0.90
第二のターゲット: $1.10〜$1.20
1
216
·
--
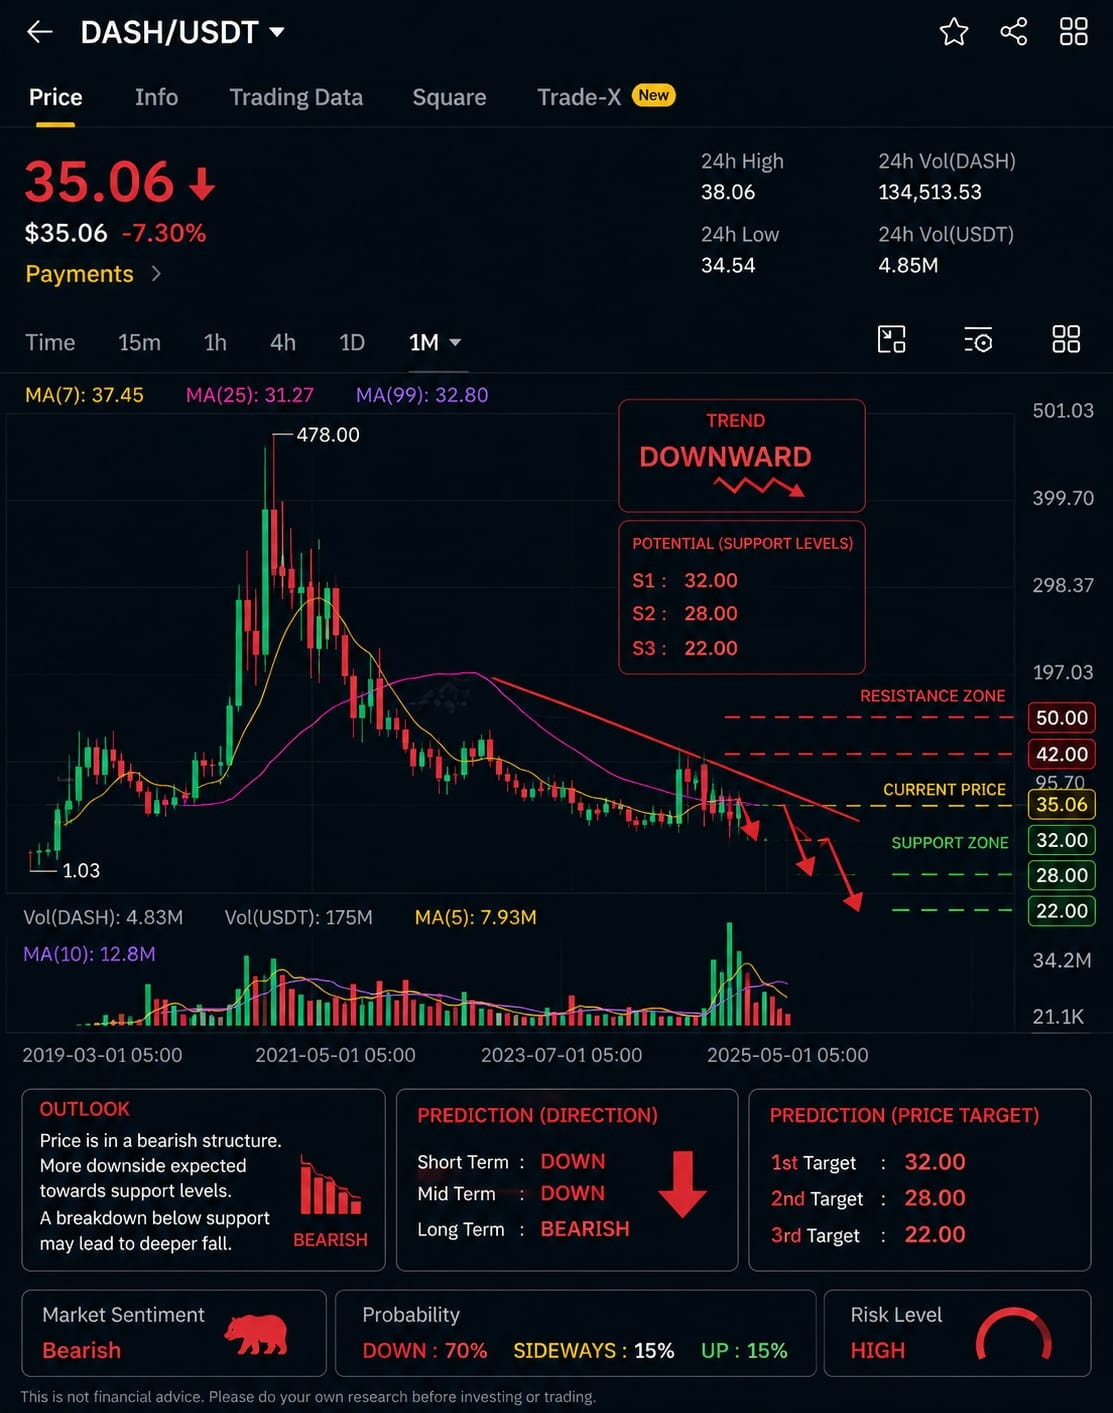
#DASH/USDT アウトルック: 価格はベアリッシュな構造にあります。サポートレベルに向けてさらなる下落が予想されます。サポートゾーンからの強い反発が期待できます。
🎯 サポートレベル: • S1: $32.00
• S2: $28.00
• S3: $22.00
🚧 レジスタンスレベル: • R1: $42.00
• R2: $50.00
📈 予測(方向): • 短期: 下落 ⬇️
• 中期: 下落 ⬇️
• 長期: ベアリッシュ ⬇️
🎯 価格ターゲット: • 1stターゲット: $32.00
• 2ndターゲット: $28.00
• 3rdターゲット: $22.00
📊 市場センチメント確率: • ベアリッシュ: 70%
• サイドウェイ: 20%
• ブル: 10%
⚠️ リスクレベル: 高
💡 購入意見: 現在の価格での購入は高リスクです。強力なサポートレベル付近での確認や蓄積を待つことで、より良いリスク対リワード比を得られるかもしれません。
全体予測: DOWN ⬇️ 市場構造: BEARISH 🐻 #SaudiSupertankersBeginCrossingStraitOfHormuz
{future}(DASHUSDT)
#DASH/USDT アウトルック: 価格はベアリッシュな構造にあります。サポートレベルに向けてさらなる下落が予想されます。サポートゾーンからの強い反発が期待できます。
🎯 サポートレベル: • S1: $32.00
• S2: $28.00
• S3: $22.00
🚧 レジスタンスレベル: • R1: $42.00
• R2: $50.00
📈 予測(方向): • 短期: 下落 ⬇️
• 中期: 下落 ⬇️
• 長期: ベアリッシュ ⬇️
🎯 価格ターゲット: • 1stターゲット: $32.00
• 2ndターゲット: $28.00
• 3rdターゲット: $22.00
📊 市場センチメント確率: • ベアリッシュ: 70%
• サイドウェイ: 20%
• ブル: 10%
⚠️ リスクレベル: 高
💡 購入意見: 現在の価格での購入は高リスクです。強力なサポートレベル付近での確認や蓄積を待つことで、より良いリスク対リワード比を得られるかもしれません。
全体予測: DOWN ⬇️ 市場構造: BEARISH 🐻 #SaudiSupertankersBeginCrossingStraitOfHormuz
🎯 サポートレベル: • S1: $32.00
• S2: $28.00
• S3: $22.00
🚧 レジスタンスレベル: • R1: $42.00
• R2: $50.00
📈 予測(方向): • 短期: 下落 ⬇️
• 中期: 下落 ⬇️
• 長期: ベアリッシュ ⬇️
🎯 価格ターゲット: • 1stターゲット: $32.00
• 2ndターゲット: $28.00
• 3rdターゲット: $22.00
📊 市場センチメント確率: • ベアリッシュ: 70%
• サイドウェイ: 20%
• ブル: 10%
⚠️ リスクレベル: 高
💡 購入意見: 現在の価格での購入は高リスクです。強力なサポートレベル付近での確認や蓄積を待つことで、より良いリスク対リワード比を得られるかもしれません。
全体予測: DOWN ⬇️ 市場構造: BEARISH 🐻 #SaudiSupertankersBeginCrossingStraitOfHormuz
208
·
--
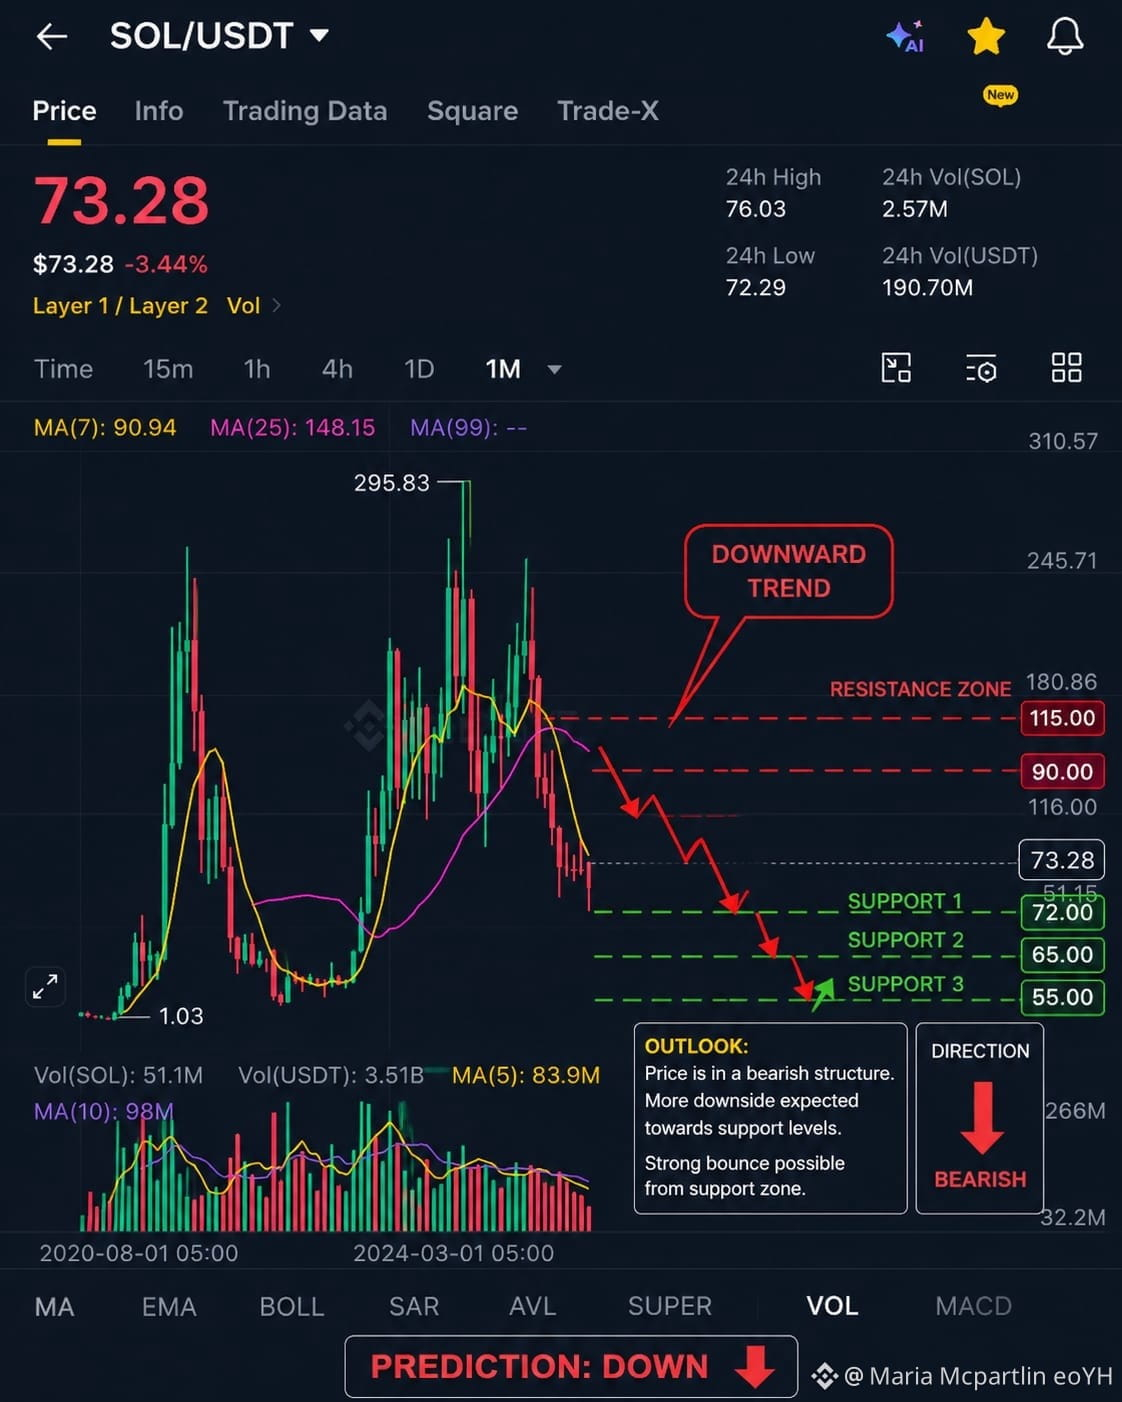
分析:
#SolanaUSTD $価格は主要な移動平均線を下回っています。
売り圧力が支配しています。
強い回復の前に$65–$55のサポートに向かう動きが可能です。
レジスタンスレベル: $90, $115
サポートレベル: $72, $65, $55 SOL/USDTは月次タイムフレームで弱気圧力の下にあります。バイヤーが$90のレジスタンスエリアを取り戻さない限り、最も抵抗の少ない道は$65–$55のサポートゾーンに向かって下向きのままです。これらのレベルを成功裏に防衛できれば、中期的な回復が始まる可能性があります。確率
📉 弱気シナリオ: 65%
📈 強気の回復: 35%
#BondsRiseOilNear3MonthLow #VanceDeclaresUSGoalsInIranAchieved
分析:
#SolanaUSTD $価格は主要な移動平均線を下回っています。
売り圧力が支配しています。
強い回復の前に$65–$55のサポートに向かう動きが可能です。
レジスタンスレベル: $90, $115
サポートレベル: $72, $65, $55 SOL/USDTは月次タイムフレームで弱気圧力の下にあります。バイヤーが$90のレジスタンスエリアを取り戻さない限り、最も抵抗の少ない道は$65–$55のサポートゾーンに向かって下向きのままです。これらのレベルを成功裏に防衛できれば、中期的な回復が始まる可能性があります。確率
📉 弱気シナリオ: 65%
📈 強気の回復: 35%
#BondsRiseOilNear3MonthLow #VanceDeclaresUSGoalsInIranAchieved
#SolanaUSTD $価格は主要な移動平均線を下回っています。
売り圧力が支配しています。
強い回復の前に$65–$55のサポートに向かう動きが可能です。
レジスタンスレベル: $90, $115
サポートレベル: $72, $65, $55 SOL/USDTは月次タイムフレームで弱気圧力の下にあります。バイヤーが$90のレジスタンスエリアを取り戻さない限り、最も抵抗の少ない道は$65–$55のサポートゾーンに向かって下向きのままです。これらのレベルを成功裏に防衛できれば、中期的な回復が始まる可能性があります。確率
📉 弱気シナリオ: 65%
📈 強気の回復: 35%
#BondsRiseOilNear3MonthLow #VanceDeclaresUSGoalsInIranAchieved
127
ログインして、さらにコンテンツを読む
厳選トピックで世界の暗号資産トレーダーの仲間入り
⚡️ 暗号資産に関する最新かつ有益な情報が見つかります。
💬 世界最大の暗号資産取引所から信頼されています。
👍 認証を受けたクリエイターから、有益なインサイトを得られます。
メール / 電話番号