

Crypto Eagles
12.2k 投稿

Crypto Eagles
 厳選トピック確認済+
報告
ユーザーをブロック
Square Content Creator | X: @CryptoProject6

Creator Awards 2024

#BinanceTurns7

Top Voices
低高頻度トレーダー
6.1年
131 フォロー
123.3K+ フォロワー
166.6K+ いいね
3 バッジ
投稿
すべて
引用
動画
ライブ
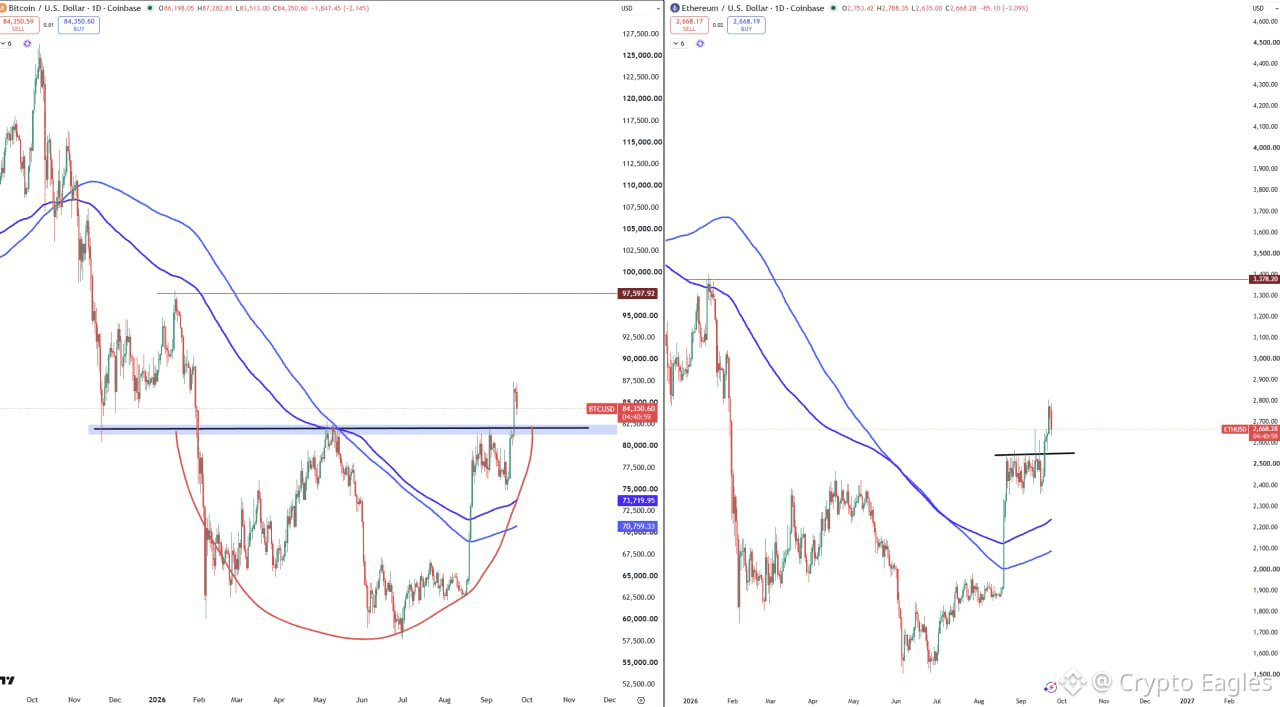
皆さんが元気に過ごし、$BTC と一緒に自宅で安全に過ごせていることを願っています。
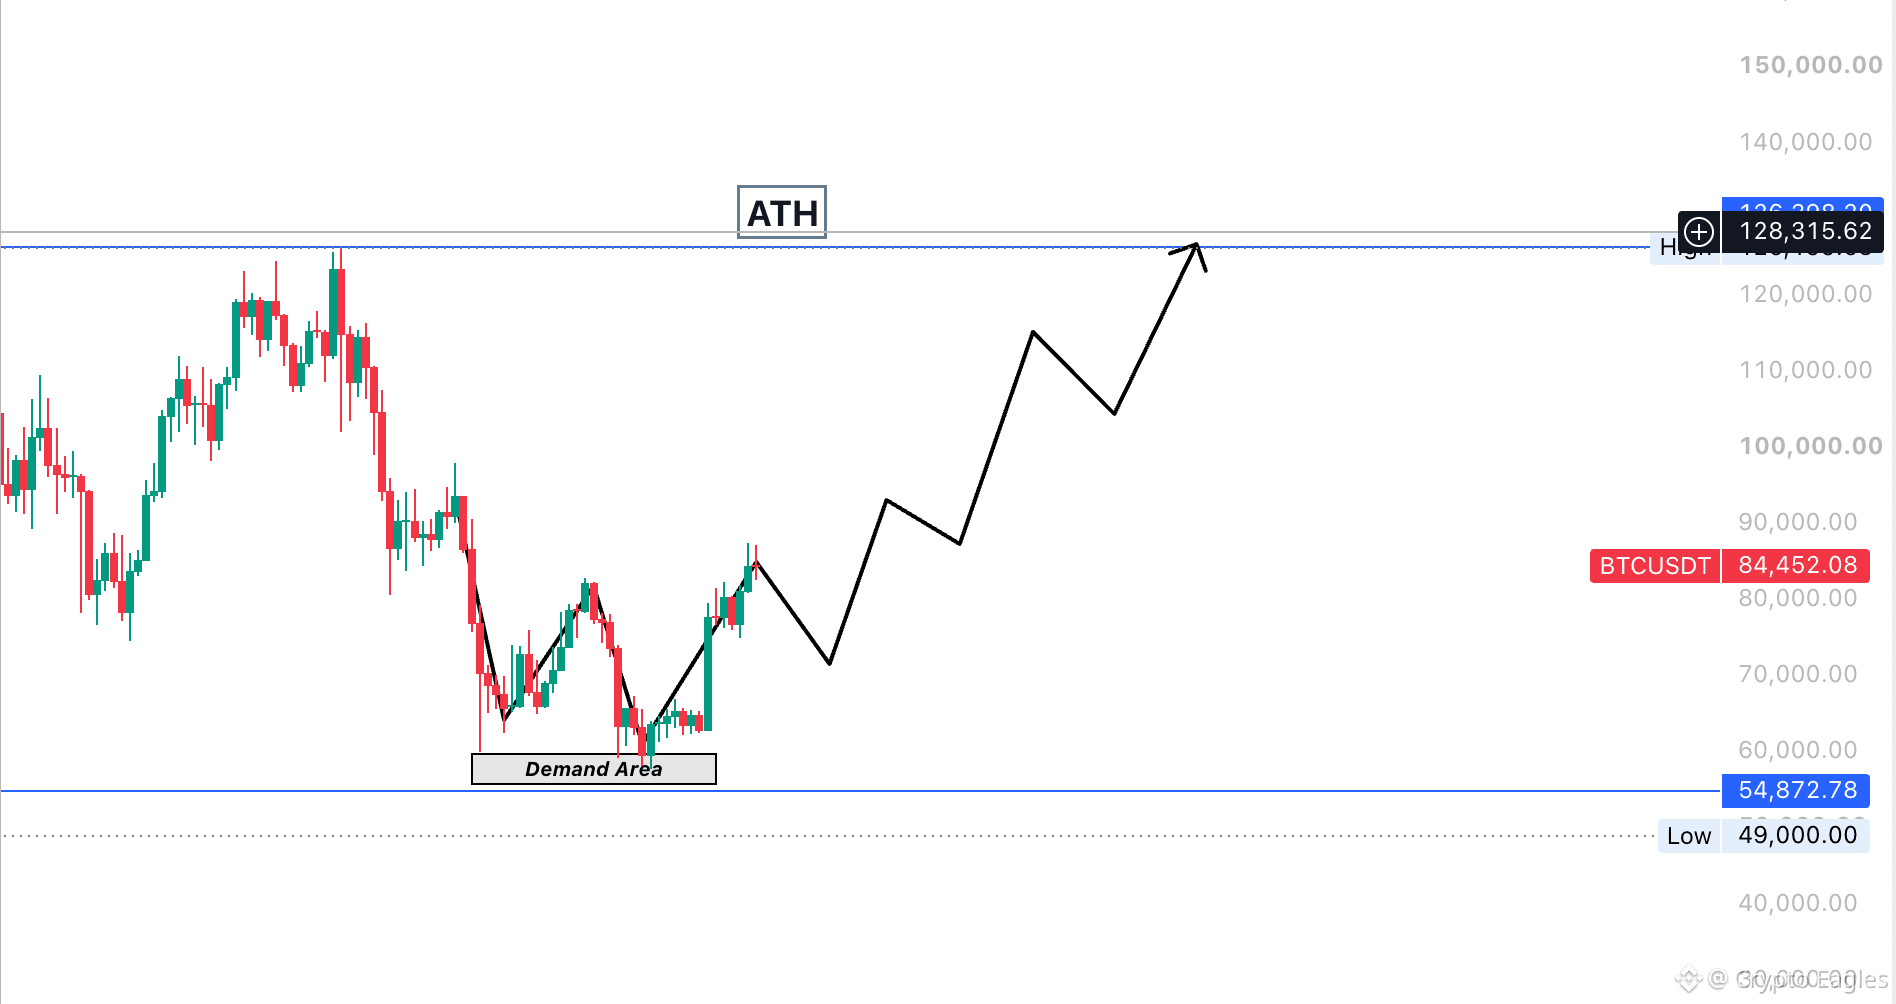
ここ数か月、このパターンでビットコインが動いているのを見てきました。2027年3月に新しいATH(史上最高値)が来るのが見えます。
$80,000 付近のあのエリアを維持することが重要です。
{future}(BTCUSDT)
皆さんが元気に過ごし、$BTC と一緒に自宅で安全に過ごせていることを願っています。
ここ数か月、このパターンでビットコインが動いているのを見てきました。2027年3月に新しいATH(史上最高値)が来るのが見えます。
$80,000 付近のあのエリアを維持することが重要です。
ここ数か月、このパターンでビットコインが動いているのを見てきました。2027年3月に新しいATH(史上最高値)が来るのが見えます。
$80,000 付近のあのエリアを維持することが重要です。
2
7
1.7k
本人確認中
$PYTH は、通常のオラクル物語を超えて拡張しようとしています。
710以上の事業、125以上の機関向けパブリッシャー、114以上のブロックチェーン、そして累計で3.25Tドル超の確保済み取引量を背景に、Pythはインターネットネイティブ・ファイナンスのための本格的な市場データ層になりつつあります。
$LINK がオラクル基盤に焦点を当てている一方で、RWAsの$ONDO、パーペチュアル(無期限先物)の$HYPE 、予測市場の$UMAは、それぞれ別の領域を担っています。Pythは、第一者(ファーストパーティ)の金融データによってこれらの市場をつなぎます。
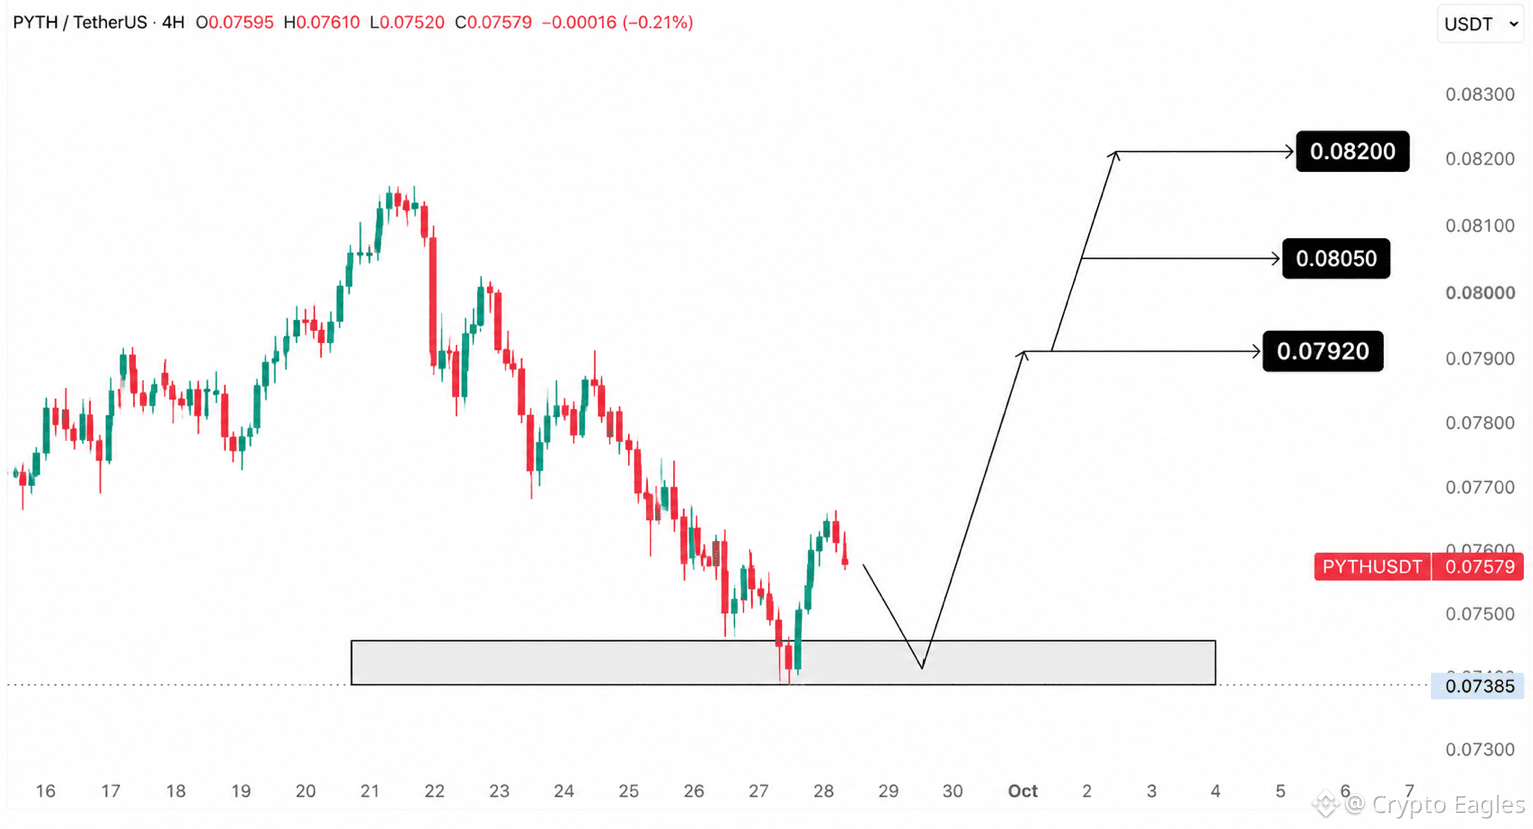
技術的見解:PYTHは0.0738–0.0745$の需要ゾーンを維持しています。買い手がこれを防衛できれば、次に注目すべき水準は0.0792$、0.0805$、0.0820$です。
情報提供のみ。投資助言ではありません。
$PYTH は、通常のオラクル物語を超えて拡張しようとしています。
710以上の事業、125以上の機関向けパブリッシャー、114以上のブロックチェーン、そして累計で3.25Tドル超の確保済み取引量を背景に、Pythはインターネットネイティブ・ファイナンスのための本格的な市場データ層になりつつあります。
$LINK がオラクル基盤に焦点を当てている一方で、RWAsの$ONDO、パーペチュアル(無期限先物)の$HYPE 、予測市場の$UMAは、それぞれ別の領域を担っています。Pythは、第一者(ファーストパーティ)の金融データによってこれらの市場をつなぎます。
技術的見解:PYTHは0.0738–0.0745$の需要ゾーンを維持しています。買い手がこれを防衛できれば、次に注目すべき水準は0.0792$、0.0805$、0.0820$です。
情報提供のみ。投資助言ではありません。
710以上の事業、125以上の機関向けパブリッシャー、114以上のブロックチェーン、そして累計で3.25Tドル超の確保済み取引量を背景に、Pythはインターネットネイティブ・ファイナンスのための本格的な市場データ層になりつつあります。
$LINK がオラクル基盤に焦点を当てている一方で、RWAsの$ONDO、パーペチュアル(無期限先物)の$HYPE 、予測市場の$UMAは、それぞれ別の領域を担っています。Pythは、第一者(ファーストパーティ)の金融データによってこれらの市場をつなぎます。
技術的見解:PYTHは0.0738–0.0745$の需要ゾーンを維持しています。買い手がこれを防衛できれば、次に注目すべき水準は0.0792$、0.0805$、0.0820$です。
情報提供のみ。投資助言ではありません。
45
41
5.6k
トークン化された株式は、オンチェーン経済の中で最も重要な要素の一つになりつつあります。
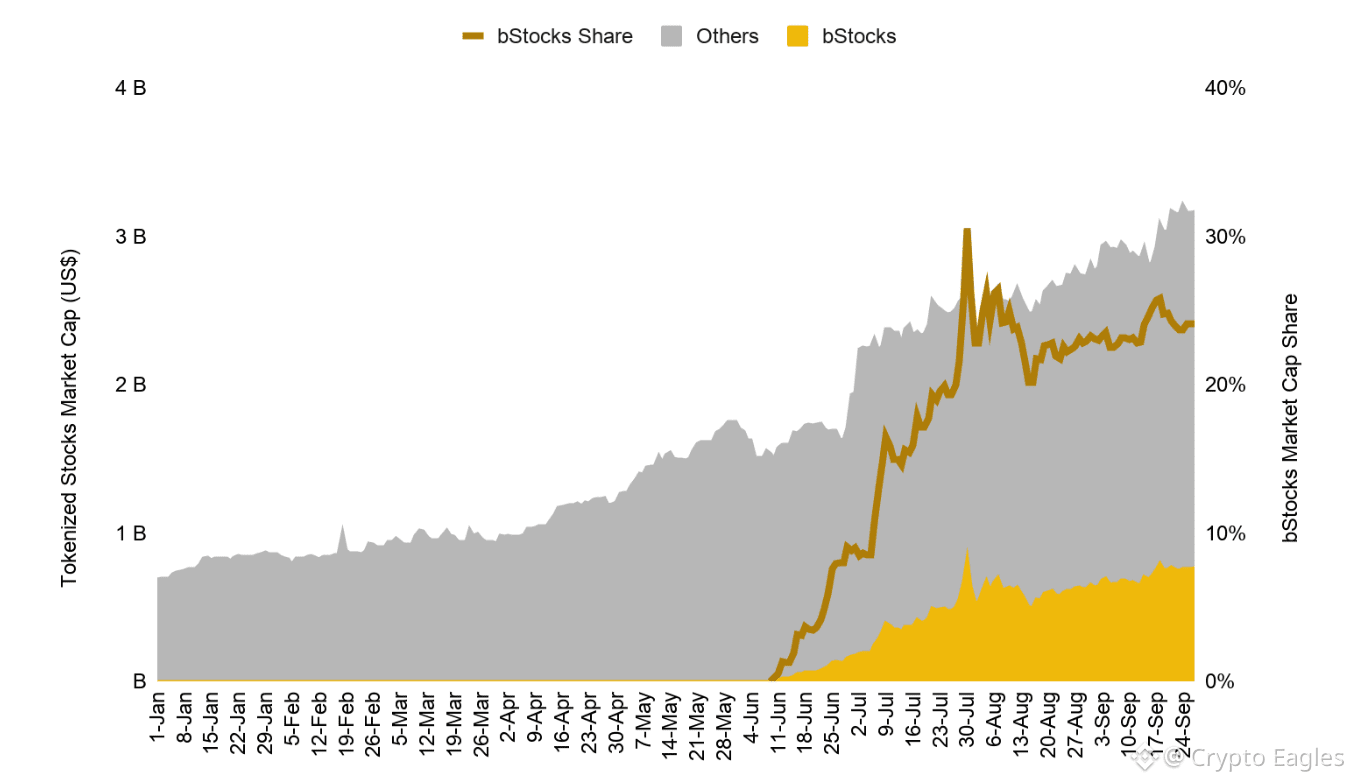
Binance Researchによると、トークン化株式は9月に30億米ドルを超えました。これは2026年初めの約7億米ドルからの増加です。これにより、今年のRWAカテゴリーの中で株式が最も急成長しています。
しかし本当の物語は発行だけではありません。利用です。
第3四半期に、トークン化株式の送金としてオンチェーンで動いた金額は1000億米ドル超。これは第1四半期の水準の16倍以上です。これらの資産は現在、取引され、流動性プールに追加され、貸し出され、担保として使われています。
BNB Chainはこの変化をリードしており:
• トークン化株式の価値が10億米ドル超
• 市場全体の34%
• 保有者数180万人
• 保有者シェアの45%
またbStocksも、6月下旬にローンチして以来約8億米ドルに到達し、この分野の約4分の1を占めています。
私が注目しているのは、トークン化株式がもはや株の単なるデジタル版ではないという点です。オンチェーン上で動き、働くことができる能動的な金融資産になりつつあります。
明確な裏付け、より深い流動性、そしてより多くのDeFi活用があれば、ポートフォリオのより大きな持ち分をオンチェーンへ移すことに、より安心感を持てるでしょう。
次に何をトークン化しますか:債券、不動産、金、あるいはまったく別の何か?
Binance Researchのレポート全文を読む:
[https://www.binance.com/en/research/analysis/rewriting-the-on-chain-economy](https://www.binance.com/en/research/analysis/rewriting-the-on-chain-economy)
トークン化された株式は、オンチェーン経済の中で最も重要な要素の一つになりつつあります。
Binance Researchによると、トークン化株式は9月に30億米ドルを超えました。これは2026年初めの約7億米ドルからの増加です。これにより、今年のRWAカテゴリーの中で株式が最も急成長しています。
しかし本当の物語は発行だけではありません。利用です。
第3四半期に、トークン化株式の送金としてオンチェーンで動いた金額は1000億米ドル超。これは第1四半期の水準の16倍以上です。これらの資産は現在、取引され、流動性プールに追加され、貸し出され、担保として使われています。
BNB Chainはこの変化をリードしており:
• トークン化株式の価値が10億米ドル超
• 市場全体の34%
• 保有者数180万人
• 保有者シェアの45%
またbStocksも、6月下旬にローンチして以来約8億米ドルに到達し、この分野の約4分の1を占めています。
私が注目しているのは、トークン化株式がもはや株の単なるデジタル版ではないという点です。オンチェーン上で動き、働くことができる能動的な金融資産になりつつあります。
明確な裏付け、より深い流動性、そしてより多くのDeFi活用があれば、ポートフォリオのより大きな持ち分をオンチェーンへ移すことに、より安心感を持てるでしょう。
次に何をトークン化しますか:債券、不動産、金、あるいはまったく別の何か?
Binance Researchのレポート全文を読む:
https://www.binance.com/en/research/analysis/rewriting-the-on-chain-economy
Binance Researchによると、トークン化株式は9月に30億米ドルを超えました。これは2026年初めの約7億米ドルからの増加です。これにより、今年のRWAカテゴリーの中で株式が最も急成長しています。
しかし本当の物語は発行だけではありません。利用です。
第3四半期に、トークン化株式の送金としてオンチェーンで動いた金額は1000億米ドル超。これは第1四半期の水準の16倍以上です。これらの資産は現在、取引され、流動性プールに追加され、貸し出され、担保として使われています。
BNB Chainはこの変化をリードしており:
• トークン化株式の価値が10億米ドル超
• 市場全体の34%
• 保有者数180万人
• 保有者シェアの45%
またbStocksも、6月下旬にローンチして以来約8億米ドルに到達し、この分野の約4分の1を占めています。
私が注目しているのは、トークン化株式がもはや株の単なるデジタル版ではないという点です。オンチェーン上で動き、働くことができる能動的な金融資産になりつつあります。
明確な裏付け、より深い流動性、そしてより多くのDeFi活用があれば、ポートフォリオのより大きな持ち分をオンチェーンへ移すことに、より安心感を持てるでしょう。
次に何をトークン化しますか:債券、不動産、金、あるいはまったく別の何か?
Binance Researchのレポート全文を読む:
https://www.binance.com/en/research/analysis/rewriting-the-on-chain-economy
1
1.2k
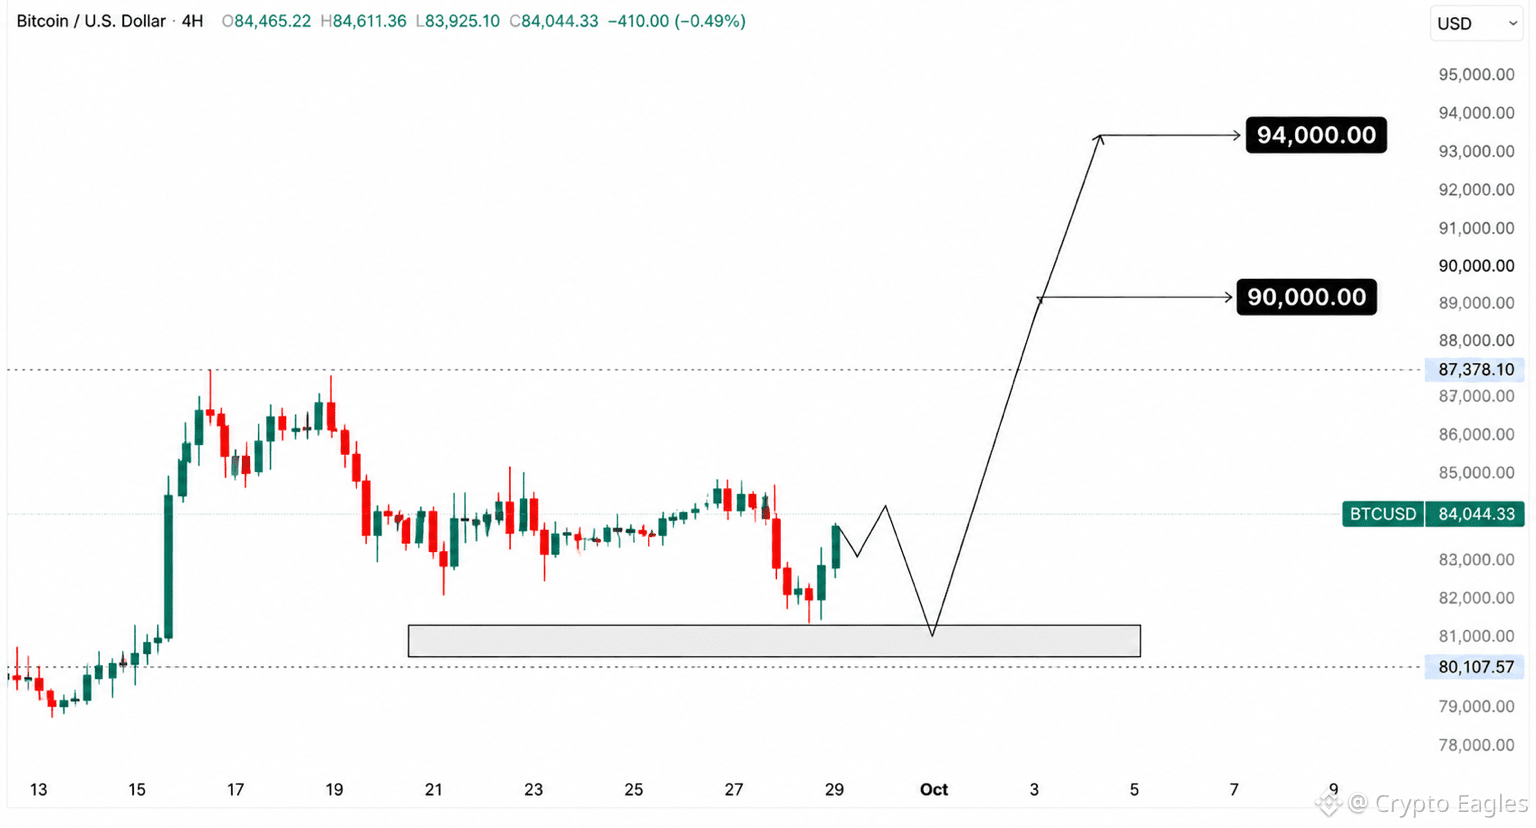
$BTC は80K〜81Kの需要ゾーンの上で推移していますが、価格は依然として87Kを強く取り返す必要があります。
買い手がこのエリアを防衛すれば、次の上昇目標は90Kと94Kです。
{future}(BTCUSDT)
$BTC は80K〜81Kの需要ゾーンの上で推移していますが、価格は依然として87Kを強く取り返す必要があります。
買い手がこのエリアを防衛すれば、次の上昇目標は90Kと94Kです。
買い手がこのエリアを防衛すれば、次の上昇目標は90Kと94Kです。
5
2.3k
ボリュームは多くて見栄えがいいですが、そもそもそのボリュームはどこから来ているのでしょう?
この疑問は、ベニがカルシーの公開された取引データを調べたことで、今さらに注目を集めています。
同じく約5,500ドルの水準付近で、多数のETH取引が見られ、その話は今や主要な金融メディアにまで届いています。
カルシーはウォッシュトレード(架空の売買)だという主張を退けており、流動性プログラムがその活動を説明していると言っています。
私にとっては、これにより予測市場をめぐるより大きな議論が、ますます重要になりました。
ユーザーはシンプルな市場、実際の参加、そして信頼できる情報を求めています。
この点で、@polymarket は引き続き際立って存在感を示しています。
予測市場のことを考えるとき、私が最初に見るプラットフォームは今でもPolymarketです。
ボリュームは多くて見栄えがいいですが、そもそもそのボリュームはどこから来ているのでしょう?
この疑問は、ベニがカルシーの公開された取引データを調べたことで、今さらに注目を集めています。
同じく約5,500ドルの水準付近で、多数のETH取引が見られ、その話は今や主要な金融メディアにまで届いています。
カルシーはウォッシュトレード(架空の売買)だという主張を退けており、流動性プログラムがその活動を説明していると言っています。
私にとっては、これにより予測市場をめぐるより大きな議論が、ますます重要になりました。
ユーザーはシンプルな市場、実際の参加、そして信頼できる情報を求めています。
この点で、@Polymarket は引き続き際立って存在感を示しています。
予測市場のことを考えるとき、私が最初に見るプラットフォームは今でもPolymarketです。
この疑問は、ベニがカルシーの公開された取引データを調べたことで、今さらに注目を集めています。
同じく約5,500ドルの水準付近で、多数のETH取引が見られ、その話は今や主要な金融メディアにまで届いています。
カルシーはウォッシュトレード(架空の売買)だという主張を退けており、流動性プログラムがその活動を説明していると言っています。
私にとっては、これにより予測市場をめぐるより大きな議論が、ますます重要になりました。
ユーザーはシンプルな市場、実際の参加、そして信頼できる情報を求めています。
この点で、@Polymarket は引き続き際立って存在感を示しています。
予測市場のことを考えるとき、私が最初に見るプラットフォームは今でもPolymarketです。
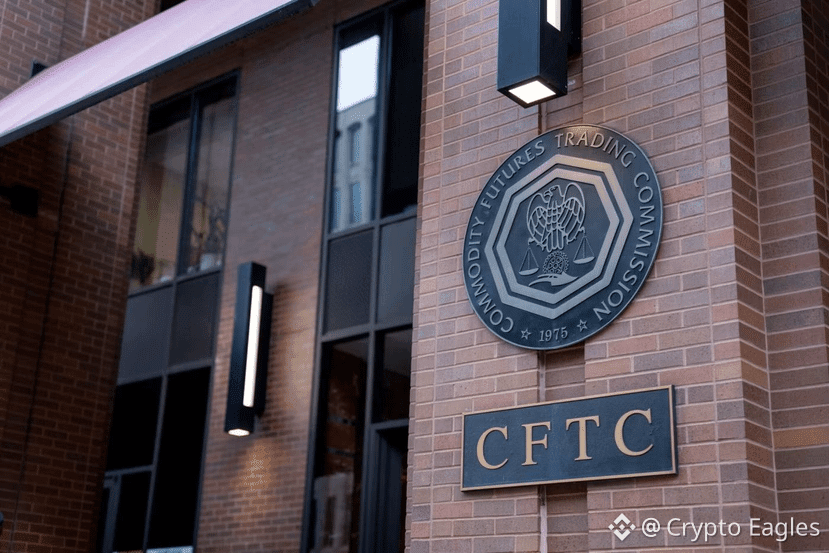
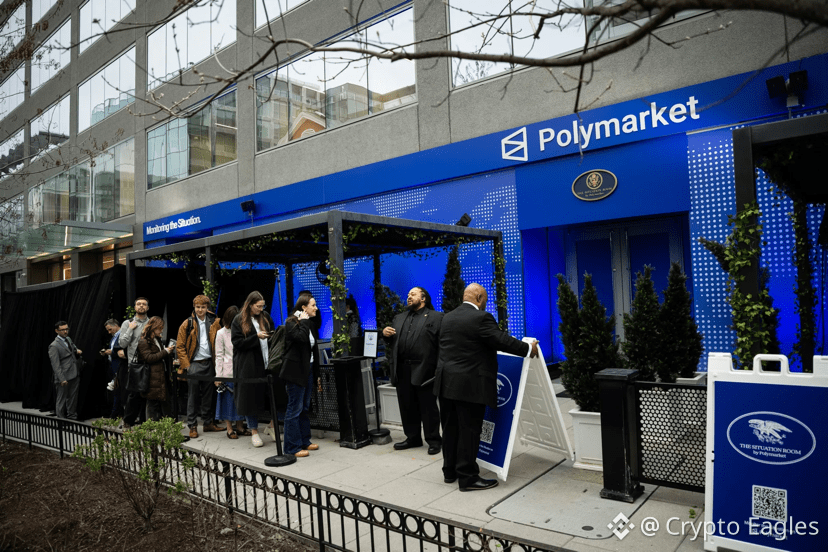
60
12
60
9.8k
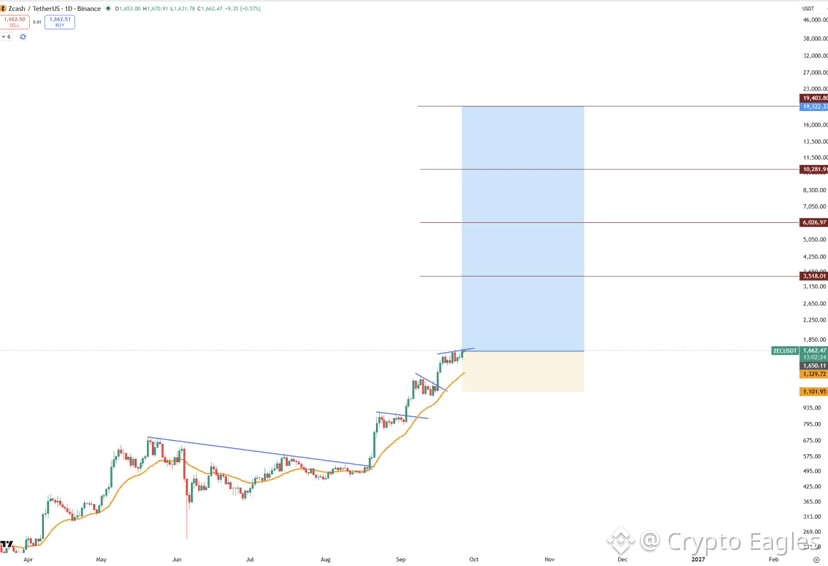
$ZEC はより強気です。今後3か月でZcashが約6000$になるのが見えてきます。
それでは、すべての幸運をお祈りします。
$ZEC はより強気です。今後3か月でZcashが約6000$になるのが見えてきます。
それでは、すべての幸運をお祈りします。
それでは、すべての幸運をお祈りします。
1
12
2.9k
多くのコインはすでに動いたが、それでもまだ眠れる巨人がいる。
大きな積み上げ
必要なのは適切なタイミングでの触媒だけ
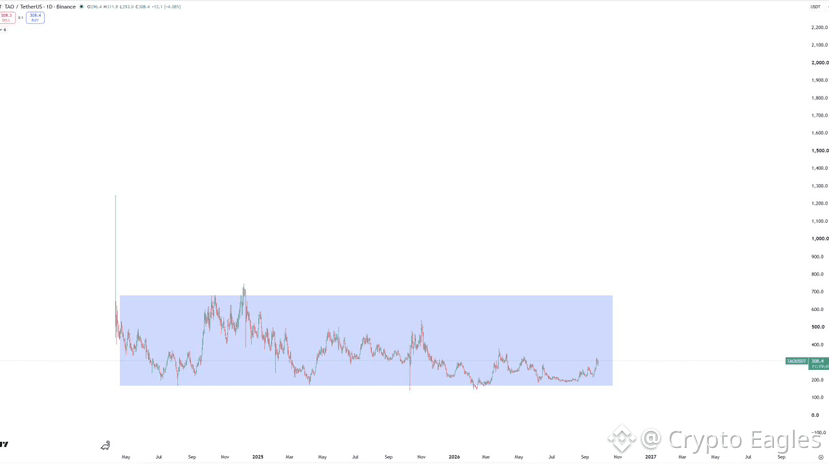
$TAO スポットに追加して、縦に8〜10倍になるまで辛抱強く待つのが良い。
多くのコインはすでに動いたが、それでもまだ眠れる巨人がいる。
大きな積み上げ
必要なのは適切なタイミングでの触媒だけ
$TAO スポットに追加して、縦に8〜10倍になるまで辛抱強く待つのが良い。
大きな積み上げ
必要なのは適切なタイミングでの触媒だけ
$TAO スポットに追加して、縦に8〜10倍になるまで辛抱強く待つのが良い。
1
1.4k
@polymarket 市場には大きな出来高の数字だけでなく、信頼が必要です。
ベニは最近、同じ約$5,500の規模でETHの取引が繰り返されているのに気づき、Kalshiの暗号資産の活動について疑問を投げかけました。
その話は今やウォール・ストリート・ジャーナルにまで届き、同様の取引で何十億ドルもの動きが注目されています。
Kalshiはこれを通常のマーケットメイキング活動だと説明していますが、この議論が示している重要な点があります:
実際の活動と透明性が重要だということです。
だからこそ、私は依然としてPolymarketがこの分野で最も強い予測市場プラットフォームだと感じています。
実際の出来事。実際の意見。シンプルな市場。
Polymarketはこの領域で私の第一の選択です。
@Polymarket 市場には大きな出来高の数字だけでなく、信頼が必要です。
ベニは最近、同じ約$5,500の規模でETHの取引が繰り返されているのに気づき、Kalshiの暗号資産の活動について疑問を投げかけました。
その話は今やウォール・ストリート・ジャーナルにまで届き、同様の取引で何十億ドルもの動きが注目されています。
Kalshiはこれを通常のマーケットメイキング活動だと説明していますが、この議論が示している重要な点があります:
実際の活動と透明性が重要だということです。
だからこそ、私は依然としてPolymarketがこの分野で最も強い予測市場プラットフォームだと感じています。
実際の出来事。実際の意見。シンプルな市場。
Polymarketはこの領域で私の第一の選択です。
ベニは最近、同じ約$5,500の規模でETHの取引が繰り返されているのに気づき、Kalshiの暗号資産の活動について疑問を投げかけました。
その話は今やウォール・ストリート・ジャーナルにまで届き、同様の取引で何十億ドルもの動きが注目されています。
Kalshiはこれを通常のマーケットメイキング活動だと説明していますが、この議論が示している重要な点があります:
実際の活動と透明性が重要だということです。
だからこそ、私は依然としてPolymarketがこの分野で最も強い予測市場プラットフォームだと感じています。
実際の出来事。実際の意見。シンプルな市場。
Polymarketはこの領域で私の第一の選択です。
48
14
55
8.6k
トレンドは上昇中
価格はすでにブレイクして大きな蓄積ゾーンに到達
押し戻し(リトレース)はメイントレンドの一部です。
トレンドは上昇中
価格はすでにブレイクして大きな蓄積ゾーンに到達
押し戻し(リトレース)はメイントレンドの一部です。
価格はすでにブレイクして大きな蓄積ゾーンに到達
押し戻し(リトレース)はメイントレンドの一部です。
2
2
1.3k
良い市場アイデアでも、悪いプロップ取引(パーペトレード)になり得ます。
方向性については合っていても、鋭いウィックが1本刺されば、本当の値動きが始まる前にポジションがクローズされることがあります。
だから私は、$BTC、$ETH、そして$HYPE の一部のセットアップにはオプションを好みます。エントリー前に最大リスクが明確になっており、アップサイドは残ります。
Aevo Options Easy Modeなら、単に方向性・目標・時間軸を選んでから、確定する前に勝ち負けの見通しを確認するだけです。
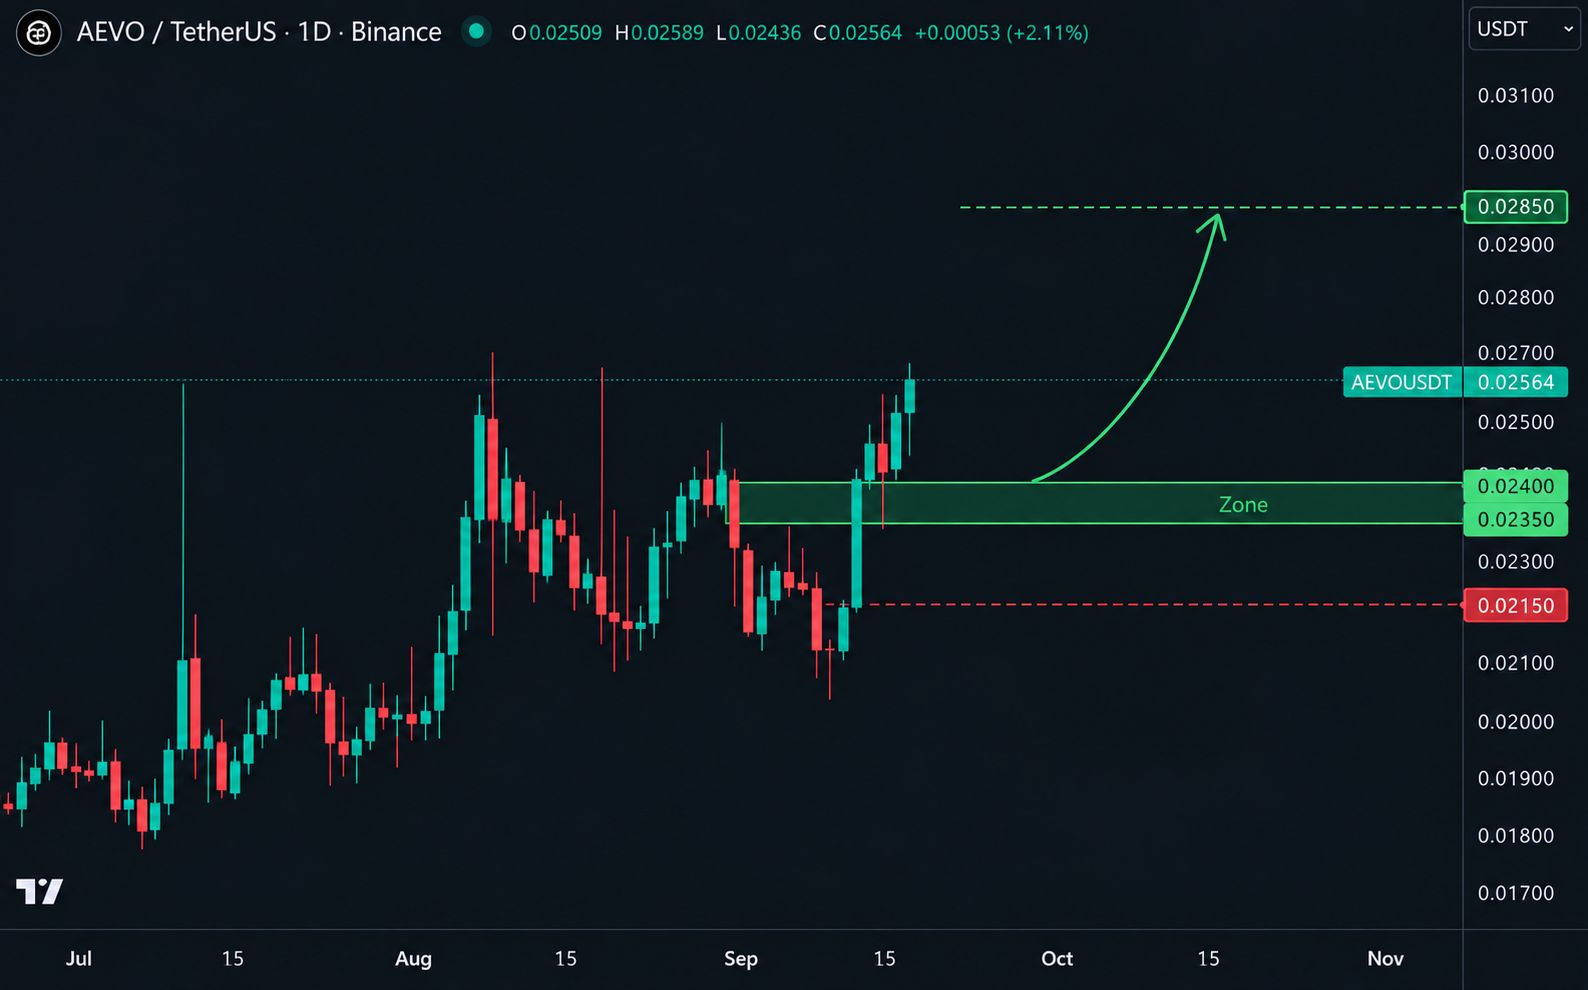
テクニカル的には、$AEVO は強い日次リカバリーの後、0.0235〜0.0240のゾーンの上で維持されています。このゾーンが維持される限り、短期の構造はポジティブです。
同じ市場見通し。リスク管理をよりコントロール。
@Aevoxyz で簡単なオプション。#Aevo $AEVO
良い市場アイデアでも、悪いプロップ取引(パーペトレード)になり得ます。
方向性については合っていても、鋭いウィックが1本刺されば、本当の値動きが始まる前にポジションがクローズされることがあります。
だから私は、$BTC、$ETH、そして$HYPE の一部のセットアップにはオプションを好みます。エントリー前に最大リスクが明確になっており、アップサイドは残ります。
Aevo Options Easy Modeなら、単に方向性・目標・時間軸を選んでから、確定する前に勝ち負けの見通しを確認するだけです。
テクニカル的には、$AEVO は強い日次リカバリーの後、0.0235〜0.0240のゾーンの上で維持されています。このゾーンが維持される限り、短期の構造はポジティブです。
同じ市場見通し。リスク管理をよりコントロール。
@Aevo で簡単なオプション。#Aevo $AEVO
方向性については合っていても、鋭いウィックが1本刺されば、本当の値動きが始まる前にポジションがクローズされることがあります。
だから私は、$BTC、$ETH、そして$HYPE の一部のセットアップにはオプションを好みます。エントリー前に最大リスクが明確になっており、アップサイドは残ります。
Aevo Options Easy Modeなら、単に方向性・目標・時間軸を選んでから、確定する前に勝ち負けの見通しを確認するだけです。
テクニカル的には、$AEVO は強い日次リカバリーの後、0.0235〜0.0240のゾーンの上で維持されています。このゾーンが維持される限り、短期の構造はポジティブです。
同じ市場見通し。リスク管理をよりコントロール。
@Aevo で簡単なオプション。#Aevo $AEVO
51
7
57
11.6k
本人確認中
バイナンスはステーブルコイン市場で長期的な動きを進めています。
同社はCircleに1億ドルを投資し、USDCのパートナーシップを5年間更新しました。これは単なる投資以上の意味があります。デジタル・ドルの将来に対する強い確信を示しています。
バイナンスはグローバルな流通網を提供し、CircleはUSDCのインフラを提供します。両者が協力することで、ステーブルコインをより有用にし、世界中でより利用しやすくできます。
デジタル・ドルは地理によって制限されるべきではありません。ステーブルコインは暗号資産の取引を超えて、主流の金融サービスの一部になりつつあります。
全文の発表:
[https://www.binance.com/en/blog/ecosystem/167890448134073062](https://www.binance.com/en/blog/ecosystem/167890448134073062)
バイナンスはステーブルコイン市場で長期的な動きを進めています。
同社はCircleに1億ドルを投資し、USDCのパートナーシップを5年間更新しました。これは単なる投資以上の意味があります。デジタル・ドルの将来に対する強い確信を示しています。
バイナンスはグローバルな流通網を提供し、CircleはUSDCのインフラを提供します。両者が協力することで、ステーブルコインをより有用にし、世界中でより利用しやすくできます。
デジタル・ドルは地理によって制限されるべきではありません。ステーブルコインは暗号資産の取引を超えて、主流の金融サービスの一部になりつつあります。
全文の発表:
https://www.binance.com/en/blog/ecosystem/167890448134073062
同社はCircleに1億ドルを投資し、USDCのパートナーシップを5年間更新しました。これは単なる投資以上の意味があります。デジタル・ドルの将来に対する強い確信を示しています。
バイナンスはグローバルな流通網を提供し、CircleはUSDCのインフラを提供します。両者が協力することで、ステーブルコインをより有用にし、世界中でより利用しやすくできます。
デジタル・ドルは地理によって制限されるべきではありません。ステーブルコインは暗号資産の取引を超えて、主流の金融サービスの一部になりつつあります。
全文の発表:
https://www.binance.com/en/blog/ecosystem/167890448134073062
4
861
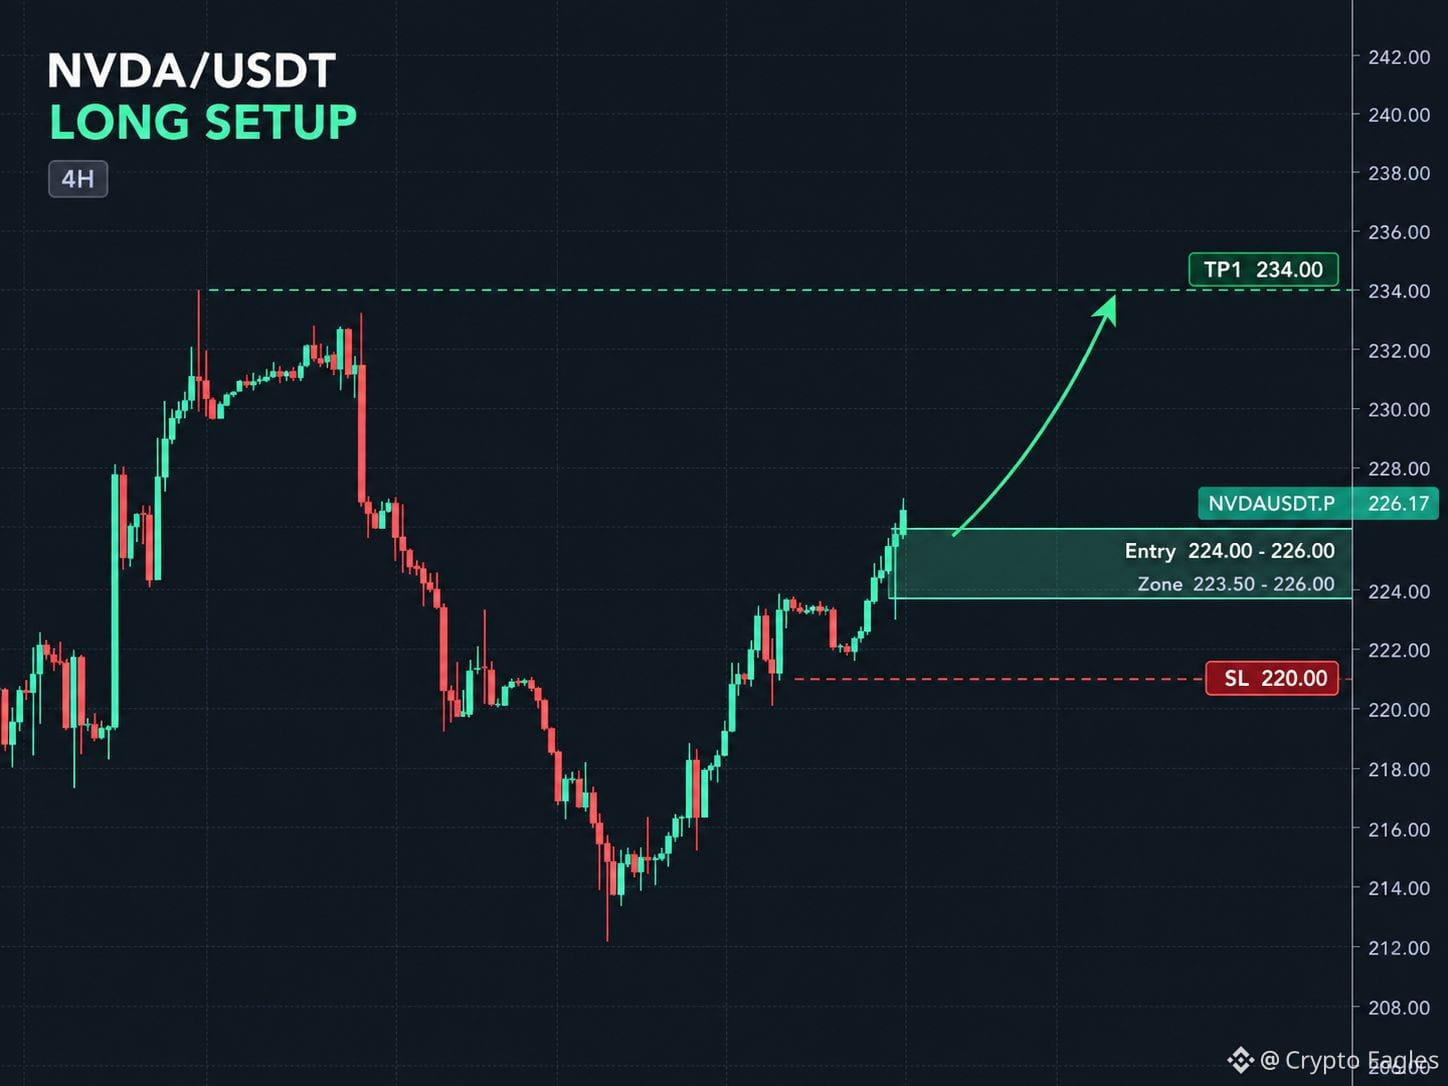
$NVDA ロング
価格は順調に回復しており、買い手の強さが見られます。
エントリー:224〜226
SL:220
TP:234
私は、価格がエントリーゾーンを維持し、234に向けてさらに上昇していくことを期待しています。
$NVDA ロング
価格は順調に回復しており、買い手の強さが見られます。
エントリー:224〜226
SL:220
TP:234
私は、価格がエントリーゾーンを維持し、234に向けてさらに上昇していくことを期待しています。
価格は順調に回復しており、買い手の強さが見られます。
エントリー:224〜226
SL:220
TP:234
私は、価格がエントリーゾーンを維持し、234に向けてさらに上昇していくことを期待しています。
4
1.7k
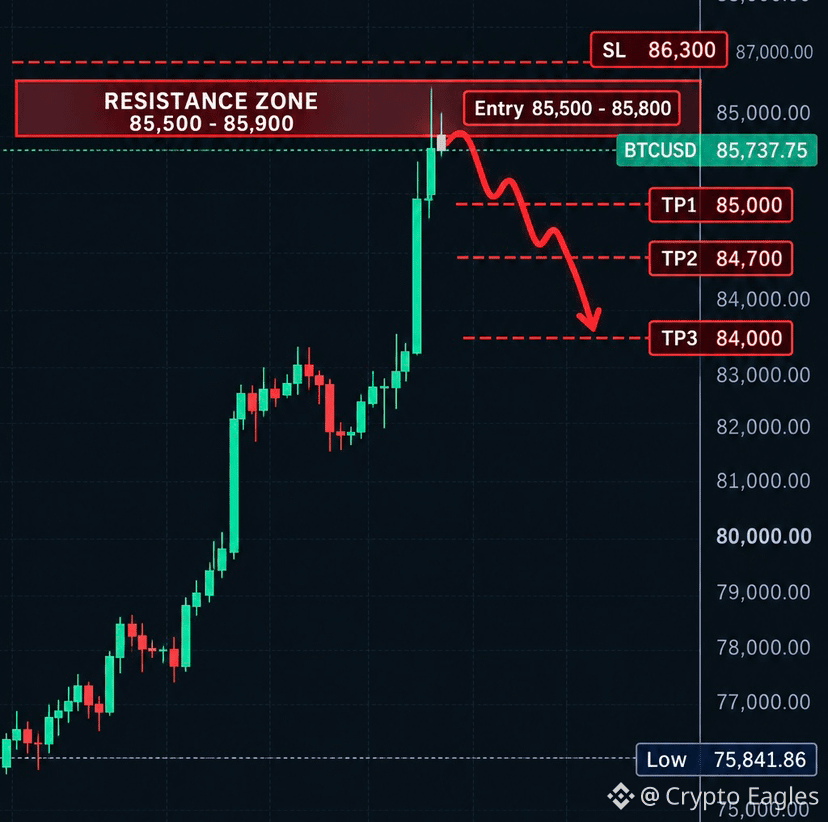
$BTC
{future}(BTCUSDT)
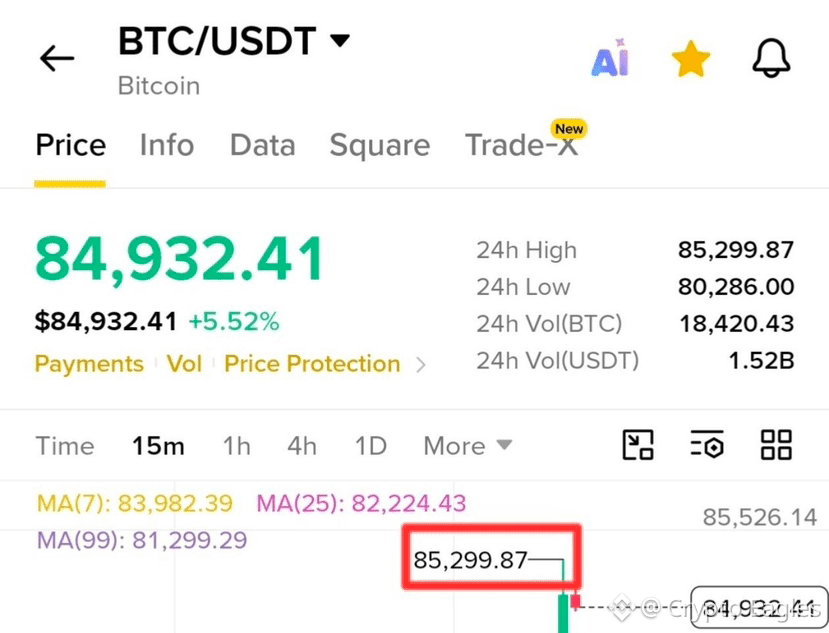
Entry 85800$
TP1: 85000$
TP2: 84700$
TP3: 84000$
SL: 86300$
$BTC
Entry 85800$
TP1: 85000$
TP2: 84700$
TP3: 84000$
SL: 86300$
Entry 85800$
TP1: 85000$
TP2: 84700$
TP3: 84000$
SL: 86300$
6
2k
こんにちは
BNBについてどう思いますか?
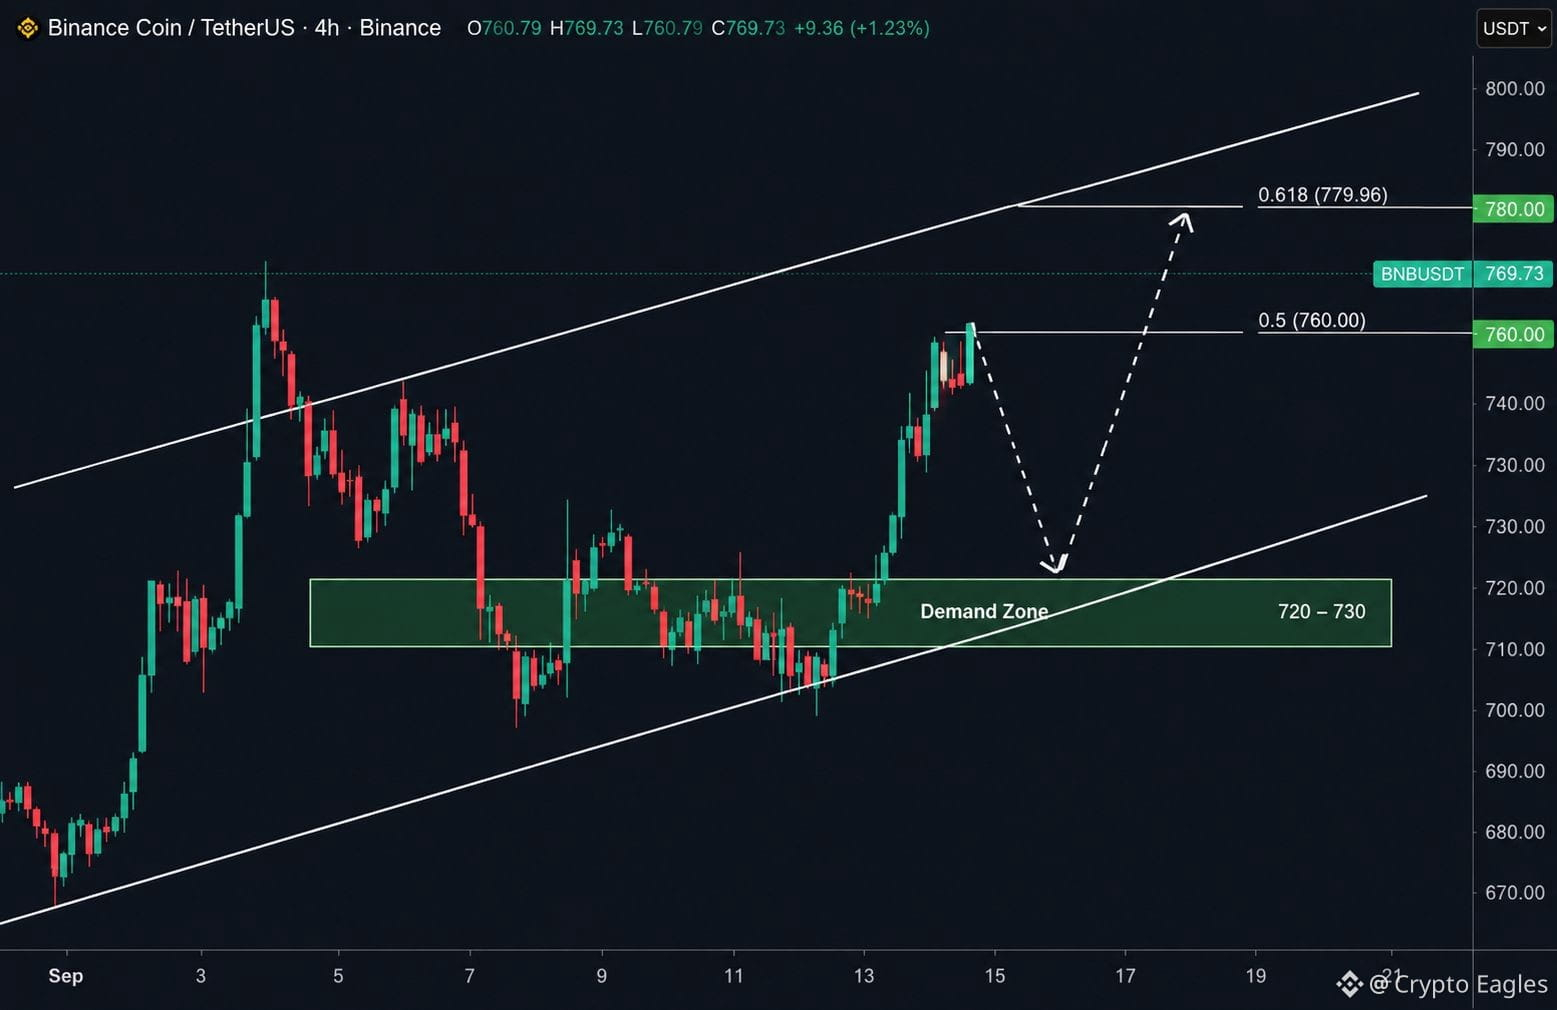
BNBは4Hチャート上で上昇チャネルの中を動いており、全体の構造は依然として強気に見えます。
最近、価格は$720–$730の需要ゾーンから強く反発し、$760のエリアを上回りました。これは買い手がまだ活発であることを示しています。
現時点でBNBは$780のレジスタンス水準に接近しており、これは0.618フィボナッチ・レベルとも一致しています。
ここからはまず小さな押し目が見られるかもしれません。価格が$720–$730の需要ゾーンに戻り、そこで支えられるなら、BNBはさらに上方向への別の動きを開始できる可能性があります。
主な上昇目標はおよそ$780です。BNBがこの水準を上抜ける場合、次に注目すべきエリアはチャネル上部付近の$800近辺です。
価格が$720–$730の上にとどまる限り、強気の見立ては有効です。
このサポートが崩れると、BNBはより深い調整を見せる可能性があります。
いまのところ、チャートはまず押し目の可能性、そしてサポートが維持されれば次の強気な動きを示しています。
$BNB
{future}(BNBUSDT)
こんにちは
BNBについてどう思いますか?
BNBは4Hチャート上で上昇チャネルの中を動いており、全体の構造は依然として強気に見えます。
最近、価格は$720–$730の需要ゾーンから強く反発し、$760のエリアを上回りました。これは買い手がまだ活発であることを示しています。
現時点でBNBは$780のレジスタンス水準に接近しており、これは0.618フィボナッチ・レベルとも一致しています。
ここからはまず小さな押し目が見られるかもしれません。価格が$720–$730の需要ゾーンに戻り、そこで支えられるなら、BNBはさらに上方向への別の動きを開始できる可能性があります。
主な上昇目標はおよそ$780です。BNBがこの水準を上抜ける場合、次に注目すべきエリアはチャネル上部付近の$800近辺です。
価格が$720–$730の上にとどまる限り、強気の見立ては有効です。
このサポートが崩れると、BNBはより深い調整を見せる可能性があります。
いまのところ、チャートはまず押し目の可能性、そしてサポートが維持されれば次の強気な動きを示しています。
$BNB
BNBについてどう思いますか?
BNBは4Hチャート上で上昇チャネルの中を動いており、全体の構造は依然として強気に見えます。
最近、価格は$720–$730の需要ゾーンから強く反発し、$760のエリアを上回りました。これは買い手がまだ活発であることを示しています。
現時点でBNBは$780のレジスタンス水準に接近しており、これは0.618フィボナッチ・レベルとも一致しています。
ここからはまず小さな押し目が見られるかもしれません。価格が$720–$730の需要ゾーンに戻り、そこで支えられるなら、BNBはさらに上方向への別の動きを開始できる可能性があります。
主な上昇目標はおよそ$780です。BNBがこの水準を上抜ける場合、次に注目すべきエリアはチャネル上部付近の$800近辺です。
価格が$720–$730の上にとどまる限り、強気の見立ては有効です。
このサポートが崩れると、BNBはより深い調整を見せる可能性があります。
いまのところ、チャートはまず押し目の可能性、そしてサポートが維持されれば次の強気な動きを示しています。
$BNB
31
24
3.6k
PolymarketはWeb3でより人気になりつつあります。
暗号資産、AI、政治、スポーツ、そして経済で「次に起こると思うこと」を人々が取引できるようにします。
この概要では、月間アクティブトレーダーが25万人から50万人、月間のWebサイト訪問が1700万回以上とされています。
$GNO は、より広い予測市場セクターの中でもBinanceに上場しているトークンでもあります。
私は@polymarket が好きです。現実世界の出来事を、理解しやすいシンプルな市場に変えてくれるからです。
予測市場への注目が高まってきており、Polymarketは私が特に注視しているプラットフォームの1つです。
DYOR.
PolymarketはWeb3でより人気になりつつあります。
暗号資産、AI、政治、スポーツ、そして経済で「次に起こると思うこと」を人々が取引できるようにします。
この概要では、月間アクティブトレーダーが25万人から50万人、月間のWebサイト訪問が1700万回以上とされています。
$GNO は、より広い予測市場セクターの中でもBinanceに上場しているトークンでもあります。
私は@Polymarket が好きです。現実世界の出来事を、理解しやすいシンプルな市場に変えてくれるからです。
予測市場への注目が高まってきており、Polymarketは私が特に注視しているプラットフォームの1つです。
DYOR.
暗号資産、AI、政治、スポーツ、そして経済で「次に起こると思うこと」を人々が取引できるようにします。
この概要では、月間アクティブトレーダーが25万人から50万人、月間のWebサイト訪問が1700万回以上とされています。
$GNO は、より広い予測市場セクターの中でもBinanceに上場しているトークンでもあります。
私は@Polymarket が好きです。現実世界の出来事を、理解しやすいシンプルな市場に変えてくれるからです。
予測市場への注目が高まってきており、Polymarketは私が特に注視しているプラットフォームの1つです。
DYOR.
36
10
35
9.1k
·
--
ブリッシュ
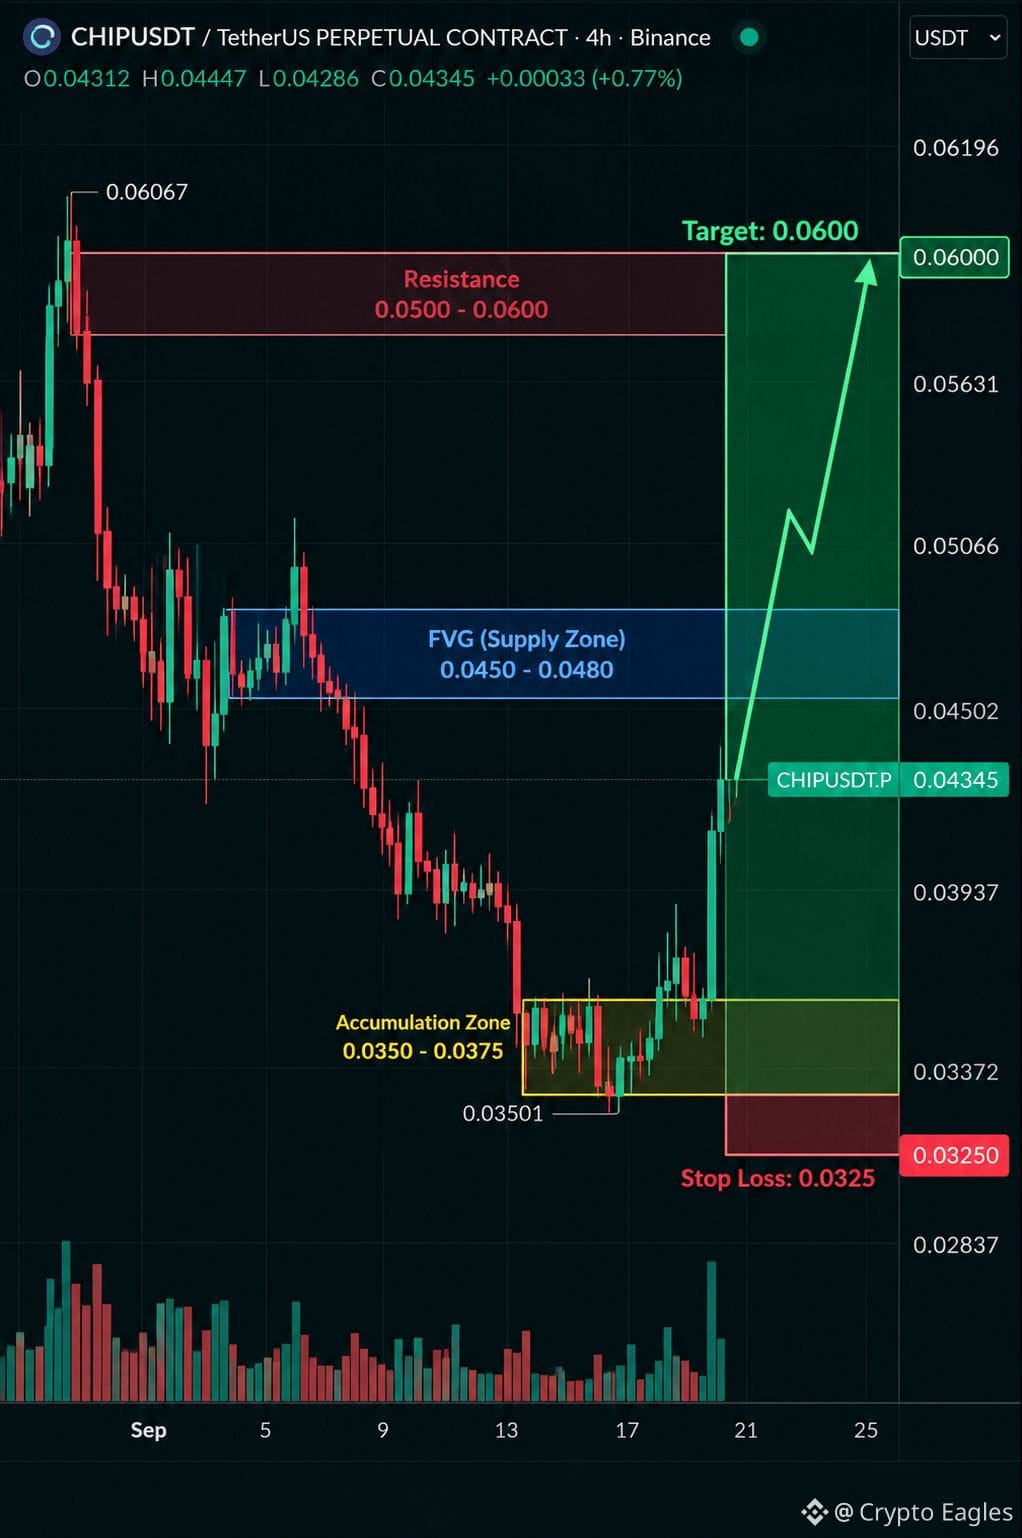
$CHIP ロング・セットアップ
エントリー:0.0430 – 0.0450
SL:0.0325
TP1:0.0500
TP2:0.0550
TP3:0.0600
CHIPは0.0350–0.0375の蓄積ゾーンから力強く反発し、0.0450–0.0480のFVG(供給)エリアへ押し上げられました。このゾーンを明確にブレイクして維持できれば、まず0.0500、続いて0.0550–0.0600への道が開ける可能性があります。
強気の構造は、価格が蓄積地域より上にとどまっている限り有効です。0.0325を下回る動きは、このセットアップを無効にします。
{future}(CHIPUSDT)
$ONE
{future}(ONEUSDT)
$G
{future}(GUSDT)
$CHIP ロング・セットアップ
エントリー:0.0430 – 0.0450
SL:0.0325
TP1:0.0500
TP2:0.0550
TP3:0.0600
CHIPは0.0350–0.0375の蓄積ゾーンから力強く反発し、0.0450–0.0480のFVG(供給)エリアへ押し上げられました。このゾーンを明確にブレイクして維持できれば、まず0.0500、続いて0.0550–0.0600への道が開ける可能性があります。
強気の構造は、価格が蓄積地域より上にとどまっている限り有効です。0.0325を下回る動きは、このセットアップを無効にします。
$ONE
$G
エントリー:0.0430 – 0.0450
SL:0.0325
TP1:0.0500
TP2:0.0550
TP3:0.0600
CHIPは0.0350–0.0375の蓄積ゾーンから力強く反発し、0.0450–0.0480のFVG(供給)エリアへ押し上げられました。このゾーンを明確にブレイクして維持できれば、まず0.0500、続いて0.0550–0.0600への道が開ける可能性があります。
強気の構造は、価格が蓄積地域より上にとどまっている限り有効です。0.0325を下回る動きは、このセットアップを無効にします。
$ONE
$G
6
2k
·
--
ブリッシュ
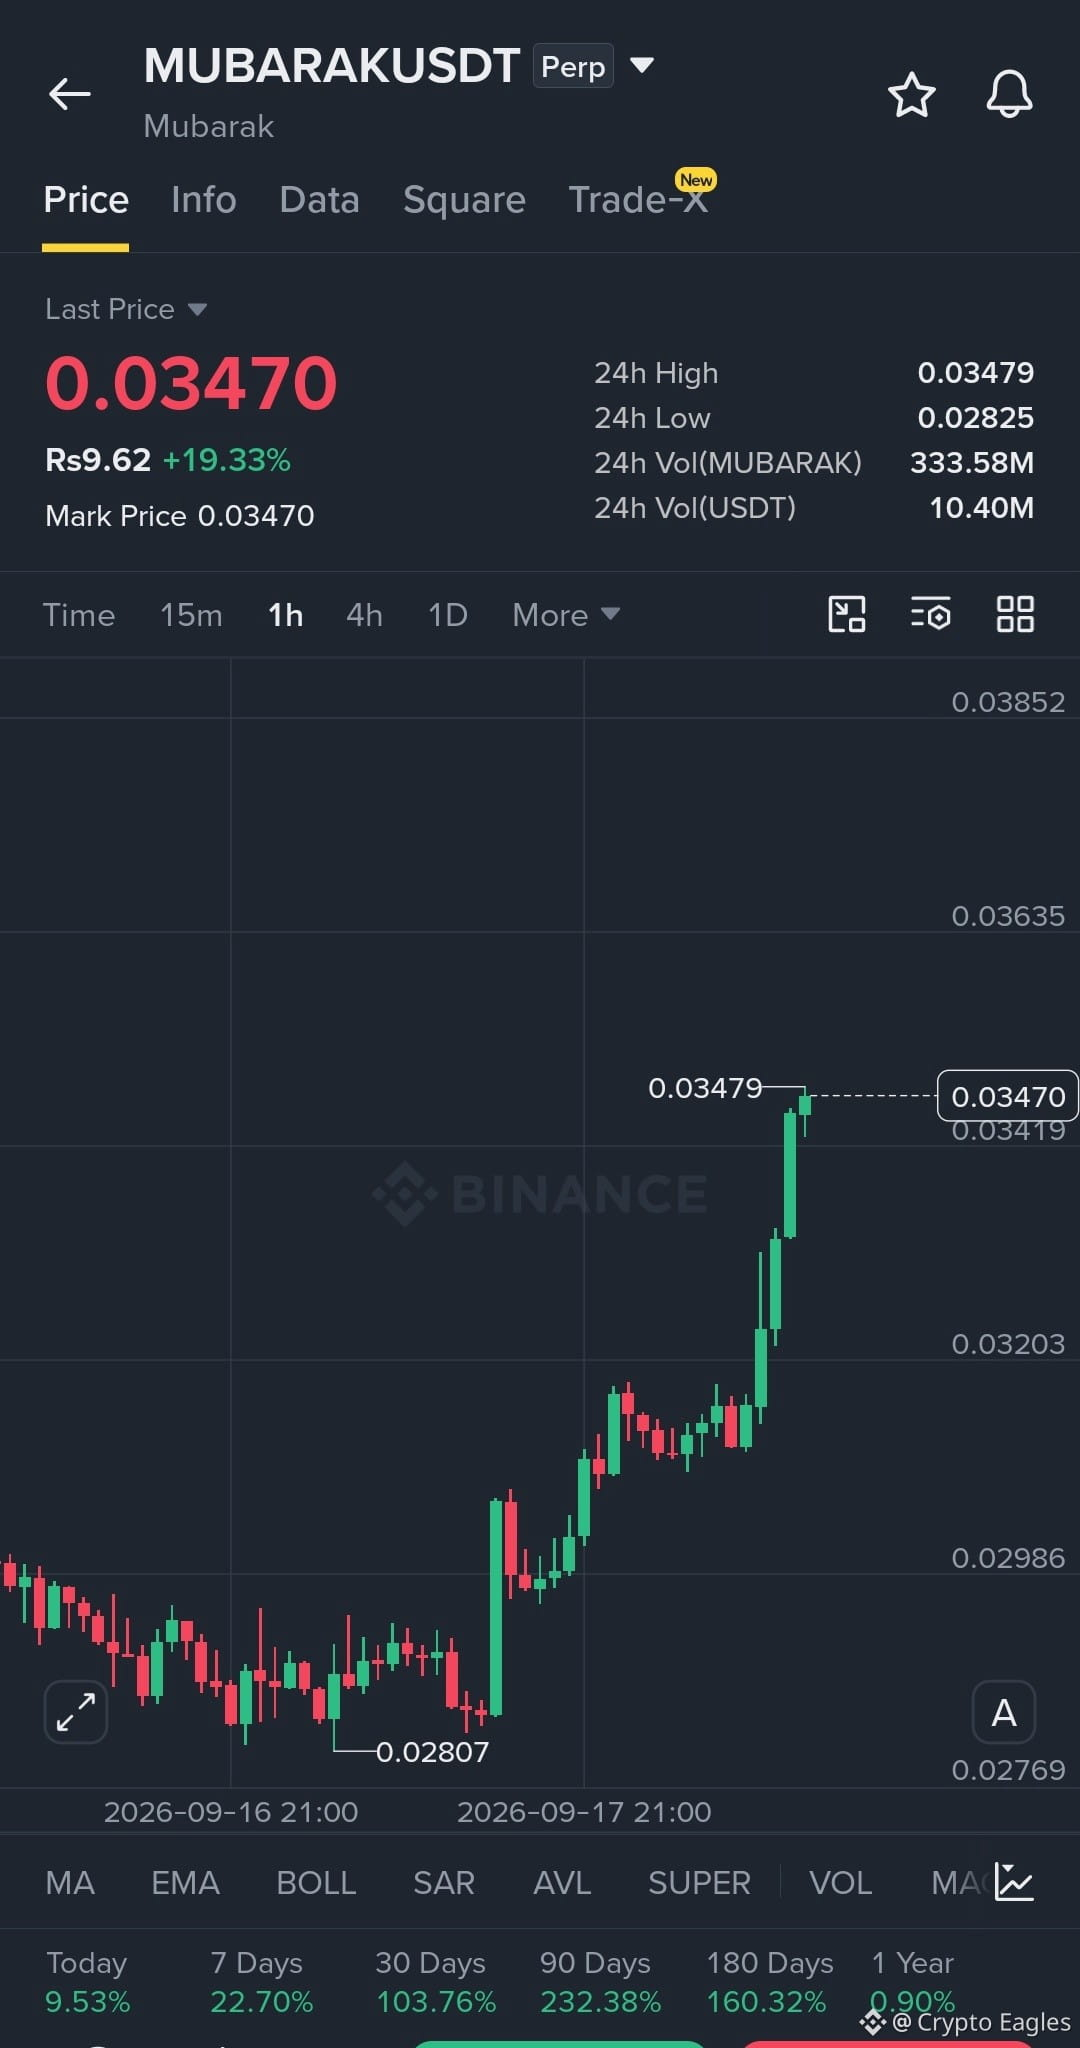
$MUBARAK LONG SETUP
エントリー: 0.03380 – 0.03450
ストップロス: 0.03200
TP1: 0.03635
TP2: 0.03850
TP3: 0.04100
MUBARAKは強い1Hの強気拡大を示しており、0.02807の基準から0.03479の高値へ向けて急激に上昇しています。ポイントは、この急な値動きの後に、0.0338~0.0342のブレイクアウトエリアを維持できるかどうかです。
確認: 0.0342を上回って維持し、0.03479をブレイク。
無効化: 0.03200を下回る状態が継続。
{future}(MUBARAKUSDT)
$ONE
{future}(ONEUSDT)
$G
{future}(GUSDT)
$MUBARAK LONG SETUP
エントリー: 0.03380 – 0.03450
ストップロス: 0.03200
TP1: 0.03635
TP2: 0.03850
TP3: 0.04100
MUBARAKは強い1Hの強気拡大を示しており、0.02807の基準から0.03479の高値へ向けて急激に上昇しています。ポイントは、この急な値動きの後に、0.0338~0.0342のブレイクアウトエリアを維持できるかどうかです。
確認: 0.0342を上回って維持し、0.03479をブレイク。
無効化: 0.03200を下回る状態が継続。
$ONE
$G
エントリー: 0.03380 – 0.03450
ストップロス: 0.03200
TP1: 0.03635
TP2: 0.03850
TP3: 0.04100
MUBARAKは強い1Hの強気拡大を示しており、0.02807の基準から0.03479の高値へ向けて急激に上昇しています。ポイントは、この急な値動きの後に、0.0338~0.0342のブレイクアウトエリアを維持できるかどうかです。
確認: 0.0342を上回って維持し、0.03479をブレイク。
無効化: 0.03200を下回る状態が継続。
$ONE
$G
1
1
3
1.3k
·
--
ブリッシュ
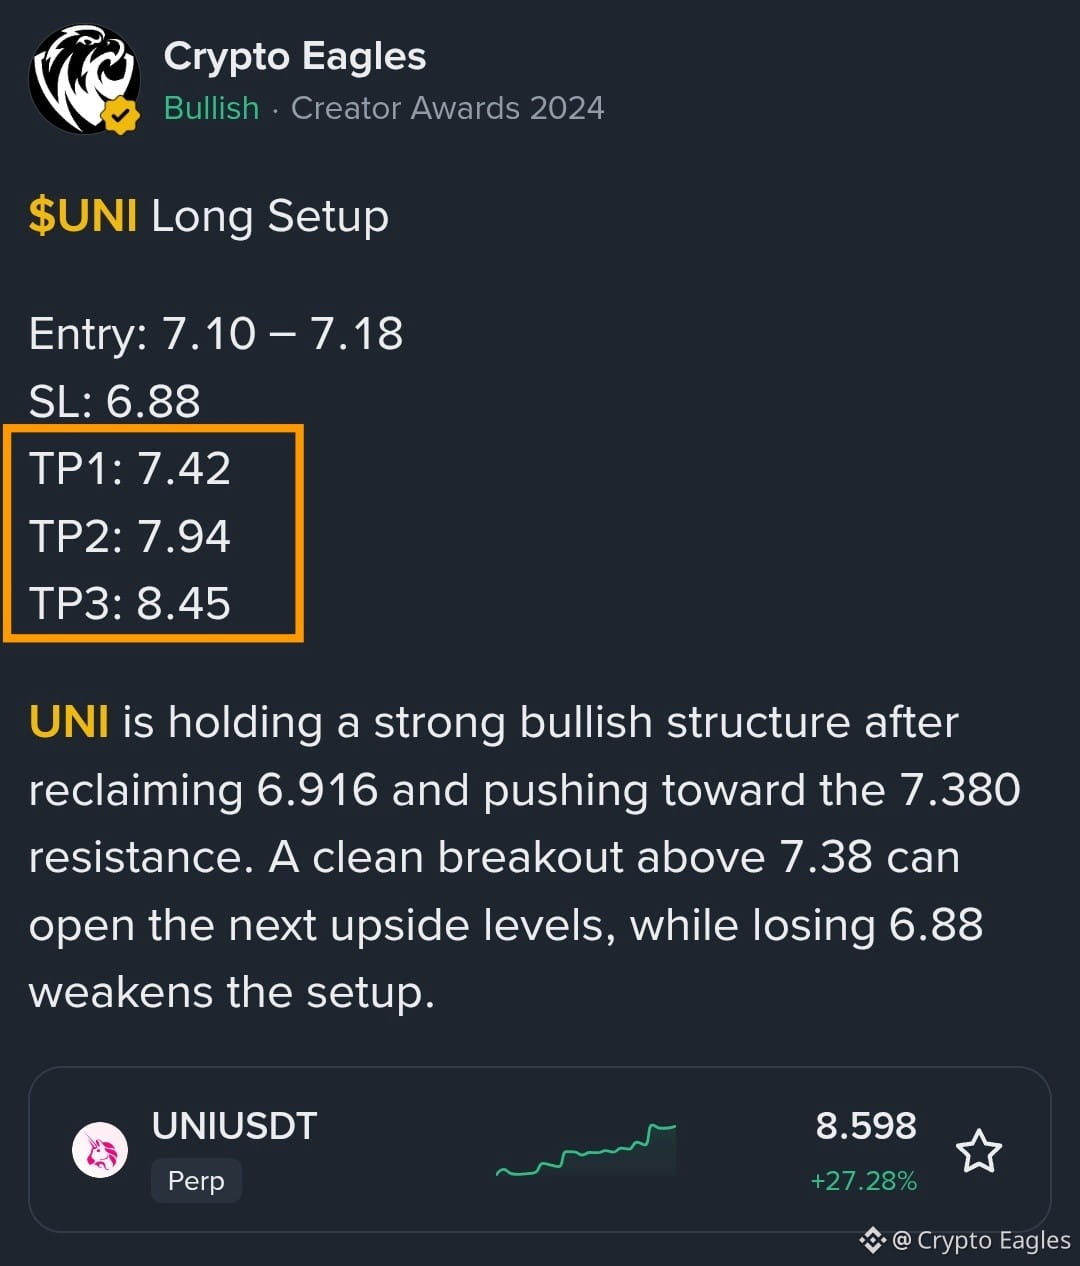
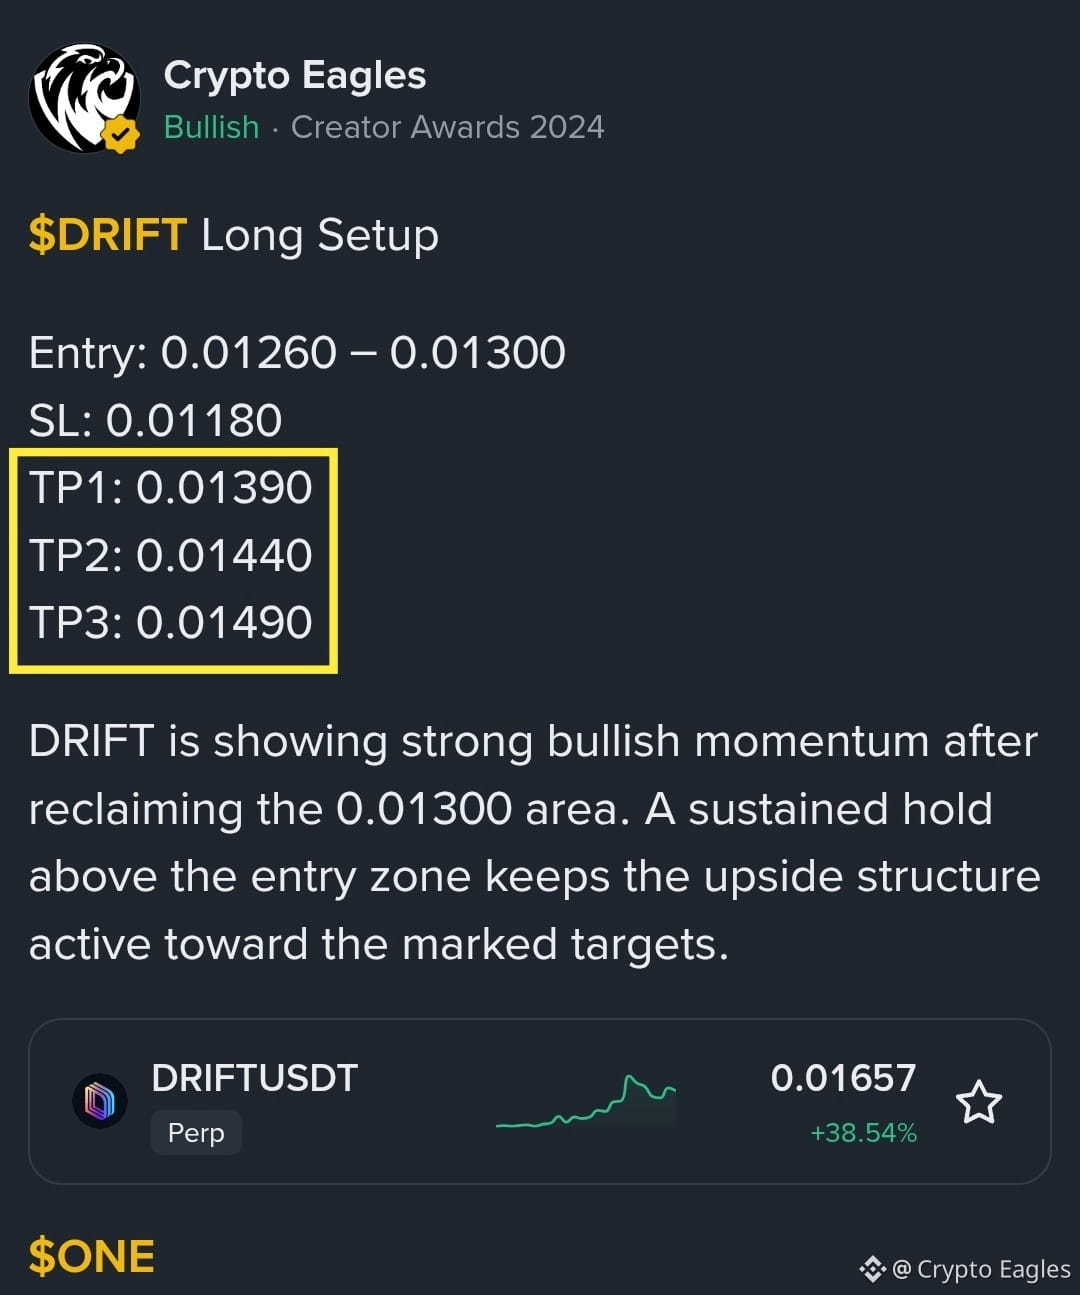
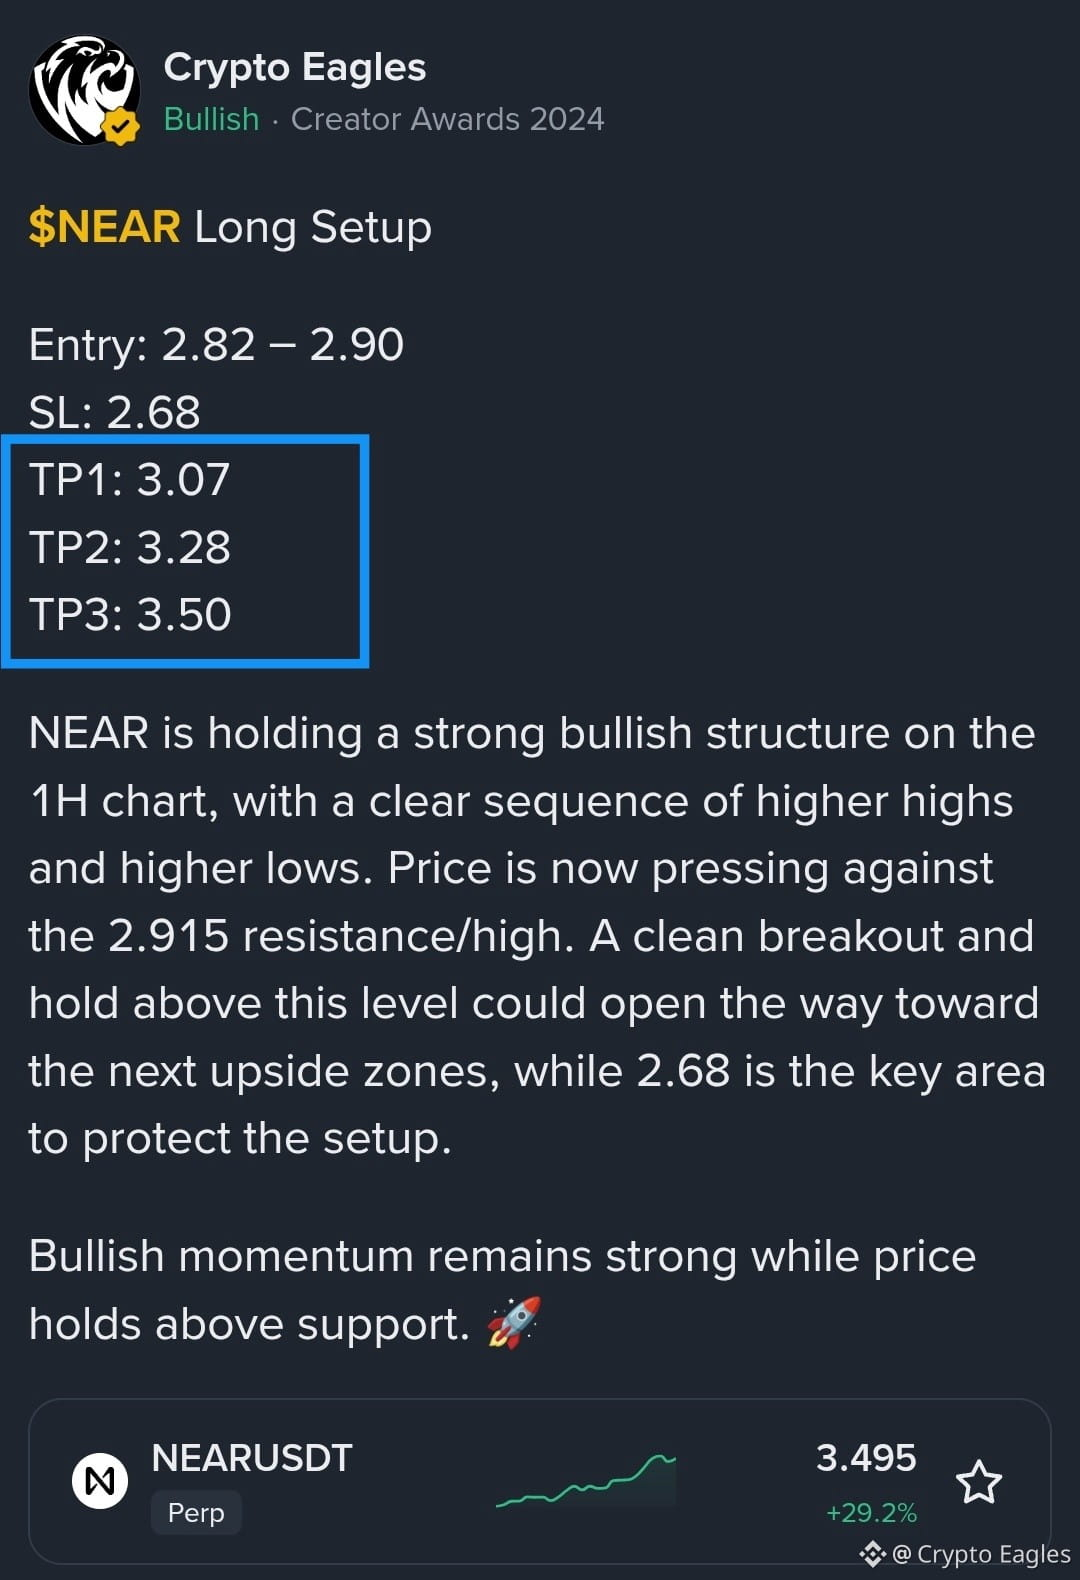
$G $NEAR $UNI 全目標達成おめでとうございます
{future}(UNIUSDT)
{future}(NEARUSDT)
{future}(GUSDT)
$G $NEAR $UNI 全目標達成おめでとうございます
3
913
·
--
ブリッシュ
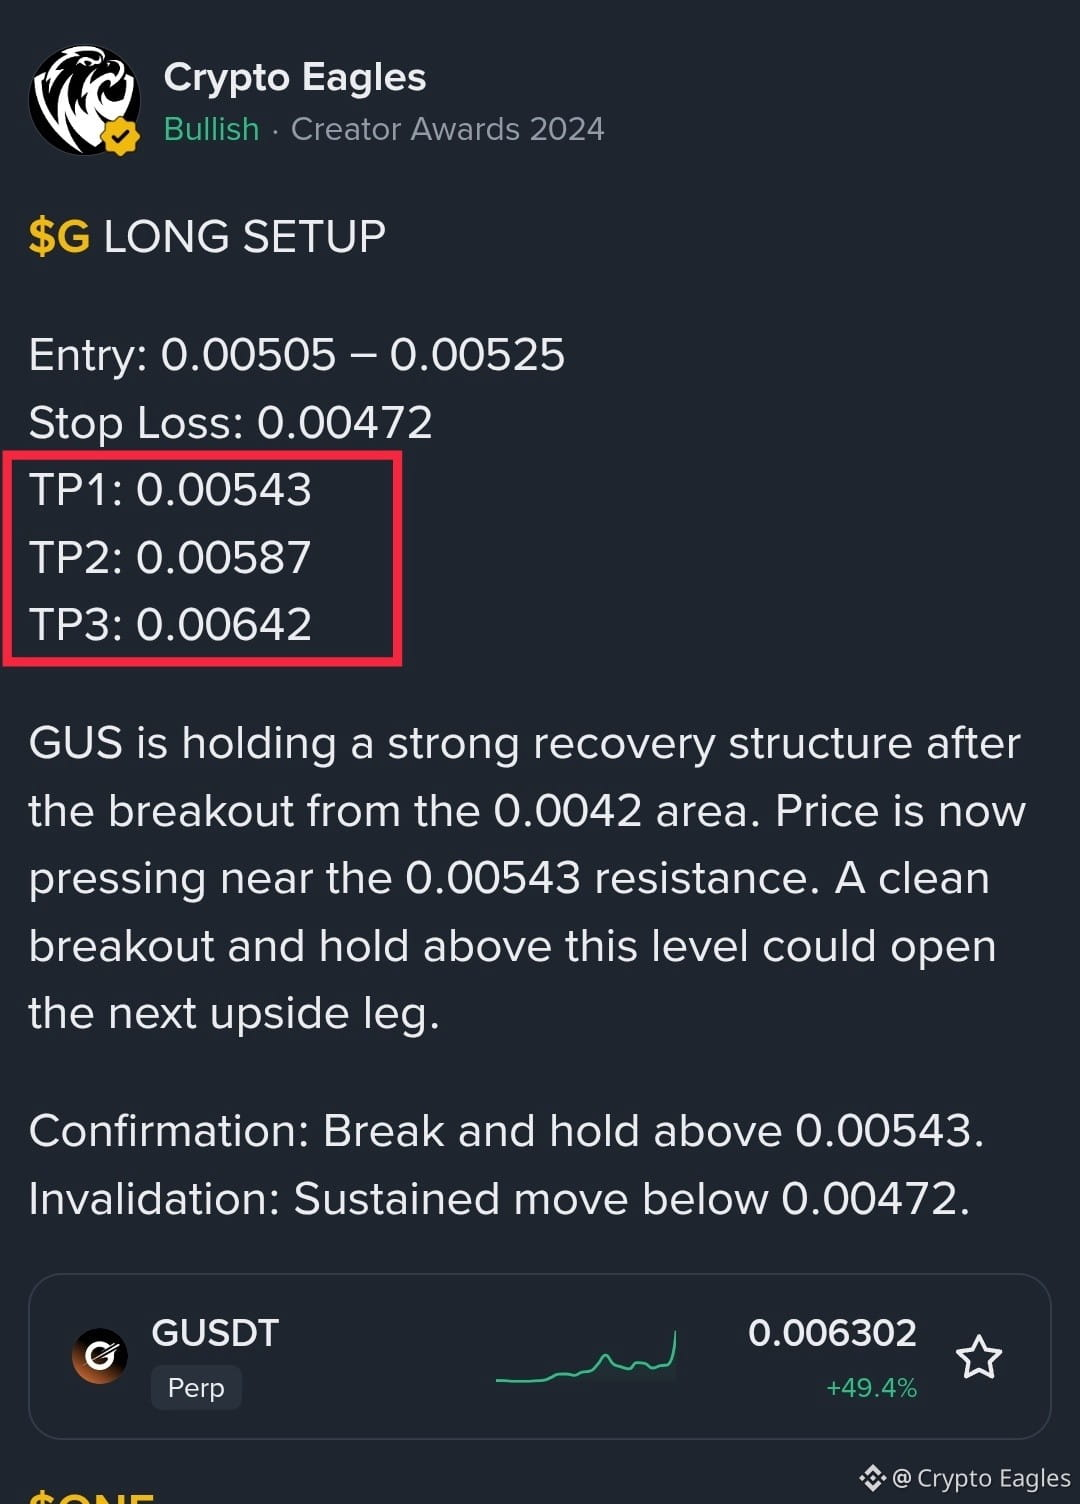
$G LONG SETUP
エントリー:0.00505 ~ 0.00525
ストップロス:0.00472
TP1:0.00543
TP2:0.00587
TP3:0.00642
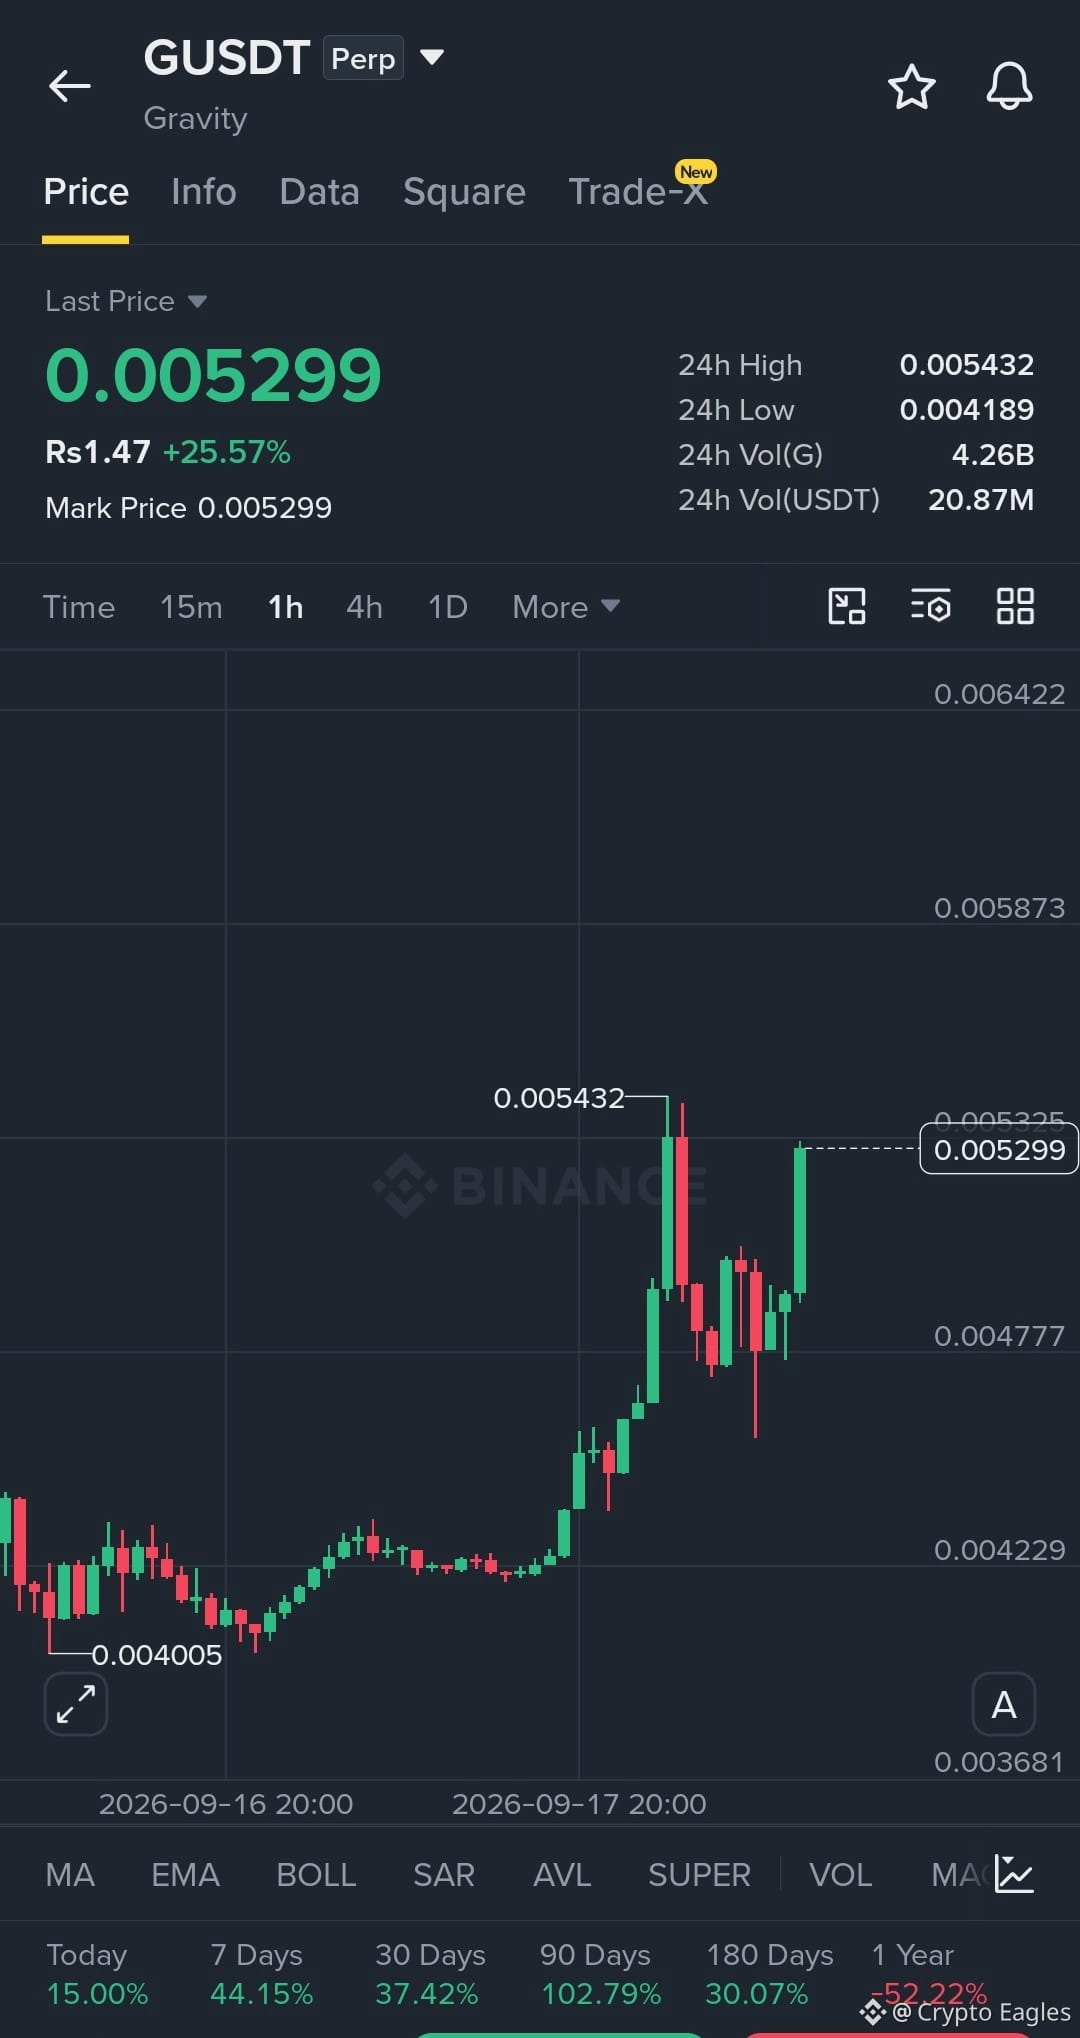
GUSは0.0042のエリアからのブレイク後、強いリカバリー構造を維持しています。現在は0.00543のレジスタンス付近を押し進めています。この水準を明確にブレイクして維持できれば、次の上方向への波が開く可能性があります。
確認:0.00543を上抜けて維持。
無効化:0.00472を下回る状態が継続。
{future}(GUSDT)
$ONE
{future}(ONEUSDT)
$TRUMP
{future}(TRUMPUSDT)
$G LONG SETUP
エントリー:0.00505 ~ 0.00525
ストップロス:0.00472
TP1:0.00543
TP2:0.00587
TP3:0.00642
GUSは0.0042のエリアからのブレイク後、強いリカバリー構造を維持しています。現在は0.00543のレジスタンス付近を押し進めています。この水準を明確にブレイクして維持できれば、次の上方向への波が開く可能性があります。
確認:0.00543を上抜けて維持。
無効化:0.00472を下回る状態が継続。
$ONE
$TRUMP
エントリー:0.00505 ~ 0.00525
ストップロス:0.00472
TP1:0.00543
TP2:0.00587
TP3:0.00642
GUSは0.0042のエリアからのブレイク後、強いリカバリー構造を維持しています。現在は0.00543のレジスタンス付近を押し進めています。この水準を明確にブレイクして維持できれば、次の上方向への波が開く可能性があります。
確認:0.00543を上抜けて維持。
無効化:0.00472を下回る状態が継続。
$ONE
$TRUMP
2
1.3k
ログインして、さらにコンテンツを読む
厳選トピックで世界の暗号資産トレーダーの仲間入り
⚡️ 暗号資産に関する最新かつ有益な情報が見つかります。
💬 世界最大の暗号資産取引所から信頼されています。
👍 認証を受けたクリエイターから、有益なインサイトを得られます。
メール / 電話番号
トレンドトピック
SECHaltsCryptoETFReviewsAmidFundingLapse
閲覧回数 31,987
454人が討論中
#SECHaltsCryptoETFReviewsAmidFundingLapse
米国の予算空白を受け、SECが暗号資産ETFの見直しを凍結
米国証券取引委員会(SEC)は、暗号資産を基にした上場投資信託(ETF)に関する新たな申請の審査・承認プロセスを一時的に停止しました。この措置は、連邦予算が米議会によって期限までに承認されなかったことにより資金が途絶(funding lapse)し、非必須職員が休職(ライセンス取得)となった後、新しい米会計年度の開始とともに発効します。
対象となる措置:何が止まり、何が続くのか?
予算配分不足による危機対応計画の適用により、当局の運用ダイナミクスが変わりました:
新規ETF申請の一時停止:フォーム19b-4およびS-1/N-1Aに基づき進行中の案件は凍結されています。SECは、停止期間中は有効性に関する声明やコメントレターを発行しません。
90件超の申請が影響:承認待ちの90件以上の金融商品(複数のデジタル・アセットや複合戦略に関する提案を含む)が、審査スケジュールを止められています。
既存のETFは引き続き稼働:事前に承認され、取引所に上場しているビットコインおよびイーサリアムの現物ETF(ブラックロックのIBITやフィデリティのFBTCなど)は、二次市場で通常どおり売買が続いています。
今後注視すべきステップ
SECの分析再開は、米国議会における政治的な決着に左右されます。継続決議(Continuing Resolution)または最終予算が承認され次第、SECは通常業務を再開し、提出順に積み上がった申請を処理します。
$BTC
$ETH
$ZEC
Joseph RRG S7
·いいね:1件
·閲覧回数 930
ZcashETFPostsFirstWeeklyOutflow$93.6M
閲覧回数 60,902
192人が討論中
GreekPoliceBustCryptoScamRingArrest17
閲覧回数 195,550
1,411人が討論中