

HolderStat
167 投稿

HolderStat
報告
ユーザーをブロック
Telegram for more ideas: https://t.me/holderstat
0 フォロー
1 フォロワー
11 いいね
投稿
·
--
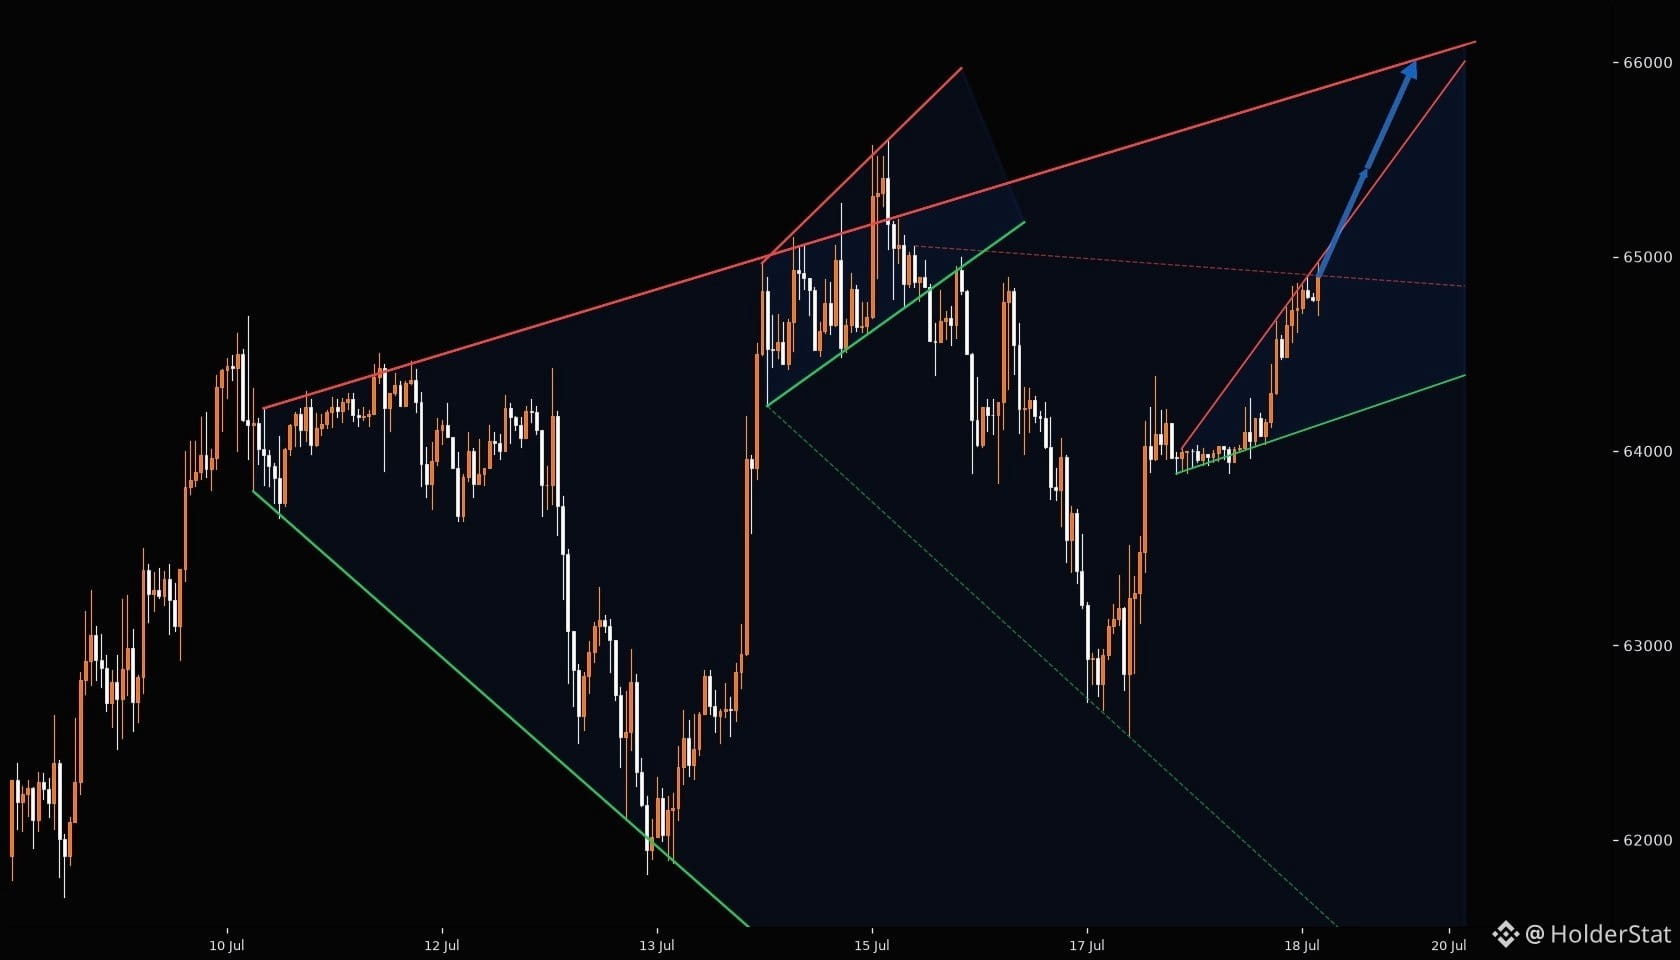
🟢 BTCUSDT 30m – ウェッジ・ブレイクアウト ローディング 📍 価格: $64,895 ⚡ 設定: 12.0の建設スコアを持つ大きな上昇ウェッジ — レジスタンスに8回、サポートに6回のタッチ。 価格が頂点(アペックス)に向けて収束している。 🔺 パターン: 強気のウェッジ目標は $65,988 付近へ向かって投影される。 検出されたパターン4件、平均評価9.75。 🔑 レジスタンス: $66,090 ゾーン(8タッチのトレンドライン) 🛡️ サポート: $64,390 に最も近いサポートゾーン(6タッチ)— その下では、次の重要水準 $63,884。 🚨 リクイディティ・トラップ: $64,390 を下抜けたように見せる(フェイク)ブレイクは、その前にショート勢を罠にかけ、より高値への上昇(リップ)の前触れになり得る。 🎯 目標: $65,988 🚨 無効化: $64,390 を下回る終値 ⏳ プラン: サポートを再テストする局面でロング。ストップは $64,300 未満。 確認のため、$65,000 を上回る強い終値に注目すること。
🟢 BTCUSDT 30m – ウェッジ・ブレイクアウト ローディング 📍 価格: $64,895 ⚡ 設定: 12.0の建設スコアを持つ大きな上昇ウェッジ — レジスタンスに8回、サポートに6回のタッチ。 価格が頂点(アペックス)に向けて収束している。 🔺 パターン: 強気のウェッジ目標は $65,988 付近へ向かって投影される。 検出されたパターン4件、平均評価9.75。 🔑 レジスタンス: $66,090 ゾーン(8タッチのトレンドライン) 🛡️ サポート: $64,390 に最も近いサポートゾーン(6タッチ)— その下では、次の重要水準 $63,884。 🚨 リクイディティ・トラップ: $64,390 を下抜けたように見せる(フェイク)ブレイクは、その前にショート勢を罠にかけ、より高値への上昇(リップ)の前触れになり得る。 🎯 目標: $65,988 🚨 無効化: $64,390 を下回る終値 ⏳ プラン: サポートを再テストする局面でロング。ストップは $64,300 未満。 確認のため、$65,000 を上回る強い終値に注目すること。
55
·
--
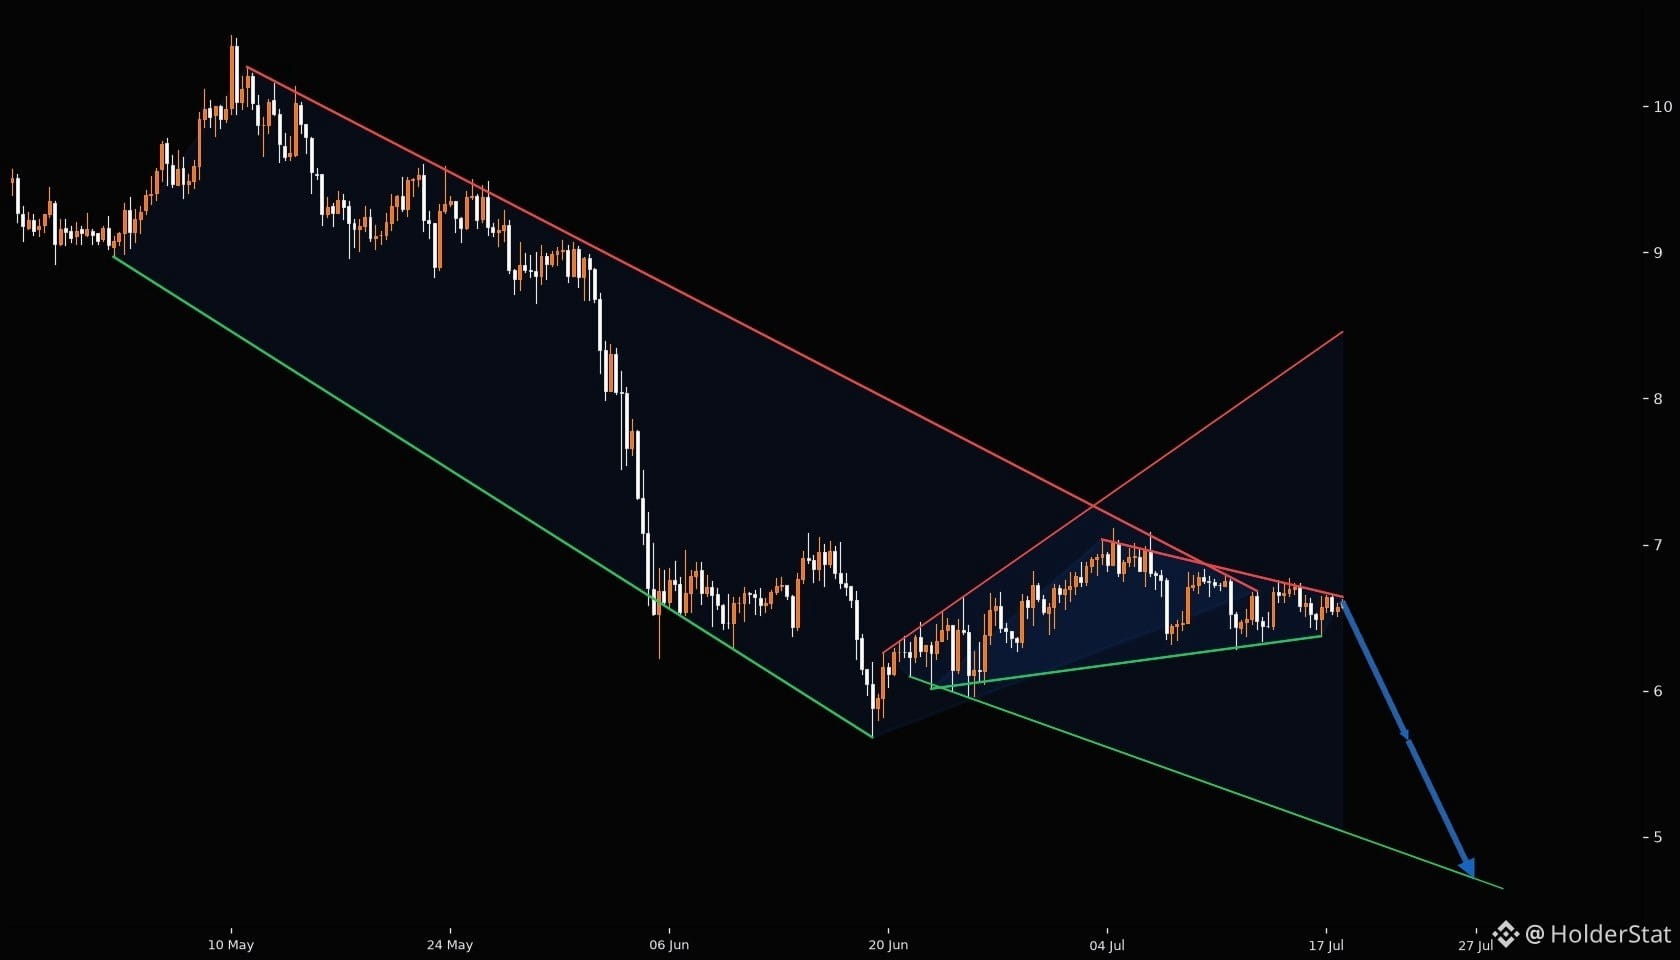
⚡ AVAXUSDT 4H – 下降ウェッジの弱気ブレイクダウン 📍 価格: $6.611 🔺 パターン: 大きな下降ウェッジ(234本足)– サポートに7回タッチ、レジスタンスに16回タッチ。スコア16。価格がウェッジのサポートを下回ってブレイクしています。 🛡️ サポート: $5.681(強い、7回タッチ、ブレイク0) 🔑 レジスタンス: $6.683(16回タッチ、1回ブレイク – 最も近いレジスタンス・ゾーン) 🚨 リクイディティ・トラップ: 価格は$6.683のレジスタンスから何度も拒否(複数回)されています。上側の流動性はおそらく刈り取られる可能性。 🎯 ターゲット: $5.773(ウェッジ投影) 🚨 無効条件: $6.683を上回ってクローズすると弱気見通しは無効。 ⏳ プラン: $6.60〜6.68を再テストする場面でショート、ストップは$6.70上、ターゲットは$5.77。リスクはタイトに。
⚡ AVAXUSDT 4H – 下降ウェッジの弱気ブレイクダウン 📍 価格: $6.611 🔺 パターン: 大きな下降ウェッジ(234本足)– サポートに7回タッチ、レジスタンスに16回タッチ。スコア16。価格がウェッジのサポートを下回ってブレイクしています。 🛡️ サポート: $5.681(強い、7回タッチ、ブレイク0) 🔑 レジスタンス: $6.683(16回タッチ、1回ブレイク – 最も近いレジスタンス・ゾーン) 🚨 リクイディティ・トラップ: 価格は$6.683のレジスタンスから何度も拒否(複数回)されています。上側の流動性はおそらく刈り取られる可能性。 🎯 ターゲット: $5.773(ウェッジ投影) 🚨 無効条件: $6.683を上回ってクローズすると弱気見通しは無効。 ⏳ プラン: $6.60〜6.68を再テストする場面でショート、ストップは$6.70上、ターゲットは$5.77。リスクはタイトに。
77
·
--
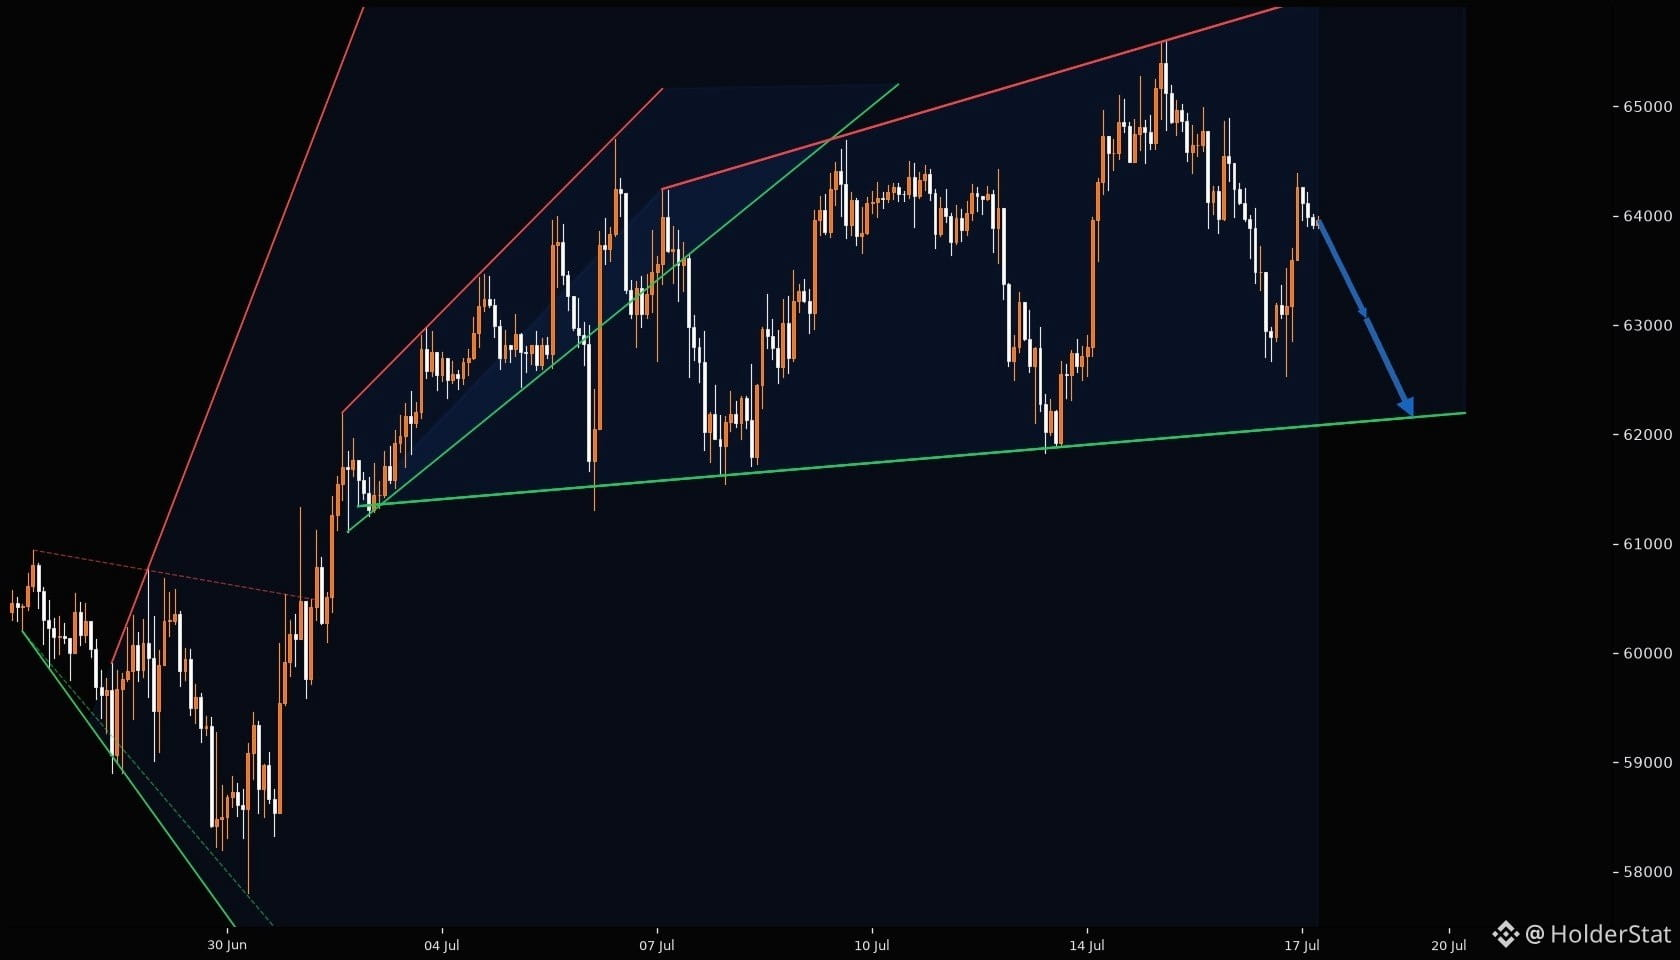
⚡ BTC/USDT – 1H 強気のウェッジブレイクアウト 準備中 📍 価格: $63,960 🔺 パターン: 大型の上昇ウェッジ(151本)– てっぺんに向けて収束 🛡️ サポート: $62,194(8回タッチのトレンドライン、267本の強さ) 🔑 レジスタンス: $65,600(ウェッジ上部レール、7回タッチのライン) 🎯 ターゲット: $65,600 🚨 無効化条件: $62,194 を下回るブレイクダウン ⏳ プラン: $SPX のサポートゾーンから反発し、8回のきれいなタッチ。ウェッジの圧縮は上方向の決着を後押し。$64,300 を上抜けるとブレイクアウトが確定。ターゲットは $65,600 のレジスタンスライン上に位置。動きの前に、$62,000 未満で流動性トラップがないか注意。 姿勢: 強気
⚡ BTC/USDT – 1H 強気のウェッジブレイクアウト 準備中 📍 価格: $63,960 🔺 パターン: 大型の上昇ウェッジ(151本)– てっぺんに向けて収束 🛡️ サポート: $62,194(8回タッチのトレンドライン、267本の強さ) 🔑 レジスタンス: $65,600(ウェッジ上部レール、7回タッチのライン) 🎯 ターゲット: $65,600 🚨 無効化条件: $62,194 を下回るブレイクダウン ⏳ プラン: $SPX のサポートゾーンから反発し、8回のきれいなタッチ。ウェッジの圧縮は上方向の決着を後押し。$64,300 を上抜けるとブレイクアウトが確定。ターゲットは $65,600 のレジスタンスライン上に位置。動きの前に、$62,000 未満で流動性トラップがないか注意。 姿勢: 強気
55
·
--
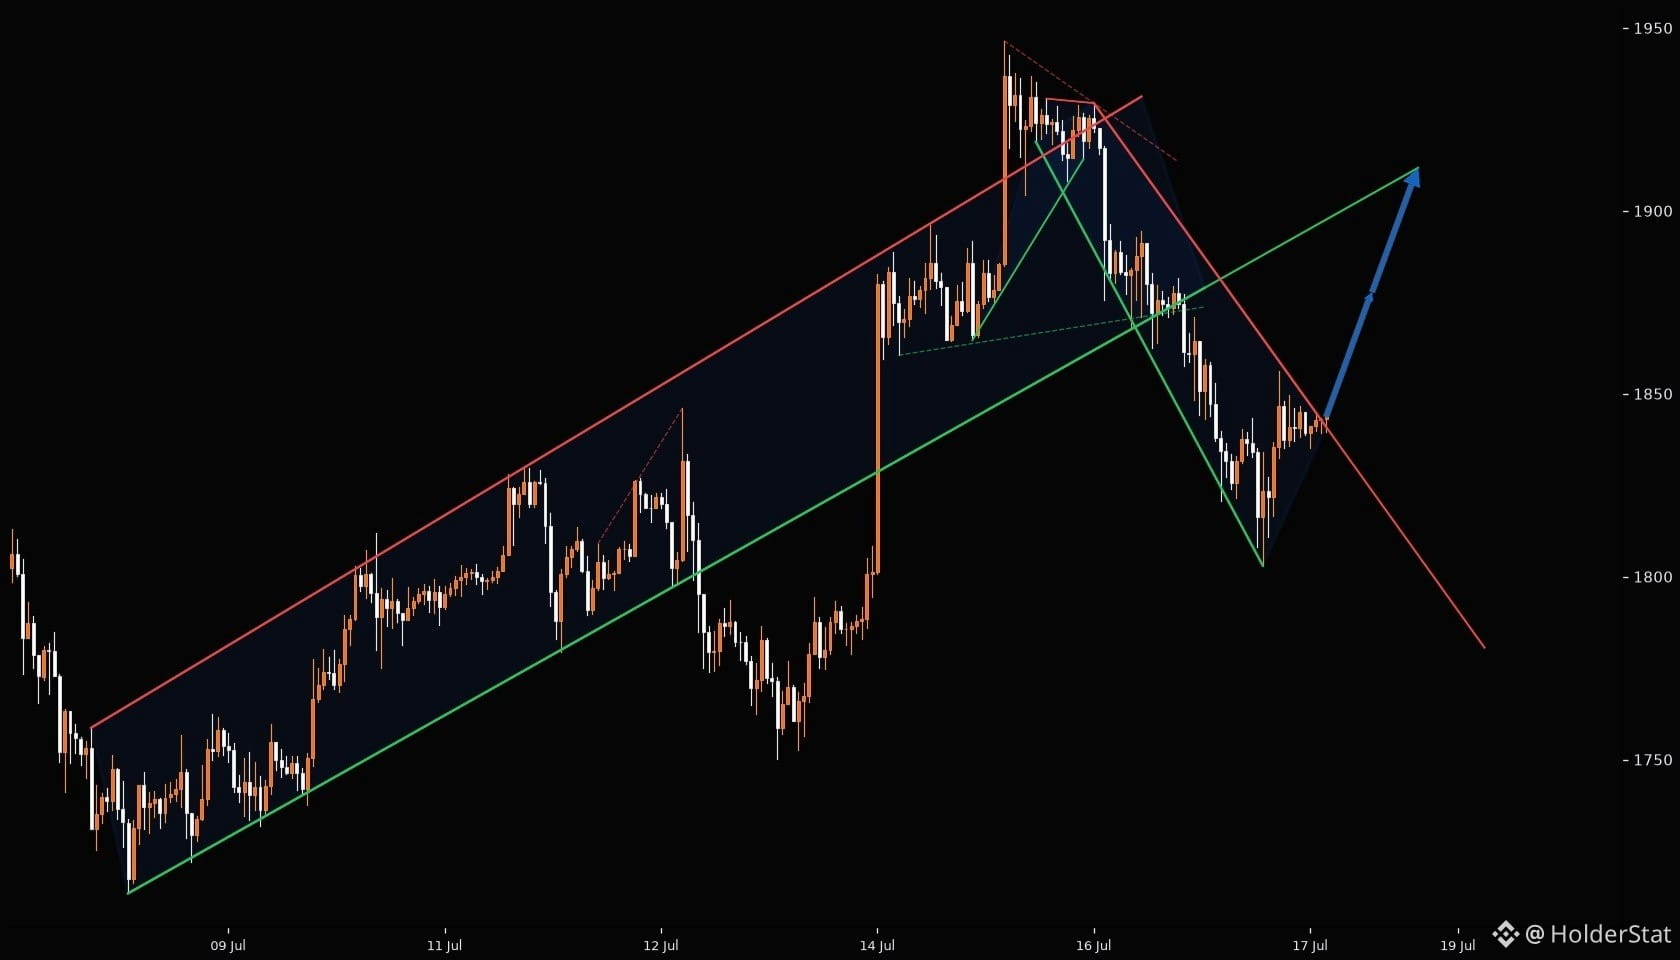
⚡ $ETH 30M: WEDGE PRESSURE IS BUILDING ⚠️ Ethereumは意思決定ゾーンの近くでコイル状になっています。チャートは締め付けられており、まさにここが流動性トラップが形成され始める典型的なポイントです。 📍 現在の構造:価格は最新のローカル・ベース付近で反応しています。買い手にはまだサポートがありますが、「クリーン」と呼べるには確認が必要です。 🔺 パターン読み:30Mで圧縮が進行しています。より大きな構造の中にできる小さなウエッジは、真の値動きの前に急なフェイクアウトを引き起こすことがあります。 🔑 注目すべきレジスタンス:いちばん近いマークされたクラスターが最初のテストです。出来高が付いてこない場合、そこを素早く上抜けると遅れて入った買い手を罠にかける可能性があります。 🛡️ 下のサポート:守られているゾーンが維持されるなら、上方向の圧力が強まることがあります。もし崩れると、市場はより深い流動性のポケットを素早く狙いにいくかもしれません。 🎯 メインプラン:ウエッジの解消(ブレイク/収束解除)を待ちます。取引はノイズの中ではなく、マークされた水準付近での反応の中にあります。 ⏳ 我慢しましょう。ブレイクアウトか拒否(リジェクション)の最初のシグナルが出るまで待つ。最初の足を追いかける必要はありません。 $ETH #ETH 価格分析
⚡ $ETH 30M: WEDGE PRESSURE IS BUILDING ⚠️ Ethereumは意思決定ゾーンの近くでコイル状になっています。チャートは締め付けられており、まさにここが流動性トラップが形成され始める典型的なポイントです。 📍 現在の構造:価格は最新のローカル・ベース付近で反応しています。買い手にはまだサポートがありますが、「クリーン」と呼べるには確認が必要です。 🔺 パターン読み:30Mで圧縮が進行しています。より大きな構造の中にできる小さなウエッジは、真の値動きの前に急なフェイクアウトを引き起こすことがあります。 🔑 注目すべきレジスタンス:いちばん近いマークされたクラスターが最初のテストです。出来高が付いてこない場合、そこを素早く上抜けると遅れて入った買い手を罠にかける可能性があります。 🛡️ 下のサポート:守られているゾーンが維持されるなら、上方向の圧力が強まることがあります。もし崩れると、市場はより深い流動性のポケットを素早く狙いにいくかもしれません。 🎯 メインプラン:ウエッジの解消(ブレイク/収束解除)を待ちます。取引はノイズの中ではなく、マークされた水準付近での反応の中にあります。 ⏳ 我慢しましょう。ブレイクアウトか拒否(リジェクション)の最初のシグナルが出るまで待つ。最初の足を追いかける必要はありません。 $ETH #ETH 価格分析
74
·
--
⚡ BTC/USDT 1H — 強気でなくショート優勢 📍 価格: 63,482 🔺 パターン: 267本の上昇サポートからのウェッジ崩れ。複数回のタッチの後、下側のトレンドラインを切り抜け—流動性トラップが確定。 🔑 レジスタンス: 64,300 ゾーン(最も近いレジスタンスの塊) | 64,700(主要) 🛡️ サポート: 62,146(構造的サポート) | 61,882(強い転換ゾーン) 🎯 標的: 62,565 🚨 無効化: ボリュームを伴い64,300を上回った場合 ⏳ 計画: 破られたサポートゾーンより下で推移。63,700-64,000の再テストはショートのエントリー機会。第1段の目標は62,565。失敗した場合、次のサポートは61,882。トレンドは弱まっており—モメンタムは下方向を支持しています。
⚡ BTC/USDT 1H — 強気でなくショート優勢 📍 価格: 63,482 🔺 パターン: 267本の上昇サポートからのウェッジ崩れ。複数回のタッチの後、下側のトレンドラインを切り抜け—流動性トラップが確定。 🔑 レジスタンス: 64,300 ゾーン(最も近いレジスタンスの塊) | 64,700(主要) 🛡️ サポート: 62,146(構造的サポート) | 61,882(強い転換ゾーン) 🎯 標的: 62,565 🚨 無効化: ボリュームを伴い64,300を上回った場合 ⏳ 計画: 破られたサポートゾーンより下で推移。63,700-64,000の再テストはショートのエントリー機会。第1段の目標は62,565。失敗した場合、次のサポートは61,882。トレンドは弱まっており—モメンタムは下方向を支持しています。
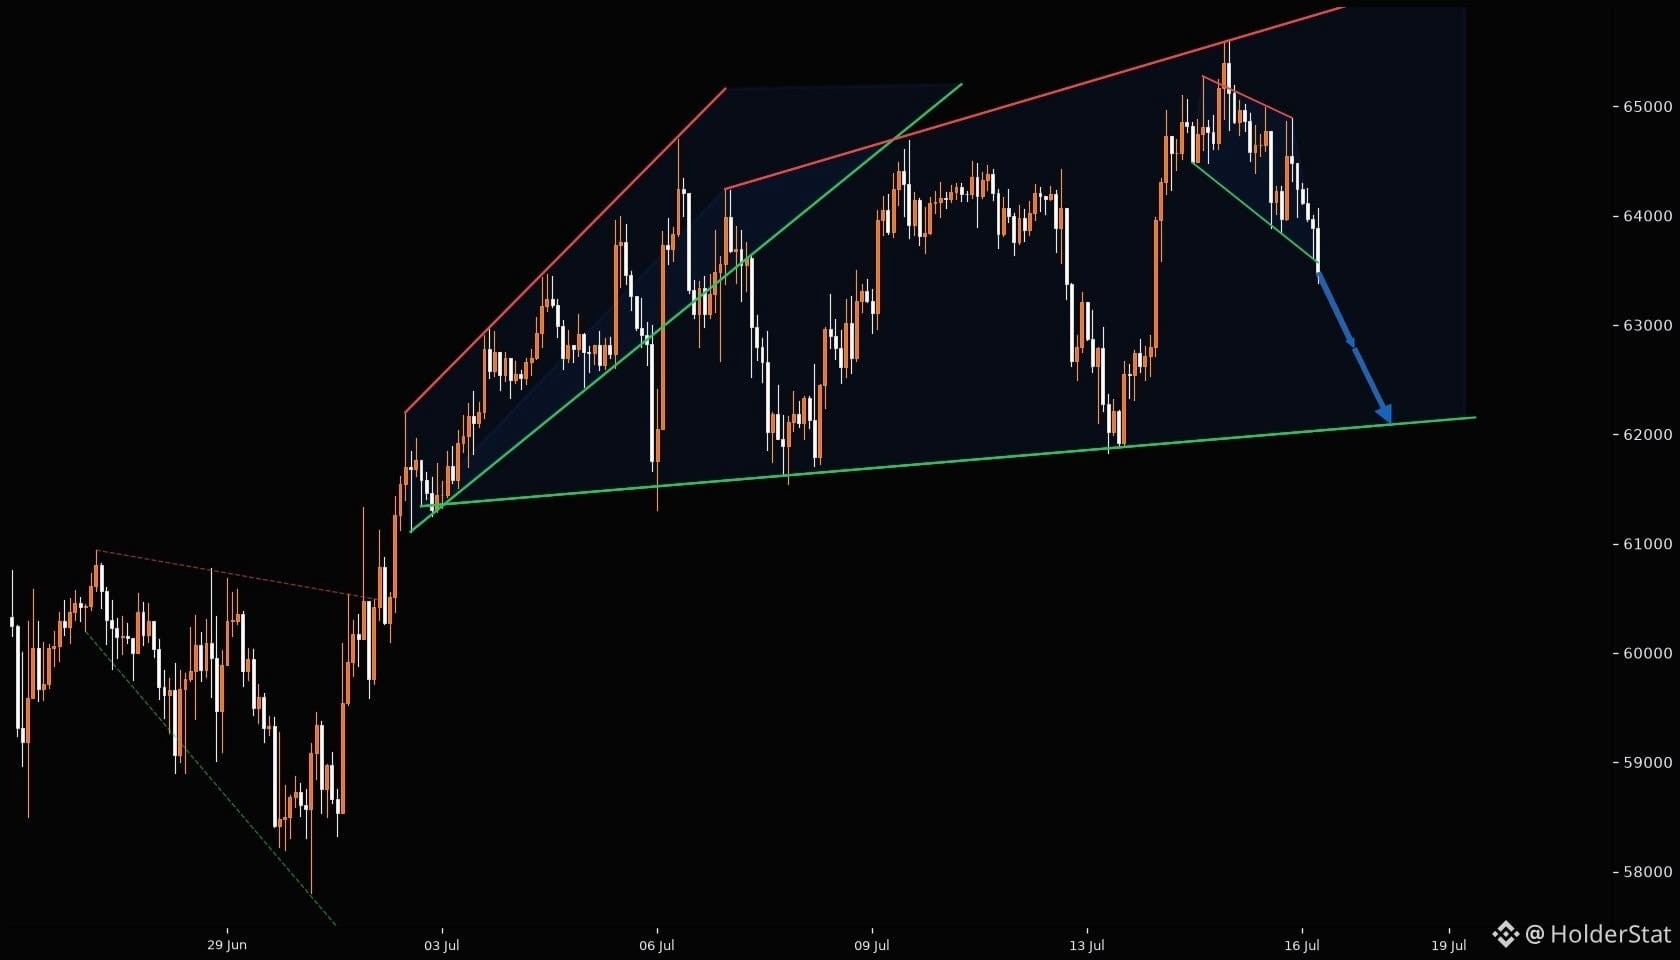
51
·
--
⚡ 設定: AVAXUSDT – 4H ベアリッシュ・ウェッジ崩れ 📍 価格: $6.519 🔺 パターン: 大型下降ウェッジ – 234本足の重なり、レジスタンスで16回タッチ。価格はウェッジ支持線の$5.68を下抜けし、現在は崩れた構造の裏側をリテスト中。 🔑 レジスタンス: $6.48 – $6.68(ウェッジ抵抗ゾーン、16回タッチライン+$6.68の二次抵抗) 🛡️ サポート: $6.34 – $6.39(複数のピボットラインからの最寄りサポートゾーン)。主要サポートは$5.68(ウェッジ底)。 ⚡ 設定: ホールド失敗の後、価格は主要なレジスタンストレンドラインの下にあります。ウェッジ崩れは、測定した下方向の値動きを目標としています。流動性トラップの可能性もありますが
⚡ 設定: AVAXUSDT – 4H ベアリッシュ・ウェッジ崩れ 📍 価格: $6.519 🔺 パターン: 大型下降ウェッジ – 234本足の重なり、レジスタンスで16回タッチ。価格はウェッジ支持線の$5.68を下抜けし、現在は崩れた構造の裏側をリテスト中。 🔑 レジスタンス: $6.48 – $6.68(ウェッジ抵抗ゾーン、16回タッチライン+$6.68の二次抵抗) 🛡️ サポート: $6.34 – $6.39(複数のピボットラインからの最寄りサポートゾーン)。主要サポートは$5.68(ウェッジ底)。 ⚡ 設定: ホールド失敗の後、価格は主要なレジスタンストレンドラインの下にあります。ウェッジ崩れは、測定した下方向の値動きを目標としています。流動性トラップの可能性もありますが
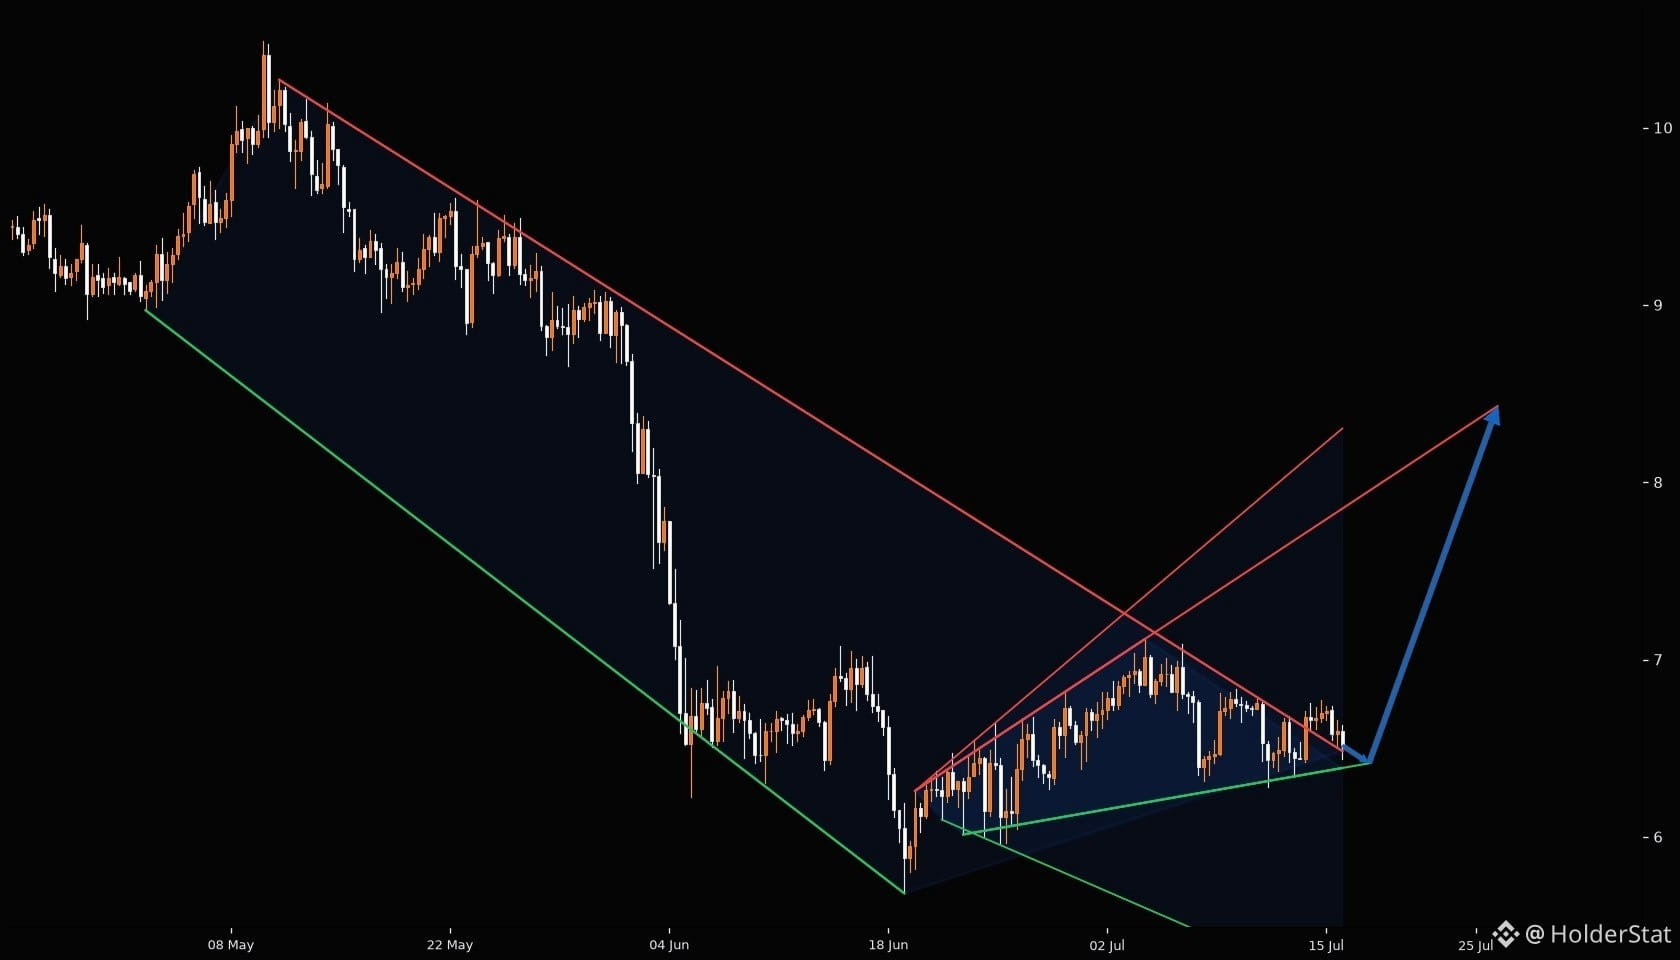
72
·
--
1時間足のBTCUSDT向けです。矢印の方向は上で、現在価格は64613.99、目標は65600です。パターンとしては、大きいウェッジ(上昇ウェッジ?)と中程度のウェッジがあります。矢印に基づくバイアスは強気です。主要な水準を抽出する必要があります:サポート線とレジスタンス線。最高スコアのレジスタンスは6.5(id 4および11)です。サポート線:最高スコアは6.0(id 1)で、終値は62099.63です。また、サポートid 4でスコア5.0、終値65201.2にも注目してください(これは現在価格の近くでしょうか?実際に65201は現在価格より上なので、これはレジスタンスに見えます。しかし、サポート線id 4の終値は65201.21で、サポート線としては傾きが正のため、上昇するサポートであり、現在価格の近くになり得ます。とはいえ、簡単にするため、最も近いサポート/レジスタンスのゾーンを使うべきです....
1時間足のBTCUSDT向けです。矢印の方向は上で、現在価格は64613.99、目標は65600です。パターンとしては、大きいウェッジ(上昇ウェッジ?)と中程度のウェッジがあります。矢印に基づくバイアスは強気です。主要な水準を抽出する必要があります:サポート線とレジスタンス線。最高スコアのレジスタンスは6.5(id 4および11)です。サポート線:最高スコアは6.0(id 1)で、終値は62099.63です。また、サポートid 4でスコア5.0、終値65201.2にも注目してください(これは現在価格の近くでしょうか?実際に65201は現在価格より上なので、これはレジスタンスに見えます。しかし、サポート線id 4の終値は65201.21で、サポート線としては傾きが正のため、上昇するサポートであり、現在価格の近くになり得ます。とはいえ、簡単にするため、最も近いサポート/レジスタンスのゾーンを使うべきです....
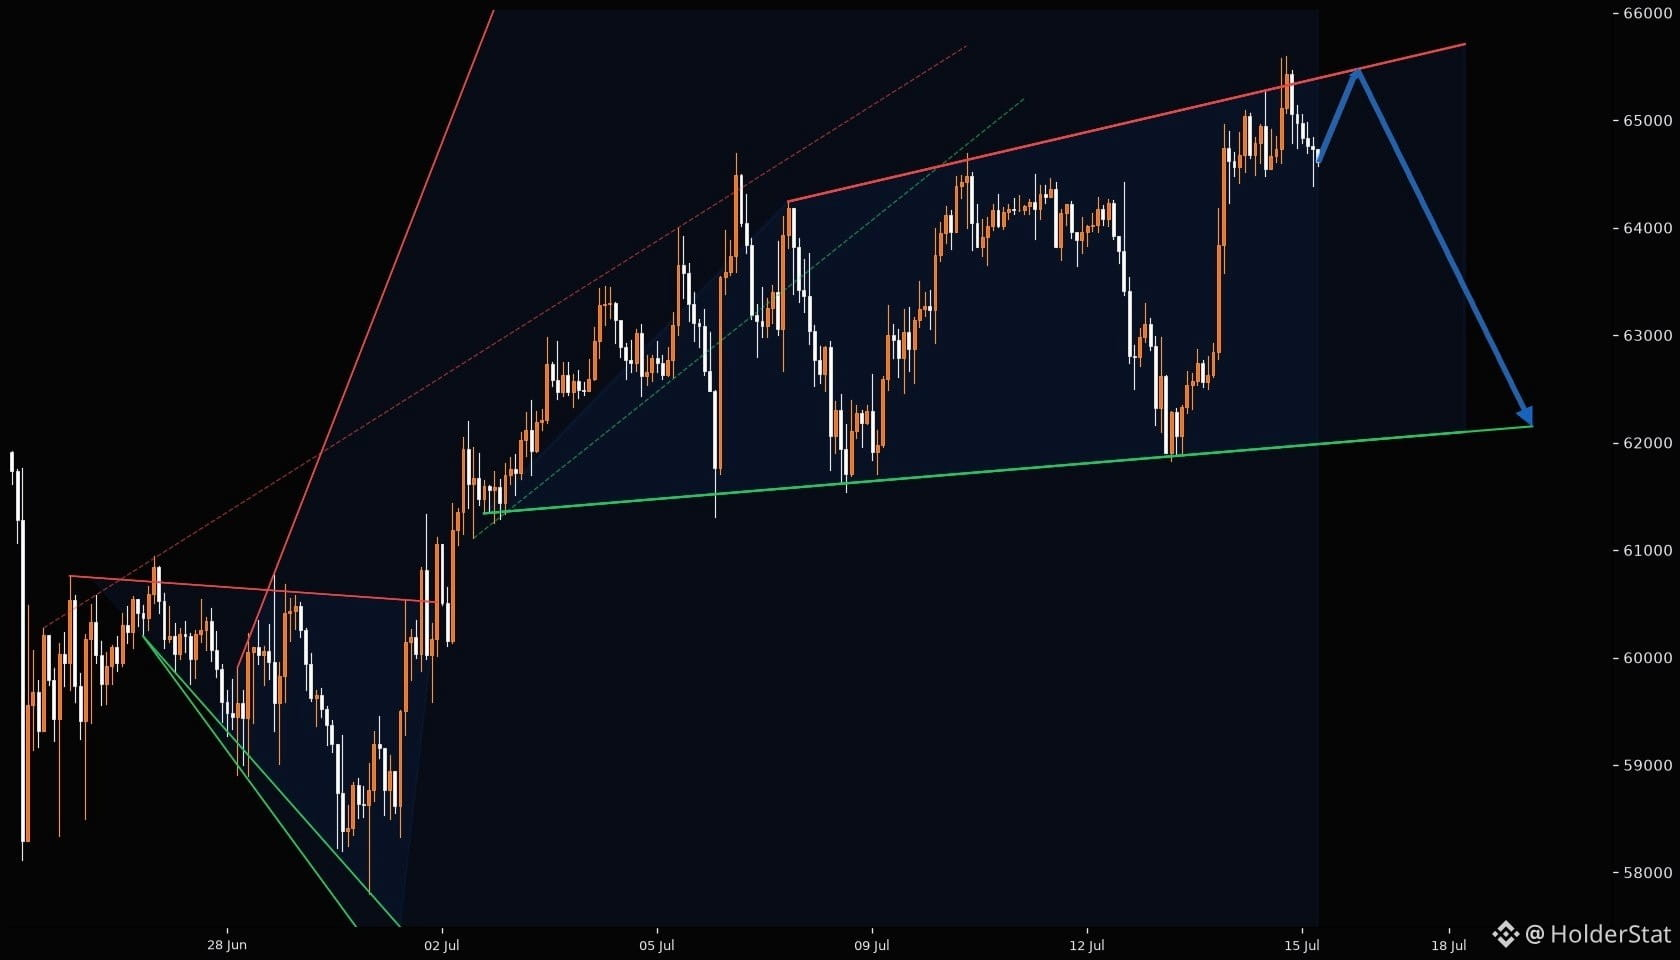
54
·
--
⚡ 設定:AVAXUSDT – 4時間 強気のブレイクアウトが進行中 📍 価格:6.722 🔺 パターン:大型の下降ウェッジ・ブレイクアウト ヶ月(400本以上)にわたって形成されたウェッジで、抵抗線へのタッチが16回、サポートへのタッチが7回。価格は現在、下降トレンドラインを上抜けました。 🔑 レジスタンス:6.683(ウェッジ抵抗線。現在は反転してサポート) その上では、最も近いレジスタンスゾーンが7.088 🛡️ サポート:5.681(ウェッジサポート線) さらに近いサポートは6.338 🎯 標的:6.952 🚨 無効化:6.683を下回って再度終値でクローズすると、遅れて買った人が損益を抱え込むことになり、ブレイクアウトは無効になります。 ⏳ プラン:6.683を明確に維持できるか注視します。この水準をサポートとして再テストできれば、動きが確認されます。目標は6.95付近の次のレジスタンスゾーン。価格が7.088で反発する場合、サポートに向けて再びギュッと押し戻される(スクイーズする)ことを想定してください。
⚡ 設定:AVAXUSDT – 4時間 強気のブレイクアウトが進行中 📍 価格:6.722 🔺 パターン:大型の下降ウェッジ・ブレイクアウト ヶ月(400本以上)にわたって形成されたウェッジで、抵抗線へのタッチが16回、サポートへのタッチが7回。価格は現在、下降トレンドラインを上抜けました。 🔑 レジスタンス:6.683(ウェッジ抵抗線。現在は反転してサポート) その上では、最も近いレジスタンスゾーンが7.088 🛡️ サポート:5.681(ウェッジサポート線) さらに近いサポートは6.338 🎯 標的:6.952 🚨 無効化:6.683を下回って再度終値でクローズすると、遅れて買った人が損益を抱え込むことになり、ブレイクアウトは無効になります。 ⏳ プラン:6.683を明確に維持できるか注視します。この水準をサポートとして再テストできれば、動きが確認されます。目標は6.95付近の次のレジスタンスゾーン。価格が7.088で反発する場合、サポートに向けて再びギュッと押し戻される(スクイーズする)ことを想定してください。
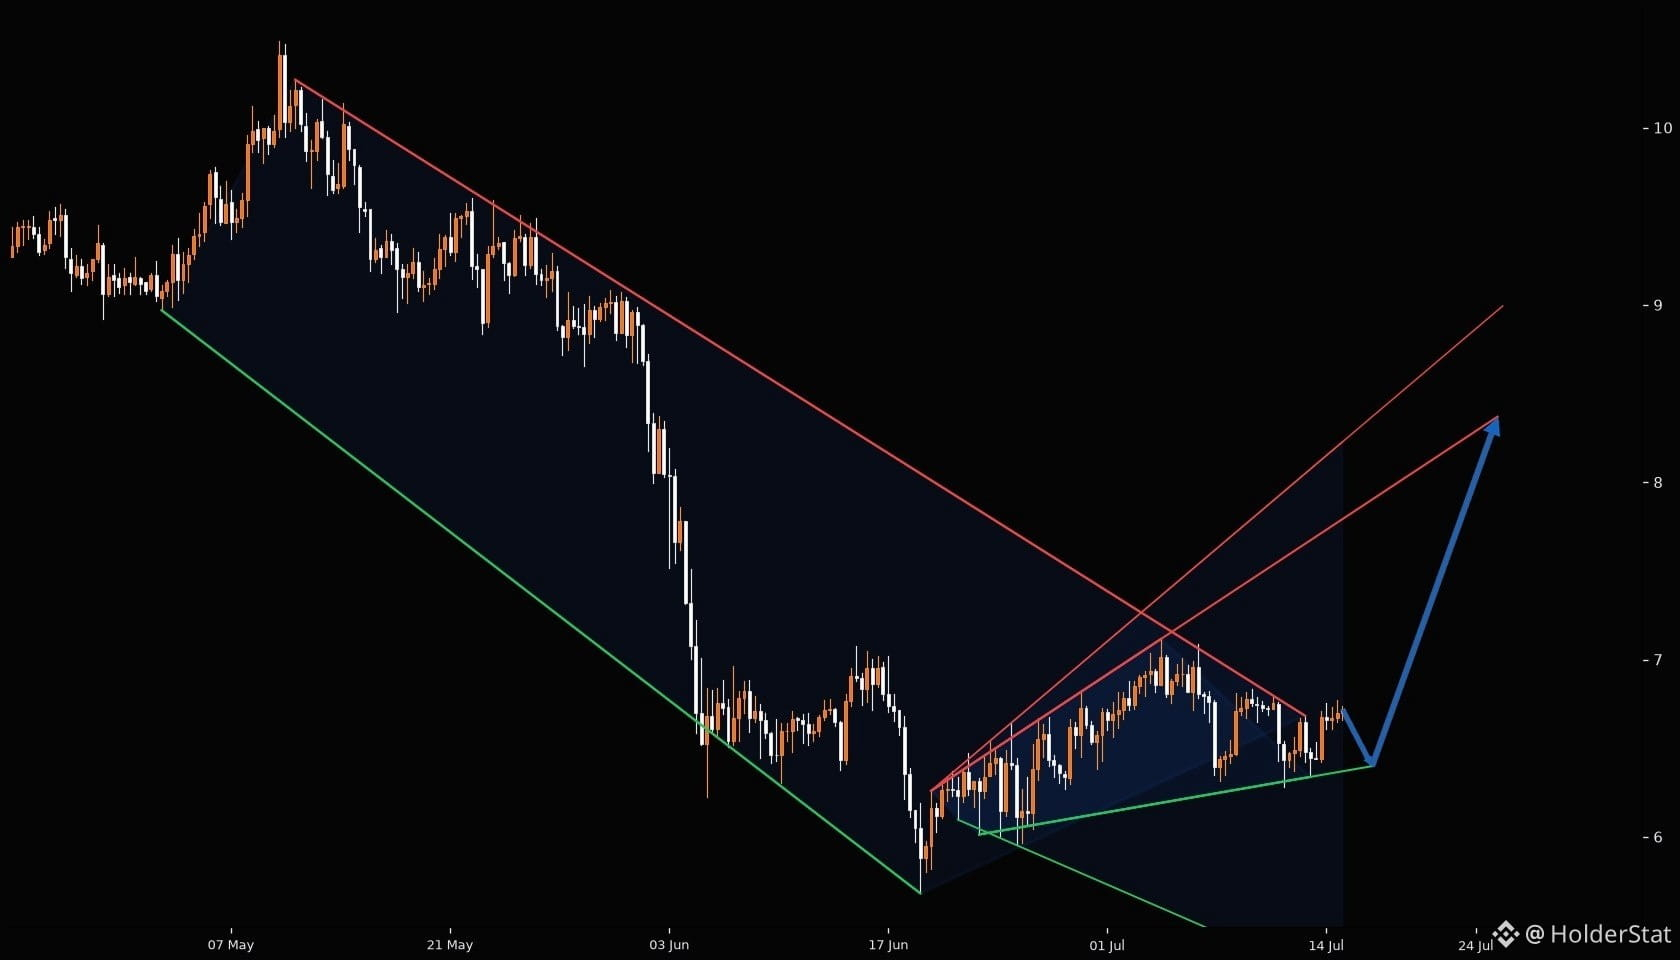
66
·
--
⚡ $BTC 1H: ウェッジの圧力が構築中 ⚠️ ビットコインは重要な決定ゾーン付近でコイル(収束)しています。チャートが締まり始めており、これは流動性トラップが形成されることが多いまさにその局面です。 📍 現在の構造: 価格は最新のローカル・ベース付近で反応しています。買い手はまだサポートを維持していますが、「きれいな動き」と判断するには確認が必要です。 🔺 パターン解釈: 1Hでは圧縮が進行中。より大きな構造の中にある小さなウェッジは、本物の動きの前に鋭いフェイクアウトを引き起こす可能性があります。 🔑 注視するレジスタンス: 最も近いマークされたクラスターが最初のテストです。そこを素早く上抜けすると、出来高が伴わない場合、遅れて入った買い手をトラップすることがあります。 🛡️ 下方サポート: 防衛されるゾーンが維持され続ければ、上方向の圧力が高まる可能性があります。もし崩れれば、市場はより深い流動性のポケットへ素早く狩りに行くかもしれません。 🎯 メイン方針: ウェッジが解決するのを待ちます。今回のトレードはノイズではありません。マークした水準付近での反応こそがポイントです。 ⏳ 忍耐。ブレイクアウトかリジェクションのサインが先に出るのを待ちましょう。最初のローソク足を追いかける必要はありません。 $BTC #BTC 価格分析
⚡ $BTC 1H: ウェッジの圧力が構築中 ⚠️ ビットコインは重要な決定ゾーン付近でコイル(収束)しています。チャートが締まり始めており、これは流動性トラップが形成されることが多いまさにその局面です。 📍 現在の構造: 価格は最新のローカル・ベース付近で反応しています。買い手はまだサポートを維持していますが、「きれいな動き」と判断するには確認が必要です。 🔺 パターン解釈: 1Hでは圧縮が進行中。より大きな構造の中にある小さなウェッジは、本物の動きの前に鋭いフェイクアウトを引き起こす可能性があります。 🔑 注視するレジスタンス: 最も近いマークされたクラスターが最初のテストです。そこを素早く上抜けすると、出来高が伴わない場合、遅れて入った買い手をトラップすることがあります。 🛡️ 下方サポート: 防衛されるゾーンが維持され続ければ、上方向の圧力が高まる可能性があります。もし崩れれば、市場はより深い流動性のポケットへ素早く狩りに行くかもしれません。 🎯 メイン方針: ウェッジが解決するのを待ちます。今回のトレードはノイズではありません。マークした水準付近での反応こそがポイントです。 ⏳ 忍耐。ブレイクアウトかリジェクションのサインが先に出るのを待ちましょう。最初のローソク足を追いかける必要はありません。 $BTC #BTC 価格分析
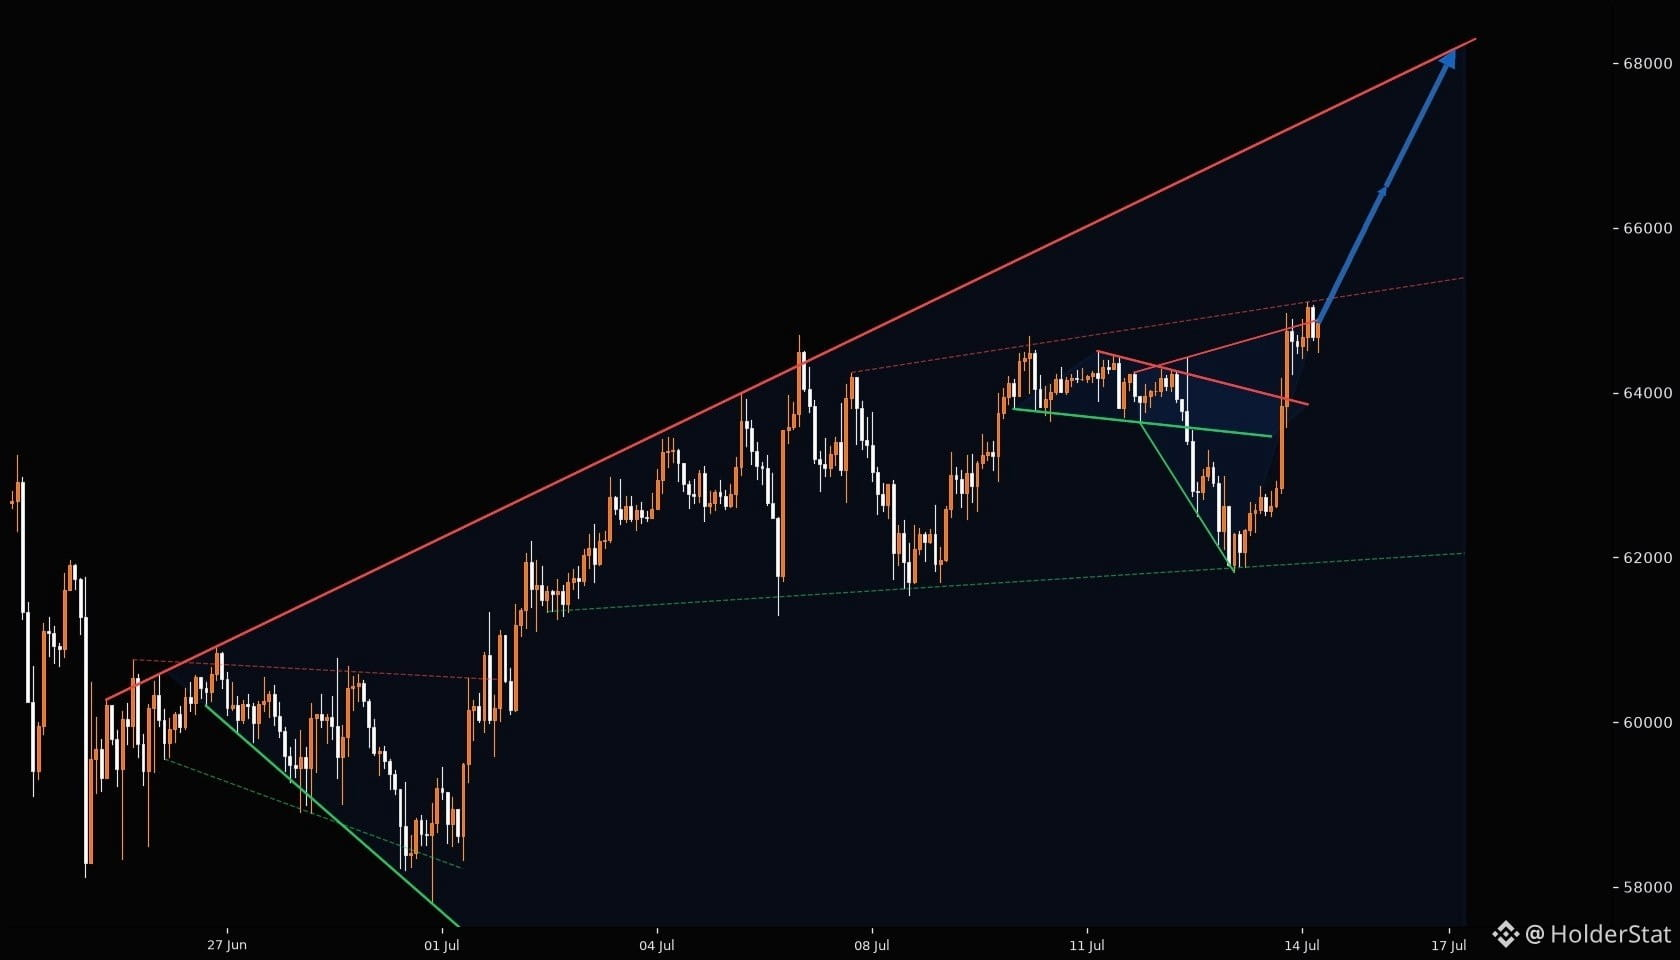
68
·
--
⚡ $ETH 1H: ウェッジの圧力が蓄積中 ⚠️ イーサリアムは意思決定ゾーン付近でコイル状になっています。チャートが締まり、ちょうどここから流動性トラップが形成され始めることがよくあります。 📍 現在の構造: 価格は直近のローカル・ベース付近で反応しています。買い手はまだサポートを保っていますが、「クリーン」と判断するには確認が必要です。 🔺 パターン読み: 1Hでは圧縮が進行中。大きな構造の中にある小さなウェッジは、実際の値動きの前に鋭いフェイクアウトを引き起こすことがあります。 🔑 注目する抵抗: 最も近いマークされたクラスターが最初のテストです。出来高が伴わない場合、そこを素早く上抜けると後追いの買い手をトラップする可能性があります。 🛡️ 下方サポート: 防衛されているゾーンが維持され続けるなら、上方向の圧力が高まることがあります。もし崩れれば、市場はより深い流動性ポケットを素早く探りにいくかもしれません。 🎯 メインプラン: ウェッジが解消するのを待ちます。取引はノイズの中ではありません――マークされた水準付近での反応の中です。 ⏳ 忍耐。ブレイクかリジェクションのサインが先に出るのを待ちましょう。最初の足を追いかける必要はありません。 $ETH #ETH 価格分析
⚡ $ETH 1H: ウェッジの圧力が蓄積中 ⚠️ イーサリアムは意思決定ゾーン付近でコイル状になっています。チャートが締まり、ちょうどここから流動性トラップが形成され始めることがよくあります。 📍 現在の構造: 価格は直近のローカル・ベース付近で反応しています。買い手はまだサポートを保っていますが、「クリーン」と判断するには確認が必要です。 🔺 パターン読み: 1Hでは圧縮が進行中。大きな構造の中にある小さなウェッジは、実際の値動きの前に鋭いフェイクアウトを引き起こすことがあります。 🔑 注目する抵抗: 最も近いマークされたクラスターが最初のテストです。出来高が伴わない場合、そこを素早く上抜けると後追いの買い手をトラップする可能性があります。 🛡️ 下方サポート: 防衛されているゾーンが維持され続けるなら、上方向の圧力が高まることがあります。もし崩れれば、市場はより深い流動性ポケットを素早く探りにいくかもしれません。 🎯 メインプラン: ウェッジが解消するのを待ちます。取引はノイズの中ではありません――マークされた水準付近での反応の中です。 ⏳ 忍耐。ブレイクかリジェクションのサインが先に出るのを待ちましょう。最初の足を追いかける必要はありません。 $ETH #ETH 価格分析
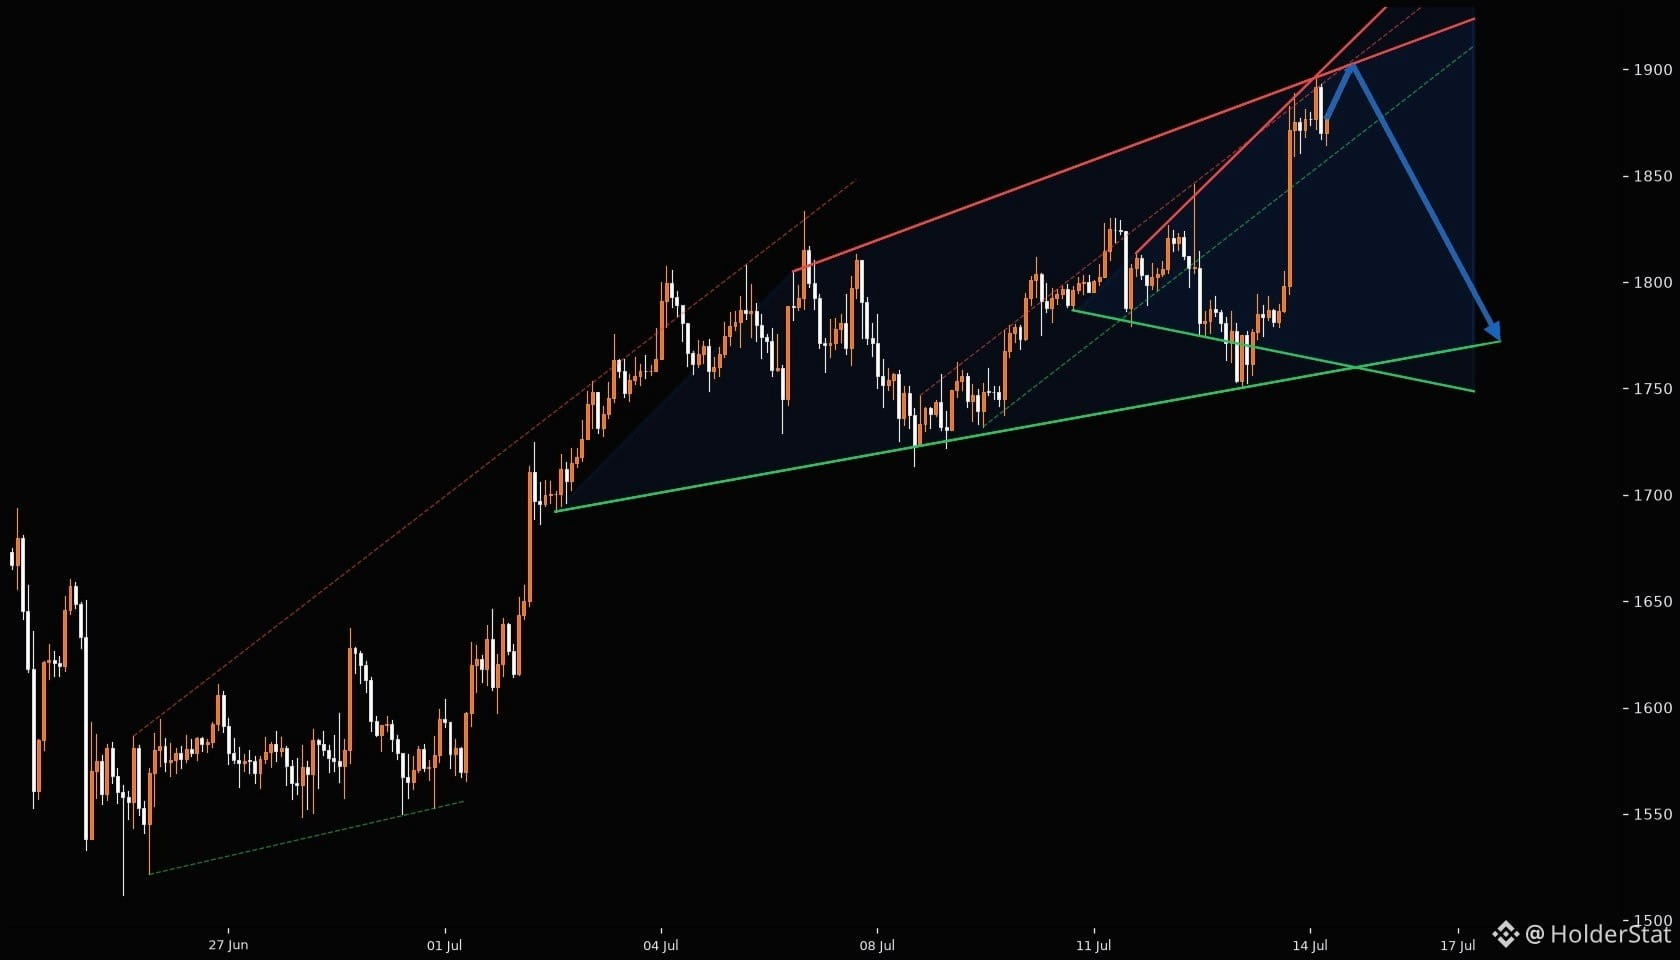
63
·
--
⚡ $BTC 1H: WEDGE PRESSURE IS BUILDING ⚠️ Bitcoinは意思決定ゾーン付近でコイル状態です。チャートが締まり、この局面はまさに流動性トラップが形成され始める典型のタイミングです。 📍 現在の構造:価格は直近のローカル・ベース付近で反応しています。買い手にはまだサポートがありますが、きれいに機能していると言うには確証が必要です。 🔺 パターン読み:1Hで圧縮が進行中です。より大きな構造の中にある小さなウエッジは、実際の値動きの前に鋭いフェイクアウトを引き起こすことがあります。 🔑 注目すべきレジスタンス:最も近いマーキング済みのクラスターが最初のテストです。そこを素早く上抜けすると、出来高が伴わない場合、手遅れの買い手を捕まえる可能性があります。 🛡️ 下方サポート:防衛されるゾーンが維持され続けるなら、上方向の勢いが強まることがあります。もし割れれば、市場はより深い流動性ポケットを素早く狙いにいくかもしれません。 🎯 メインプラン:ウエッジが解消されるのを待ちます。この取引はノイズではありません。マーキングした水準付近での反応こそがポイントです。 ⏳ 我慢です。ブレイクアウトかリジェクションが先に表示されるのを待ちましょう。最初のローソク足を追いかける必要はありません。 $BTC $BTC 価格分析
⚡ $BTC 1H: WEDGE PRESSURE IS BUILDING ⚠️ Bitcoinは意思決定ゾーン付近でコイル状態です。チャートが締まり、この局面はまさに流動性トラップが形成され始める典型のタイミングです。 📍 現在の構造:価格は直近のローカル・ベース付近で反応しています。買い手にはまだサポートがありますが、きれいに機能していると言うには確証が必要です。 🔺 パターン読み:1Hで圧縮が進行中です。より大きな構造の中にある小さなウエッジは、実際の値動きの前に鋭いフェイクアウトを引き起こすことがあります。 🔑 注目すべきレジスタンス:最も近いマーキング済みのクラスターが最初のテストです。そこを素早く上抜けすると、出来高が伴わない場合、手遅れの買い手を捕まえる可能性があります。 🛡️ 下方サポート:防衛されるゾーンが維持され続けるなら、上方向の勢いが強まることがあります。もし割れれば、市場はより深い流動性ポケットを素早く狙いにいくかもしれません。 🎯 メインプラン:ウエッジが解消されるのを待ちます。この取引はノイズではありません。マーキングした水準付近での反応こそがポイントです。 ⏳ 我慢です。ブレイクアウトかリジェクションが先に表示されるのを待ちましょう。最初のローソク足を追いかける必要はありません。 $BTC $BTC 価格分析
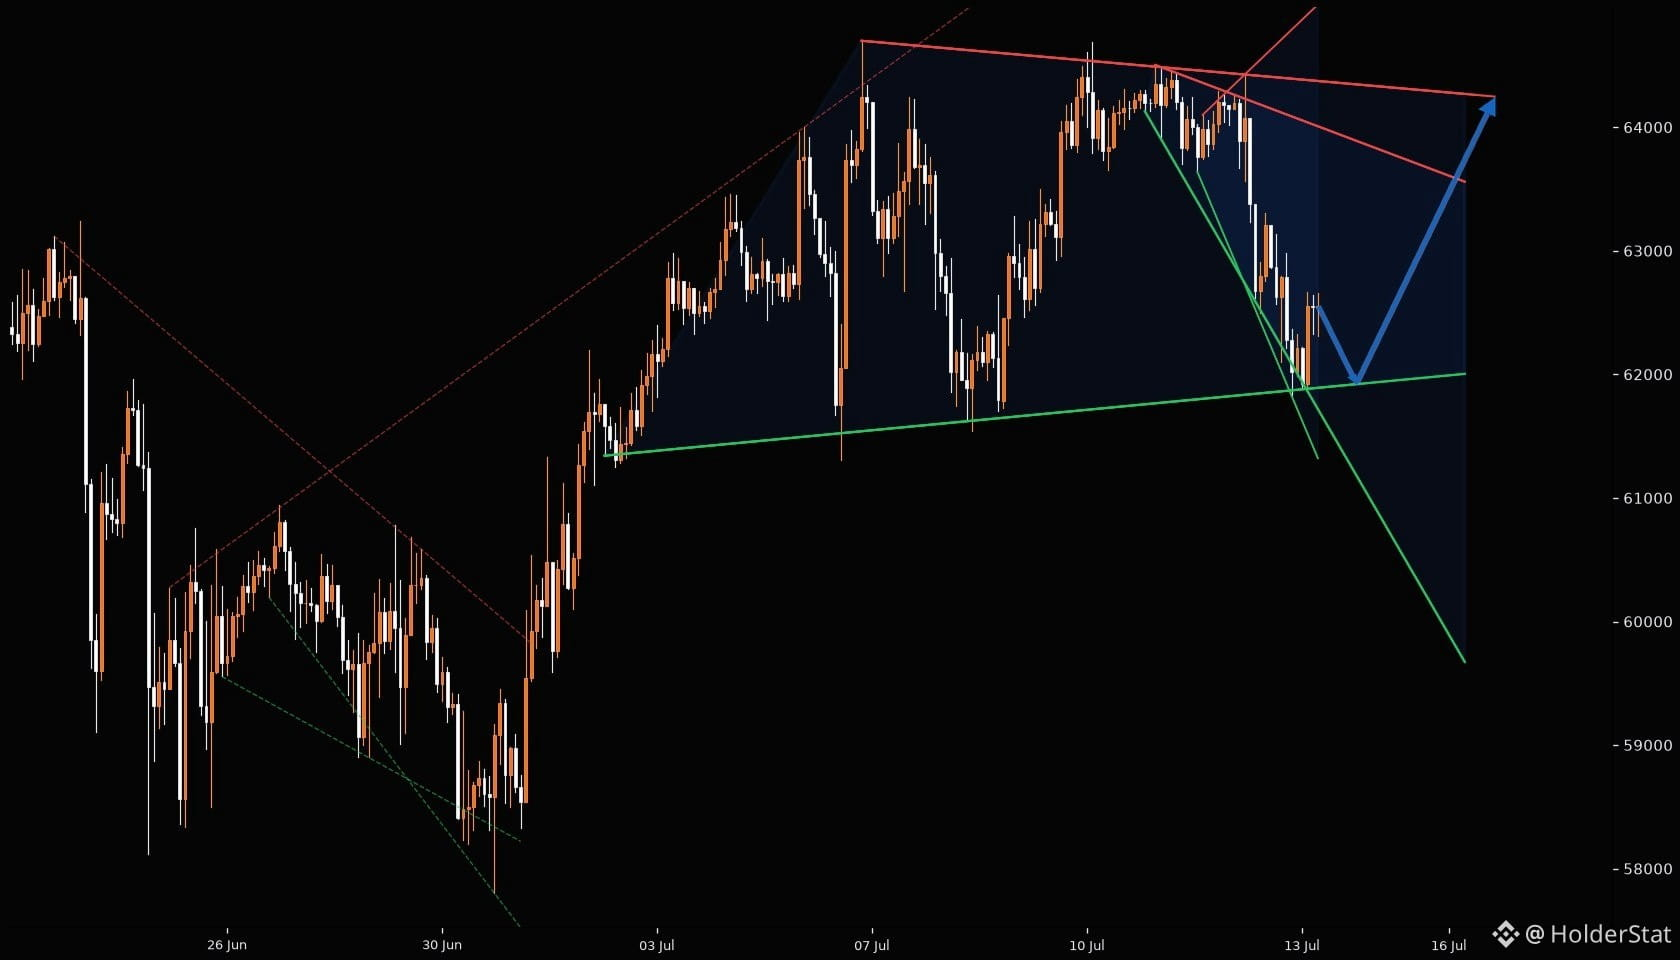
60
·
--
⚡ $AVAX 4H: WEDGE PRESSURE IS BUILDING ⚠️ Avalancheは重要な判断ゾーン付近でコイル状になっています。チャートは収縮しており、ここは通常「流動性トラップ」が形成され始めるポイントです。 📍 現在の構造:最新のローカル・ベース付近で価格が反応しています。買い手にはまだサポートがありますが、「クリーン」と判断するには、その前に動きの確認が必要です。 🔺 パターンの読み:4Hで圧縮が高まっています。より大きな構造の中にある小さなウエッジは、本物の値動きの前に鋭いフェイクアウトを引き起こすことがあります。 🔑 注目すべきレジスタンス:最も近いマークされたクラスターが最初のテストです。そこを素早く上抜けすると、出来高が伴わない場合、手遅れの買い手を罠にかける可能性があります。 🛡️ 下方サポート:防衛されているゾーンが維持され続けるなら、上方向の圧力が積み上がり得ます。もし割れると、市場はより深い流動性のポケットを素早く探りに行くかもしれません。 🎯 メインプラン:ウエッジの解消(ブレイク/収束後の決着)を待ちます。取引はノイズの中ではありません。マークした水準周辺での反応がすべてです。 ⏳ 焦らないでください。ブレイクかリジェクションの「最初の表示」を先に見ましょう。最初の1本に飛びつく必要はありません。 $AVAX #AVAX 価格分析
⚡ $AVAX 4H: WEDGE PRESSURE IS BUILDING ⚠️ Avalancheは重要な判断ゾーン付近でコイル状になっています。チャートは収縮しており、ここは通常「流動性トラップ」が形成され始めるポイントです。 📍 現在の構造:最新のローカル・ベース付近で価格が反応しています。買い手にはまだサポートがありますが、「クリーン」と判断するには、その前に動きの確認が必要です。 🔺 パターンの読み:4Hで圧縮が高まっています。より大きな構造の中にある小さなウエッジは、本物の値動きの前に鋭いフェイクアウトを引き起こすことがあります。 🔑 注目すべきレジスタンス:最も近いマークされたクラスターが最初のテストです。そこを素早く上抜けすると、出来高が伴わない場合、手遅れの買い手を罠にかける可能性があります。 🛡️ 下方サポート:防衛されているゾーンが維持され続けるなら、上方向の圧力が積み上がり得ます。もし割れると、市場はより深い流動性のポケットを素早く探りに行くかもしれません。 🎯 メインプラン:ウエッジの解消(ブレイク/収束後の決着)を待ちます。取引はノイズの中ではありません。マークした水準周辺での反応がすべてです。 ⏳ 焦らないでください。ブレイクかリジェクションの「最初の表示」を先に見ましょう。最初の1本に飛びつく必要はありません。 $AVAX #AVAX 価格分析
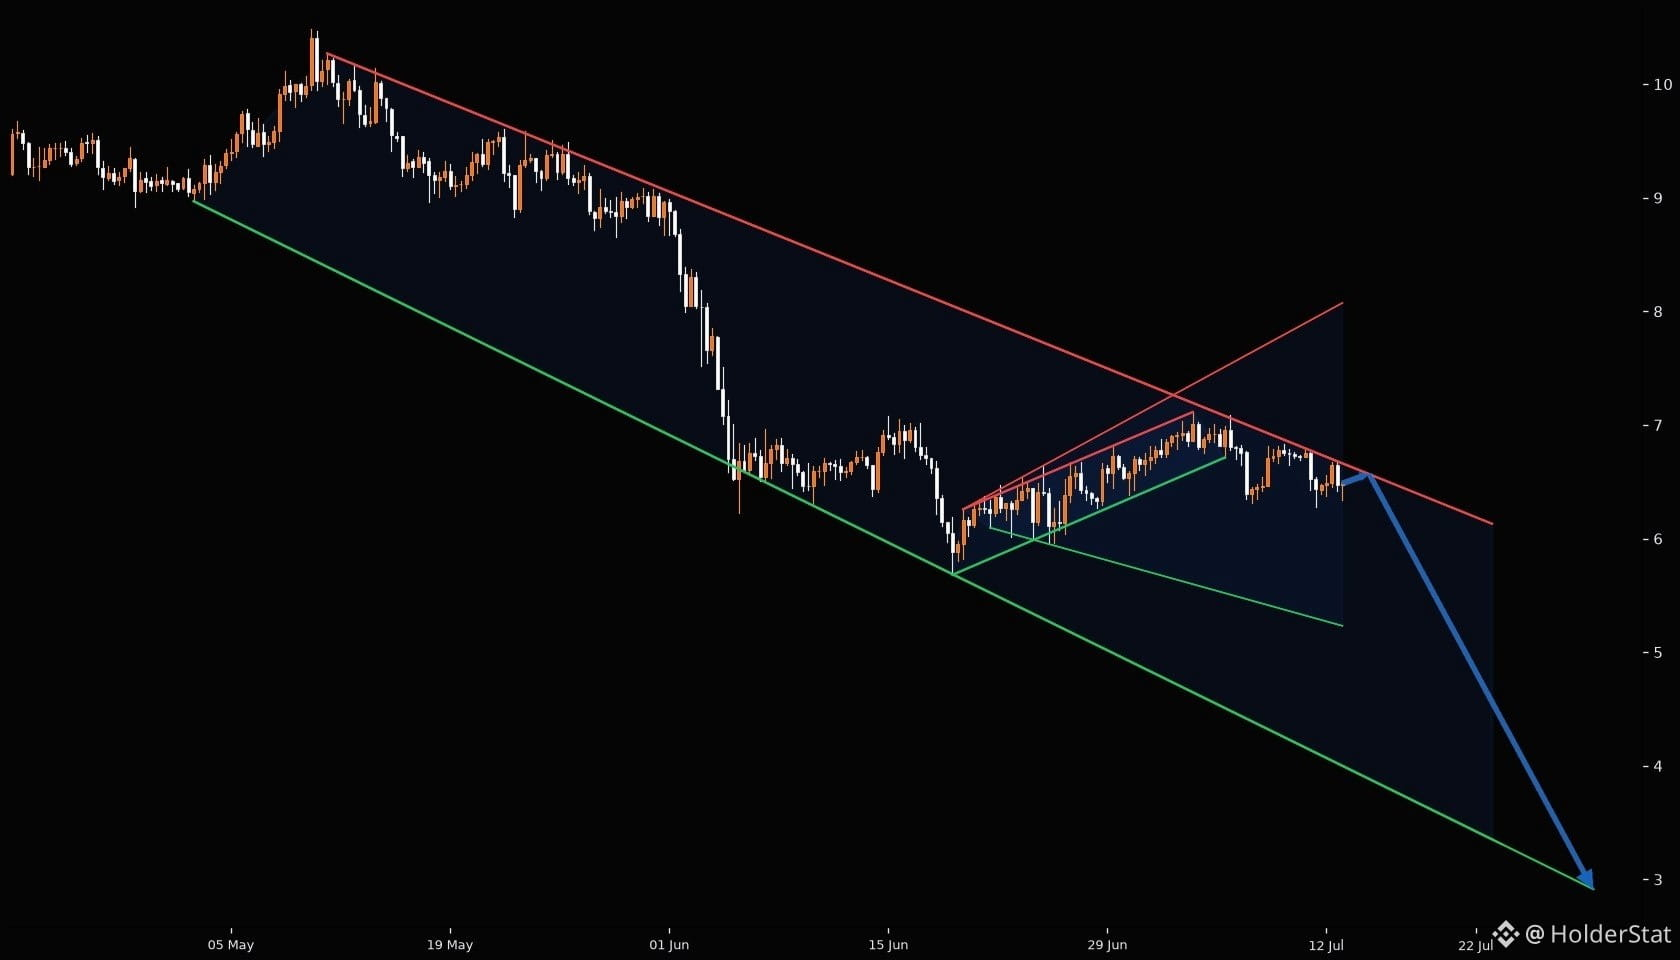
71
·
--
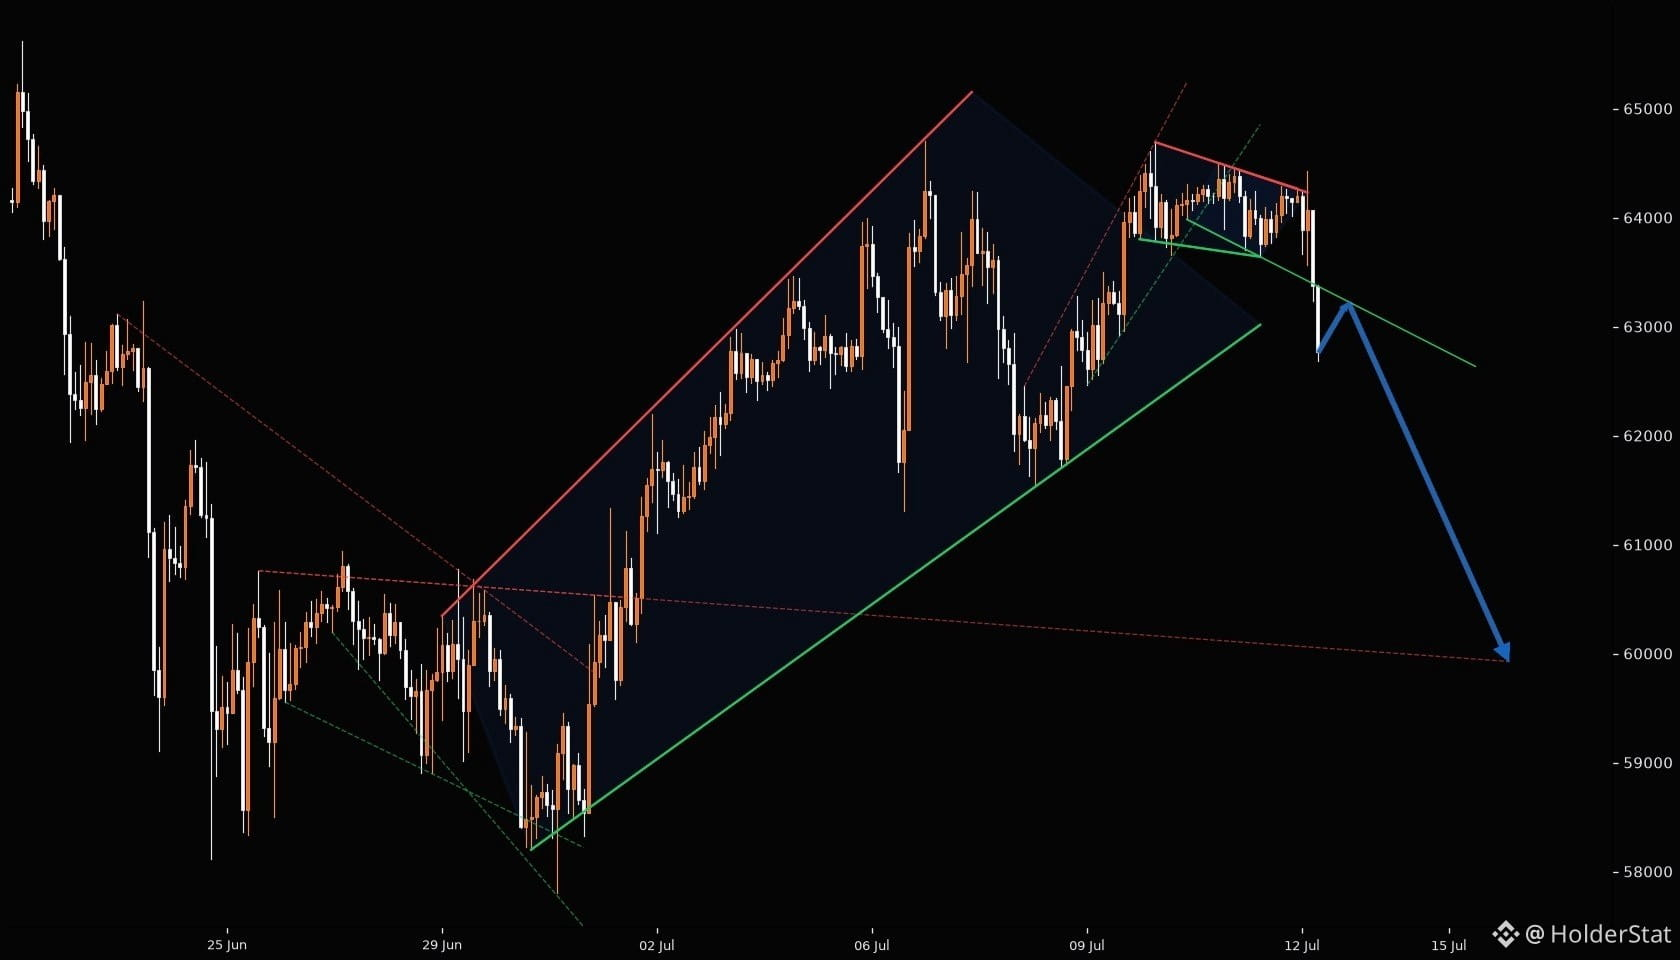
⚡ $BTC 1H: WEDGE PRESSURE IS BUILDING ⚠️ ビットコインは重要な決断ゾーン付近でコイル状に収束しています。チャートが締まりつつあり、まさにここは流動性トラップが形成され始めるポイントです。 📍 現在の構造:価格は直近のローカル・ベース付近で反応しています。買い手のサポートはまだありますが、「クリーン」と呼べるには確認が必要です。 🔺 パターン読み:1Hで圧縮が進行中です。より大きな構造の中にある小さなウェッジが、実際の動きの前に鋭いフェイクアウトを引き起こす可能性があります。 🔑 注目するレジスタンス:最も近いマーキングされたクラスターが最初のテストになります。そこを素早く上抜けると、出来高が伴わない場合、手遅れの買い手を罠にかけることがあります。 🛡️ 下のサポート:防衛されているゾーンが維持され続けるなら、上方向の勢いが強まる可能性があります。もし崩れれば、市場はより深い流動性のポケットをすぐに探りにいくかもしれません。 🎯 メインチャートプラン:ウェッジが解消されるのを待ちましょう。エントリーはノイズの中ではなく、マーキングされた水準付近での反応にあります。 ⏳ 忍耐。ブレイクアウトかリジェクションの確定を先に見てください。最初の1本を追いかける必要はありません。 $BTC #BTC 価格分析
⚡ $BTC 1H: WEDGE PRESSURE IS BUILDING ⚠️ ビットコインは重要な決断ゾーン付近でコイル状に収束しています。チャートが締まりつつあり、まさにここは流動性トラップが形成され始めるポイントです。 📍 現在の構造:価格は直近のローカル・ベース付近で反応しています。買い手のサポートはまだありますが、「クリーン」と呼べるには確認が必要です。 🔺 パターン読み:1Hで圧縮が進行中です。より大きな構造の中にある小さなウェッジが、実際の動きの前に鋭いフェイクアウトを引き起こす可能性があります。 🔑 注目するレジスタンス:最も近いマーキングされたクラスターが最初のテストになります。そこを素早く上抜けると、出来高が伴わない場合、手遅れの買い手を罠にかけることがあります。 🛡️ 下のサポート:防衛されているゾーンが維持され続けるなら、上方向の勢いが強まる可能性があります。もし崩れれば、市場はより深い流動性のポケットをすぐに探りにいくかもしれません。 🎯 メインチャートプラン:ウェッジが解消されるのを待ちましょう。エントリーはノイズの中ではなく、マーキングされた水準付近での反応にあります。 ⏳ 忍耐。ブレイクアウトかリジェクションの確定を先に見てください。最初の1本を追いかける必要はありません。 $BTC #BTC 価格分析
45
·
--
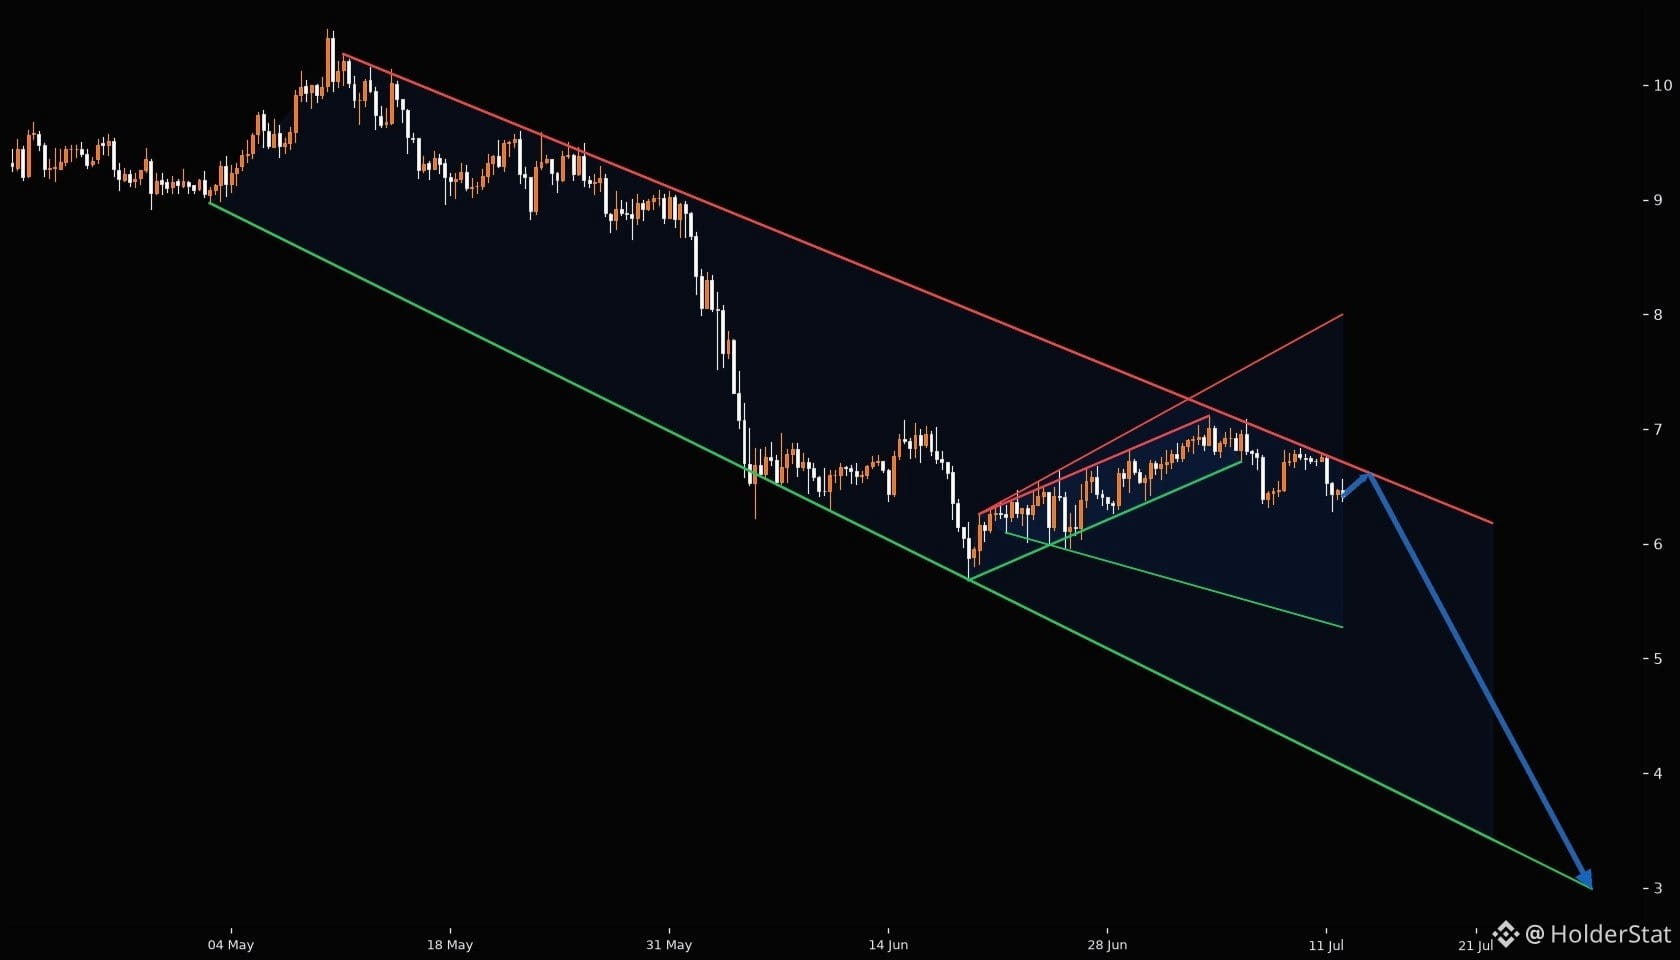
$AVAX 4H: WEDGE PRESSURE IS BUILDING ⚠️ アバランチは意思決定ゾーン付近でコイル状になっています。チャートはさらに締まっており、ここは流動性トラップが形成され始める典型的なタイミングです。 📍 現在の構造:最新のローカル・ベース付近で価格が反応しています。買い手にはまだサポートがありますが、綺麗に判断するには確認が必要です。 🔺 パターン読み:4Hで圧縮が蓄積しています。より大きな構造の中にある小さなウェッジは、本物の動きの前に鋭いフェイクアウトを引き起こすことがあります。 🔑 注目すべき抵抗:最も近い目印のクラスタがまずのテストです。出来高がついてこない場合、そこを素早く上抜けると、遅れて入った買い手を捕まえる可能性があります。 🛡️ 下側サポート:防衛されているゾーンが維持されるなら、上方向の圧力が高まることがあります。もし崩れると、市場はより深い流動性のポケットを素早く狙いに行くかもしれません。 🎯 メインプラン:ウェッジの解消(ブレイク/収束の決着)を待ちます。これはただのノイズではありません。目印の水準周辺で起きる反応がポイントです。 ⏳ 冷静に。ブレイクかリジェクトの最初の表示が出るまで待ちましょう。最初のローソク足を追いかける必要はありません。 $AVAX #AVAX 価格分析
$AVAX 4H: WEDGE PRESSURE IS BUILDING ⚠️ アバランチは意思決定ゾーン付近でコイル状になっています。チャートはさらに締まっており、ここは流動性トラップが形成され始める典型的なタイミングです。 📍 現在の構造:最新のローカル・ベース付近で価格が反応しています。買い手にはまだサポートがありますが、綺麗に判断するには確認が必要です。 🔺 パターン読み:4Hで圧縮が蓄積しています。より大きな構造の中にある小さなウェッジは、本物の動きの前に鋭いフェイクアウトを引き起こすことがあります。 🔑 注目すべき抵抗:最も近い目印のクラスタがまずのテストです。出来高がついてこない場合、そこを素早く上抜けると、遅れて入った買い手を捕まえる可能性があります。 🛡️ 下側サポート:防衛されているゾーンが維持されるなら、上方向の圧力が高まることがあります。もし崩れると、市場はより深い流動性のポケットを素早く狙いに行くかもしれません。 🎯 メインプラン:ウェッジの解消(ブレイク/収束の決着)を待ちます。これはただのノイズではありません。目印の水準周辺で起きる反応がポイントです。 ⏳ 冷静に。ブレイクかリジェクトの最初の表示が出るまで待ちましょう。最初のローソク足を追いかける必要はありません。 $AVAX #AVAX 価格分析
58
·
--
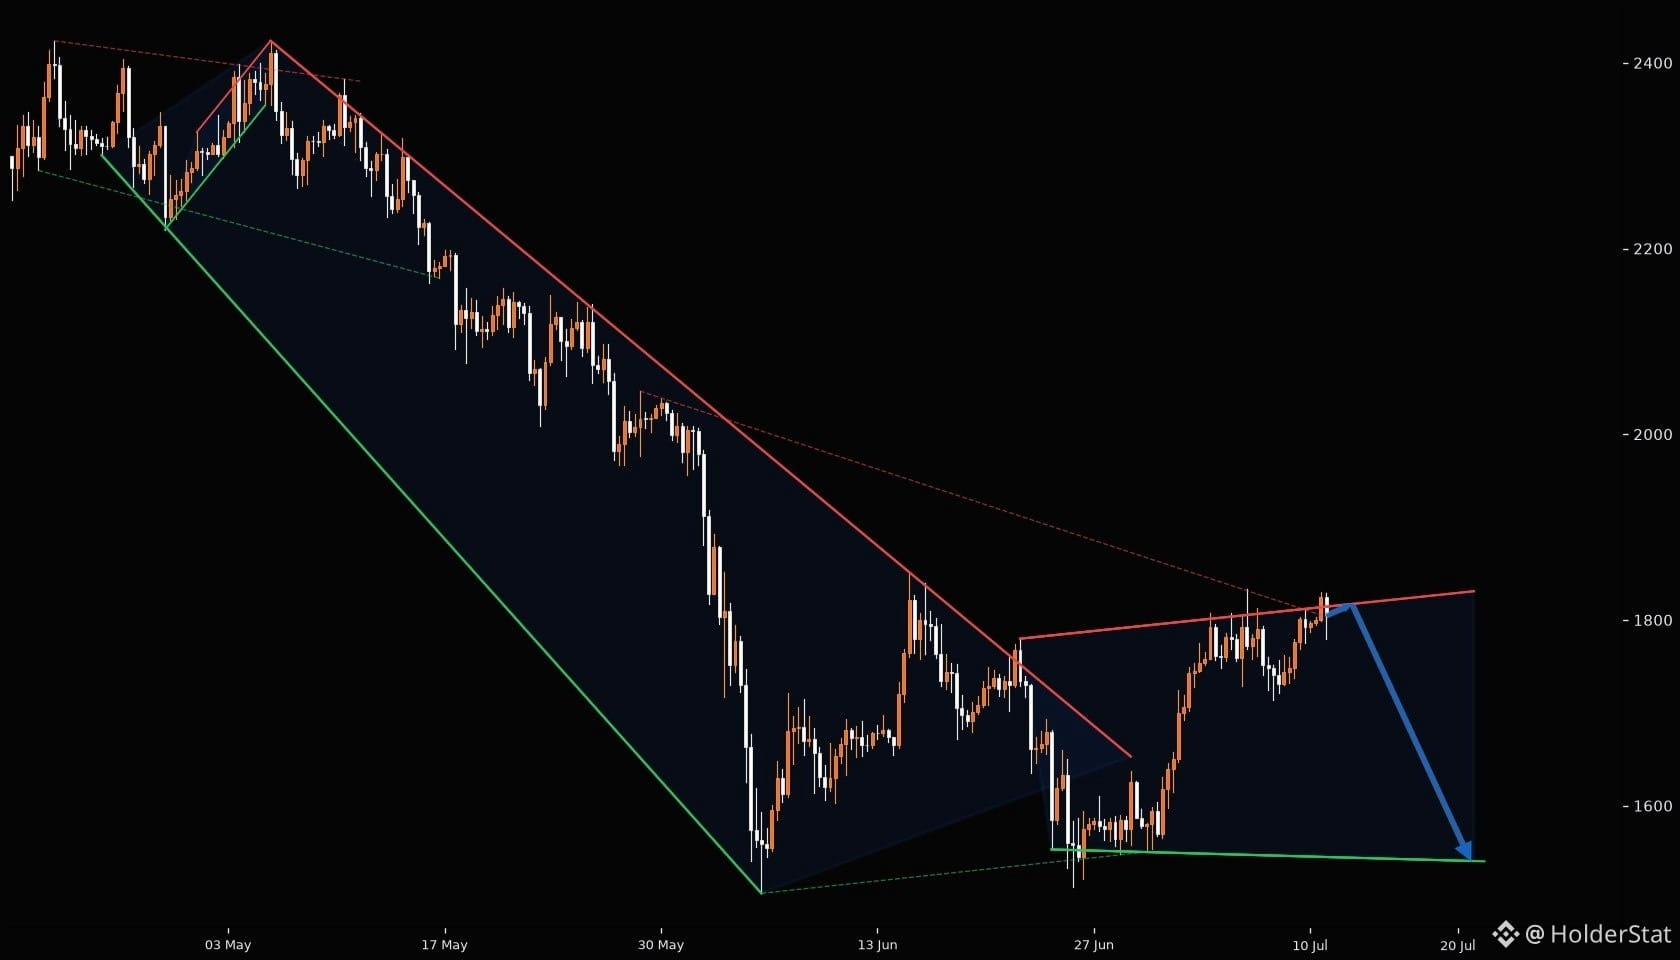
⚡ $ETH 4H: WEDGE PRESSURE IS BUILDING ⚠️ イーサリアムは重要な分岐点付近でコイル状に推移しています。チャートは収束しており、こここそ流動性トラップが形成され始める典型的なタイミングです。 📍 現在の構造:価格は最新のローカル・ベース周辺で反応しています。買い手はまだサポートを持っていますが、「きれいだ」と判断するには、確証(コンファーム)が必要です。 🔺 パターン読み:4Hで圧縮(コンプレッション)が構築中です。より大きな構造の中にできる小さなウェッジは、本命の動きの前に鋭いフェイクアウトを引き起こすことがあります。 🔑 注目するレジスタンス:最も近いマークされたクラスターが最初のテストです。そこを素早く上抜けると、出来高が伴わない場合、後追いの買い手をトラップする可能性があります。 🛡️ 下のサポート:防衛されたゾーンが維持され続けるなら、上方向の勢いが積み上がり得ます。もし崩れるなら、市場はより深い流動性ポケットを素早く探しにいくかもしれません。 🎯 メインプラン:ウェッジが解消されるのを待ちます。このトレードはノイズの中ではなく、マークされた水準付近での反応にあります。 ⏳ 忍耐。ブレイクアウトかリジェクションの結果(表示)を先に見てください。最初のローソクを追いかける必要はありません。 $ETH #ETH 価格分析
⚡ $ETH 4H: WEDGE PRESSURE IS BUILDING ⚠️ イーサリアムは重要な分岐点付近でコイル状に推移しています。チャートは収束しており、こここそ流動性トラップが形成され始める典型的なタイミングです。 📍 現在の構造:価格は最新のローカル・ベース周辺で反応しています。買い手はまだサポートを持っていますが、「きれいだ」と判断するには、確証(コンファーム)が必要です。 🔺 パターン読み:4Hで圧縮(コンプレッション)が構築中です。より大きな構造の中にできる小さなウェッジは、本命の動きの前に鋭いフェイクアウトを引き起こすことがあります。 🔑 注目するレジスタンス:最も近いマークされたクラスターが最初のテストです。そこを素早く上抜けると、出来高が伴わない場合、後追いの買い手をトラップする可能性があります。 🛡️ 下のサポート:防衛されたゾーンが維持され続けるなら、上方向の勢いが積み上がり得ます。もし崩れるなら、市場はより深い流動性ポケットを素早く探しにいくかもしれません。 🎯 メインプラン:ウェッジが解消されるのを待ちます。このトレードはノイズの中ではなく、マークされた水準付近での反応にあります。 ⏳ 忍耐。ブレイクアウトかリジェクションの結果(表示)を先に見てください。最初のローソクを追いかける必要はありません。 $ETH #ETH 価格分析
71
·
--
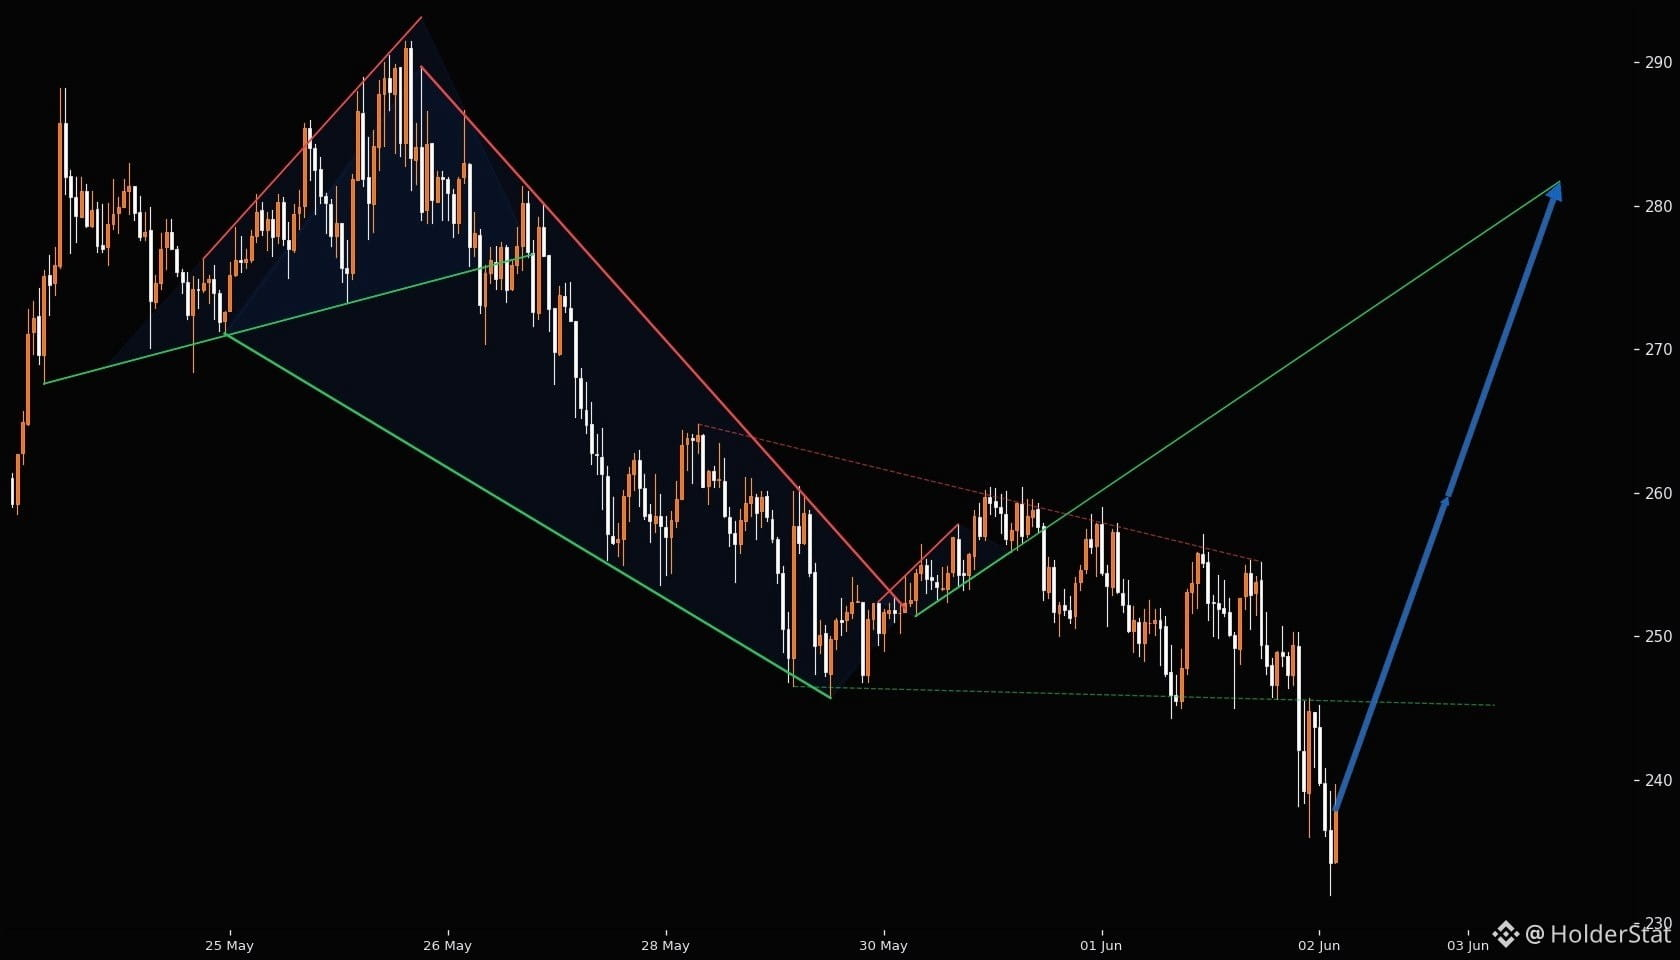
構造チェック:市場が $TAO を守っている場所 1時間足は構造優先の読みを提供しています。主なアイデアは、最後のキャンドルを追いかけるのではなく、市場がすでにどこで防御を示しているかを理解することです。17のサポートラインに対して12のレジスタンスラインがあり、17のサポートエリアと12のレジスタンスエリアはピボットフィルターを通過するのに十分強いです。HolderStatスタイルの場合、重要な部分はベースです:価格が守られたゾーンを尊重し続けるなら、バイヤーはリロードする場所を持っています。そのベースが崩れると、同じレベルがすぐに圧力に変わる可能性があります。視覚的に見えるパターンゾーンは3つあるので、チャートはランダムなノイズではなく、流動性が待機している場所の地図です。現在の読み:サポートが現在の構造をコントロールしています。ムーブを呼ぶ前に、最も近いラインの近くで次の反応を観察してください。 ✅さらに分析はこちら:t.me/holderstat $TAO #Bittensor #TAO価格分析#
構造チェック:市場が $TAO を守っている場所 1時間足は構造優先の読みを提供しています。主なアイデアは、最後のキャンドルを追いかけるのではなく、市場がすでにどこで防御を示しているかを理解することです。17のサポートラインに対して12のレジスタンスラインがあり、17のサポートエリアと12のレジスタンスエリアはピボットフィルターを通過するのに十分強いです。HolderStatスタイルの場合、重要な部分はベースです:価格が守られたゾーンを尊重し続けるなら、バイヤーはリロードする場所を持っています。そのベースが崩れると、同じレベルがすぐに圧力に変わる可能性があります。視覚的に見えるパターンゾーンは3つあるので、チャートはランダムなノイズではなく、流動性が待機している場所の地図です。現在の読み:サポートが現在の構造をコントロールしています。ムーブを呼ぶ前に、最も近いラインの近くで次の反応を観察してください。 ✅さらに分析はこちら:t.me/holderstat $TAO #Bittensor #TAO価格分析#
·
--
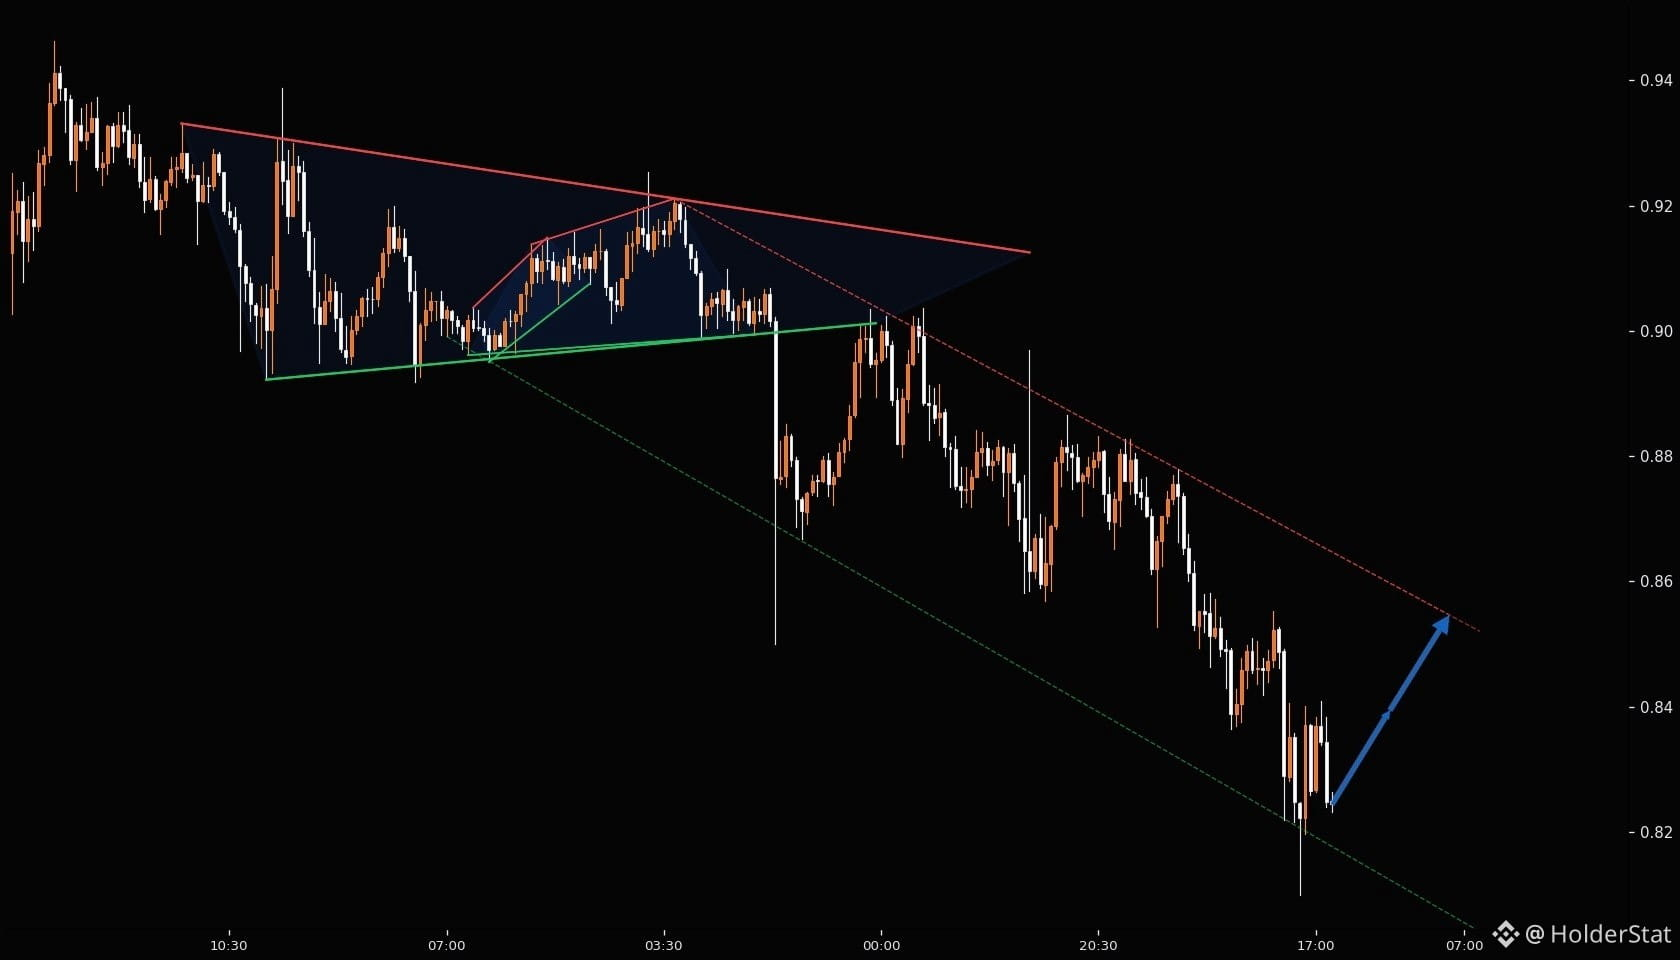
$SUI ホルダー マップ: サポートが物語を語っている $SUIの30分足は構造的な読みを提供しています。主要な考え方は、最後のキャンドルを追いかけるのではなく、市場がすでに防御を示した場所を理解することです。17のサポートラインに対して13のレジスタンスラインが見られ、17のサポートエリアと13のレジスタンスエリアはピボットフィルターを通過するのに十分強いです。HolderStatスタイルでは、重要なのはベースです: 価格が防御されたゾーンを尊重し続ける限り、バイヤーは再度エントリーする場所を持っています。そのベースが破られると、同じレベルはすぐにプレッシャーに変わる可能性があります。視認可能なパターンゾーンが2つあるため、チャートはランダムノイズではなく、流動性が待機している場所の地図です。現在の読み: サポートが現在の構造を制御しています。動きを呼ぶ前に、最も近いライン付近の次の反応を見守りましょう。 ✅さらなる分析はこちら : t.me/holderstat $SUI #Sui #SUI価格分析#
$SUI ホルダー マップ: サポートが物語を語っている $SUIの30分足は構造的な読みを提供しています。主要な考え方は、最後のキャンドルを追いかけるのではなく、市場がすでに防御を示した場所を理解することです。17のサポートラインに対して13のレジスタンスラインが見られ、17のサポートエリアと13のレジスタンスエリアはピボットフィルターを通過するのに十分強いです。HolderStatスタイルでは、重要なのはベースです: 価格が防御されたゾーンを尊重し続ける限り、バイヤーは再度エントリーする場所を持っています。そのベースが破られると、同じレベルはすぐにプレッシャーに変わる可能性があります。視認可能なパターンゾーンが2つあるため、チャートはランダムノイズではなく、流動性が待機している場所の地図です。現在の読み: サポートが現在の構造を制御しています。動きを呼ぶ前に、最も近いライン付近の次の反応を見守りましょう。 ✅さらなる分析はこちら : t.me/holderstat $SUI #Sui #SUI価格分析#
·
--
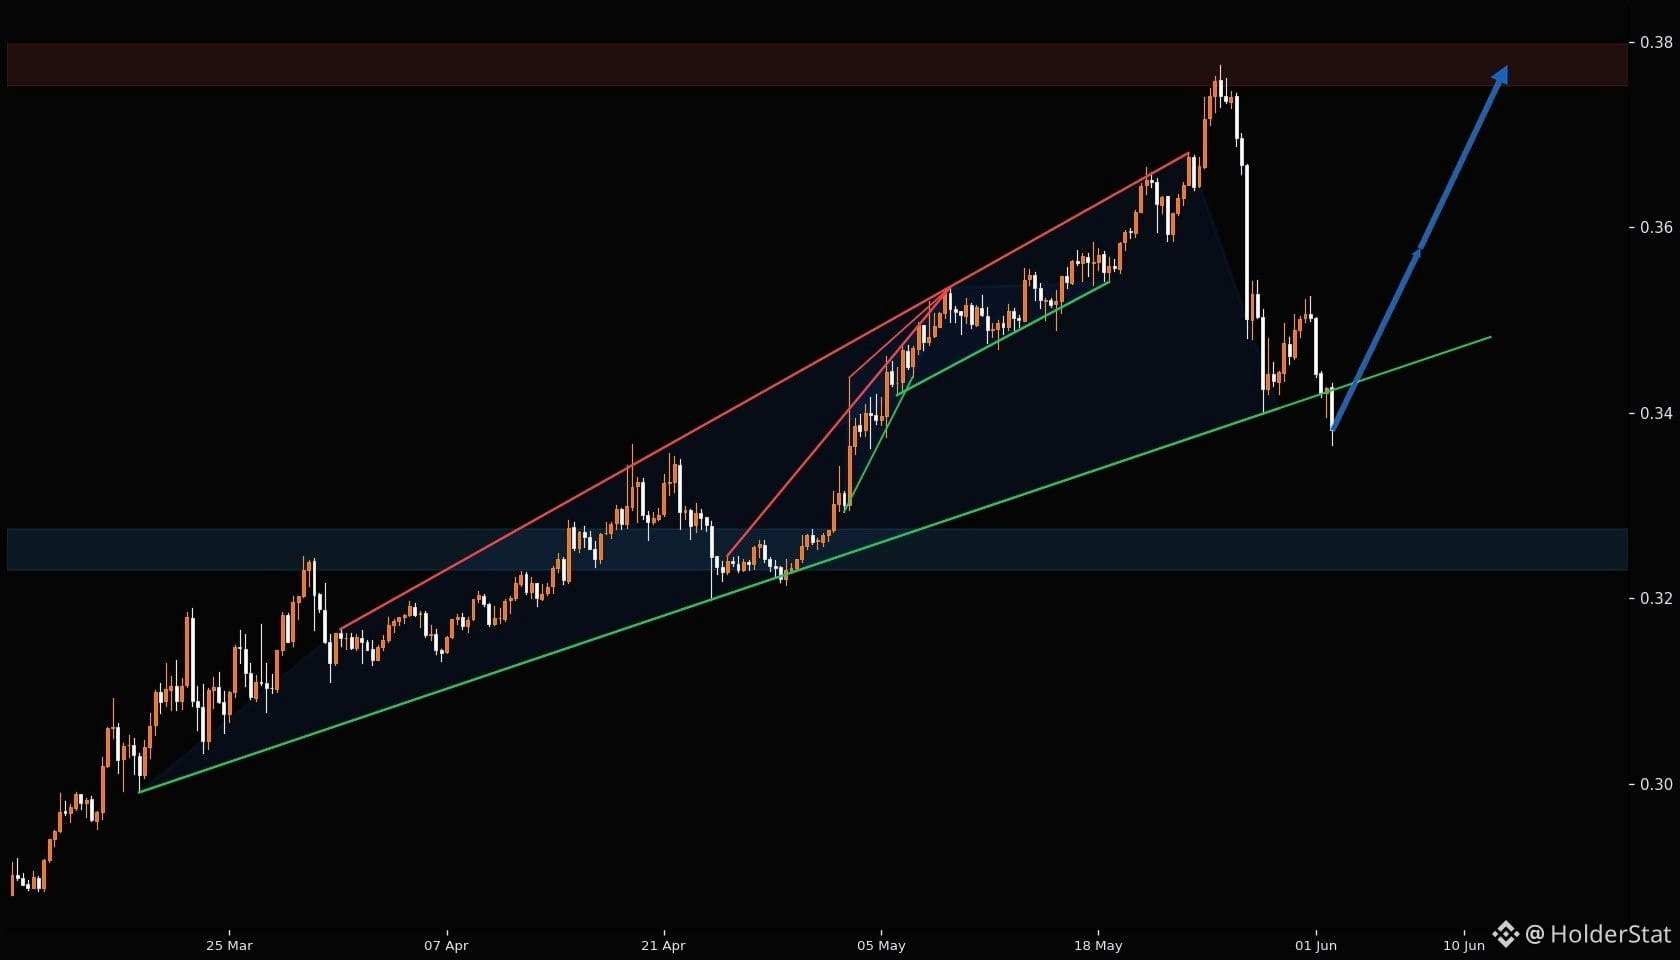
$TRX ベースウォッチ: 現在重要なレベル $TRX の8時間足は、構造的な初見を提供しています。主な考えは、最後のキャンドルを追いかけるのではなく、市場がすでに防御を示した場所を理解することです。12のサポートラインに対して15のレジスタンスラインが見え、12のサポートエリアと15のレジスタンスエリアはピボットフィルターを通過するのに十分強いです。ホルダースタイルでは、重要なのはベースです: 価格が防御ゾーンを尊重し続けるなら、バイヤーはリロードする場所があります。そのベースが崩れると、同じレベルがすぐにプレッシャーに変わる可能性があります。1つの可視パターンゾーンがあるため、チャートはランダムなノイズではなく、流動性が待っている場所の地図です。現在の見解: レジスタンスが主なプレッシャーゾーンです。次の反応を最も近いラインの近くで見てから、動きを呼びかけてください。 ✅詳細な分析はこちら: t.me/holderstat #TRX #TRON #TRX プライス分析#
$TRX ベースウォッチ: 現在重要なレベル $TRX の8時間足は、構造的な初見を提供しています。主な考えは、最後のキャンドルを追いかけるのではなく、市場がすでに防御を示した場所を理解することです。12のサポートラインに対して15のレジスタンスラインが見え、12のサポートエリアと15のレジスタンスエリアはピボットフィルターを通過するのに十分強いです。ホルダースタイルでは、重要なのはベースです: 価格が防御ゾーンを尊重し続けるなら、バイヤーはリロードする場所があります。そのベースが崩れると、同じレベルがすぐにプレッシャーに変わる可能性があります。1つの可視パターンゾーンがあるため、チャートはランダムなノイズではなく、流動性が待っている場所の地図です。現在の見解: レジスタンスが主なプレッシャーゾーンです。次の反応を最も近いラインの近くで見てから、動きを呼びかけてください。 ✅詳細な分析はこちら: t.me/holderstat #TRX #TRON #TRX プライス分析#
71
·
--
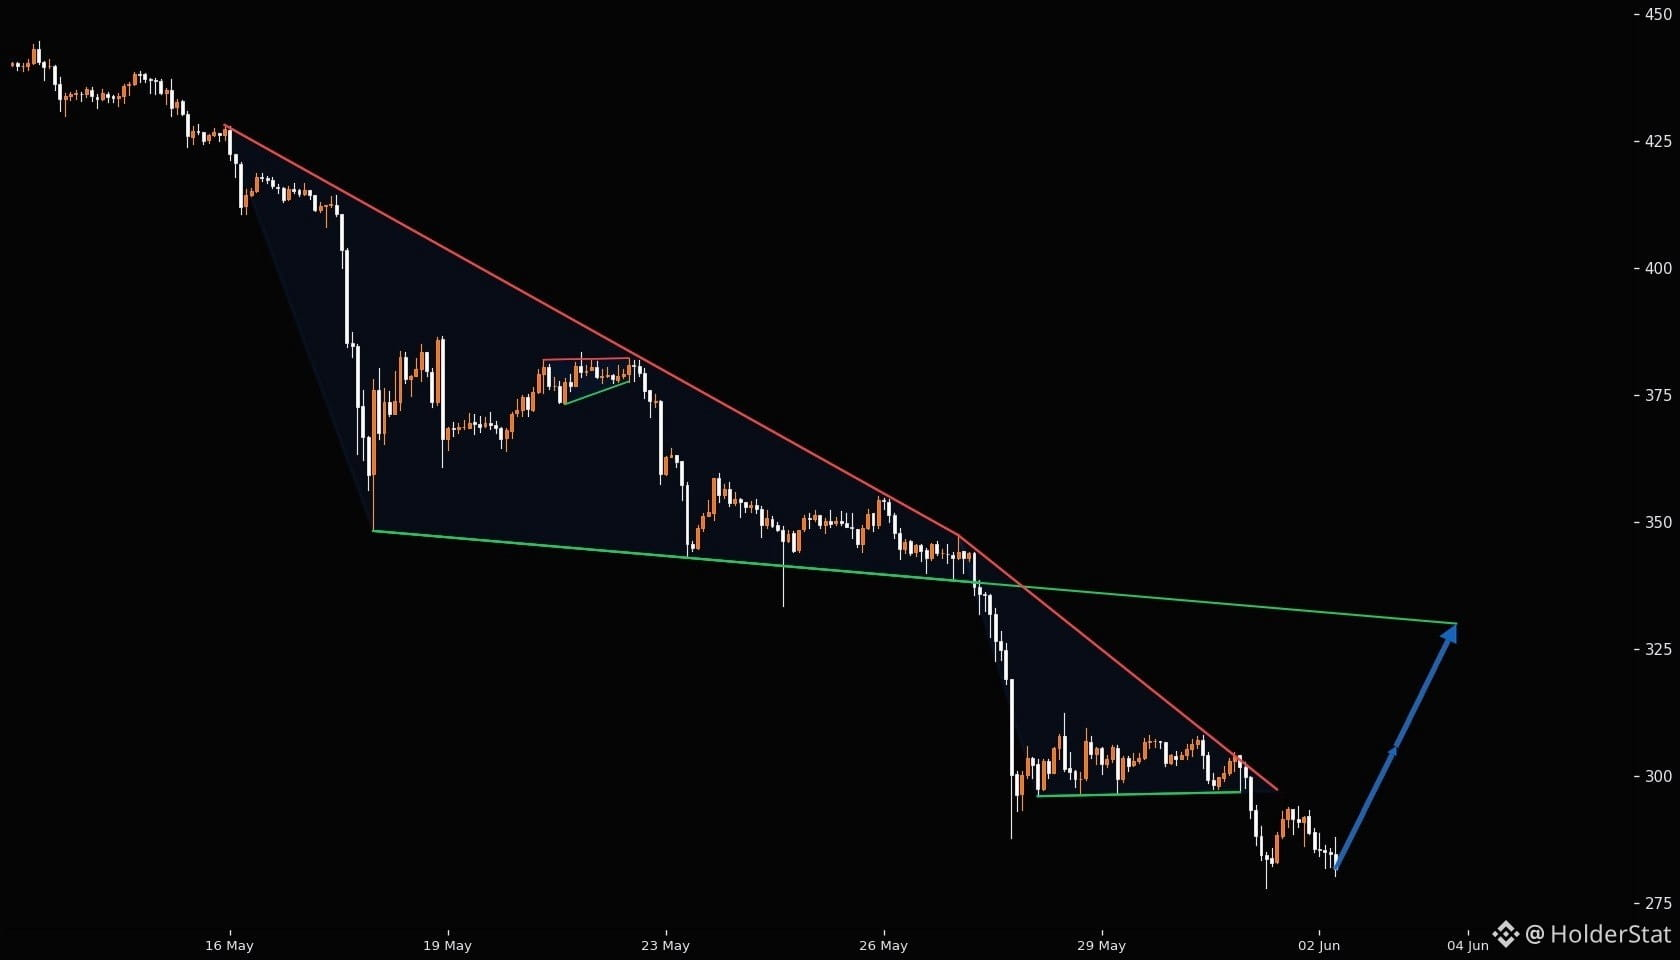
$BCH ホルダーマップ: サポートがストーリーを語る $BCH は2時間足で構造的な読みを提供しています。主なアイデアは最後のキャンドルを追いかけるのではなく、市場がすでに防御を示した場所を理解することです。15のサポートラインに対して16のレジスタンスラインが見え、15のサポートエリアと16のレジスタンスエリアはピボットフィルターを通過するのに十分強力です。HolderStatスタイルでは、重要な部分はベースです: 価格が防御ゾーンを尊重し続けるなら、買い手はまだリロードする場所があります。そのベースが崩れると、同じレベルがすぐにプレッシャーに変わる可能性があります。2つの視覚的なパターンゾーンがあり、チャートはランダムなノイズではありません; それは流動性が待っている可能性のある場所のマップです。現在の読み: レジスタンスが主なプレッシャーゾーンです。次の反応を最も近いラインの近くで見守り、動きを呼びかけてください。 ✅詳細な分析はこちら : t.me/holderstat $BCH #BitcoinCash #BCH プライスアナリシス#
$BCH ホルダーマップ: サポートがストーリーを語る $BCH は2時間足で構造的な読みを提供しています。主なアイデアは最後のキャンドルを追いかけるのではなく、市場がすでに防御を示した場所を理解することです。15のサポートラインに対して16のレジスタンスラインが見え、15のサポートエリアと16のレジスタンスエリアはピボットフィルターを通過するのに十分強力です。HolderStatスタイルでは、重要な部分はベースです: 価格が防御ゾーンを尊重し続けるなら、買い手はまだリロードする場所があります。そのベースが崩れると、同じレベルがすぐにプレッシャーに変わる可能性があります。2つの視覚的なパターンゾーンがあり、チャートはランダムなノイズではありません; それは流動性が待っている可能性のある場所のマップです。現在の読み: レジスタンスが主なプレッシャーゾーンです。次の反応を最も近いラインの近くで見守り、動きを呼びかけてください。 ✅詳細な分析はこちら : t.me/holderstat $BCH #BitcoinCash #BCH プライスアナリシス#
2
·
--
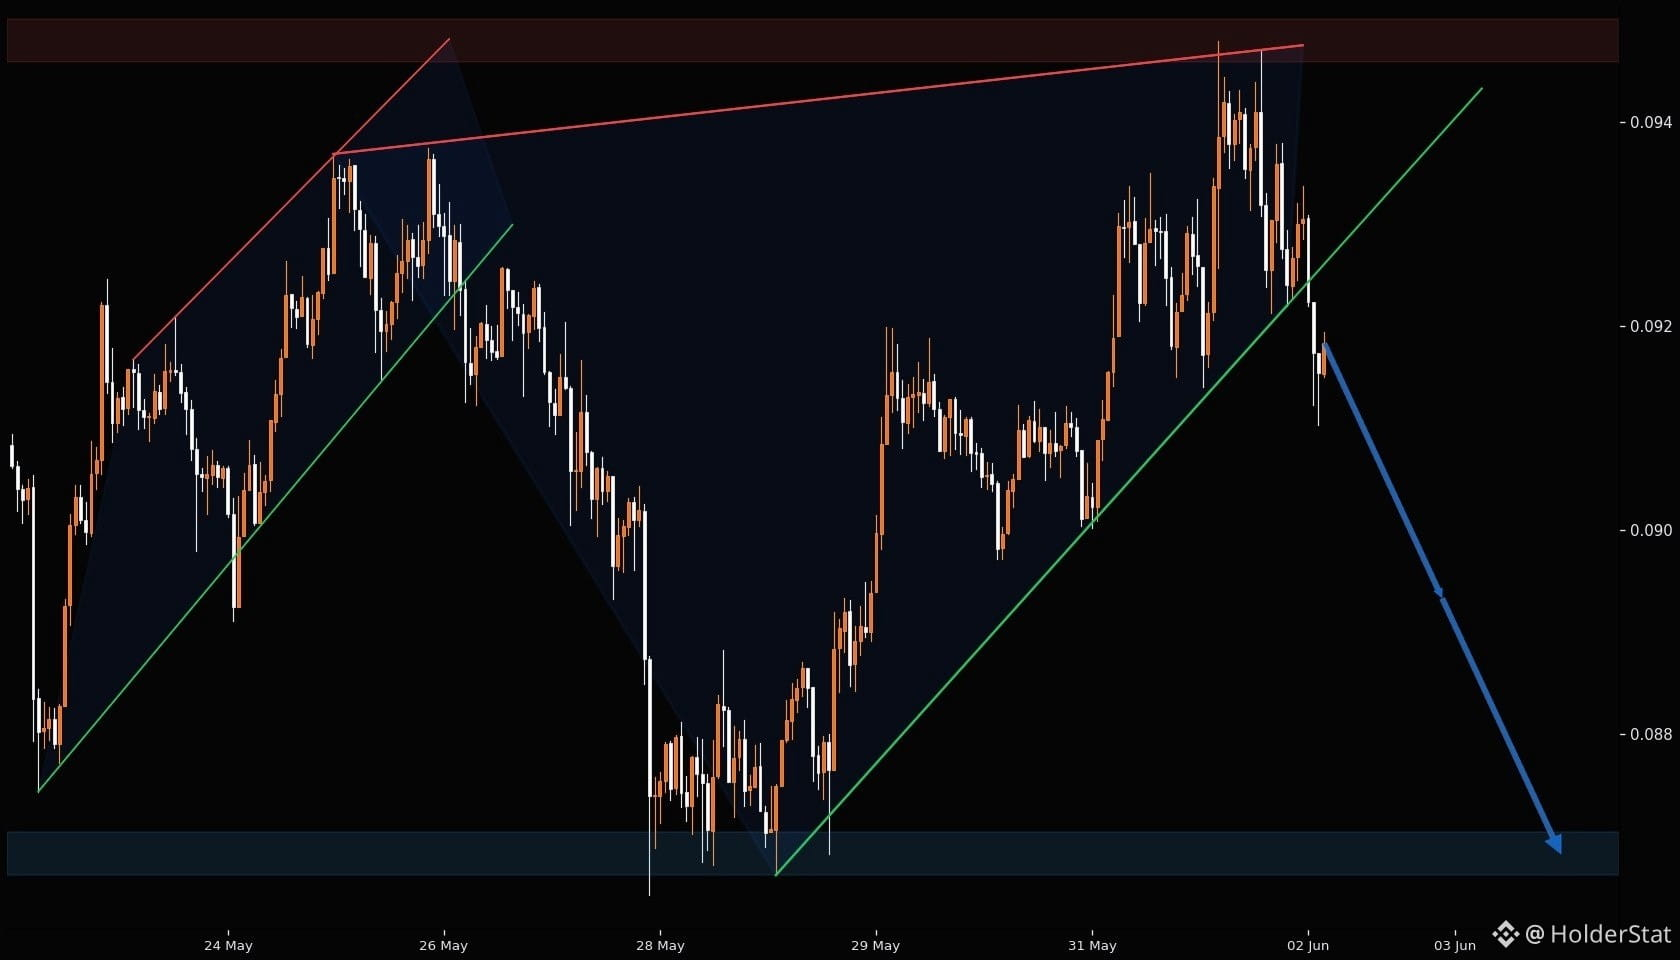
$POL ホルダー マップ: サポートがストーリーを語っている $POL 1時間足は構造優先のリーディングを提供しています。主な考えは最後のキャンドルを追いかけるのではなく、市場がすでに防御を示した場所を理解することです。12のサポートラインに対して14のレジスタンスラインがあり、12のサポートエリアと14のレジスタンスエリアはピボットフィルターを通過するのに十分強いです。HolderStatスタイルにとって重要な部分はベースです: 価格が防御されたゾーンを尊重し続ける限り、バイヤーには再ローディングする場所があります。そのベースが破られると、同じレベルはすぐにプレッシャーに変わる可能性があります。2つの可視パターンゾーンがあり、チャートは無作為なノイズではなく、流動性が待機している可能性のある場所のマップです。現在のリーディング: レジスタンスが主要なプレッシャーゾーンです。ムーブを呼び出す前に、最も近いライン付近での次の反応を観察してください。 ✅詳細な分析はこちら: t.me/holderstat $POL #Polygon #POL 価格分析#
$POL ホルダー マップ: サポートがストーリーを語っている $POL 1時間足は構造優先のリーディングを提供しています。主な考えは最後のキャンドルを追いかけるのではなく、市場がすでに防御を示した場所を理解することです。12のサポートラインに対して14のレジスタンスラインがあり、12のサポートエリアと14のレジスタンスエリアはピボットフィルターを通過するのに十分強いです。HolderStatスタイルにとって重要な部分はベースです: 価格が防御されたゾーンを尊重し続ける限り、バイヤーには再ローディングする場所があります。そのベースが破られると、同じレベルはすぐにプレッシャーに変わる可能性があります。2つの可視パターンゾーンがあり、チャートは無作為なノイズではなく、流動性が待機している可能性のある場所のマップです。現在のリーディング: レジスタンスが主要なプレッシャーゾーンです。ムーブを呼び出す前に、最も近いライン付近での次の反応を観察してください。 ✅詳細な分析はこちら: t.me/holderstat $POL #Polygon #POL 価格分析#
ログインして、さらにコンテンツを読む
厳選トピックで世界の暗号資産トレーダーの仲間入り
⚡️ 暗号資産に関する最新かつ有益な情報が見つかります。
💬 世界最大の暗号資産取引所から信頼されています。
👍 認証を受けたクリエイターから、有益なインサイトを得られます。
メール / 電話番号