

Ông Chú Trader
99 投稿

Ông Chú Trader
報告
ユーザーをブロック
Set-up giao dịch chất lượng: Cập nhật tín hiệu giao dịch mỗi ngày dựa trên phân tích kỹ thuật (TA) vững chắc. Kèm theo quản lý rủi ro chặt chẽ.
取引を発注
高頻度トレーダー
5.2年
92 フォロー
1.0K+ フォロワー
140 いいね
投稿
ポートフォリオ
すべて
ライブ
#BNB/USDT
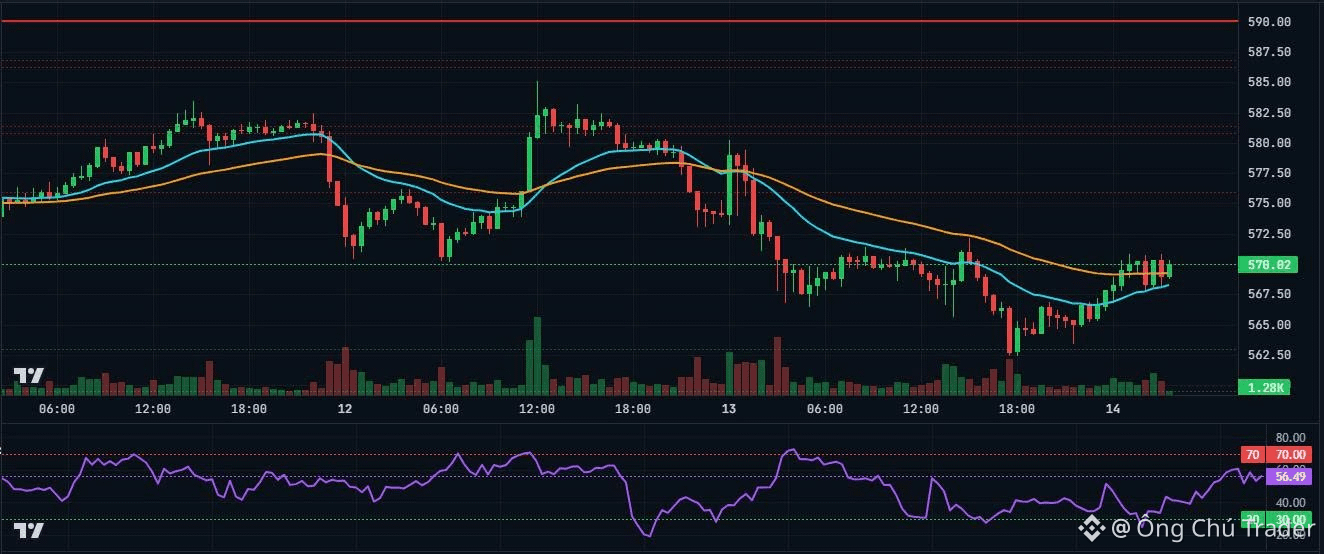
📉 トレンド:横ばい。
$562.52まで急落した後、価格は蓄積の兆しを見せており、徐々に回復しているようで、切り上がる安値を形成しつつ、EMA 20の軸付近で上下に振れています。
🔹 サポート:
$567.00 – $568.00(短期のコンフルエンス:Fib 0.786、中段ボリンジャーバンド、EMA 20)
$564.50 – $565.50(直近のリバウンドで形成された小さな切り上がり安値)
$562.50 – $563.00(重要なスイング安値の下支え / Fib 1.0)
🔸 レジスタンス:
$571.00 – $572.00(Fib 0.618 と上側ボリンジャーバンドのコンフルエンス領域)
$573.00 – $574.50(EMA 200 と Fib 0.50からなる強い壁)
$576.45 – $578.40(Fib 0.382 とスイング・ピボットのレジスタンス)
⚙️ 価格シナリオ:
✅ 継続:価格が $567 – $568 のベース(EMA 20 + Fib 0.786)でうまく反応する場合、ロングエントリーを検討。目標は上限の $571 付近、そして $573 あたりの強い EMA 200 レジスタンス。
❌ 押し戻し:価格が $571 – $572 のゾーンで強い拒否(弱気のリバーサル・キャンドル)を受けた場合、短期のスキャル・ショートを検討。目標は $568 – $565 の下方向ラインの再テスト。
⚠️ 注意:情報提供のみです。ご自身のリスク管理を行ってください。
$BNB #BinanceSquare #CryptoTrading #TechnicalAnalysis
#BNB/USDT
📉 トレンド:横ばい。
$562.52まで急落した後、価格は蓄積の兆しを見せており、徐々に回復しているようで、切り上がる安値を形成しつつ、EMA 20の軸付近で上下に振れています。
🔹 サポート:
$567.00 – $568.00(短期のコンフルエンス:Fib 0.786、中段ボリンジャーバンド、EMA 20)
$564.50 – $565.50(直近のリバウンドで形成された小さな切り上がり安値)
$562.50 – $563.00(重要なスイング安値の下支え / Fib 1.0)
🔸 レジスタンス:
$571.00 – $572.00(Fib 0.618 と上側ボリンジャーバンドのコンフルエンス領域)
$573.00 – $574.50(EMA 200 と Fib 0.50からなる強い壁)
$576.45 – $578.40(Fib 0.382 とスイング・ピボットのレジスタンス)
⚙️ 価格シナリオ:
✅ 継続:価格が $567 – $568 のベース(EMA 20 + Fib 0.786)でうまく反応する場合、ロングエントリーを検討。目標は上限の $571 付近、そして $573 あたりの強い EMA 200 レジスタンス。
❌ 押し戻し:価格が $571 – $572 のゾーンで強い拒否(弱気のリバーサル・キャンドル)を受けた場合、短期のスキャル・ショートを検討。目標は $568 – $565 の下方向ラインの再テスト。
⚠️ 注意:情報提供のみです。ご自身のリスク管理を行ってください。
$BNB #BinanceSquare #CryptoTrading #TechnicalAnalysis
📉 トレンド:横ばい。
$562.52まで急落した後、価格は蓄積の兆しを見せており、徐々に回復しているようで、切り上がる安値を形成しつつ、EMA 20の軸付近で上下に振れています。
🔹 サポート:
$567.00 – $568.00(短期のコンフルエンス:Fib 0.786、中段ボリンジャーバンド、EMA 20)
$564.50 – $565.50(直近のリバウンドで形成された小さな切り上がり安値)
$562.50 – $563.00(重要なスイング安値の下支え / Fib 1.0)
🔸 レジスタンス:
$571.00 – $572.00(Fib 0.618 と上側ボリンジャーバンドのコンフルエンス領域)
$573.00 – $574.50(EMA 200 と Fib 0.50からなる強い壁)
$576.45 – $578.40(Fib 0.382 とスイング・ピボットのレジスタンス)
⚙️ 価格シナリオ:
✅ 継続:価格が $567 – $568 のベース(EMA 20 + Fib 0.786)でうまく反応する場合、ロングエントリーを検討。目標は上限の $571 付近、そして $573 あたりの強い EMA 200 レジスタンス。
❌ 押し戻し:価格が $571 – $572 のゾーンで強い拒否(弱気のリバーサル・キャンドル)を受けた場合、短期のスキャル・ショートを検討。目標は $568 – $565 の下方向ラインの再テスト。
⚠️ 注意:情報提供のみです。ご自身のリスク管理を行ってください。
$BNB #BinanceSquare #CryptoTrading #TechnicalAnalysis
112
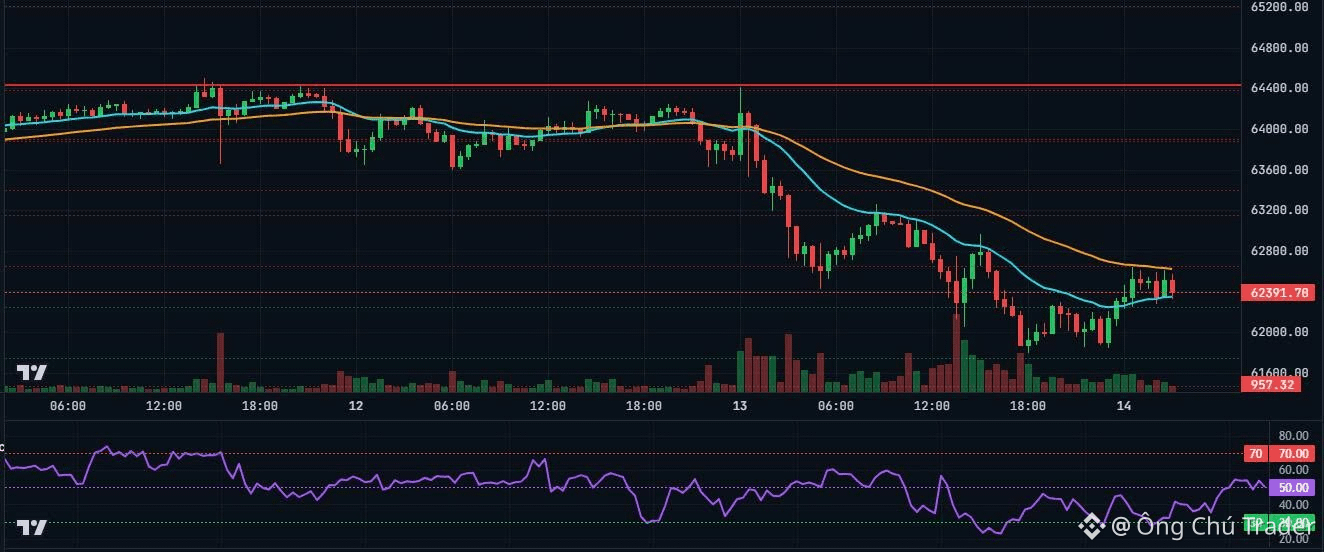
#BTC/USDT
📉 トレンド:急落($64.4kからの下落)に続く短期的な弱気の構造。価格は現在、$61.8kのローカル安値からの反発局面(押し目)にあります。
🔹 サポート:
$62,350 – $62,365(Fib 0.786 と EMA 20 が重なるコンフルエンスゾーンで、反発の勢いを維持)
$61,775 – $61,806(直近のスイング安値 / 下部ボリンジャーバンド境界)
$61,500(心理的サポートおよび下方向の流動性ポケット)
🔸 レジスタンス:
$62,623 – $62,801(EMA 50、上部ボリンジャーバンド、Fib 0.618 の直近レジスタンス・クラスター)
$63,108 – $63,262(Fib 0.50 と EMA 200 の重要な構造的トレンド障壁)
$63,416 – $63,495(Fib 0.382 とスイング・ピボットのレジスタンス)
⚙️ 価格シナリオ:
✅ 継続:$62,800のクラスター(Fib 0.618)を明確にブレイクし、ローソク足がその上で終値確定すれば、回復は維持され、$63,100 – $63,260 付近のEMA 200の再テストがターゲットとなります。
❌ 押し戻し:$62,620 – $62,800 のクラスター(EMA 50 / Fib 0.618)で強い拒否(リジェクション)が起きると、安値切り下げの「Lower High」構造が形成され、価格は $61,800 の底を再テスト、またはさらに深い流動性を刈りにいく可能性があります。
⚠️ 免責事項:情報提供のみです。自己の判断でリスク管理を行ってください。
$BTC #BinanceSquare #CryptoTrading #TechnicalAnalysis
#BTC/USDT
📉 トレンド:急落($64.4kからの下落)に続く短期的な弱気の構造。価格は現在、$61.8kのローカル安値からの反発局面(押し目)にあります。
🔹 サポート:
$62,350 – $62,365(Fib 0.786 と EMA 20 が重なるコンフルエンスゾーンで、反発の勢いを維持)
$61,775 – $61,806(直近のスイング安値 / 下部ボリンジャーバンド境界)
$61,500(心理的サポートおよび下方向の流動性ポケット)
🔸 レジスタンス:
$62,623 – $62,801(EMA 50、上部ボリンジャーバンド、Fib 0.618 の直近レジスタンス・クラスター)
$63,108 – $63,262(Fib 0.50 と EMA 200 の重要な構造的トレンド障壁)
$63,416 – $63,495(Fib 0.382 とスイング・ピボットのレジスタンス)
⚙️ 価格シナリオ:
✅ 継続:$62,800のクラスター(Fib 0.618)を明確にブレイクし、ローソク足がその上で終値確定すれば、回復は維持され、$63,100 – $63,260 付近のEMA 200の再テストがターゲットとなります。
❌ 押し戻し:$62,620 – $62,800 のクラスター(EMA 50 / Fib 0.618)で強い拒否(リジェクション)が起きると、安値切り下げの「Lower High」構造が形成され、価格は $61,800 の底を再テスト、またはさらに深い流動性を刈りにいく可能性があります。
⚠️ 免責事項:情報提供のみです。自己の判断でリスク管理を行ってください。
$BTC #BinanceSquare #CryptoTrading #TechnicalAnalysis
📉 トレンド:急落($64.4kからの下落)に続く短期的な弱気の構造。価格は現在、$61.8kのローカル安値からの反発局面(押し目)にあります。
🔹 サポート:
$62,350 – $62,365(Fib 0.786 と EMA 20 が重なるコンフルエンスゾーンで、反発の勢いを維持)
$61,775 – $61,806(直近のスイング安値 / 下部ボリンジャーバンド境界)
$61,500(心理的サポートおよび下方向の流動性ポケット)
🔸 レジスタンス:
$62,623 – $62,801(EMA 50、上部ボリンジャーバンド、Fib 0.618 の直近レジスタンス・クラスター)
$63,108 – $63,262(Fib 0.50 と EMA 200 の重要な構造的トレンド障壁)
$63,416 – $63,495(Fib 0.382 とスイング・ピボットのレジスタンス)
⚙️ 価格シナリオ:
✅ 継続:$62,800のクラスター(Fib 0.618)を明確にブレイクし、ローソク足がその上で終値確定すれば、回復は維持され、$63,100 – $63,260 付近のEMA 200の再テストがターゲットとなります。
❌ 押し戻し:$62,620 – $62,800 のクラスター(EMA 50 / Fib 0.618)で強い拒否(リジェクション)が起きると、安値切り下げの「Lower High」構造が形成され、価格は $61,800 の底を再テスト、またはさらに深い流動性を刈りにいく可能性があります。
⚠️ 免責事項:情報提供のみです。自己の判断でリスク管理を行ってください。
$BTC #BinanceSquare #CryptoTrading #TechnicalAnalysis
92
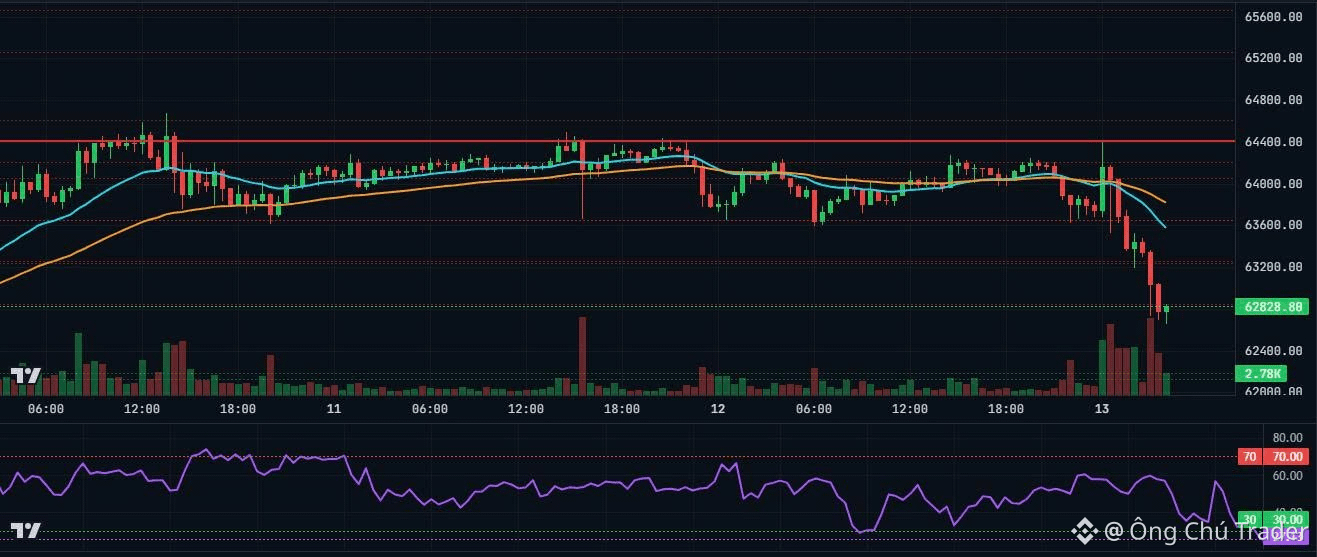
#BTC/USDT
📉 トレンド:短期的に弱気(EMA 20 < EMA 50)/RSIは売られ過ぎ。
現在の価格は約$63,045.2で推移しています。
週間プロファイル:PWH $64,691.9 / PWL $61,297.0(強気の構造)。
🔹 サポート:
$61,406.0 – $61,658.2(直近のサポート・ゾーン)
$61,658.2 – $61,910.4(相関するサポートのフロア)
🔸 レジスタンス:
$63,378.3 – $63,630.5(Fib 0.618のレジスタンス・クラスター)
$64,180.0 – $64,432.2(Fib 0.0%の上値供給)
⚙️ 価格シナリオ:
✅ 継続:$63,504.4を上回る足の終値で勢いが上方向に切り替わり、次の構造的な水準である約$64,306.1を目指す可能性があります。
❌ 押し戻し:価格が$61,532.1を下抜けると、$61,784.3付近へ反転し、買いの勢いを再生成するかもしれません。
⚠️ 免責事項:情報提供のみを目的としています。ご自身のリスク管理を行ってください。
$BTC #BinanceSquare #CryptoTrading #TechnicalAnalysis
#BTC/USDT
📉 トレンド:短期的に弱気(EMA 20 < EMA 50)/RSIは売られ過ぎ。
現在の価格は約$63,045.2で推移しています。
週間プロファイル:PWH $64,691.9 / PWL $61,297.0(強気の構造)。
🔹 サポート:
$61,406.0 – $61,658.2(直近のサポート・ゾーン)
$61,658.2 – $61,910.4(相関するサポートのフロア)
🔸 レジスタンス:
$63,378.3 – $63,630.5(Fib 0.618のレジスタンス・クラスター)
$64,180.0 – $64,432.2(Fib 0.0%の上値供給)
⚙️ 価格シナリオ:
✅ 継続:$63,504.4を上回る足の終値で勢いが上方向に切り替わり、次の構造的な水準である約$64,306.1を目指す可能性があります。
❌ 押し戻し:価格が$61,532.1を下抜けると、$61,784.3付近へ反転し、買いの勢いを再生成するかもしれません。
⚠️ 免責事項:情報提供のみを目的としています。ご自身のリスク管理を行ってください。
$BTC #BinanceSquare #CryptoTrading #TechnicalAnalysis
📉 トレンド:短期的に弱気(EMA 20 < EMA 50)/RSIは売られ過ぎ。
現在の価格は約$63,045.2で推移しています。
週間プロファイル:PWH $64,691.9 / PWL $61,297.0(強気の構造)。
🔹 サポート:
$61,406.0 – $61,658.2(直近のサポート・ゾーン)
$61,658.2 – $61,910.4(相関するサポートのフロア)
🔸 レジスタンス:
$63,378.3 – $63,630.5(Fib 0.618のレジスタンス・クラスター)
$64,180.0 – $64,432.2(Fib 0.0%の上値供給)
⚙️ 価格シナリオ:
✅ 継続:$63,504.4を上回る足の終値で勢いが上方向に切り替わり、次の構造的な水準である約$64,306.1を目指す可能性があります。
❌ 押し戻し:価格が$61,532.1を下抜けると、$61,784.3付近へ反転し、買いの勢いを再生成するかもしれません。
⚠️ 免責事項:情報提供のみを目的としています。ご自身のリスク管理を行ってください。
$BTC #BinanceSquare #CryptoTrading #TechnicalAnalysis
73
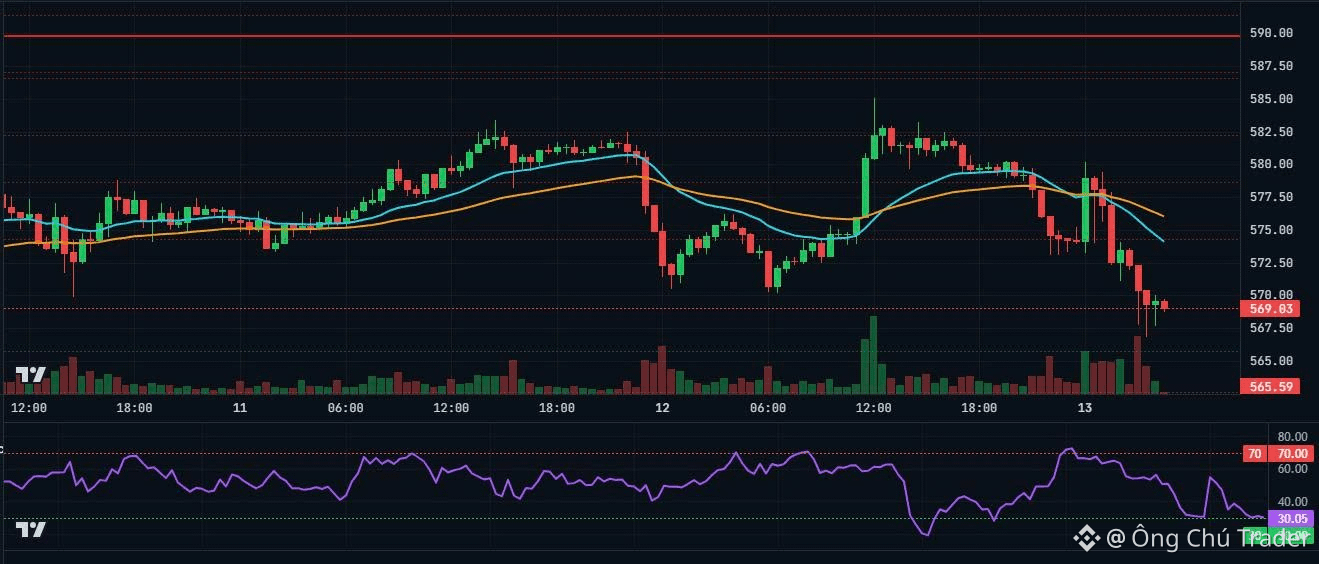
#BNB/USDT
📉 トレンド:短期は弱気(EMA20 < EMA50)。
現在の価格は約 $569.030 付近で推移しており、移動平均が売り手に有利なため、短期の下押し圧力が続いています。
🔹 サポート:
$555.31 – $558.79(重なり合う需要ゾーンのクラスター)
🔸 レジスタンス:
$579.27 – $581.94(Fib 0.236 レジスタンスのコンフルエンス領域)
⚙️ 価格シナリオ:
✅ 継続:$580.804 を明確に上回る確定足が出れば、短期の構造が切り替わり、上方向への勢いが強まり、より高い目標の奪回へつながる可能性があります。
❌ 押し戻し:価格が $556.450 を下抜けると、買いの勢力を回復するために、$555.31 – $557.59 の基準(ベース)付近まで、より深いテクニカル・リテストのリスクがあります。
⚠️ 注意:情報提供のみを目的としています。自己責任でリスク管理を行ってください。
$BNB #BinanceSquare #CryptoTrading #TechnicalAnalysis
#BNB/USDT
📉 トレンド:短期は弱気(EMA20 < EMA50)。
現在の価格は約 $569.030 付近で推移しており、移動平均が売り手に有利なため、短期の下押し圧力が続いています。
🔹 サポート:
$555.31 – $558.79(重なり合う需要ゾーンのクラスター)
🔸 レジスタンス:
$579.27 – $581.94(Fib 0.236 レジスタンスのコンフルエンス領域)
⚙️ 価格シナリオ:
✅ 継続:$580.804 を明確に上回る確定足が出れば、短期の構造が切り替わり、上方向への勢いが強まり、より高い目標の奪回へつながる可能性があります。
❌ 押し戻し:価格が $556.450 を下抜けると、買いの勢力を回復するために、$555.31 – $557.59 の基準(ベース)付近まで、より深いテクニカル・リテストのリスクがあります。
⚠️ 注意:情報提供のみを目的としています。自己責任でリスク管理を行ってください。
$BNB #BinanceSquare #CryptoTrading #TechnicalAnalysis
📉 トレンド:短期は弱気(EMA20 < EMA50)。
現在の価格は約 $569.030 付近で推移しており、移動平均が売り手に有利なため、短期の下押し圧力が続いています。
🔹 サポート:
$555.31 – $558.79(重なり合う需要ゾーンのクラスター)
🔸 レジスタンス:
$579.27 – $581.94(Fib 0.236 レジスタンスのコンフルエンス領域)
⚙️ 価格シナリオ:
✅ 継続:$580.804 を明確に上回る確定足が出れば、短期の構造が切り替わり、上方向への勢いが強まり、より高い目標の奪回へつながる可能性があります。
❌ 押し戻し:価格が $556.450 を下抜けると、買いの勢力を回復するために、$555.31 – $557.59 の基準(ベース)付近まで、より深いテクニカル・リテストのリスクがあります。
⚠️ 注意:情報提供のみを目的としています。自己責任でリスク管理を行ってください。
$BNB #BinanceSquare #CryptoTrading #TechnicalAnalysis
111
#BTC/USDT
📈 トレンド:強気。
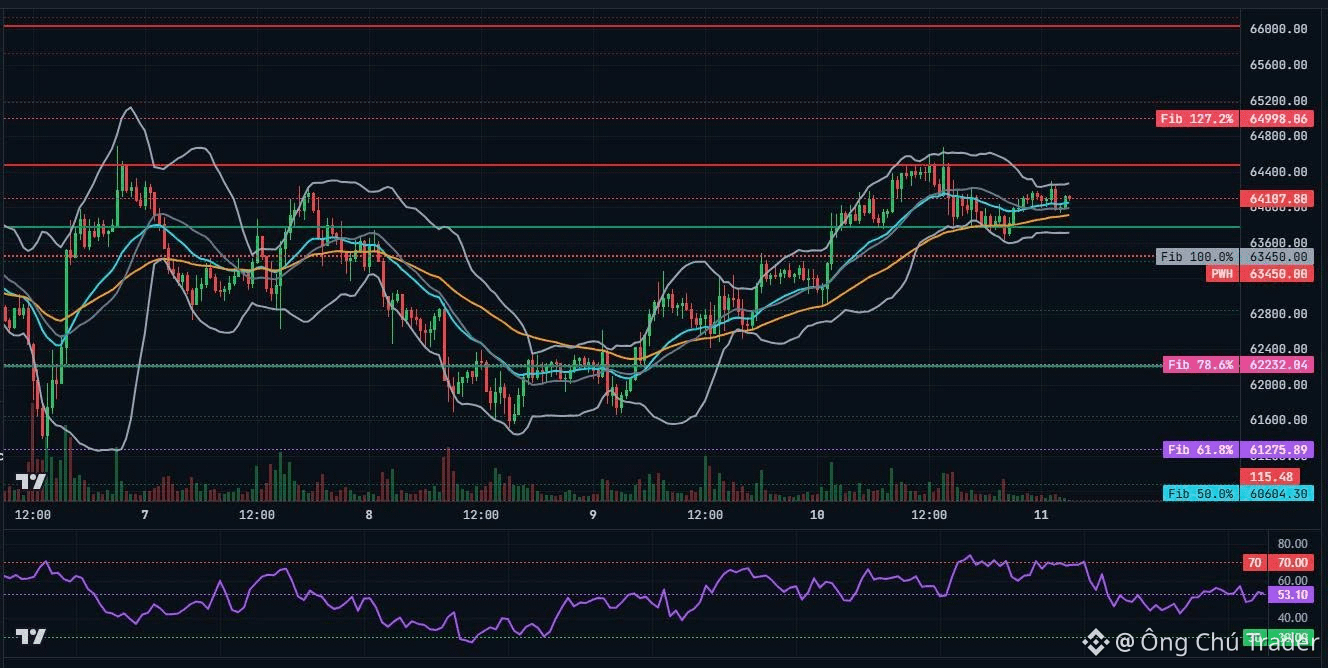
価格は、$64,680の直近高値を付けた後、短期的なレンジでの横ばいの推移(調整局面)にあります。EMA20およびEMA50を大きく上回った状態を維持しており、買い手が主要トレンドを支配していることを示しています。
🔹 サポート:
$63,910 – $63,968(EMA50、Fib 0.236、ミドル・ボリンジャーバンドの合致)
$63,528 – $63,600(直近スイング:$61,666〜$64,680のFib 0.382)
$63,173 – $63,250(Fib 0.50およびEMA200の合致領域)
🔸 レジスタンス:
$64,268 – $64,350(直近の上側ボリンジャーバンド境界)
$64,680 – $64,685(直近のスイング高値/ピークの流動性ゾーン)
$65,000 – $65,200(主要な心理的ラウンドナンバーのクラスター)
✅ 継続:価格が統合中に$63,900を堅持した後、高出来高で$64,300を上抜け、$64,680のピークをクリアして、より高い高値/より高い安値(Higher High/Higher Low)の構造を維持する可能性があります。
❌ 押し戻し:売り手が$63,800の節目を割り込むと、価格はより深く下落し、Fib 0.382($63,528)を試すか、EMA200付近の流動性を取りにいく動きになりやすいです。
📊 戦略:
強気の構造が維持されている間は、価格が狭いレンジ内で圧縮しています。最適なR:Rのエントリーは、構造的な押し目局面、または重要な境界での明確なリジェクト(拒否)時に見つかります。
プラン1(買い):$63,850〜$63,950あたりの押し目でエントリー。SL:$63,600(EMA50およびFib 0.382を下回る)、TP:$64,250〜$64,650。
プラン2(ショート・スキャルプ):$64,500〜$64,680のレジスタンス・ゾーンで、明確な弱気の反転またはダイバージェンスが出た場合に逆張りでショート。SL:$64,850、TP:$64,200〜$63,950。
⚠️ 免責事項:情報提供のみを目的としています。自己の責任でリスク管理を行ってください。
$BTC #BinanceSquare #CryptoTrading #TechnicalAnalysis
#BTC/USDT
📈 トレンド:強気。
価格は、$64,680の直近高値を付けた後、短期的なレンジでの横ばいの推移(調整局面)にあります。EMA20およびEMA50を大きく上回った状態を維持しており、買い手が主要トレンドを支配していることを示しています。
🔹 サポート:
$63,910 – $63,968(EMA50、Fib 0.236、ミドル・ボリンジャーバンドの合致)
$63,528 – $63,600(直近スイング:$61,666〜$64,680のFib 0.382)
$63,173 – $63,250(Fib 0.50およびEMA200の合致領域)
🔸 レジスタンス:
$64,268 – $64,350(直近の上側ボリンジャーバンド境界)
$64,680 – $64,685(直近のスイング高値/ピークの流動性ゾーン)
$65,000 – $65,200(主要な心理的ラウンドナンバーのクラスター)
✅ 継続:価格が統合中に$63,900を堅持した後、高出来高で$64,300を上抜け、$64,680のピークをクリアして、より高い高値/より高い安値(Higher High/Higher Low)の構造を維持する可能性があります。
❌ 押し戻し:売り手が$63,800の節目を割り込むと、価格はより深く下落し、Fib 0.382($63,528)を試すか、EMA200付近の流動性を取りにいく動きになりやすいです。
📊 戦略:
強気の構造が維持されている間は、価格が狭いレンジ内で圧縮しています。最適なR:Rのエントリーは、構造的な押し目局面、または重要な境界での明確なリジェクト(拒否)時に見つかります。
プラン1(買い):$63,850〜$63,950あたりの押し目でエントリー。SL:$63,600(EMA50およびFib 0.382を下回る)、TP:$64,250〜$64,650。
プラン2(ショート・スキャルプ):$64,500〜$64,680のレジスタンス・ゾーンで、明確な弱気の反転またはダイバージェンスが出た場合に逆張りでショート。SL:$64,850、TP:$64,200〜$63,950。
⚠️ 免責事項:情報提供のみを目的としています。自己の責任でリスク管理を行ってください。
$BTC #BinanceSquare #CryptoTrading #TechnicalAnalysis
📈 トレンド:強気。
価格は、$64,680の直近高値を付けた後、短期的なレンジでの横ばいの推移(調整局面)にあります。EMA20およびEMA50を大きく上回った状態を維持しており、買い手が主要トレンドを支配していることを示しています。
🔹 サポート:
$63,910 – $63,968(EMA50、Fib 0.236、ミドル・ボリンジャーバンドの合致)
$63,528 – $63,600(直近スイング:$61,666〜$64,680のFib 0.382)
$63,173 – $63,250(Fib 0.50およびEMA200の合致領域)
🔸 レジスタンス:
$64,268 – $64,350(直近の上側ボリンジャーバンド境界)
$64,680 – $64,685(直近のスイング高値/ピークの流動性ゾーン)
$65,000 – $65,200(主要な心理的ラウンドナンバーのクラスター)
✅ 継続:価格が統合中に$63,900を堅持した後、高出来高で$64,300を上抜け、$64,680のピークをクリアして、より高い高値/より高い安値(Higher High/Higher Low)の構造を維持する可能性があります。
❌ 押し戻し:売り手が$63,800の節目を割り込むと、価格はより深く下落し、Fib 0.382($63,528)を試すか、EMA200付近の流動性を取りにいく動きになりやすいです。
📊 戦略:
強気の構造が維持されている間は、価格が狭いレンジ内で圧縮しています。最適なR:Rのエントリーは、構造的な押し目局面、または重要な境界での明確なリジェクト(拒否)時に見つかります。
プラン1(買い):$63,850〜$63,950あたりの押し目でエントリー。SL:$63,600(EMA50およびFib 0.382を下回る)、TP:$64,250〜$64,650。
プラン2(ショート・スキャルプ):$64,500〜$64,680のレジスタンス・ゾーンで、明確な弱気の反転またはダイバージェンスが出た場合に逆張りでショート。SL:$64,850、TP:$64,200〜$63,950。
⚠️ 免責事項:情報提供のみを目的としています。自己の責任でリスク管理を行ってください。
$BTC #BinanceSquare #CryptoTrading #TechnicalAnalysis
85
#BTC/USDT
📈 傾向:強い回復。
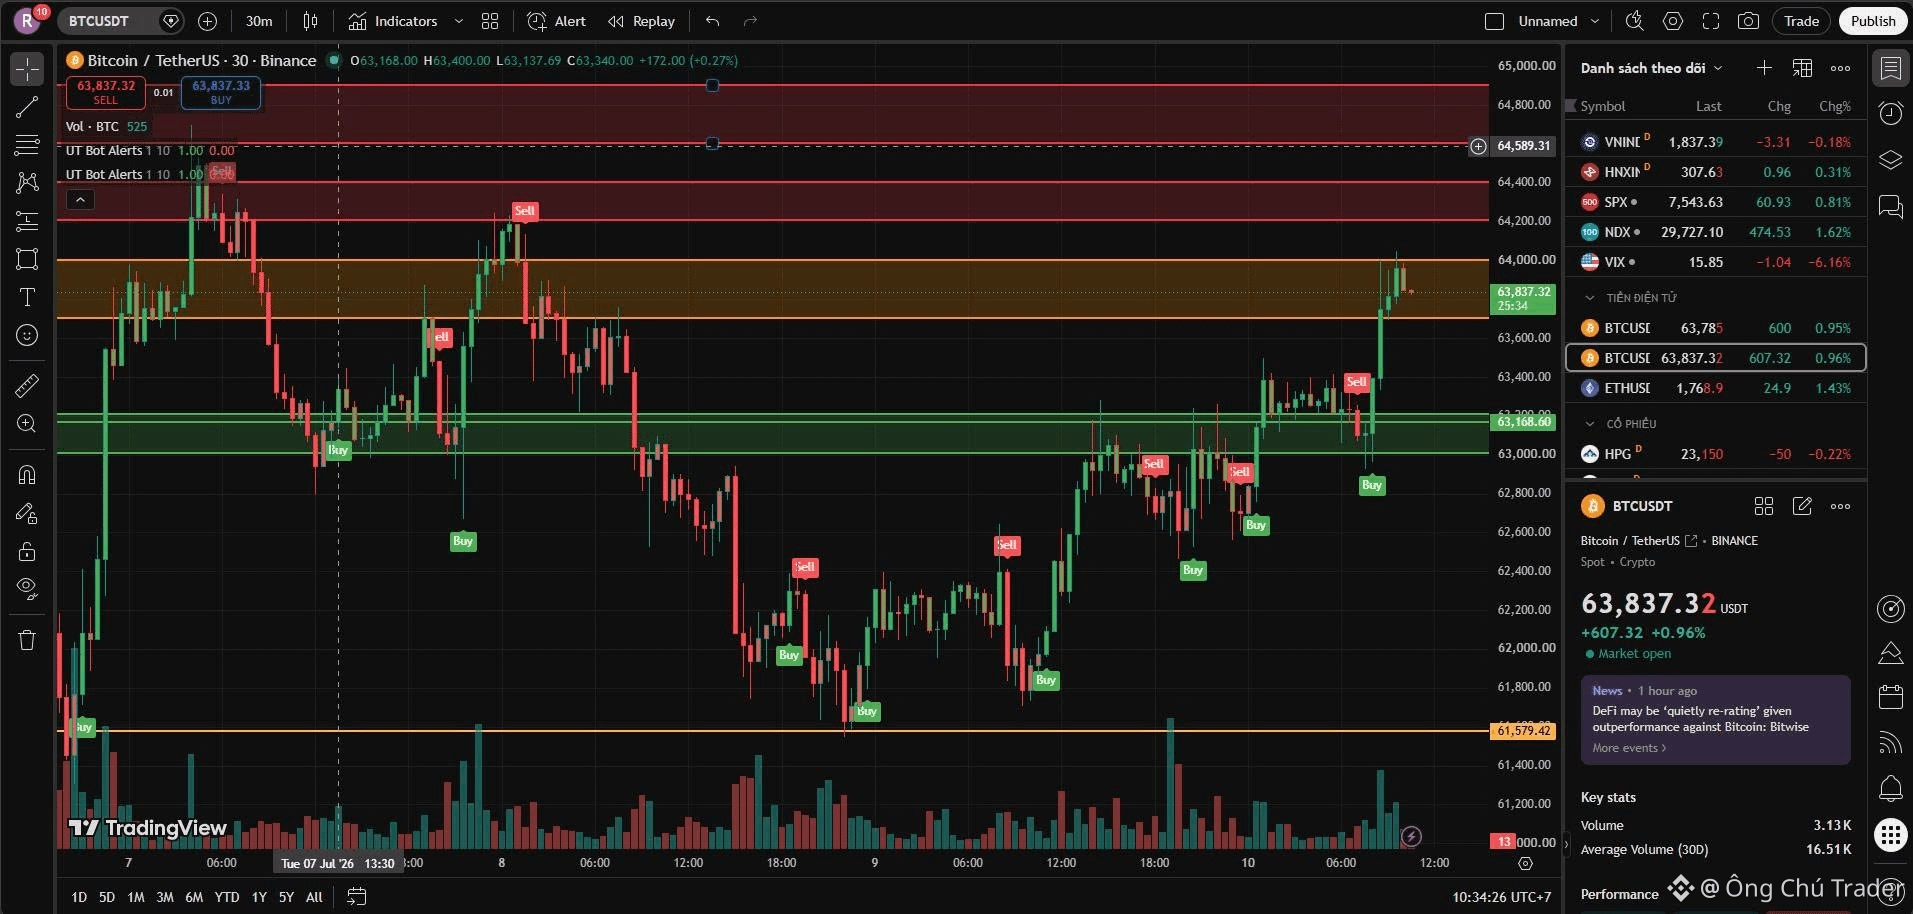
価格は、長い上昇の後に利確の圧力を吸収するため、$63,800 前後で足踏みしています。
🔹 サポート:
$63,000 – $63,200(堅い下支え/反転したレジスタンス帯)
🔸 レジスタンス:
$63,700 – $64,000(短期の値固めレンジ)
$64,200 – $64,400(強いレジスタンス/直近の高値付近)
$64,600 – $64,900(マクロのレジスタンス/旧ディストリビューション帯)
✅ 継続:$64,000 を明確に上抜けて終値が確定すれば、価格は素早く $64,200 – $64,400 の上値目標に挑みに行く可能性があります。
❌ 押し戻し:$63,700 の水準を下回ると、$63,000 – $63,200 の堅いサポート基盤を再テストするために後退するリスクがあります。
📊 戦略:
現在のエリアはリスクが高いので、FOMO(取り残され不安)で追いかけないでください。実行プランを2つ優先しましょう:
$64,000 を超えるクリーンなブレイクを待ち、継続モメンタムを取引する。
$63,000 – $63,200 のサポート帯へ健康的に押し戻されるのを待ち、よりタイトで安全な損切りでポジションを確保する。
⚠️ 注意:情報提供のみです。ご自身の判断でリスク管理を行ってください。
$BTC #BinanceSquare #CryptoTrading #TechnicalAnalysis
#BTC/USDT
📈 傾向:強い回復。
価格は、長い上昇の後に利確の圧力を吸収するため、$63,800 前後で足踏みしています。
🔹 サポート:
$63,000 – $63,200(堅い下支え/反転したレジスタンス帯)
🔸 レジスタンス:
$63,700 – $64,000(短期の値固めレンジ)
$64,200 – $64,400(強いレジスタンス/直近の高値付近)
$64,600 – $64,900(マクロのレジスタンス/旧ディストリビューション帯)
✅ 継続:$64,000 を明確に上抜けて終値が確定すれば、価格は素早く $64,200 – $64,400 の上値目標に挑みに行く可能性があります。
❌ 押し戻し:$63,700 の水準を下回ると、$63,000 – $63,200 の堅いサポート基盤を再テストするために後退するリスクがあります。
📊 戦略:
現在のエリアはリスクが高いので、FOMO(取り残され不安)で追いかけないでください。実行プランを2つ優先しましょう:
$64,000 を超えるクリーンなブレイクを待ち、継続モメンタムを取引する。
$63,000 – $63,200 のサポート帯へ健康的に押し戻されるのを待ち、よりタイトで安全な損切りでポジションを確保する。
⚠️ 注意:情報提供のみです。ご自身の判断でリスク管理を行ってください。
$BTC #BinanceSquare #CryptoTrading #TechnicalAnalysis
📈 傾向:強い回復。
価格は、長い上昇の後に利確の圧力を吸収するため、$63,800 前後で足踏みしています。
🔹 サポート:
$63,000 – $63,200(堅い下支え/反転したレジスタンス帯)
🔸 レジスタンス:
$63,700 – $64,000(短期の値固めレンジ)
$64,200 – $64,400(強いレジスタンス/直近の高値付近)
$64,600 – $64,900(マクロのレジスタンス/旧ディストリビューション帯)
✅ 継続:$64,000 を明確に上抜けて終値が確定すれば、価格は素早く $64,200 – $64,400 の上値目標に挑みに行く可能性があります。
❌ 押し戻し:$63,700 の水準を下回ると、$63,000 – $63,200 の堅いサポート基盤を再テストするために後退するリスクがあります。
📊 戦略:
現在のエリアはリスクが高いので、FOMO(取り残され不安)で追いかけないでください。実行プランを2つ優先しましょう:
$64,000 を超えるクリーンなブレイクを待ち、継続モメンタムを取引する。
$63,000 – $63,200 のサポート帯へ健康的に押し戻されるのを待ち、よりタイトで安全な損切りでポジションを確保する。
⚠️ 注意:情報提供のみです。ご自身の判断でリスク管理を行ってください。
$BTC #BinanceSquare #CryptoTrading #TechnicalAnalysis
81
#BNB/USDT
📈 トレンド:強気のブレイクアウト。
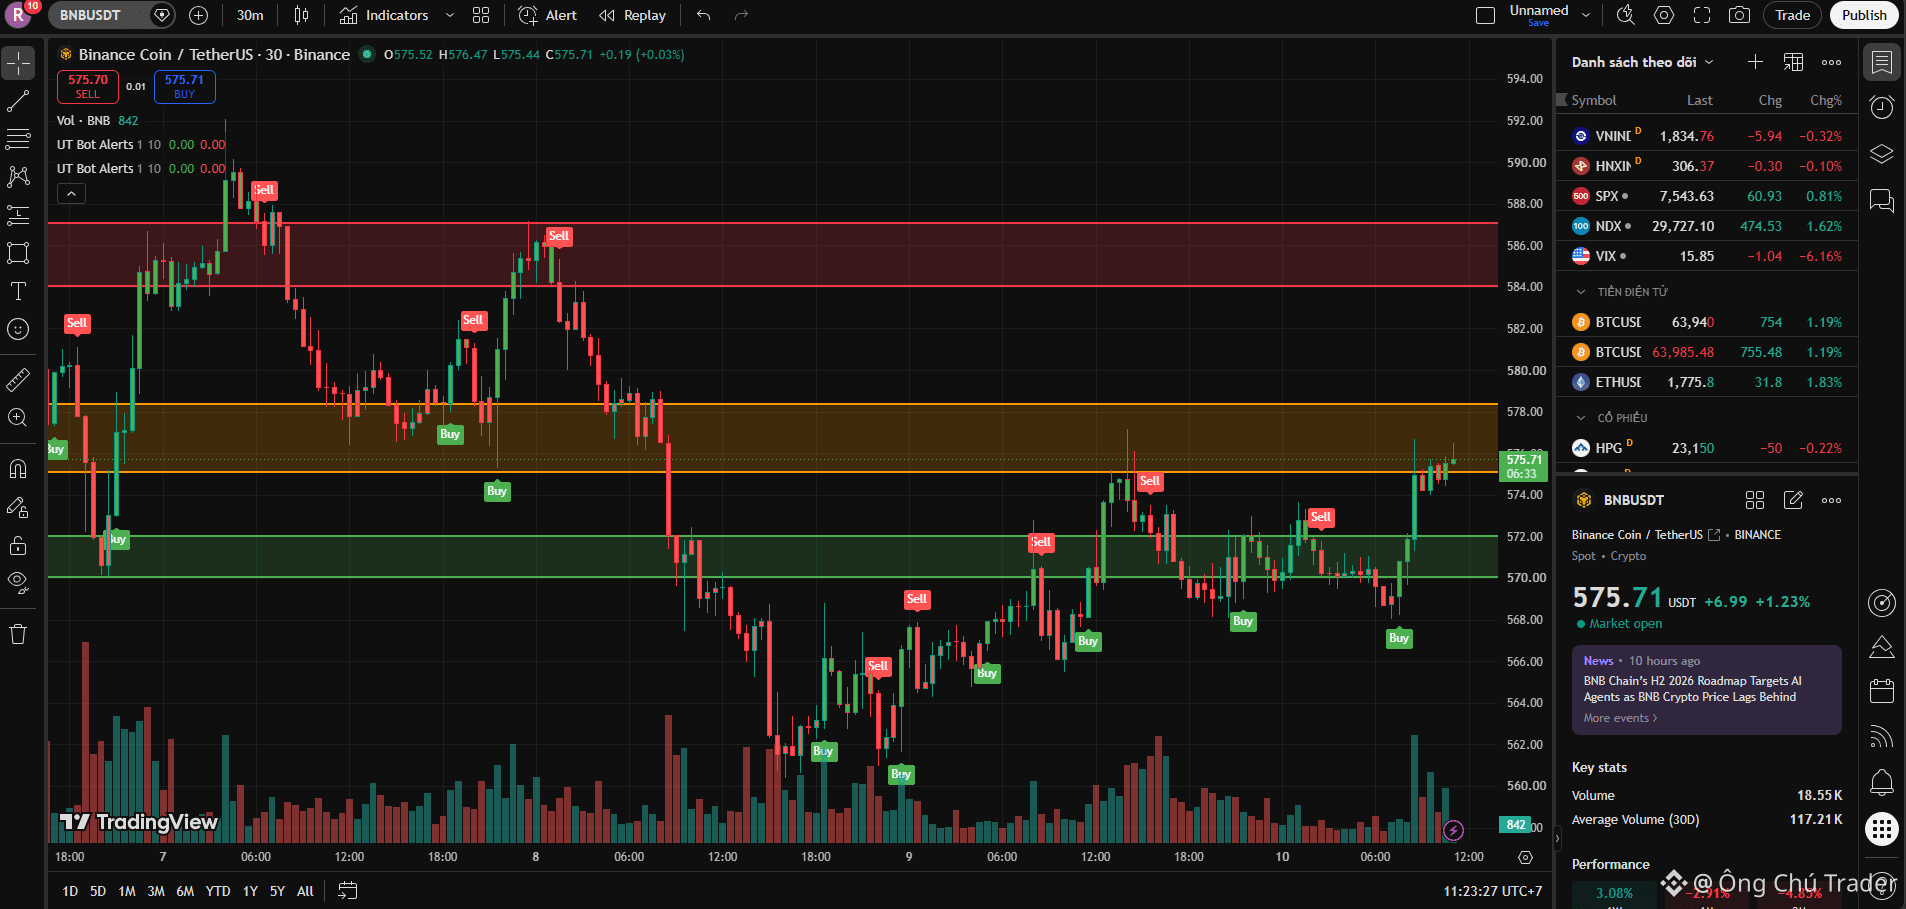
攻めの買いが増加し、BNBを直近の下値(ローカルボトム)から押し上げました。これにより価格は重要な構造的水準を取り戻しています。
🔹 サポート:
$570 – $572(堅い直近の下支え/反転したレジスタンス)
🔸 レジスタンス:
$575 – $578(ローカルの壁/利確ゾーン)
$584 – $587(主要なマクロ構造のサプライ・ゾーン)
✅ 継続:$578を明確に上抜ける確定足が出れば、薄い流動性の壁を越えて$584 – $587のサプライ・クラスターに挑戦する道が開けます。
❌ 押し戻し:勢いが失速し、$575を下抜けるなら、価格は$570 – $572のサポート・ポケットまで後退し、次の新しい土台を作ります。
📊 戦略:
BNBは現在、レンジ中間のレジスタンス領域($575 – $578)ど真ん中で取引されています。ここを追いかけると、リスク対リターン(R:R)比率が不利です。
優先1:安全にブレイクアウトの勢いを買うため、$578を上回るクリーンなローソク足の確定を待ちます。
優先2:$570 – $572のサポート・ゾーンへ健全な押し目が入るまで辛抱強く待ち、最適化したリスク設定でトレンドフォローのロングを組み立てます。
⚠️ 免責事項:情報提供のみを目的としています。自己責任でリスク管理を行ってください。
$BNB #BinanceSquare #CryptoTrading #TechnicalAnalysis
#BNB/USDT
📈 トレンド:強気のブレイクアウト。
攻めの買いが増加し、BNBを直近の下値(ローカルボトム)から押し上げました。これにより価格は重要な構造的水準を取り戻しています。
🔹 サポート:
$570 – $572(堅い直近の下支え/反転したレジスタンス)
🔸 レジスタンス:
$575 – $578(ローカルの壁/利確ゾーン)
$584 – $587(主要なマクロ構造のサプライ・ゾーン)
✅ 継続:$578を明確に上抜ける確定足が出れば、薄い流動性の壁を越えて$584 – $587のサプライ・クラスターに挑戦する道が開けます。
❌ 押し戻し:勢いが失速し、$575を下抜けるなら、価格は$570 – $572のサポート・ポケットまで後退し、次の新しい土台を作ります。
📊 戦略:
BNBは現在、レンジ中間のレジスタンス領域($575 – $578)ど真ん中で取引されています。ここを追いかけると、リスク対リターン(R:R)比率が不利です。
優先1:安全にブレイクアウトの勢いを買うため、$578を上回るクリーンなローソク足の確定を待ちます。
優先2:$570 – $572のサポート・ゾーンへ健全な押し目が入るまで辛抱強く待ち、最適化したリスク設定でトレンドフォローのロングを組み立てます。
⚠️ 免責事項:情報提供のみを目的としています。自己責任でリスク管理を行ってください。
$BNB #BinanceSquare #CryptoTrading #TechnicalAnalysis
📈 トレンド:強気のブレイクアウト。
攻めの買いが増加し、BNBを直近の下値(ローカルボトム)から押し上げました。これにより価格は重要な構造的水準を取り戻しています。
🔹 サポート:
$570 – $572(堅い直近の下支え/反転したレジスタンス)
🔸 レジスタンス:
$575 – $578(ローカルの壁/利確ゾーン)
$584 – $587(主要なマクロ構造のサプライ・ゾーン)
✅ 継続:$578を明確に上抜ける確定足が出れば、薄い流動性の壁を越えて$584 – $587のサプライ・クラスターに挑戦する道が開けます。
❌ 押し戻し:勢いが失速し、$575を下抜けるなら、価格は$570 – $572のサポート・ポケットまで後退し、次の新しい土台を作ります。
📊 戦略:
BNBは現在、レンジ中間のレジスタンス領域($575 – $578)ど真ん中で取引されています。ここを追いかけると、リスク対リターン(R:R)比率が不利です。
優先1:安全にブレイクアウトの勢いを買うため、$578を上回るクリーンなローソク足の確定を待ちます。
優先2:$570 – $572のサポート・ゾーンへ健全な押し目が入るまで辛抱強く待ち、最適化したリスク設定でトレンドフォローのロングを組み立てます。
⚠️ 免責事項:情報提供のみを目的としています。自己責任でリスク管理を行ってください。
$BNB #BinanceSquare #CryptoTrading #TechnicalAnalysis
115
#BNB/USDT
📉 トレンド:弱気/ボトムの揉み合い。
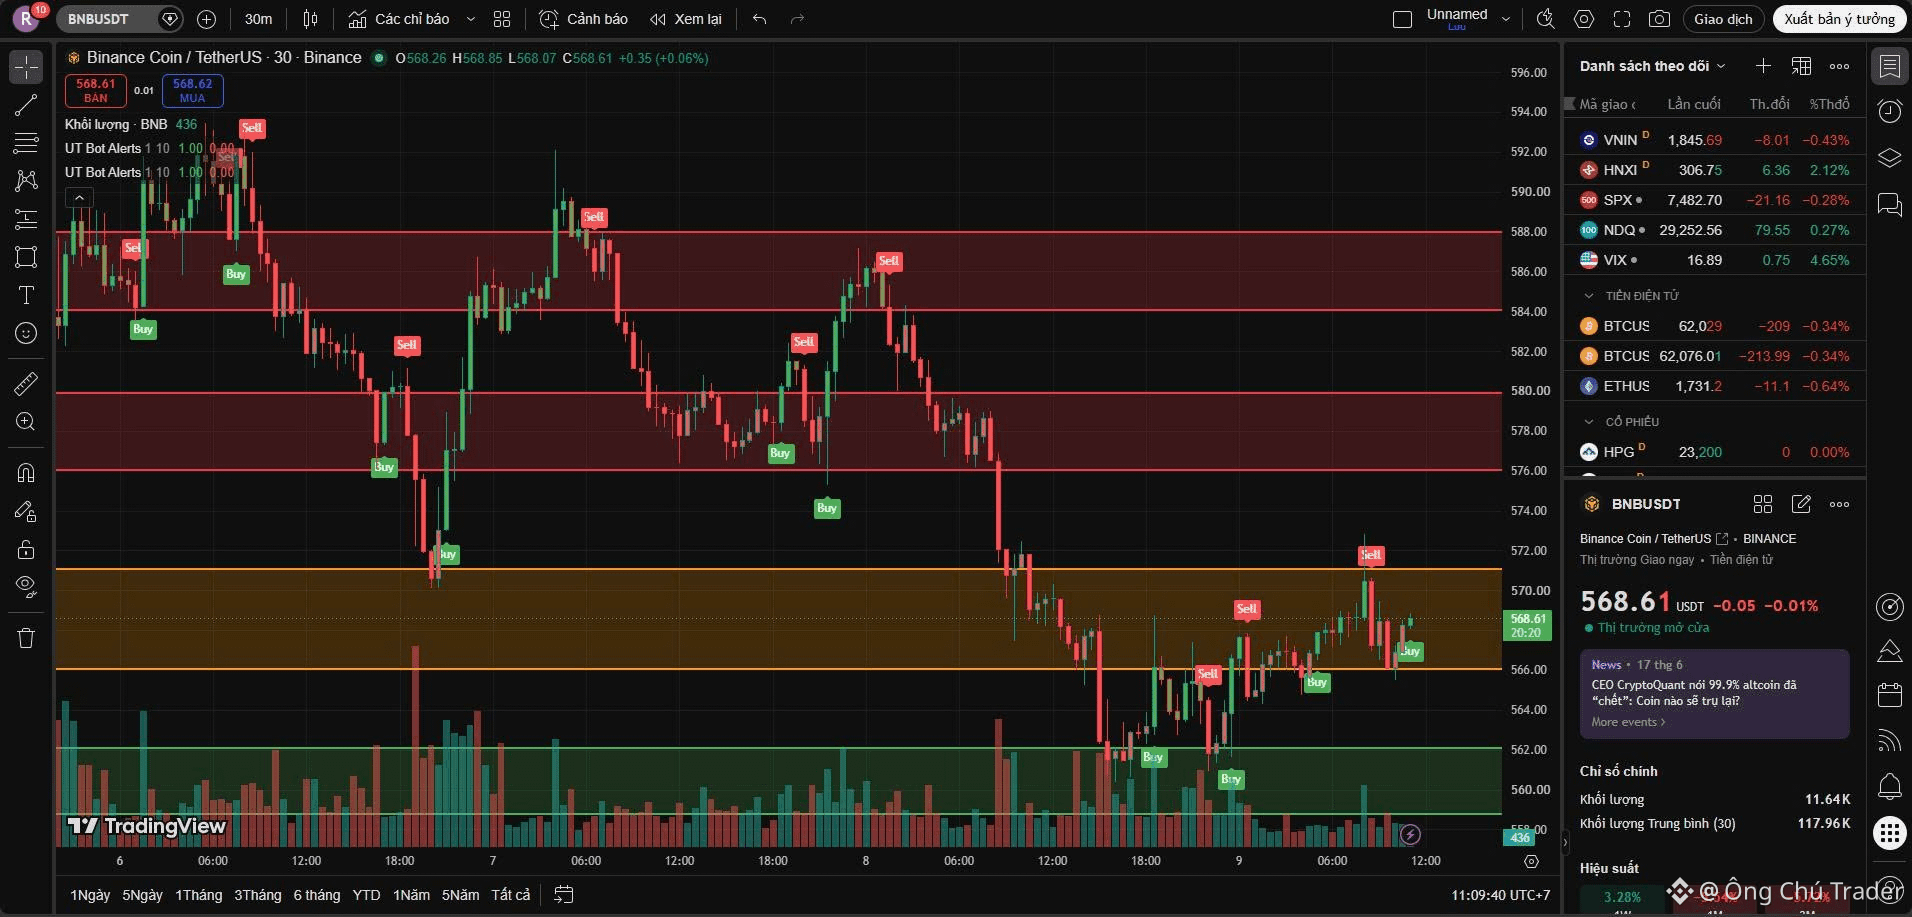
BNBは先のサポートをブレイクして新たなローカル安値を形成しました。下落は一時的に止まり、価格は$568.54付近で、上値の供給を吸収しようとしながら、狭いレンジの「ディシジョンゾーン」内を推移しています。
🔹 サポート:
$566(直近の揉み合いの下限)
$558 – $562(非常に強い深いヒゲの下限)
🔸 レジスタンス:
$571(直近の揉み合いの上限)
$576 – $579(強く反転したレジスタンス)
$584 – $587(主要なブレイクダウン構造のピーク)
✅ 強気:$571を明確に上回って終値をつければ、価格の圧縮が解放され、$576 – $579の基盤へ向けて回復する明確な道が開けます。
❌ 弱気:$566を下回ってブレイクすると、ローカル回復の構造が無効化され、最終防衛ラインである$558 – $562まで直接下落するリスクがあります。
📊 戦略:
BNBはボトムを探る局面で横ばいに動いています。もみ合う$566 – $571のレンジ内での取引は、ノイズが大きく勝率は50/50と見込まれます。
最適な計画は明確な確認を待つことです。つまり、$571を上抜けるクリーンなブレイクアウトに追随して短期のリバウンドを狙うか、$558 – $562の堅いサポート底付近でディープリテストを待ち、実行前に買い手の強さを評価するかのどちらかです。
⚠️ 注意事項:情報提供のみを目的としています。自己責任でリスク管理を行ってください。
$BNB #BinanceSquare #CryptoTrading #TechnicalAnalysis
#BNB/USDT
📉 トレンド:弱気/ボトムの揉み合い。
BNBは先のサポートをブレイクして新たなローカル安値を形成しました。下落は一時的に止まり、価格は$568.54付近で、上値の供給を吸収しようとしながら、狭いレンジの「ディシジョンゾーン」内を推移しています。
🔹 サポート:
$566(直近の揉み合いの下限)
$558 – $562(非常に強い深いヒゲの下限)
🔸 レジスタンス:
$571(直近の揉み合いの上限)
$576 – $579(強く反転したレジスタンス)
$584 – $587(主要なブレイクダウン構造のピーク)
✅ 強気:$571を明確に上回って終値をつければ、価格の圧縮が解放され、$576 – $579の基盤へ向けて回復する明確な道が開けます。
❌ 弱気:$566を下回ってブレイクすると、ローカル回復の構造が無効化され、最終防衛ラインである$558 – $562まで直接下落するリスクがあります。
📊 戦略:
BNBはボトムを探る局面で横ばいに動いています。もみ合う$566 – $571のレンジ内での取引は、ノイズが大きく勝率は50/50と見込まれます。
最適な計画は明確な確認を待つことです。つまり、$571を上抜けるクリーンなブレイクアウトに追随して短期のリバウンドを狙うか、$558 – $562の堅いサポート底付近でディープリテストを待ち、実行前に買い手の強さを評価するかのどちらかです。
⚠️ 注意事項:情報提供のみを目的としています。自己責任でリスク管理を行ってください。
$BNB #BinanceSquare #CryptoTrading #TechnicalAnalysis
📉 トレンド:弱気/ボトムの揉み合い。
BNBは先のサポートをブレイクして新たなローカル安値を形成しました。下落は一時的に止まり、価格は$568.54付近で、上値の供給を吸収しようとしながら、狭いレンジの「ディシジョンゾーン」内を推移しています。
🔹 サポート:
$566(直近の揉み合いの下限)
$558 – $562(非常に強い深いヒゲの下限)
🔸 レジスタンス:
$571(直近の揉み合いの上限)
$576 – $579(強く反転したレジスタンス)
$584 – $587(主要なブレイクダウン構造のピーク)
✅ 強気:$571を明確に上回って終値をつければ、価格の圧縮が解放され、$576 – $579の基盤へ向けて回復する明確な道が開けます。
❌ 弱気:$566を下回ってブレイクすると、ローカル回復の構造が無効化され、最終防衛ラインである$558 – $562まで直接下落するリスクがあります。
📊 戦略:
BNBはボトムを探る局面で横ばいに動いています。もみ合う$566 – $571のレンジ内での取引は、ノイズが大きく勝率は50/50と見込まれます。
最適な計画は明確な確認を待つことです。つまり、$571を上抜けるクリーンなブレイクアウトに追随して短期のリバウンドを狙うか、$558 – $562の堅いサポート底付近でディープリテストを待ち、実行前に買い手の強さを評価するかのどちらかです。
⚠️ 注意事項:情報提供のみを目的としています。自己責任でリスク管理を行ってください。
$BNB #BinanceSquare #CryptoTrading #TechnicalAnalysis
1
97
#BTC/USDT
📉 傾向:短期的に弱気 / 直近の底固め(ボトム・コンソリデーション)。
BTCは売り圧力が継続しており、ピーク時の分布(ディストリビューション)後により低い高値を作っています。現在の価格は約$61,994で推移しており、重要な意思決定ゾーン内で小動きしています。
🔹 サポート:
$61,200 – $61,580(非常に強い、過去の下ヒゲ安値フロア)
🔸 レジスタンス:
$61,800 – $62,400(直近のトレンドを決める重要ゾーン)
$63,000 – $63,200(強い反転レジスタンス)
$63,800 – $64,400(主要なピーク供給)
✅ 強気:$62,400を明確に上抜けすれば、弱気の構造が崩れ、$63,000 – $63,200へ向けた強いリカバリーの道が開けます。
❌ 弱気:$61,800を終値ベースで下回ると、最終防衛ラインである$61,200 – $61,580へ直接下落するリスクがあります。$61,200を割り込むと、より広範なパニック売りを誘発します。
📊 戦略:
BTCはディフェンシブな姿勢で、慎重な買い需要が見られます。乱高下する$61,800 – $62,400ゾーンの中での取引はリスクが高いです。
より安全なのは、$62,400を明確に上抜けてから回復モメンタムを買うこと、または$61,200 – $61,500付近まで下がった場合に、押し目買いのセットアップを注意深く監視することです。
⚠️ 免責事項:情報提供のみを目的としています。ご自身のリスク管理を行ってください。
$BTC #BinanceSquare #CryptoTrading #TechnicalAnalysis
#BTC/USDT
📉 傾向:短期的に弱気 / 直近の底固め(ボトム・コンソリデーション)。
BTCは売り圧力が継続しており、ピーク時の分布(ディストリビューション)後により低い高値を作っています。現在の価格は約$61,994で推移しており、重要な意思決定ゾーン内で小動きしています。
🔹 サポート:
$61,200 – $61,580(非常に強い、過去の下ヒゲ安値フロア)
🔸 レジスタンス:
$61,800 – $62,400(直近のトレンドを決める重要ゾーン)
$63,000 – $63,200(強い反転レジスタンス)
$63,800 – $64,400(主要なピーク供給)
✅ 強気:$62,400を明確に上抜けすれば、弱気の構造が崩れ、$63,000 – $63,200へ向けた強いリカバリーの道が開けます。
❌ 弱気:$61,800を終値ベースで下回ると、最終防衛ラインである$61,200 – $61,580へ直接下落するリスクがあります。$61,200を割り込むと、より広範なパニック売りを誘発します。
📊 戦略:
BTCはディフェンシブな姿勢で、慎重な買い需要が見られます。乱高下する$61,800 – $62,400ゾーンの中での取引はリスクが高いです。
より安全なのは、$62,400を明確に上抜けてから回復モメンタムを買うこと、または$61,200 – $61,500付近まで下がった場合に、押し目買いのセットアップを注意深く監視することです。
⚠️ 免責事項:情報提供のみを目的としています。ご自身のリスク管理を行ってください。
$BTC #BinanceSquare #CryptoTrading #TechnicalAnalysis
📉 傾向:短期的に弱気 / 直近の底固め(ボトム・コンソリデーション)。
BTCは売り圧力が継続しており、ピーク時の分布(ディストリビューション)後により低い高値を作っています。現在の価格は約$61,994で推移しており、重要な意思決定ゾーン内で小動きしています。
🔹 サポート:
$61,200 – $61,580(非常に強い、過去の下ヒゲ安値フロア)
🔸 レジスタンス:
$61,800 – $62,400(直近のトレンドを決める重要ゾーン)
$63,000 – $63,200(強い反転レジスタンス)
$63,800 – $64,400(主要なピーク供給)
✅ 強気:$62,400を明確に上抜けすれば、弱気の構造が崩れ、$63,000 – $63,200へ向けた強いリカバリーの道が開けます。
❌ 弱気:$61,800を終値ベースで下回ると、最終防衛ラインである$61,200 – $61,580へ直接下落するリスクがあります。$61,200を割り込むと、より広範なパニック売りを誘発します。
📊 戦略:
BTCはディフェンシブな姿勢で、慎重な買い需要が見られます。乱高下する$61,800 – $62,400ゾーンの中での取引はリスクが高いです。
より安全なのは、$62,400を明確に上抜けてから回復モメンタムを買うこと、または$61,200 – $61,500付近まで下がった場合に、押し目買いのセットアップを注意深く監視することです。
⚠️ 免責事項:情報提供のみを目的としています。ご自身のリスク管理を行ってください。
$BTC #BinanceSquare #CryptoTrading #TechnicalAnalysis
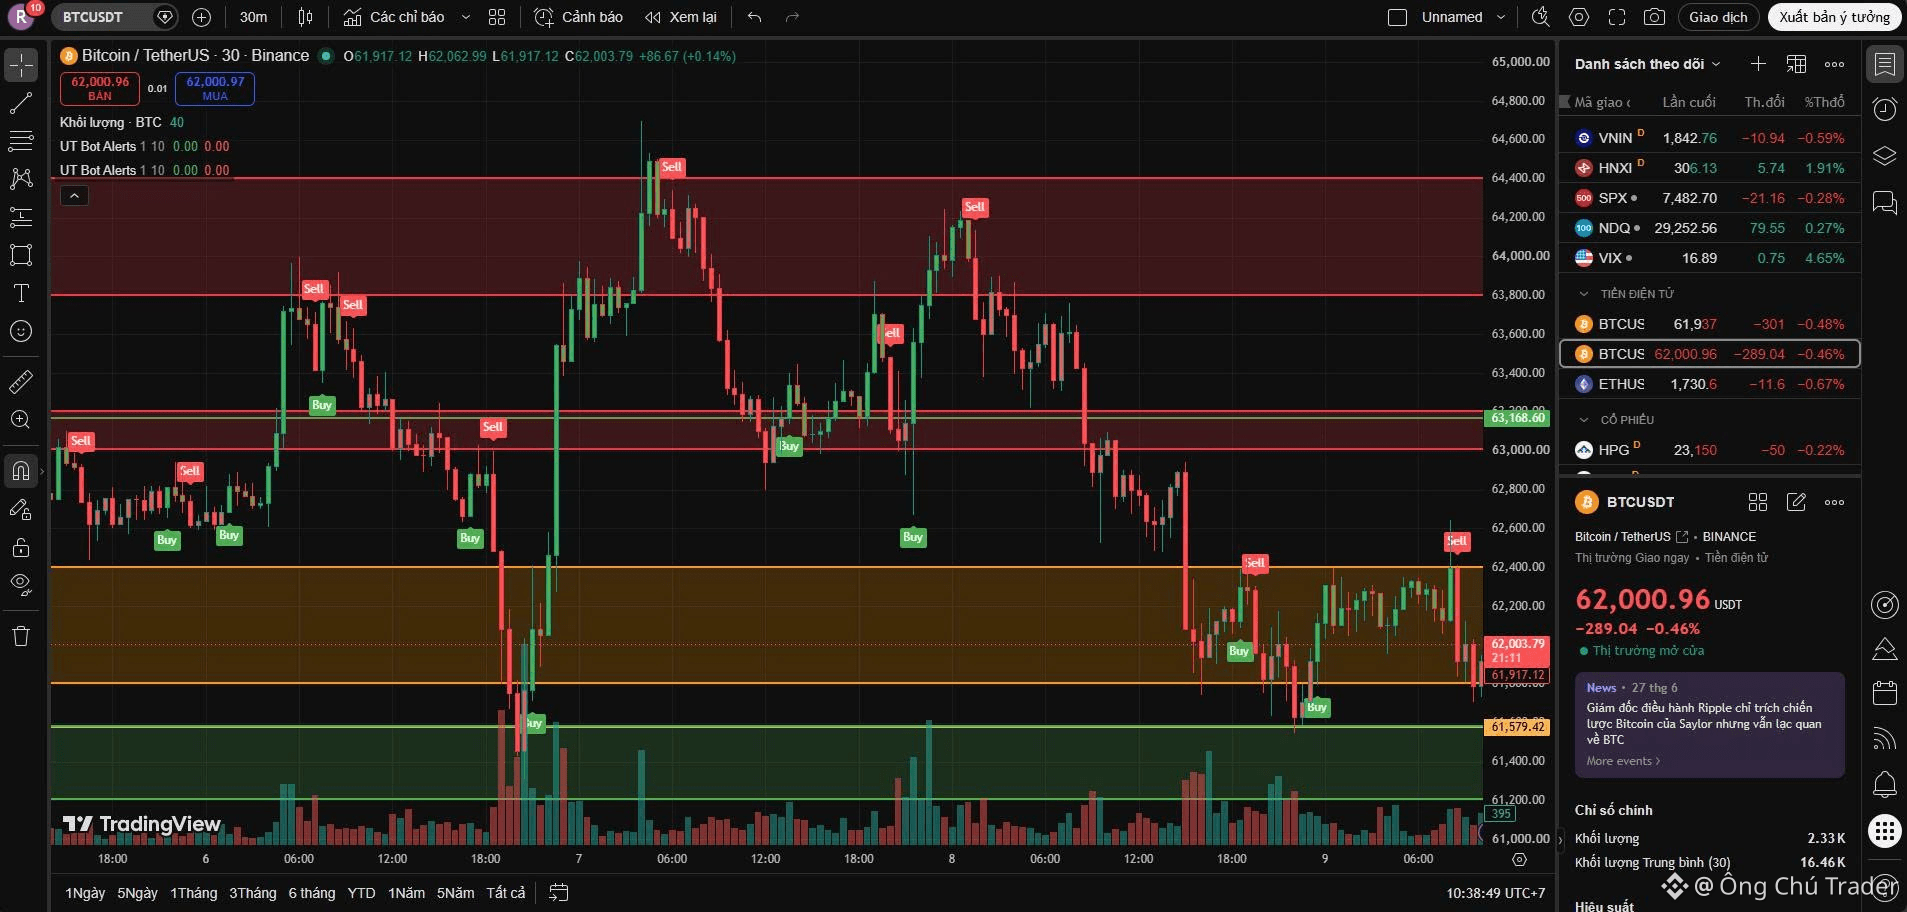
90
#BTC/USDT
📉 トレンド:横ばい / 短期のサポートで需要を試している。
BTCは下落後に安定しているものの、依然として圧力下にあり、意思決定ゾーン下限付近の約$62,902で取引されています。
🔹 サポート:
$61,200 – $61,712(非常に強い過去の下げ買いの下支え)
🔸 レジスタンス:
$63,600(直近の意思決定ゾーンの上限)
$64,427 – $64,900(主要なマクロの高値の供給帯)
✅ 強気:$63,600を上回って終値で確定すると弱気の構造が崩れ、$64,427 – $64,900の高値を再テストするための明確な道筋が開けます。
❌ 弱気:$62,850を下抜けると、最深のサポートである$61,200 – $61,712までの直行的な下落リスクがあります。
📊 戦略:
BTCは売り手が押し下げる中で、感度の高い転換点に位置しています。この中間レンジでの取引は避けましょう。より安全なのは、勢いに乗るために$63,600を明確に上抜けるのを待つこと、または確かな$61,700のサポートまで大きく割り込むディスカウントを待って、リスクを厳密に管理しながら買いポジションを構築することです。
⚠️ 注意:情報提供のみを目的としています。自身のリスクを管理してください。
$BTC #BinanceSquare #CryptoTrading #TechnicalAnalysis
#BTC/USDT
📉 トレンド:横ばい / 短期のサポートで需要を試している。
BTCは下落後に安定しているものの、依然として圧力下にあり、意思決定ゾーン下限付近の約$62,902で取引されています。
🔹 サポート:
$61,200 – $61,712(非常に強い過去の下げ買いの下支え)
🔸 レジスタンス:
$63,600(直近の意思決定ゾーンの上限)
$64,427 – $64,900(主要なマクロの高値の供給帯)
✅ 強気:$63,600を上回って終値で確定すると弱気の構造が崩れ、$64,427 – $64,900の高値を再テストするための明確な道筋が開けます。
❌ 弱気:$62,850を下抜けると、最深のサポートである$61,200 – $61,712までの直行的な下落リスクがあります。
📊 戦略:
BTCは売り手が押し下げる中で、感度の高い転換点に位置しています。この中間レンジでの取引は避けましょう。より安全なのは、勢いに乗るために$63,600を明確に上抜けるのを待つこと、または確かな$61,700のサポートまで大きく割り込むディスカウントを待って、リスクを厳密に管理しながら買いポジションを構築することです。
⚠️ 注意:情報提供のみを目的としています。自身のリスクを管理してください。
$BTC #BinanceSquare #CryptoTrading #TechnicalAnalysis
📉 トレンド:横ばい / 短期のサポートで需要を試している。
BTCは下落後に安定しているものの、依然として圧力下にあり、意思決定ゾーン下限付近の約$62,902で取引されています。
🔹 サポート:
$61,200 – $61,712(非常に強い過去の下げ買いの下支え)
🔸 レジスタンス:
$63,600(直近の意思決定ゾーンの上限)
$64,427 – $64,900(主要なマクロの高値の供給帯)
✅ 強気:$63,600を上回って終値で確定すると弱気の構造が崩れ、$64,427 – $64,900の高値を再テストするための明確な道筋が開けます。
❌ 弱気:$62,850を下抜けると、最深のサポートである$61,200 – $61,712までの直行的な下落リスクがあります。
📊 戦略:
BTCは売り手が押し下げる中で、感度の高い転換点に位置しています。この中間レンジでの取引は避けましょう。より安全なのは、勢いに乗るために$63,600を明確に上抜けるのを待つこと、または確かな$61,700のサポートまで大きく割り込むディスカウントを待って、リスクを厳密に管理しながら買いポジションを構築することです。
⚠️ 注意:情報提供のみを目的としています。自身のリスクを管理してください。
$BTC #BinanceSquare #CryptoTrading #TechnicalAnalysis
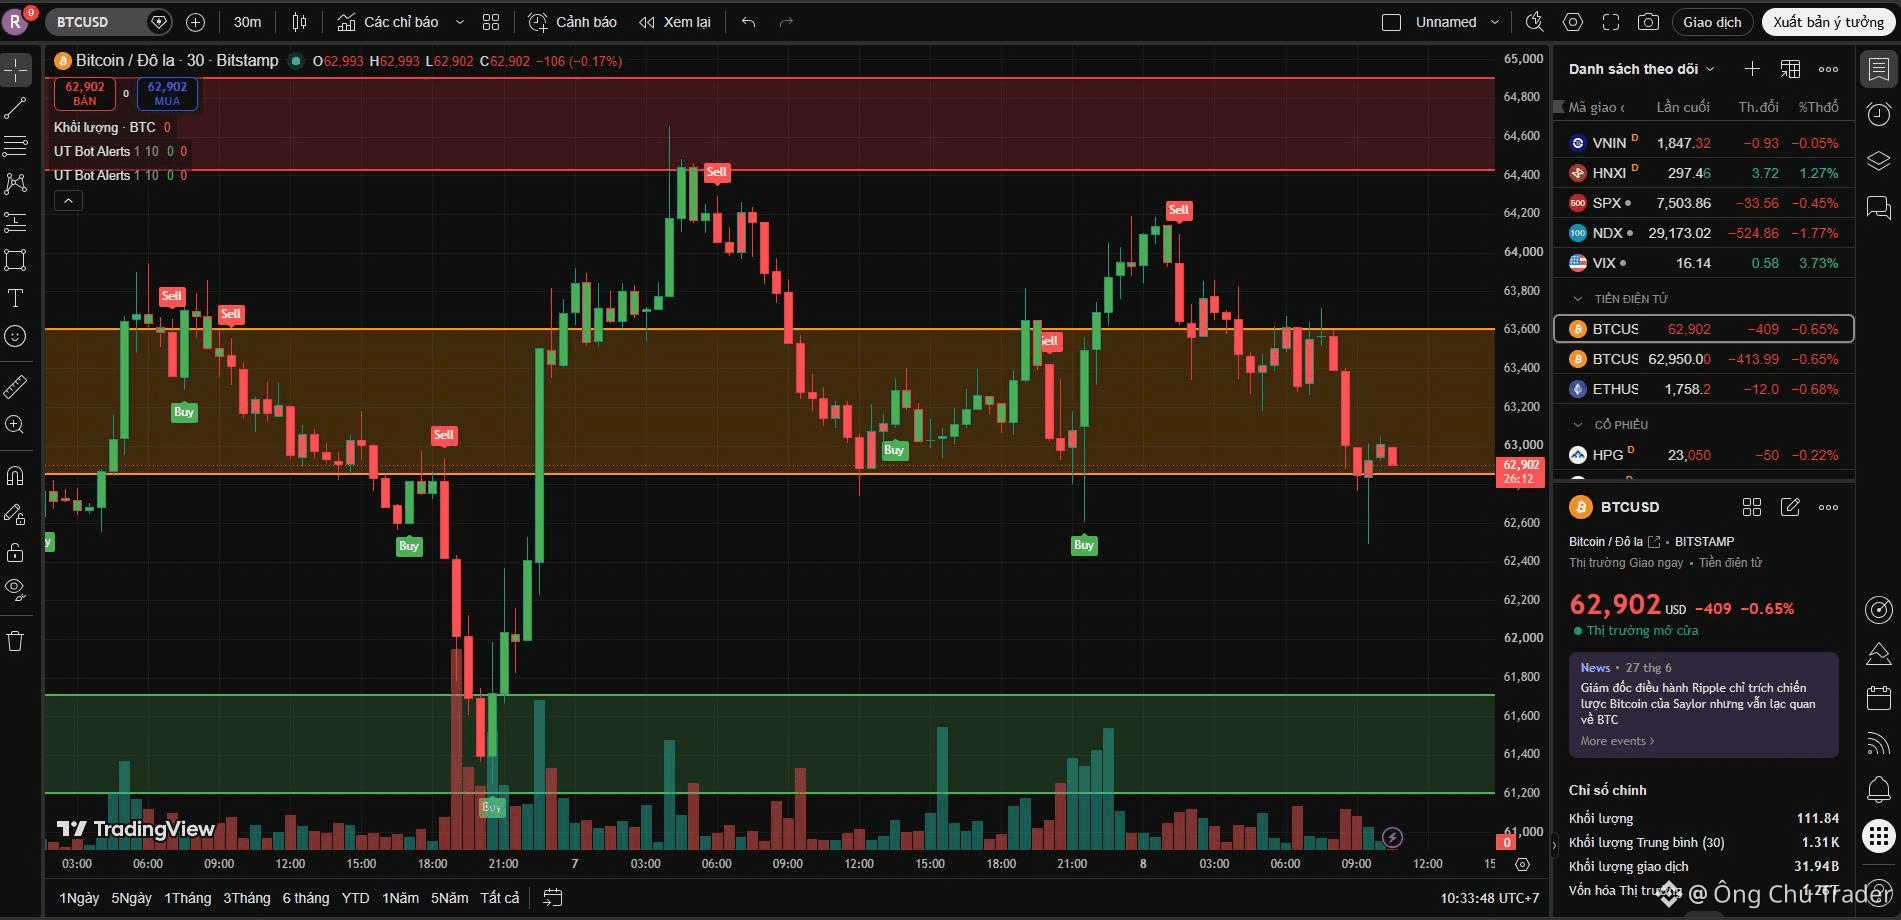
79
#BNB/USDT
📉 トレンド:短期的には弱気 / 重要なサポートを試す展開。
BNBはもみ合いの基盤をブレイクし、前回の安値まで下落。現在は重要なディフェンシブ・ゾーン内で約$570.82で取引されています。
🔹 サポート:
$569 – $572(決定的なメイク・オア・ブレイクの下限)
🔸 レジスタンス:
$575 – $577(直近で反転したレジスタンス)
$583 – $585(強い下向きの高値圏)
$589 – $592(主要なピーク供給)
✅ 強気:
$569 – $572を維持できれば反発して$575へ。$577を上回って突破できれば弱気圧力が緩みます。
❌ 弱気:
$569を下回って終値でクローズすると、パニック売りが起きてさらに深い急落へつながります。
📊 戦略:
BNBはリスキーな「より低い高値」構造を示しています。押し目買いは良いR:Rが見込める一方、売り手が優勢なためリスクは高めです。より安全なのは、出来高の増加とともに$569 – $572で確定したベースを待つこと、または$575 – $577での反発(リジェクト)を確認してショートすることです。
⚠️ 免責事項:情報提供のみを目的としています。ご自身でリスク管理を行ってください。
$BNB #BinanceSquare #CryptoTrading #TechnicalAnalysis
#BNB/USDT
📉 トレンド:短期的には弱気 / 重要なサポートを試す展開。
BNBはもみ合いの基盤をブレイクし、前回の安値まで下落。現在は重要なディフェンシブ・ゾーン内で約$570.82で取引されています。
🔹 サポート:
$569 – $572(決定的なメイク・オア・ブレイクの下限)
🔸 レジスタンス:
$575 – $577(直近で反転したレジスタンス)
$583 – $585(強い下向きの高値圏)
$589 – $592(主要なピーク供給)
✅ 強気:
$569 – $572を維持できれば反発して$575へ。$577を上回って突破できれば弱気圧力が緩みます。
❌ 弱気:
$569を下回って終値でクローズすると、パニック売りが起きてさらに深い急落へつながります。
📊 戦略:
BNBはリスキーな「より低い高値」構造を示しています。押し目買いは良いR:Rが見込める一方、売り手が優勢なためリスクは高めです。より安全なのは、出来高の増加とともに$569 – $572で確定したベースを待つこと、または$575 – $577での反発(リジェクト)を確認してショートすることです。
⚠️ 免責事項:情報提供のみを目的としています。ご自身でリスク管理を行ってください。
$BNB #BinanceSquare #CryptoTrading #TechnicalAnalysis
📉 トレンド:短期的には弱気 / 重要なサポートを試す展開。
BNBはもみ合いの基盤をブレイクし、前回の安値まで下落。現在は重要なディフェンシブ・ゾーン内で約$570.82で取引されています。
🔹 サポート:
$569 – $572(決定的なメイク・オア・ブレイクの下限)
🔸 レジスタンス:
$575 – $577(直近で反転したレジスタンス)
$583 – $585(強い下向きの高値圏)
$589 – $592(主要なピーク供給)
✅ 強気:
$569 – $572を維持できれば反発して$575へ。$577を上回って突破できれば弱気圧力が緩みます。
❌ 弱気:
$569を下回って終値でクローズすると、パニック売りが起きてさらに深い急落へつながります。
📊 戦略:
BNBはリスキーな「より低い高値」構造を示しています。押し目買いは良いR:Rが見込める一方、売り手が優勢なためリスクは高めです。より安全なのは、出来高の増加とともに$569 – $572で確定したベースを待つこと、または$575 – $577での反発(リジェクト)を確認してショートすることです。
⚠️ 免責事項:情報提供のみを目的としています。ご自身でリスク管理を行ってください。
$BNB #BinanceSquare #CryptoTrading #TechnicalAnalysis
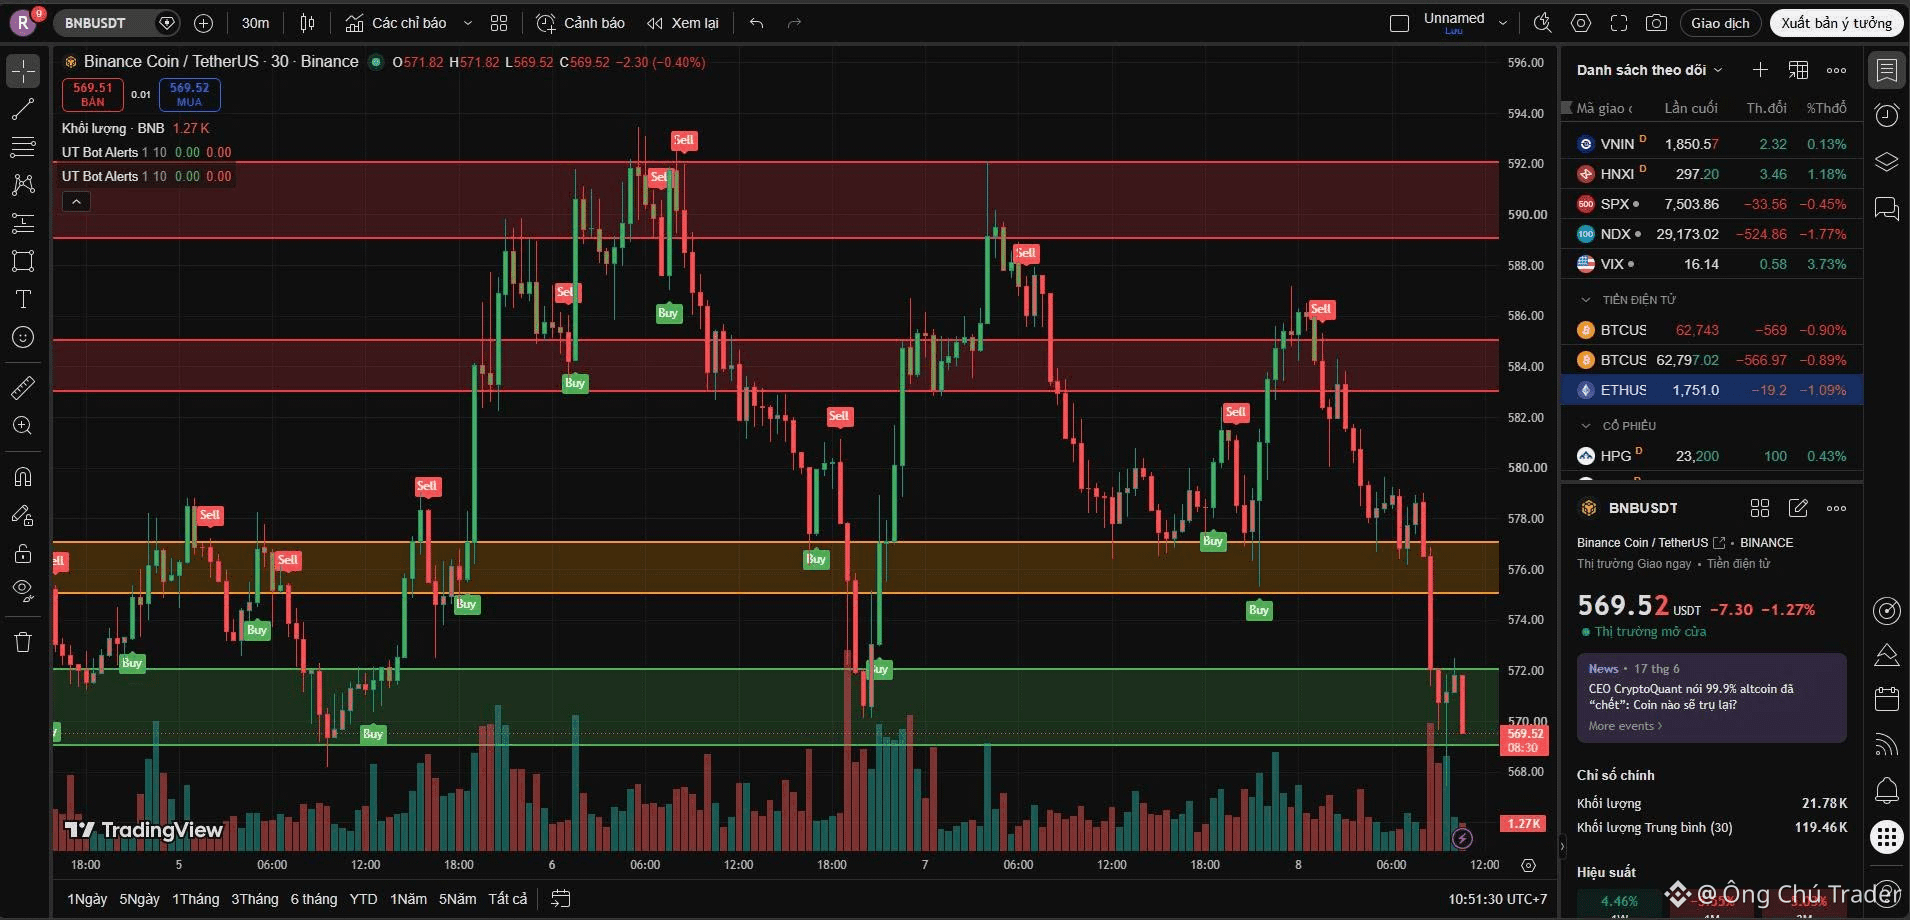
81
#BNB/USDT
📉 トレンド:短期的に弱気 / 横ばい下落。
明確な上方の供給ゾーンからのはっきりとした拒否(リジェクト)を受けた後、価格は売り圧力に直面しています。現在、BNBは移動平均線を下回ったまま推移しており、ますます狭くなっているレンジの中で調整(コンソリデーション)しています。
🔹 サポート:
$576.98(直近のクッション。現在は一時的に足踏みし、この節目を再テストしています)
$572.76(直近の振り落としでの重要な直前安値。強い買いの関心が入った地点)
$568.00(下方の堅い構造的サポート。より大きなパニック売りから守ります)
🔸 レジスタンス:
$582.09(動的な上方レジスタンス。現在、戻りの試みを押さえています)
$591.42(直近の高値。待機している売り注文が詰まった分厚い供給ゾーン)
✅ 強気シナリオ:
出来高の多い状況で、$582.50を明確に上抜ける実体のあるローソク足が終値で確定すれば、下方向の調整は崩れます。すると、$591周辺の流動性プール(リクイディティ)を再テストする道が開けます。
❌ 弱気シナリオ:
$576.00のサポート・マイルストーンを失うと、弱気の勢いが固まり、$572.76の底を取りにいくための下落(ディップ買いの流動性を探す動き)への道ができます。
📊 トレーディング戦略:
構造はわずかに売り手側に傾いていますが、価格はちょうどサポートのすぐ近くに位置しているため、ベアトラップ(弱気罠)のリスクが非常に高くなっています。最適な動きは今のところ様子見し、観察することです。価格が重要な節目に明確に反応するのを待ちましょう($582への戻り、または$572への下落)。
その後は、スマートマネーの介入を示す確認シナリオ(例:CRT + TBSのセットアップ)を見てからエントリーを検討してください。いつも通り、損失(ドローダウン)が絶対に安全な範囲に収まるよう、ポジションサイズを慎重に計算しましょう。
⚠️ 免責事項:情報提供のみを目的としています。投資家は各自でリスク評価を行ってください。
💡 このシグナルをさらに深掘りしたいですか?最新情報はプロフィールのバイオをご確認ください!
$BNB #BinanceSquare #CryptoTrading #TechnicalAnalysis #MarketUpdate
#BNB/USDT
📉 トレンド:短期的に弱気 / 横ばい下落。
明確な上方の供給ゾーンからのはっきりとした拒否(リジェクト)を受けた後、価格は売り圧力に直面しています。現在、BNBは移動平均線を下回ったまま推移しており、ますます狭くなっているレンジの中で調整(コンソリデーション)しています。
🔹 サポート:
$576.98(直近のクッション。現在は一時的に足踏みし、この節目を再テストしています)
$572.76(直近の振り落としでの重要な直前安値。強い買いの関心が入った地点)
$568.00(下方の堅い構造的サポート。より大きなパニック売りから守ります)
🔸 レジスタンス:
$582.09(動的な上方レジスタンス。現在、戻りの試みを押さえています)
$591.42(直近の高値。待機している売り注文が詰まった分厚い供給ゾーン)
✅ 強気シナリオ:
出来高の多い状況で、$582.50を明確に上抜ける実体のあるローソク足が終値で確定すれば、下方向の調整は崩れます。すると、$591周辺の流動性プール(リクイディティ)を再テストする道が開けます。
❌ 弱気シナリオ:
$576.00のサポート・マイルストーンを失うと、弱気の勢いが固まり、$572.76の底を取りにいくための下落(ディップ買いの流動性を探す動き)への道ができます。
📊 トレーディング戦略:
構造はわずかに売り手側に傾いていますが、価格はちょうどサポートのすぐ近くに位置しているため、ベアトラップ(弱気罠)のリスクが非常に高くなっています。最適な動きは今のところ様子見し、観察することです。価格が重要な節目に明確に反応するのを待ちましょう($582への戻り、または$572への下落)。
その後は、スマートマネーの介入を示す確認シナリオ(例:CRT + TBSのセットアップ)を見てからエントリーを検討してください。いつも通り、損失(ドローダウン)が絶対に安全な範囲に収まるよう、ポジションサイズを慎重に計算しましょう。
⚠️ 免責事項:情報提供のみを目的としています。投資家は各自でリスク評価を行ってください。
💡 このシグナルをさらに深掘りしたいですか?最新情報はプロフィールのバイオをご確認ください!
$BNB #BinanceSquare #CryptoTrading #TechnicalAnalysis #MarketUpdate
📉 トレンド:短期的に弱気 / 横ばい下落。
明確な上方の供給ゾーンからのはっきりとした拒否(リジェクト)を受けた後、価格は売り圧力に直面しています。現在、BNBは移動平均線を下回ったまま推移しており、ますます狭くなっているレンジの中で調整(コンソリデーション)しています。
🔹 サポート:
$576.98(直近のクッション。現在は一時的に足踏みし、この節目を再テストしています)
$572.76(直近の振り落としでの重要な直前安値。強い買いの関心が入った地点)
$568.00(下方の堅い構造的サポート。より大きなパニック売りから守ります)
🔸 レジスタンス:
$582.09(動的な上方レジスタンス。現在、戻りの試みを押さえています)
$591.42(直近の高値。待機している売り注文が詰まった分厚い供給ゾーン)
✅ 強気シナリオ:
出来高の多い状況で、$582.50を明確に上抜ける実体のあるローソク足が終値で確定すれば、下方向の調整は崩れます。すると、$591周辺の流動性プール(リクイディティ)を再テストする道が開けます。
❌ 弱気シナリオ:
$576.00のサポート・マイルストーンを失うと、弱気の勢いが固まり、$572.76の底を取りにいくための下落(ディップ買いの流動性を探す動き)への道ができます。
📊 トレーディング戦略:
構造はわずかに売り手側に傾いていますが、価格はちょうどサポートのすぐ近くに位置しているため、ベアトラップ(弱気罠)のリスクが非常に高くなっています。最適な動きは今のところ様子見し、観察することです。価格が重要な節目に明確に反応するのを待ちましょう($582への戻り、または$572への下落)。
その後は、スマートマネーの介入を示す確認シナリオ(例:CRT + TBSのセットアップ)を見てからエントリーを検討してください。いつも通り、損失(ドローダウン)が絶対に安全な範囲に収まるよう、ポジションサイズを慎重に計算しましょう。
⚠️ 免責事項:情報提供のみを目的としています。投資家は各自でリスク評価を行ってください。
💡 このシグナルをさらに深掘りしたいですか?最新情報はプロフィールのバイオをご確認ください!
$BNB #BinanceSquare #CryptoTrading #TechnicalAnalysis #MarketUpdate
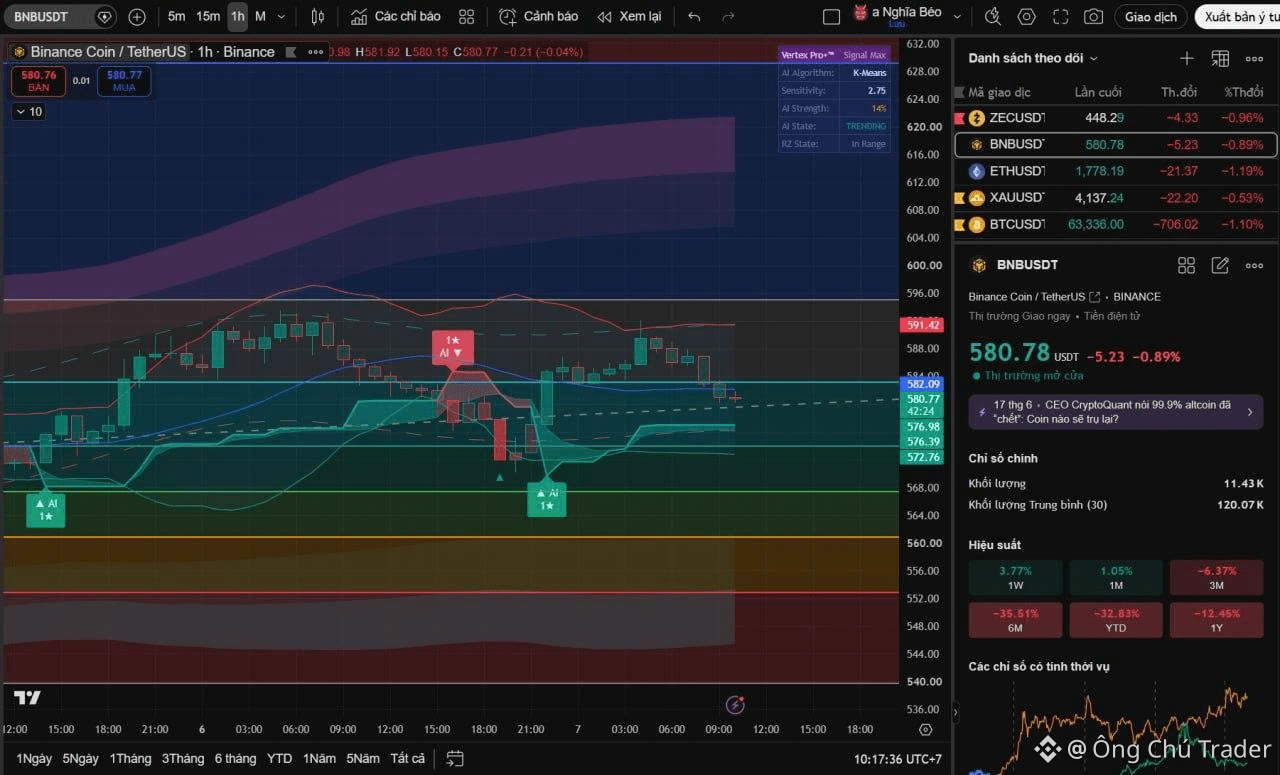
73
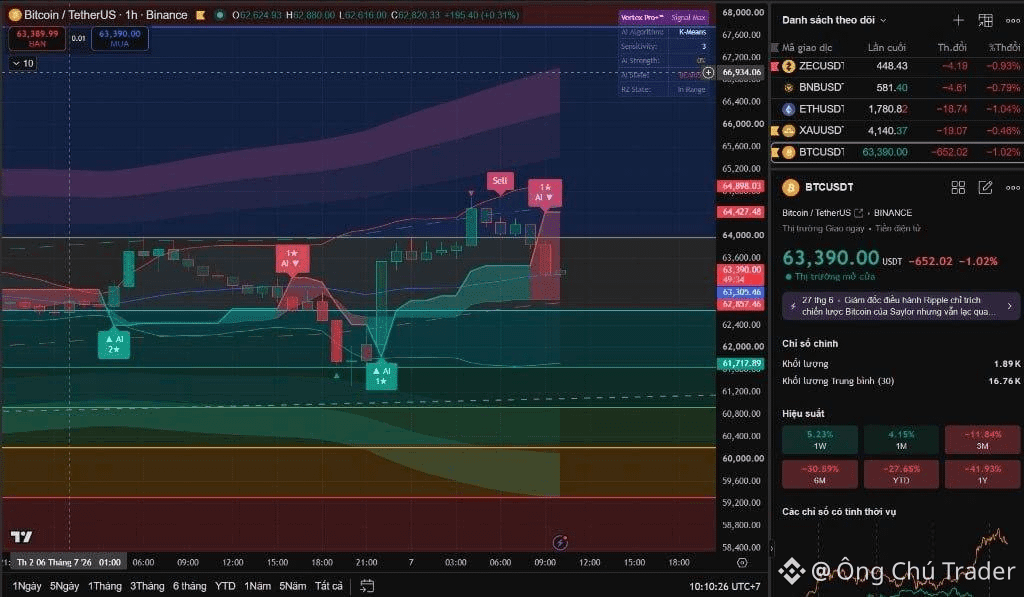
#BTC/USDT
📉 トレンド:強い下落 / 大量の売り圧力にさらされています。
価格は、直近の分配シグナルがローカル天井で出た後に、圧倒的な出来高を伴って急激かつ攻撃的に売られています。
🔹 サポート:
$63,305(現在のポジション直下にあるダイナミックな下値のフロア)
$62,857(投げの直前に一時的に付けたウィック安値。最近の刈り取り)
$61,712(極めて重要な構造的サポート。主要な機関投資家の注文フローが以前に踏み込んだ領域)
🔸 レジスタンス:
$64,427(直近のレジスタンス。上昇構造が最初に崩れた地点)
$64,898(最近確立された高値。強い供給ゾーンで、売り手がしっかり支配している)
✅ 強気シナリオ:
実体のある足で、$64,400の節目を明確に上抜けて終値確定すれば、今回の急落は無効化されます。買いのボリュームが戻り、$64,898までの再テストを狙う動きにつながる可能性があります。
❌ 弱気シナリオ:
価格が$62,850のウィック安値を下抜けると、下方向の勢いは継続し、$61,712にある下の流動性ポケットへ向けて急速に滑り落ちることになります。
📊 取引戦略:
売り圧力は完全に優勢です。不安定な価格帯で落ちてくるナイフを掴むことは厳禁。様子見を続けるのが最も安全です。$62,857のゾーンで均衡の土台が形成されるのを待つか、さらに深い$61,712での形成を待ちましょう。
スマートマネーが明確な足跡を残した場合(例:CRT+TBSのようなセットアップ)に限って、BUYの優先を検討してください。必ずリスク管理を厳格に守り、ドローダウンを安全な範囲に収めましょう。
⚠️ 免責事項:情報提供のみを目的としています。投資家は各自でリスク評価を行ってください。
💡 このシグナルをさらに深掘りしたいですか?最新情報はプロフィールのバイオをご覧ください!
$BTC #BinanceSquare #CryptoTrading #TechnicalAnalysis #MarketUpdate
#BTC/USDT
📉 トレンド:強い下落 / 大量の売り圧力にさらされています。
価格は、直近の分配シグナルがローカル天井で出た後に、圧倒的な出来高を伴って急激かつ攻撃的に売られています。
🔹 サポート:
$63,305(現在のポジション直下にあるダイナミックな下値のフロア)
$62,857(投げの直前に一時的に付けたウィック安値。最近の刈り取り)
$61,712(極めて重要な構造的サポート。主要な機関投資家の注文フローが以前に踏み込んだ領域)
🔸 レジスタンス:
$64,427(直近のレジスタンス。上昇構造が最初に崩れた地点)
$64,898(最近確立された高値。強い供給ゾーンで、売り手がしっかり支配している)
✅ 強気シナリオ:
実体のある足で、$64,400の節目を明確に上抜けて終値確定すれば、今回の急落は無効化されます。買いのボリュームが戻り、$64,898までの再テストを狙う動きにつながる可能性があります。
❌ 弱気シナリオ:
価格が$62,850のウィック安値を下抜けると、下方向の勢いは継続し、$61,712にある下の流動性ポケットへ向けて急速に滑り落ちることになります。
📊 取引戦略:
売り圧力は完全に優勢です。不安定な価格帯で落ちてくるナイフを掴むことは厳禁。様子見を続けるのが最も安全です。$62,857のゾーンで均衡の土台が形成されるのを待つか、さらに深い$61,712での形成を待ちましょう。
スマートマネーが明確な足跡を残した場合(例:CRT+TBSのようなセットアップ)に限って、BUYの優先を検討してください。必ずリスク管理を厳格に守り、ドローダウンを安全な範囲に収めましょう。
⚠️ 免責事項:情報提供のみを目的としています。投資家は各自でリスク評価を行ってください。
💡 このシグナルをさらに深掘りしたいですか?最新情報はプロフィールのバイオをご覧ください!
$BTC #BinanceSquare #CryptoTrading #TechnicalAnalysis #MarketUpdate
📉 トレンド:強い下落 / 大量の売り圧力にさらされています。
価格は、直近の分配シグナルがローカル天井で出た後に、圧倒的な出来高を伴って急激かつ攻撃的に売られています。
🔹 サポート:
$63,305(現在のポジション直下にあるダイナミックな下値のフロア)
$62,857(投げの直前に一時的に付けたウィック安値。最近の刈り取り)
$61,712(極めて重要な構造的サポート。主要な機関投資家の注文フローが以前に踏み込んだ領域)
🔸 レジスタンス:
$64,427(直近のレジスタンス。上昇構造が最初に崩れた地点)
$64,898(最近確立された高値。強い供給ゾーンで、売り手がしっかり支配している)
✅ 強気シナリオ:
実体のある足で、$64,400の節目を明確に上抜けて終値確定すれば、今回の急落は無効化されます。買いのボリュームが戻り、$64,898までの再テストを狙う動きにつながる可能性があります。
❌ 弱気シナリオ:
価格が$62,850のウィック安値を下抜けると、下方向の勢いは継続し、$61,712にある下の流動性ポケットへ向けて急速に滑り落ちることになります。
📊 取引戦略:
売り圧力は完全に優勢です。不安定な価格帯で落ちてくるナイフを掴むことは厳禁。様子見を続けるのが最も安全です。$62,857のゾーンで均衡の土台が形成されるのを待つか、さらに深い$61,712での形成を待ちましょう。
スマートマネーが明確な足跡を残した場合(例:CRT+TBSのようなセットアップ)に限って、BUYの優先を検討してください。必ずリスク管理を厳格に守り、ドローダウンを安全な範囲に収めましょう。
⚠️ 免責事項:情報提供のみを目的としています。投資家は各自でリスク評価を行ってください。
💡 このシグナルをさらに深掘りしたいですか?最新情報はプロフィールのバイオをご覧ください!
$BTC #BinanceSquare #CryptoTrading #TechnicalAnalysis #MarketUpdate
139
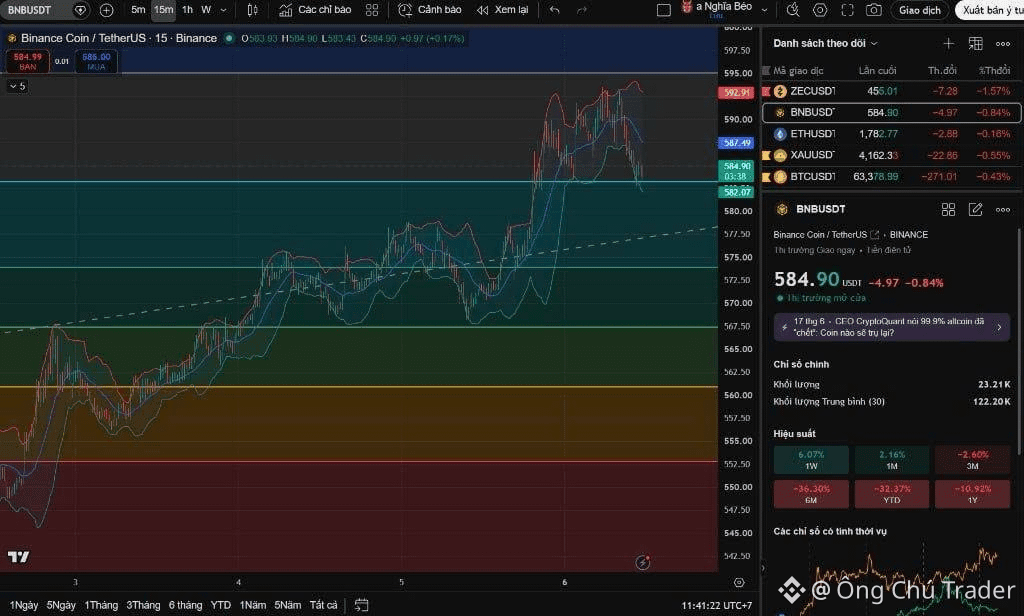
#BNB/USDT
📉 トレンド:全体的な上昇トレンドの中での下方修正(押し目)。
上値の供給ゾーンに到達した後、価格は短期的な売りの圧力を受けています。移動平均を下抜けし、現在は調整レンジ下限に接近中です。
🔹 サポート:
+ $582.07(現在の価格のすぐそばの構造的サポート。安定化の兆しが見られます)
+ $572.50(売りの圧力が支配的に続く場合の流動性クッション)
+ $567.50(重要な直近安値。中期の強気構造を維持するための最終防衛ライン)
🔸 レジスタンス:
+ $587.49(ダイナミックレジスタンス。戻りの局面で売り手がさらに価格を押し下げてくる可能性)
+ $592.91(最近確立された高値。大きな利益確定の圧力が示される強い供給ゾーン)
✅ 強気シナリオ:
$587.50の水準を明確に上抜けて、実体のあるローソク足でクローズした場合、買い手が主導権を取り戻します。これにより短期の弱気構造が崩れ、$592.91の高値への再テストに向かう道が開けます。
❌ 弱気シナリオ:
価格が$582.00のサポートを決定的に下回ってクローズした場合、投げ売りが加速し、$572.50ゾーンへより深く後退するリスクが高まります。
📊 取引戦略:
短期では売り手が優勢で、鋭い下落が発生しやすい状況です。そのため、ここでナイフを掴む行為(落ちてくるナイフを追う)は強く非推奨です。最適な対応は様子見を続け、$582.07のサポートでの値動きを監視することです。
辛抱強く待ち、明確な出来高/注文フローの確認サイン(例:CRT + TBSのセットアップ)がこのサポートゾーンで出た場合にのみ、BUYの優先順位を上げてください。リバウンドを狙うにせよトレンドに沿って取引するにせよ、常に厳格なリスク管理を徹底し、ドローダウンを安全な水準に保つためにストップロスを必ず適用してください。
⚠️ 免責事項:情報提供のみを目的としています。投資家は各自でリスク評価を行ってください。
💡 このシグナルをもっと深掘りしたいですか?最新情報はプロフィールのバイオをご覧ください!
$BNB #BinanceSquare #CryptoTrading #TechnicalAnalysis #MarketUpdate
#BNB/USDT
📉 トレンド:全体的な上昇トレンドの中での下方修正(押し目)。
上値の供給ゾーンに到達した後、価格は短期的な売りの圧力を受けています。移動平均を下抜けし、現在は調整レンジ下限に接近中です。
🔹 サポート:
+ $582.07(現在の価格のすぐそばの構造的サポート。安定化の兆しが見られます)
+ $572.50(売りの圧力が支配的に続く場合の流動性クッション)
+ $567.50(重要な直近安値。中期の強気構造を維持するための最終防衛ライン)
🔸 レジスタンス:
+ $587.49(ダイナミックレジスタンス。戻りの局面で売り手がさらに価格を押し下げてくる可能性)
+ $592.91(最近確立された高値。大きな利益確定の圧力が示される強い供給ゾーン)
✅ 強気シナリオ:
$587.50の水準を明確に上抜けて、実体のあるローソク足でクローズした場合、買い手が主導権を取り戻します。これにより短期の弱気構造が崩れ、$592.91の高値への再テストに向かう道が開けます。
❌ 弱気シナリオ:
価格が$582.00のサポートを決定的に下回ってクローズした場合、投げ売りが加速し、$572.50ゾーンへより深く後退するリスクが高まります。
📊 取引戦略:
短期では売り手が優勢で、鋭い下落が発生しやすい状況です。そのため、ここでナイフを掴む行為(落ちてくるナイフを追う)は強く非推奨です。最適な対応は様子見を続け、$582.07のサポートでの値動きを監視することです。
辛抱強く待ち、明確な出来高/注文フローの確認サイン(例:CRT + TBSのセットアップ)がこのサポートゾーンで出た場合にのみ、BUYの優先順位を上げてください。リバウンドを狙うにせよトレンドに沿って取引するにせよ、常に厳格なリスク管理を徹底し、ドローダウンを安全な水準に保つためにストップロスを必ず適用してください。
⚠️ 免責事項:情報提供のみを目的としています。投資家は各自でリスク評価を行ってください。
💡 このシグナルをもっと深掘りしたいですか?最新情報はプロフィールのバイオをご覧ください!
$BNB #BinanceSquare #CryptoTrading #TechnicalAnalysis #MarketUpdate
📉 トレンド:全体的な上昇トレンドの中での下方修正(押し目)。
上値の供給ゾーンに到達した後、価格は短期的な売りの圧力を受けています。移動平均を下抜けし、現在は調整レンジ下限に接近中です。
🔹 サポート:
+ $582.07(現在の価格のすぐそばの構造的サポート。安定化の兆しが見られます)
+ $572.50(売りの圧力が支配的に続く場合の流動性クッション)
+ $567.50(重要な直近安値。中期の強気構造を維持するための最終防衛ライン)
🔸 レジスタンス:
+ $587.49(ダイナミックレジスタンス。戻りの局面で売り手がさらに価格を押し下げてくる可能性)
+ $592.91(最近確立された高値。大きな利益確定の圧力が示される強い供給ゾーン)
✅ 強気シナリオ:
$587.50の水準を明確に上抜けて、実体のあるローソク足でクローズした場合、買い手が主導権を取り戻します。これにより短期の弱気構造が崩れ、$592.91の高値への再テストに向かう道が開けます。
❌ 弱気シナリオ:
価格が$582.00のサポートを決定的に下回ってクローズした場合、投げ売りが加速し、$572.50ゾーンへより深く後退するリスクが高まります。
📊 取引戦略:
短期では売り手が優勢で、鋭い下落が発生しやすい状況です。そのため、ここでナイフを掴む行為(落ちてくるナイフを追う)は強く非推奨です。最適な対応は様子見を続け、$582.07のサポートでの値動きを監視することです。
辛抱強く待ち、明確な出来高/注文フローの確認サイン(例:CRT + TBSのセットアップ)がこのサポートゾーンで出た場合にのみ、BUYの優先順位を上げてください。リバウンドを狙うにせよトレンドに沿って取引するにせよ、常に厳格なリスク管理を徹底し、ドローダウンを安全な水準に保つためにストップロスを必ず適用してください。
⚠️ 免責事項:情報提供のみを目的としています。投資家は各自でリスク評価を行ってください。
💡 このシグナルをもっと深掘りしたいですか?最新情報はプロフィールのバイオをご覧ください!
$BNB #BinanceSquare #CryptoTrading #TechnicalAnalysis #MarketUpdate
73
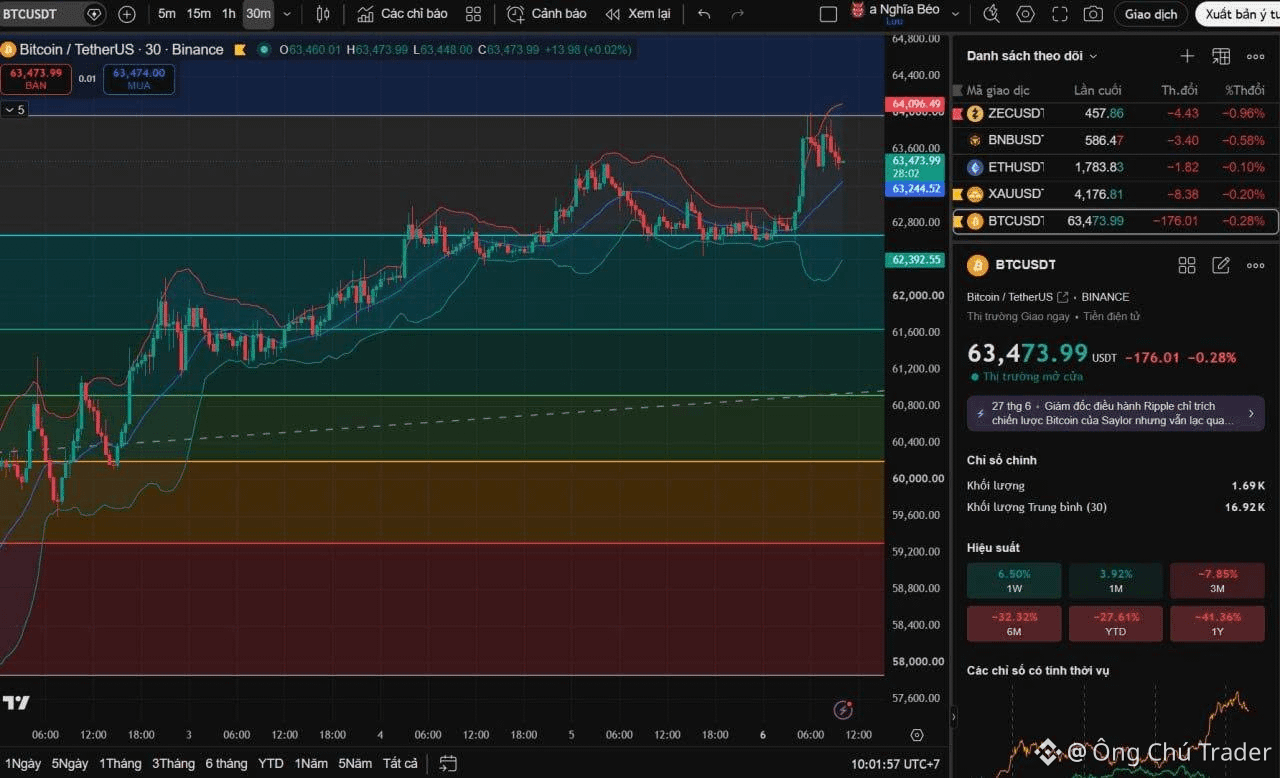
#BTC/USDT
📈 傾向:短期は強気 / 押し戻し。
価格は最近ローカルの高値を付けた後、移動平均に向けて小幅な下方修正を進めています。
🔹 サポート:
$63,244(直近の価格下限)
$62,392(堅い下側サポートゾーン)
🔸 レジスタンス:
$64,096(最近確立された高値 / 利確ゾーン)
$64,500(次の心理的節目)
✅ 強気シナリオ:
$64,100の水準を明確に上抜けることで上昇モメンタムが維持され、$64,500に向けた直接の道筋が開けます。
❌ 弱気シナリオ:
$63,200の水準を失うと、一時的に短期の強気構造が崩れ、$62,392の領域へ再び下落するリスクがあります。
📊 取引戦略:
全体の市場構造は依然として強気ですが、ここで価格を追いかけるのは、短期の売り圧が強いため強く非推奨です。
最も安全なのは、様子見に徹して$63,244の直近サポートが再テストされるのを監視することです。この水準で強気の反転シグナルが出たら、BUYのセットアップを優先してください。資金を守り、ドローダウンを安全な範囲に抑えるため、必ず厳格なストップロス管理を徹底してください。
⚠️ 免責事項:情報提供のみを目的としています。投資家は自己の判断でリスク評価を行ってください。
💡 このシグナルをさらに深掘りしたいですか?最新情報はプロフィールのバイオをご覧ください!
$BTC #BinanceSquare #CryptoTrading #TechnicalAnalysis #MarketUpdate
#BTC/USDT
📈 傾向:短期は強気 / 押し戻し。
価格は最近ローカルの高値を付けた後、移動平均に向けて小幅な下方修正を進めています。
🔹 サポート:
$63,244(直近の価格下限)
$62,392(堅い下側サポートゾーン)
🔸 レジスタンス:
$64,096(最近確立された高値 / 利確ゾーン)
$64,500(次の心理的節目)
✅ 強気シナリオ:
$64,100の水準を明確に上抜けることで上昇モメンタムが維持され、$64,500に向けた直接の道筋が開けます。
❌ 弱気シナリオ:
$63,200の水準を失うと、一時的に短期の強気構造が崩れ、$62,392の領域へ再び下落するリスクがあります。
📊 取引戦略:
全体の市場構造は依然として強気ですが、ここで価格を追いかけるのは、短期の売り圧が強いため強く非推奨です。
最も安全なのは、様子見に徹して$63,244の直近サポートが再テストされるのを監視することです。この水準で強気の反転シグナルが出たら、BUYのセットアップを優先してください。資金を守り、ドローダウンを安全な範囲に抑えるため、必ず厳格なストップロス管理を徹底してください。
⚠️ 免責事項:情報提供のみを目的としています。投資家は自己の判断でリスク評価を行ってください。
💡 このシグナルをさらに深掘りしたいですか?最新情報はプロフィールのバイオをご覧ください!
$BTC #BinanceSquare #CryptoTrading #TechnicalAnalysis #MarketUpdate
📈 傾向:短期は強気 / 押し戻し。
価格は最近ローカルの高値を付けた後、移動平均に向けて小幅な下方修正を進めています。
🔹 サポート:
$63,244(直近の価格下限)
$62,392(堅い下側サポートゾーン)
🔸 レジスタンス:
$64,096(最近確立された高値 / 利確ゾーン)
$64,500(次の心理的節目)
✅ 強気シナリオ:
$64,100の水準を明確に上抜けることで上昇モメンタムが維持され、$64,500に向けた直接の道筋が開けます。
❌ 弱気シナリオ:
$63,200の水準を失うと、一時的に短期の強気構造が崩れ、$62,392の領域へ再び下落するリスクがあります。
📊 取引戦略:
全体の市場構造は依然として強気ですが、ここで価格を追いかけるのは、短期の売り圧が強いため強く非推奨です。
最も安全なのは、様子見に徹して$63,244の直近サポートが再テストされるのを監視することです。この水準で強気の反転シグナルが出たら、BUYのセットアップを優先してください。資金を守り、ドローダウンを安全な範囲に抑えるため、必ず厳格なストップロス管理を徹底してください。
⚠️ 免責事項:情報提供のみを目的としています。投資家は自己の判断でリスク評価を行ってください。
💡 このシグナルをさらに深掘りしたいですか?最新情報はプロフィールのバイオをご覧ください!
$BTC #BinanceSquare #CryptoTrading #TechnicalAnalysis #MarketUpdate
118
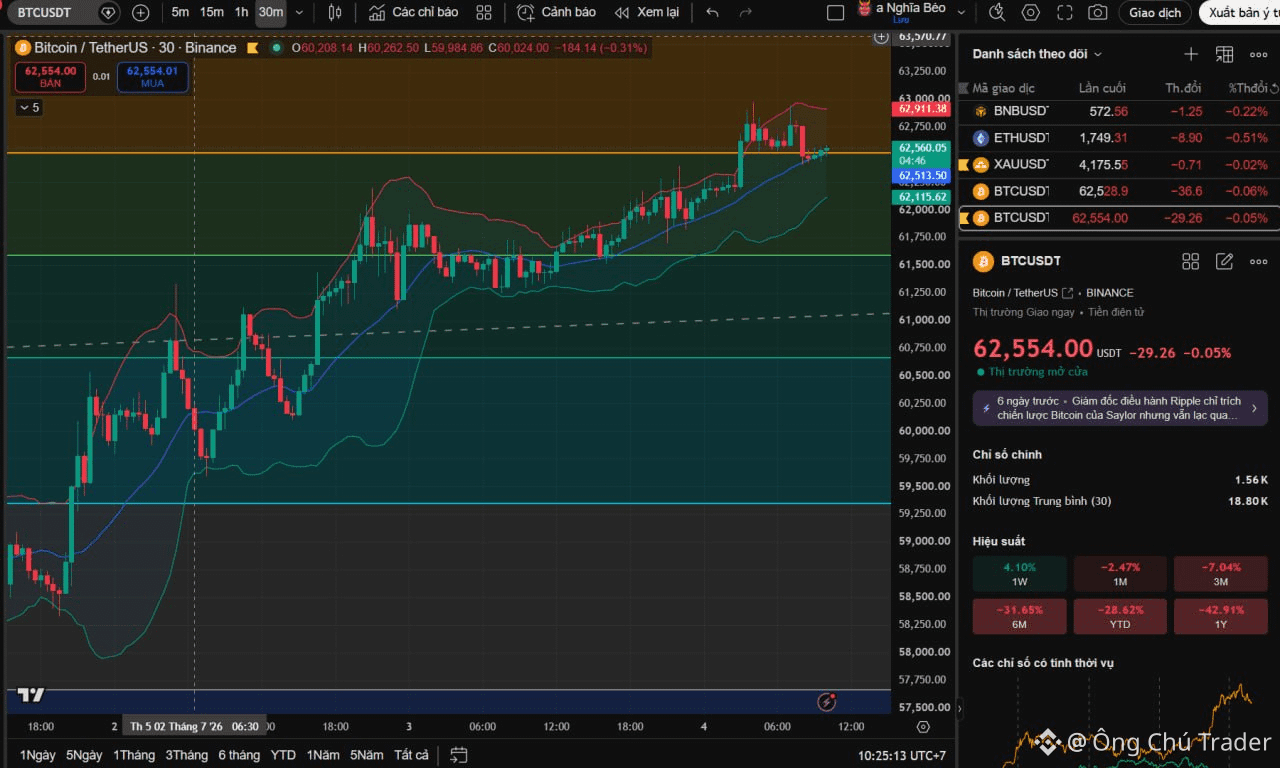
#BTC/USDT
📈 トレンド:短期的に強気 / 高水準でのレンジ相場。
BTCは$58,500のゾーンから約$62,500までの強い上昇(ラリー)を経て、その上向きの流れを維持しています。
現在、価格は直近の高値付近で足踏みしており、値固め(コンソリデーション)と軽微なボラティリティの兆しが見られます。
🔹 サポート:
$62,513(直近のサポート)
$62,115(強いサポート)
$61,500(調整時のより深いサポート)
🔸 レジスタンス:
$62,911(直近のレジスタンス)
$63,000(心理的レジスタンス)
$63,500(主要な上値のレジスタンス帯)
✅ 強気シナリオ:
BTCが$62,911エリアを突破し、その上で維持できれば、価格は$63,000~$63,500の目標レンジへ向けて進む可能性があります。
❌ 弱気シナリオ:
$62,513の水準を失うと、テクニカルな調整が$62,115へ戻るきっかけになり得ます。さらに深い下方向への拡張として、$61,500までの可能性もあります。
📊 取引戦略:
全体としての見通しはBUY(買い)セットアップ寄りですが、価格が高水準で取引されているため、短期的な利益確定が強く見込まれます。
この高値圏でのFOMO(恐怖による衝動買い)は避けましょう。優先順位は、価格が$62,115~$62,513のサポート群をしっかり防衛するのを待つこと、または$62,911を超えるクリーンで出来高の伴ったブレイクアウトが起きてからエントリー位置を探すことです。
⚠️ 免責事項:情報提供のみを目的としています。投資家は各自でリスク評価を行ってください。
💡 このシグナルをさらに深掘りしたいですか?最新情報は私のプロフィールのバイオをご覧ください!
$BTC #BinanceSquare #CryptoTrading #TechnicalAnalysis #MarketUpdate
#BTC/USDT
📈 トレンド:短期的に強気 / 高水準でのレンジ相場。
BTCは$58,500のゾーンから約$62,500までの強い上昇(ラリー)を経て、その上向きの流れを維持しています。
現在、価格は直近の高値付近で足踏みしており、値固め(コンソリデーション)と軽微なボラティリティの兆しが見られます。
🔹 サポート:
$62,513(直近のサポート)
$62,115(強いサポート)
$61,500(調整時のより深いサポート)
🔸 レジスタンス:
$62,911(直近のレジスタンス)
$63,000(心理的レジスタンス)
$63,500(主要な上値のレジスタンス帯)
✅ 強気シナリオ:
BTCが$62,911エリアを突破し、その上で維持できれば、価格は$63,000~$63,500の目標レンジへ向けて進む可能性があります。
❌ 弱気シナリオ:
$62,513の水準を失うと、テクニカルな調整が$62,115へ戻るきっかけになり得ます。さらに深い下方向への拡張として、$61,500までの可能性もあります。
📊 取引戦略:
全体としての見通しはBUY(買い)セットアップ寄りですが、価格が高水準で取引されているため、短期的な利益確定が強く見込まれます。
この高値圏でのFOMO(恐怖による衝動買い)は避けましょう。優先順位は、価格が$62,115~$62,513のサポート群をしっかり防衛するのを待つこと、または$62,911を超えるクリーンで出来高の伴ったブレイクアウトが起きてからエントリー位置を探すことです。
⚠️ 免責事項:情報提供のみを目的としています。投資家は各自でリスク評価を行ってください。
💡 このシグナルをさらに深掘りしたいですか?最新情報は私のプロフィールのバイオをご覧ください!
$BTC #BinanceSquare #CryptoTrading #TechnicalAnalysis #MarketUpdate
📈 トレンド:短期的に強気 / 高水準でのレンジ相場。
BTCは$58,500のゾーンから約$62,500までの強い上昇(ラリー)を経て、その上向きの流れを維持しています。
現在、価格は直近の高値付近で足踏みしており、値固め(コンソリデーション)と軽微なボラティリティの兆しが見られます。
🔹 サポート:
$62,513(直近のサポート)
$62,115(強いサポート)
$61,500(調整時のより深いサポート)
🔸 レジスタンス:
$62,911(直近のレジスタンス)
$63,000(心理的レジスタンス)
$63,500(主要な上値のレジスタンス帯)
✅ 強気シナリオ:
BTCが$62,911エリアを突破し、その上で維持できれば、価格は$63,000~$63,500の目標レンジへ向けて進む可能性があります。
❌ 弱気シナリオ:
$62,513の水準を失うと、テクニカルな調整が$62,115へ戻るきっかけになり得ます。さらに深い下方向への拡張として、$61,500までの可能性もあります。
📊 取引戦略:
全体としての見通しはBUY(買い)セットアップ寄りですが、価格が高水準で取引されているため、短期的な利益確定が強く見込まれます。
この高値圏でのFOMO(恐怖による衝動買い)は避けましょう。優先順位は、価格が$62,115~$62,513のサポート群をしっかり防衛するのを待つこと、または$62,911を超えるクリーンで出来高の伴ったブレイクアウトが起きてからエントリー位置を探すことです。
⚠️ 免責事項:情報提供のみを目的としています。投資家は各自でリスク評価を行ってください。
💡 このシグナルをさらに深掘りしたいですか?最新情報は私のプロフィールのバイオをご覧ください!
$BTC #BinanceSquare #CryptoTrading #TechnicalAnalysis #MarketUpdate
80
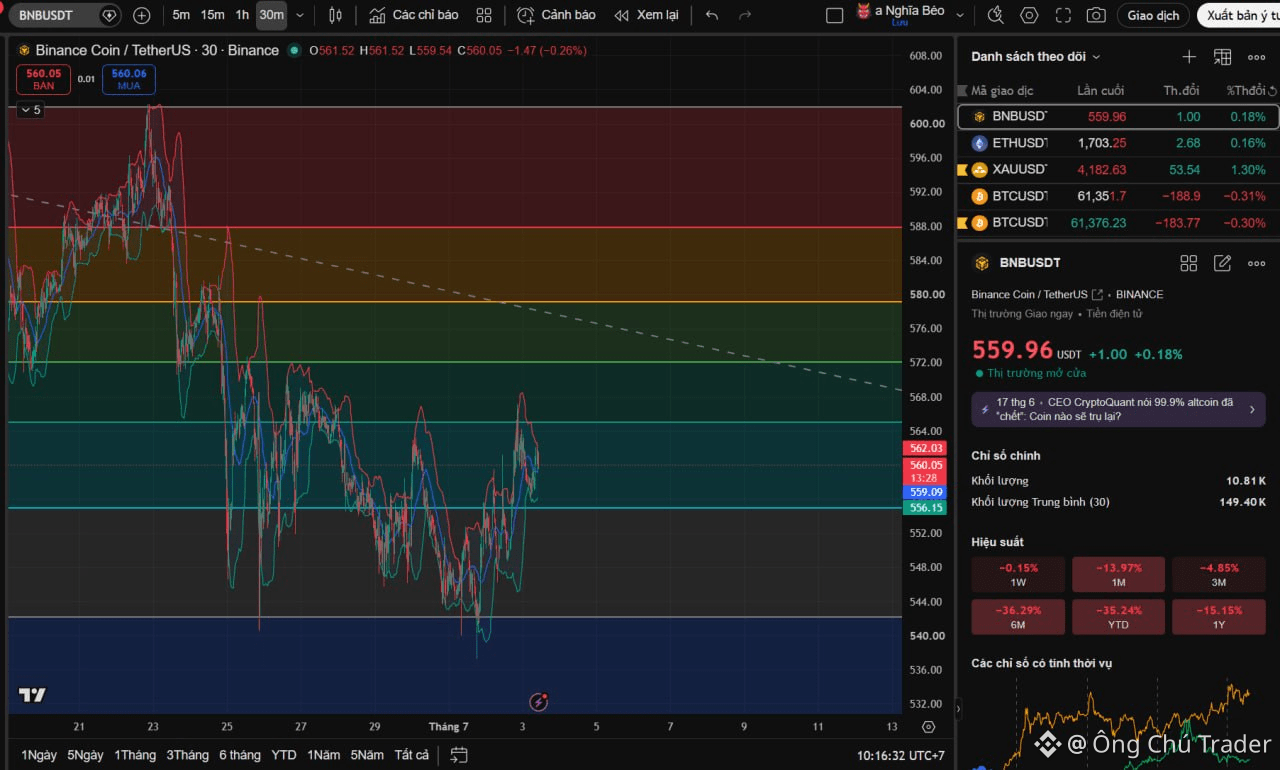
#BNB/USDT
{spot}(BNBUSDT)
📉 傾向: 弱気トレンド内での短期的なリバウンド。
M30の時間軸では、BNBが$540の底から約$560まで回復しています。
ただし、価格は依然として主要な上値の抵抗を突破できていないため、より広いトレンドは売り圧力下にあります。
🔹 サポート:
$556.15(直近サポート)
$552.00(中間サポート)
$540.00 – $544.00(強いサポート)
🔸 レジスタンス:
$562.03(直近レジスタンス)
$564.00 – $568.00(強いレジスタンス帯)
$572.00(次の上値レジスタンス)
✅ $562.03以上の場合:
BNBがこの水準をクリアし、維持できれば、価格は$564 – $568へ向けて回復を続ける可能性があります。さらに先の目標は$572です。
❌ $556.15未満の場合:
このエリアを失うと$552までの押し戻しが起こり得ます。さらに深い下落では、$544 – $540のゾーンがターゲットになり得ます。
📊 市場見通し:
BNBには回復への関心が見られるものの、まだ強い構造的な反転は確認できていません。優先事項は、$562 – $564のクラスターを上抜けする「クリーンなブレイク」か、$556をしっかり防衛する健全な押し戻しのどちらかを待つことです。価格が抵抗付近で推移しているため、FOMO(焦っての買い)を避けてください。
⚠️ 免責事項: 情報提供のみを目的としています。投資家は各自でリスク評価を行ってください。
💡 このシグナルをさらに深掘りしたいですか?私のプロフィールのバイオをチェックして、最新情報をご覧ください!
$BNB #BinanceSquare #CryptoTrading #TechnicalAnalysis #MarketUpdate
#BNB/USDT
📉 傾向: 弱気トレンド内での短期的なリバウンド。
M30の時間軸では、BNBが$540の底から約$560まで回復しています。
ただし、価格は依然として主要な上値の抵抗を突破できていないため、より広いトレンドは売り圧力下にあります。
🔹 サポート:
$556.15(直近サポート)
$552.00(中間サポート)
$540.00 – $544.00(強いサポート)
🔸 レジスタンス:
$562.03(直近レジスタンス)
$564.00 – $568.00(強いレジスタンス帯)
$572.00(次の上値レジスタンス)
✅ $562.03以上の場合:
BNBがこの水準をクリアし、維持できれば、価格は$564 – $568へ向けて回復を続ける可能性があります。さらに先の目標は$572です。
❌ $556.15未満の場合:
このエリアを失うと$552までの押し戻しが起こり得ます。さらに深い下落では、$544 – $540のゾーンがターゲットになり得ます。
📊 市場見通し:
BNBには回復への関心が見られるものの、まだ強い構造的な反転は確認できていません。優先事項は、$562 – $564のクラスターを上抜けする「クリーンなブレイク」か、$556をしっかり防衛する健全な押し戻しのどちらかを待つことです。価格が抵抗付近で推移しているため、FOMO(焦っての買い)を避けてください。
⚠️ 免責事項: 情報提供のみを目的としています。投資家は各自でリスク評価を行ってください。
💡 このシグナルをさらに深掘りしたいですか?私のプロフィールのバイオをチェックして、最新情報をご覧ください!
$BNB #BinanceSquare #CryptoTrading #TechnicalAnalysis #MarketUpdate
📉 傾向: 弱気トレンド内での短期的なリバウンド。
M30の時間軸では、BNBが$540の底から約$560まで回復しています。
ただし、価格は依然として主要な上値の抵抗を突破できていないため、より広いトレンドは売り圧力下にあります。
🔹 サポート:
$556.15(直近サポート)
$552.00(中間サポート)
$540.00 – $544.00(強いサポート)
🔸 レジスタンス:
$562.03(直近レジスタンス)
$564.00 – $568.00(強いレジスタンス帯)
$572.00(次の上値レジスタンス)
✅ $562.03以上の場合:
BNBがこの水準をクリアし、維持できれば、価格は$564 – $568へ向けて回復を続ける可能性があります。さらに先の目標は$572です。
❌ $556.15未満の場合:
このエリアを失うと$552までの押し戻しが起こり得ます。さらに深い下落では、$544 – $540のゾーンがターゲットになり得ます。
📊 市場見通し:
BNBには回復への関心が見られるものの、まだ強い構造的な反転は確認できていません。優先事項は、$562 – $564のクラスターを上抜けする「クリーンなブレイク」か、$556をしっかり防衛する健全な押し戻しのどちらかを待つことです。価格が抵抗付近で推移しているため、FOMO(焦っての買い)を避けてください。
⚠️ 免責事項: 情報提供のみを目的としています。投資家は各自でリスク評価を行ってください。
💡 このシグナルをさらに深掘りしたいですか?私のプロフィールのバイオをチェックして、最新情報をご覧ください!
$BNB #BinanceSquare #CryptoTrading #TechnicalAnalysis #MarketUpdate
83
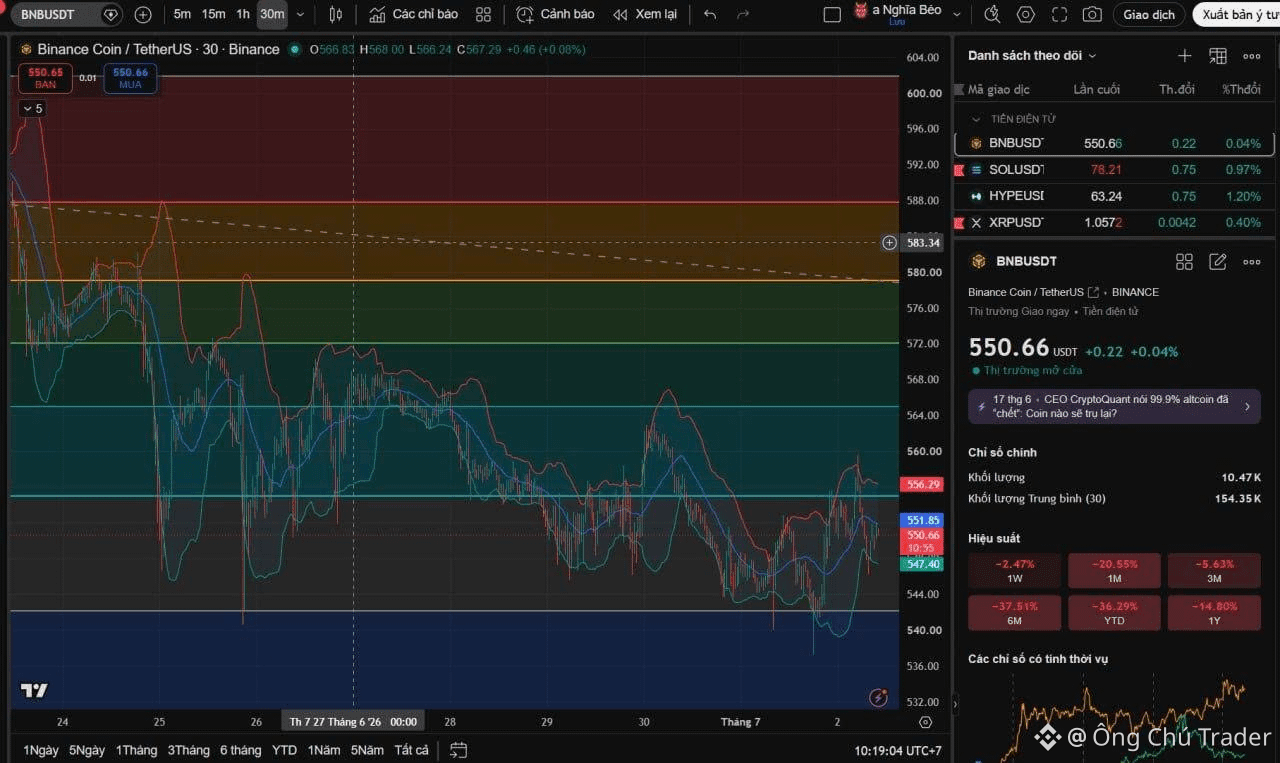
#BNB/USDT
{spot}(BNBUSDT)
📉 トレンド:短期的に弱気 / 弱いテクニカル・リバウンド。価格は最近$540の底から跳ね返ったものの、目先の上値にあるレジスタンスをまだ突破できていません。現在は約$550.66で取引されており、BNBは短期的な売り圧力が残っています。
🔹 サポート:
$547.40(直近サポート)
$540.00 – $543.00(強いサポート)
🔸 レジスタンス:
$551.85(直近レジスタンス)
$556.29(強いレジスタンス)
$564.00(強いリバウンド後の次のレジスタンス)
✅ 強気シナリオ:BNBが$551.85のゾーンをクリアして維持できれば、価格は$556.29に向けて回復する可能性があります。この水準を上抜けることが、短期的な構造を改善するために必要です。
❌ 弱気シナリオ:$547.40のサポートを失うと、$543 – $540ゾーンを再テストするための押し戻しリスクが高まります。
📊 取引戦略:現状のリバウンドに力がないため、BNBは依然として弱気に傾いています。優先順位は、$556.29を明確にブレイクするのを待つこと、または$547 – $540ゾーンでの値動きを監視することです。ブレイクが確認される前に追いかけるのは避けましょう。
⚠️ 免責事項:情報提供のみを目的としています。投資家は各自でリスクを評価してください。
💡 このシグナルをさらに深掘りしたいですか?プロフィールのバイオをチェックして、最新情報を確認してください!
$BNB #BinanceSquare #CryptoTrading #TechnicalAnalysis #MarketUpdate
#BNB/USDT
📉 トレンド:短期的に弱気 / 弱いテクニカル・リバウンド。価格は最近$540の底から跳ね返ったものの、目先の上値にあるレジスタンスをまだ突破できていません。現在は約$550.66で取引されており、BNBは短期的な売り圧力が残っています。
🔹 サポート:
$547.40(直近サポート)
$540.00 – $543.00(強いサポート)
🔸 レジスタンス:
$551.85(直近レジスタンス)
$556.29(強いレジスタンス)
$564.00(強いリバウンド後の次のレジスタンス)
✅ 強気シナリオ:BNBが$551.85のゾーンをクリアして維持できれば、価格は$556.29に向けて回復する可能性があります。この水準を上抜けることが、短期的な構造を改善するために必要です。
❌ 弱気シナリオ:$547.40のサポートを失うと、$543 – $540ゾーンを再テストするための押し戻しリスクが高まります。
📊 取引戦略:現状のリバウンドに力がないため、BNBは依然として弱気に傾いています。優先順位は、$556.29を明確にブレイクするのを待つこと、または$547 – $540ゾーンでの値動きを監視することです。ブレイクが確認される前に追いかけるのは避けましょう。
⚠️ 免責事項:情報提供のみを目的としています。投資家は各自でリスクを評価してください。
💡 このシグナルをさらに深掘りしたいですか?プロフィールのバイオをチェックして、最新情報を確認してください!
$BNB #BinanceSquare #CryptoTrading #TechnicalAnalysis #MarketUpdate
📉 トレンド:短期的に弱気 / 弱いテクニカル・リバウンド。価格は最近$540の底から跳ね返ったものの、目先の上値にあるレジスタンスをまだ突破できていません。現在は約$550.66で取引されており、BNBは短期的な売り圧力が残っています。
🔹 サポート:
$547.40(直近サポート)
$540.00 – $543.00(強いサポート)
🔸 レジスタンス:
$551.85(直近レジスタンス)
$556.29(強いレジスタンス)
$564.00(強いリバウンド後の次のレジスタンス)
✅ 強気シナリオ:BNBが$551.85のゾーンをクリアして維持できれば、価格は$556.29に向けて回復する可能性があります。この水準を上抜けることが、短期的な構造を改善するために必要です。
❌ 弱気シナリオ:$547.40のサポートを失うと、$543 – $540ゾーンを再テストするための押し戻しリスクが高まります。
📊 取引戦略:現状のリバウンドに力がないため、BNBは依然として弱気に傾いています。優先順位は、$556.29を明確にブレイクするのを待つこと、または$547 – $540ゾーンでの値動きを監視することです。ブレイクが確認される前に追いかけるのは避けましょう。
⚠️ 免責事項:情報提供のみを目的としています。投資家は各自でリスクを評価してください。
💡 このシグナルをさらに深掘りしたいですか?プロフィールのバイオをチェックして、最新情報を確認してください!
$BNB #BinanceSquare #CryptoTrading #TechnicalAnalysis #MarketUpdate
1
58
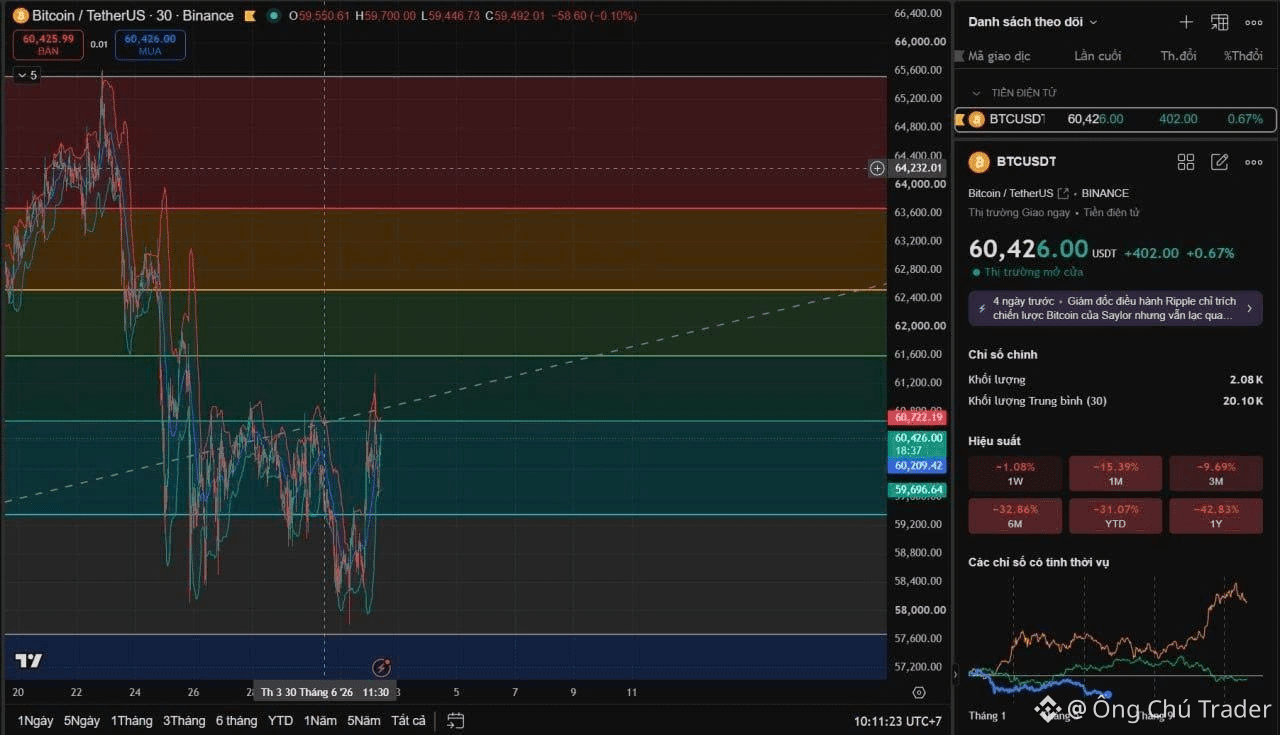
#BTC/USDT
{spot}(BTCUSDT)
📉 傾向:弱気トレンド内での短期リバウンド。
BTCは$58,000の底から$60,426付近まで強く反発しました。ですが、価格が主要な上値の抵抗ゾーンを下回っているため、マクロのトレンドはまだ反転していません。
🔹 サポート:
$60,209(直近のサポート)
$59,696(強いサポート)
$59,200(大きな売りが入った場合のより深いサポート)
🔸 レジスタンス:
$60,722(直近のレジスタンス)
$61,600(強いレジスタンス)
$62,400(非常に強い上値抵抗)
✅ 強気シナリオ:
BTCが$60,722のゾーンをクリアし、そこを維持できれば、価格は回復を続けて$61,600へ向かう可能性があります。さらに延長目標は$62,400です。
❌ 弱気シナリオ:
$60,209の水準を失うと、$59,696までの押し戻しが起こり得ます。さらにこのゾーンを下抜けると、$59,200〜$58,000エリアへの後退リスクが大幅に高まります。
📊 取引戦略:
BTCは大きな下落の後に堅調に反発していますが、これは依然としてテクニカルなリバウンドです。より前向きな構造的変化のためには、価格が$60,722〜$61,600のクラスターを明確にブレイクする必要があります。
今はFOMO(恐怖による焦り)を避けましょう。エントリーを検討する前に、価格がサポートを防衛するのを待つか、はっきりしたブレイクアウトを実行することを優先してください。
⚠️ 注意:本情報は情報提供のみです。投資家は各自でリスク評価を行ってください。
💡 このシグナルをさらに深掘りしたいですか?最新情報はプロフィールの自己紹介をご覧ください!
$BTC #BinanceSquare #CryptoTrading #TechnicalAnalysis #MarketUpdate
#BTC/USDT
📉 傾向:弱気トレンド内での短期リバウンド。
BTCは$58,000の底から$60,426付近まで強く反発しました。ですが、価格が主要な上値の抵抗ゾーンを下回っているため、マクロのトレンドはまだ反転していません。
🔹 サポート:
$60,209(直近のサポート)
$59,696(強いサポート)
$59,200(大きな売りが入った場合のより深いサポート)
🔸 レジスタンス:
$60,722(直近のレジスタンス)
$61,600(強いレジスタンス)
$62,400(非常に強い上値抵抗)
✅ 強気シナリオ:
BTCが$60,722のゾーンをクリアし、そこを維持できれば、価格は回復を続けて$61,600へ向かう可能性があります。さらに延長目標は$62,400です。
❌ 弱気シナリオ:
$60,209の水準を失うと、$59,696までの押し戻しが起こり得ます。さらにこのゾーンを下抜けると、$59,200〜$58,000エリアへの後退リスクが大幅に高まります。
📊 取引戦略:
BTCは大きな下落の後に堅調に反発していますが、これは依然としてテクニカルなリバウンドです。より前向きな構造的変化のためには、価格が$60,722〜$61,600のクラスターを明確にブレイクする必要があります。
今はFOMO(恐怖による焦り)を避けましょう。エントリーを検討する前に、価格がサポートを防衛するのを待つか、はっきりしたブレイクアウトを実行することを優先してください。
⚠️ 注意:本情報は情報提供のみです。投資家は各自でリスク評価を行ってください。
💡 このシグナルをさらに深掘りしたいですか?最新情報はプロフィールの自己紹介をご覧ください!
$BTC #BinanceSquare #CryptoTrading #TechnicalAnalysis #MarketUpdate
📉 傾向:弱気トレンド内での短期リバウンド。
BTCは$58,000の底から$60,426付近まで強く反発しました。ですが、価格が主要な上値の抵抗ゾーンを下回っているため、マクロのトレンドはまだ反転していません。
🔹 サポート:
$60,209(直近のサポート)
$59,696(強いサポート)
$59,200(大きな売りが入った場合のより深いサポート)
🔸 レジスタンス:
$60,722(直近のレジスタンス)
$61,600(強いレジスタンス)
$62,400(非常に強い上値抵抗)
✅ 強気シナリオ:
BTCが$60,722のゾーンをクリアし、そこを維持できれば、価格は回復を続けて$61,600へ向かう可能性があります。さらに延長目標は$62,400です。
❌ 弱気シナリオ:
$60,209の水準を失うと、$59,696までの押し戻しが起こり得ます。さらにこのゾーンを下抜けると、$59,200〜$58,000エリアへの後退リスクが大幅に高まります。
📊 取引戦略:
BTCは大きな下落の後に堅調に反発していますが、これは依然としてテクニカルなリバウンドです。より前向きな構造的変化のためには、価格が$60,722〜$61,600のクラスターを明確にブレイクする必要があります。
今はFOMO(恐怖による焦り)を避けましょう。エントリーを検討する前に、価格がサポートを防衛するのを待つか、はっきりしたブレイクアウトを実行することを優先してください。
⚠️ 注意:本情報は情報提供のみです。投資家は各自でリスク評価を行ってください。
💡 このシグナルをさらに深掘りしたいですか?最新情報はプロフィールの自己紹介をご覧ください!
$BTC #BinanceSquare #CryptoTrading #TechnicalAnalysis #MarketUpdate
1
106
·
--
ブリッシュ
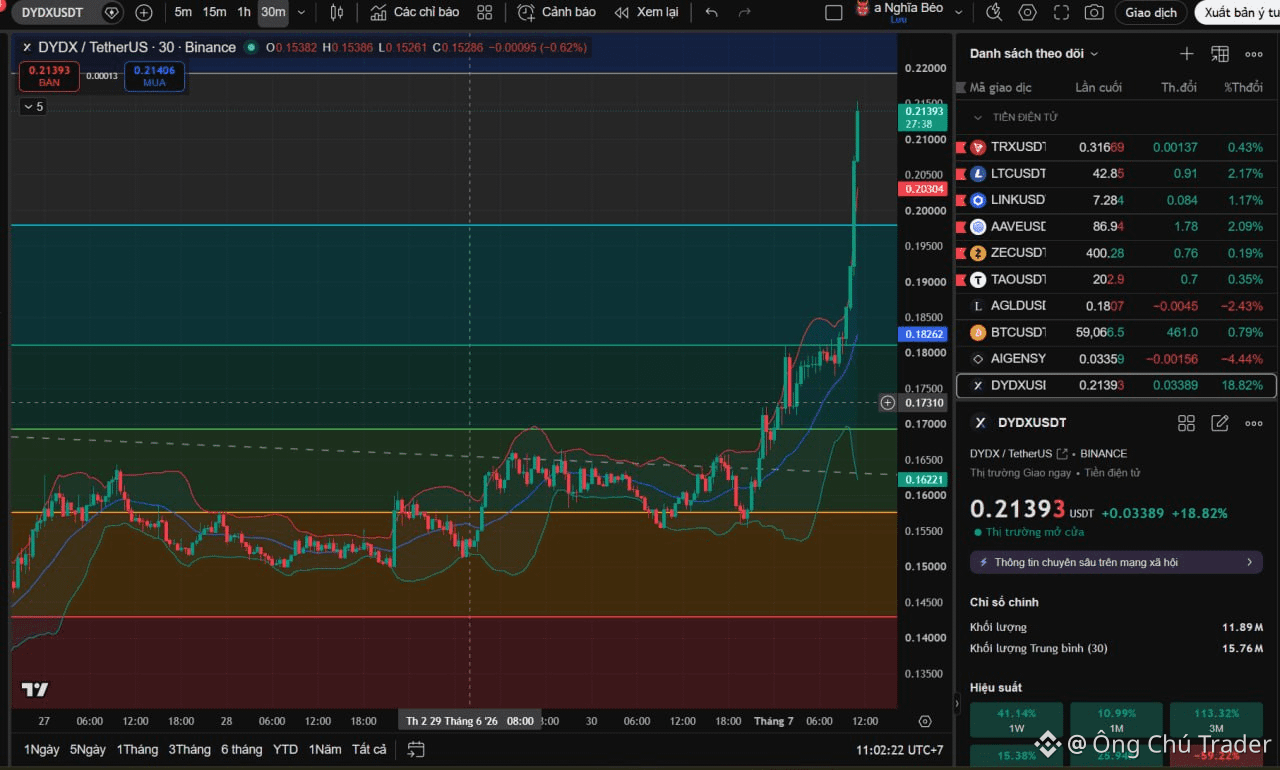
#DYDX/USDT
{spot}(DYDXUSDT)
📉 トレンド:短期的に強気(ブル) / ブレイクアウト。
M30(30分足)では、価格が蓄積(コンソリデーション)ゾーンを明確にブレイクし、約19%の急騰を示しています。現在は約$0.21393で取引されており、買い手が主導権を握っていますが、価格は利益確定が起こり得る領域に入りつつあります。
🔹 サポート:
$0.20304(直近サポート)
$0.18626(強いサポート)
🔸 レジスタンス:
$0.21393(直近レジスタンス - 現在の高値)
$0.22000(強い / 心理的レジスタンス)
✅ $0.21393 上:
この水準を維持し、$0.22000を上抜けできれば、DYDXは上昇を継続し、$0.230〜$0.240のゾーンへ伸びる可能性があります。
❌ $0.20304 下:
この領域を失うと、より深いテクニカルな調整が入り、買い需要を再確認するために$0.18626まで戻されるリスクがあります。
📊 市場見通し:
DYDXはブレイクアウト後に強い上昇モメンタムを示しています。とはいえ、急激な縦方向への伸びの後にここから価格を追いかけると、大きなFOMO(取り残し不安)のリスクがあります。
優先事項は、新規エントリーを検討する前に、$0.203〜$0.186のサポート・クラスターへ向けての健全な押し目、または統合(コンソリデーション)を待つことです。
⚠️ 免責事項:情報提供のみを目的としています。投資家は各自でリスク評価を行ってください。
💡 このシグナルをもっと深掘りしたいですか?プロフィールのバイオをチェックして、最新情報をご確認ください!
$DYDX #BinanceSquare #CryptoTrading #TechnicalAnalysis #Altcoins
#DYDX/USDT
📉 トレンド:短期的に強気(ブル) / ブレイクアウト。
M30(30分足)では、価格が蓄積(コンソリデーション)ゾーンを明確にブレイクし、約19%の急騰を示しています。現在は約$0.21393で取引されており、買い手が主導権を握っていますが、価格は利益確定が起こり得る領域に入りつつあります。
🔹 サポート:
$0.20304(直近サポート)
$0.18626(強いサポート)
🔸 レジスタンス:
$0.21393(直近レジスタンス - 現在の高値)
$0.22000(強い / 心理的レジスタンス)
✅ $0.21393 上:
この水準を維持し、$0.22000を上抜けできれば、DYDXは上昇を継続し、$0.230〜$0.240のゾーンへ伸びる可能性があります。
❌ $0.20304 下:
この領域を失うと、より深いテクニカルな調整が入り、買い需要を再確認するために$0.18626まで戻されるリスクがあります。
📊 市場見通し:
DYDXはブレイクアウト後に強い上昇モメンタムを示しています。とはいえ、急激な縦方向への伸びの後にここから価格を追いかけると、大きなFOMO(取り残し不安)のリスクがあります。
優先事項は、新規エントリーを検討する前に、$0.203〜$0.186のサポート・クラスターへ向けての健全な押し目、または統合(コンソリデーション)を待つことです。
⚠️ 免責事項:情報提供のみを目的としています。投資家は各自でリスク評価を行ってください。
💡 このシグナルをもっと深掘りしたいですか?プロフィールのバイオをチェックして、最新情報をご確認ください!
$DYDX #BinanceSquare #CryptoTrading #TechnicalAnalysis #Altcoins
📉 トレンド:短期的に強気(ブル) / ブレイクアウト。
M30(30分足)では、価格が蓄積(コンソリデーション)ゾーンを明確にブレイクし、約19%の急騰を示しています。現在は約$0.21393で取引されており、買い手が主導権を握っていますが、価格は利益確定が起こり得る領域に入りつつあります。
🔹 サポート:
$0.20304(直近サポート)
$0.18626(強いサポート)
🔸 レジスタンス:
$0.21393(直近レジスタンス - 現在の高値)
$0.22000(強い / 心理的レジスタンス)
✅ $0.21393 上:
この水準を維持し、$0.22000を上抜けできれば、DYDXは上昇を継続し、$0.230〜$0.240のゾーンへ伸びる可能性があります。
❌ $0.20304 下:
この領域を失うと、より深いテクニカルな調整が入り、買い需要を再確認するために$0.18626まで戻されるリスクがあります。
📊 市場見通し:
DYDXはブレイクアウト後に強い上昇モメンタムを示しています。とはいえ、急激な縦方向への伸びの後にここから価格を追いかけると、大きなFOMO(取り残し不安)のリスクがあります。
優先事項は、新規エントリーを検討する前に、$0.203〜$0.186のサポート・クラスターへ向けての健全な押し目、または統合(コンソリデーション)を待つことです。
⚠️ 免責事項:情報提供のみを目的としています。投資家は各自でリスク評価を行ってください。
💡 このシグナルをもっと深掘りしたいですか?プロフィールのバイオをチェックして、最新情報をご確認ください!
$DYDX #BinanceSquare #CryptoTrading #TechnicalAnalysis #Altcoins
1
245
ログインして、さらにコンテンツを読む
厳選トピックで世界の暗号資産トレーダーの仲間入り
⚡️ 暗号資産に関する最新かつ有益な情報が見つかります。
💬 世界最大の暗号資産取引所から信頼されています。
👍 認証を受けたクリエイターから、有益なインサイトを得られます。
メール / 電話番号
トレンドトピック
DriftHackVictimsBeginClaims
閲覧回数 8,950
162人が討論中
#DriftHackVictimsBeginClaims
ソラナ(Solana)を基盤とした非中央集権型の注目の無期限先物取引所「El Drift Protocol」が、回復トークンであるDFXの請求・償還(リデンプション)ポータルを正式に開設しました。この措置は、4月1日に発生した壊滅的な大規模ハッキングによって被害を受けたユーザーを補償することを目的としています。北朝鮮に関連する勢力による攻撃で、同プラットフォームから約2億9,540万ドルが流出したとされています。被害者は、その日のスナップショット(snapshot)で検証された損失1USDTごとにDFXトークンを受け取ります。とはいえ、回復基金の当初配分(約311万USDT)は、初期の償還レートを1DFXあたりわずか0.0104USDTに設定しており、つまりこの第1段階ではユーザーは失った1ドルにつき約1セント相当を受け取る計算になります。被害者は公式ポータルを通じて、2028年1月1日までにトークンを請求できます。期限後は、未請求のDFX供給分はすべて永久にバーン(焼却)されます。
続いて、ポータルやデジタルの金融アラート告知に関連する実際の画像を示します:
WorldWideWeb The World ARPANET Archie EFF
·いいね:2件
·閲覧回数 266
SolanaTokenizedStockVolumeTops$4.4BInSeptember
閲覧回数 1,609
24人が討論中
BitcoinSpotETFsDraw$6.34BInflowsInQ3
閲覧回数 9,536
136人が討論中