Binance Square

The trading chat man

"Hi, I’m Aero. I am a dedicated Forex trader with a deep passion for navigating the financial markets and decoding complex price action.
取引を発注
1.8年
199 フォロー
67 フォロワー
8 いいね
0 共有
投稿
ポートフォリオ
·
--
BTC価格圧縮:主要なトラップとプレミアム実行ゾーン$BTC 現在のBTC/USDTの生ライブ価格は$76,150と$76,600の間で取引されており、最近のローカルピークから反転した後、脆弱な短期収縮パターンでコンソリデーションしています。ハイタイムフレームのオーダーフローマトリックスを見ると、ビットコインは$78,000ゾーンで重い構造的なディストリビューション抵抗に直面しており、ここでは機関投資家の売り注文が市場を厳しく制限し、ダウンサイドの修正を強いられました。インストラデイチャートでは、ブルが取り戻すべき即時のハードルは$77,200レベルで、これは100時間移動平均と一致しており、現在の供給側の障害を示しています。現在のスポット価格のすぐ下には、$76,000の内部ピボットサポートがあり、これはマイクロフロアを維持しようとするバイヤーによって積極的に防御されています。このローカルサポートが崩れた場合、主要な機関需要プールとコアのハイタイムフレーム蓄積ゾーンは、$74,500と$75,000の間で売り圧力を吸収する準備が整っています。

BTC価格圧縮:主要なトラップとプレミアム実行ゾーン

$BTC 現在のBTC/USDTの生ライブ価格は$76,150と$76,600の間で取引されており、最近のローカルピークから反転した後、脆弱な短期収縮パターンでコンソリデーションしています。ハイタイムフレームのオーダーフローマトリックスを見ると、ビットコインは$78,000ゾーンで重い構造的なディストリビューション抵抗に直面しており、ここでは機関投資家の売り注文が市場を厳しく制限し、ダウンサイドの修正を強いられました。インストラデイチャートでは、ブルが取り戻すべき即時のハードルは$77,200レベルで、これは100時間移動平均と一致しており、現在の供給側の障害を示しています。現在のスポット価格のすぐ下には、$76,000の内部ピボットサポートがあり、これはマイクロフロアを維持しようとするバイヤーによって積極的に防御されています。このローカルサポートが崩れた場合、主要な機関需要プールとコアのハイタイムフレーム蓄積ゾーンは、$74,500と$75,000の間で売り圧力を吸収する準備が整っています。
翻訳参照
USDC Analysis: The Role of Stablecoins in Trading$USDC In normal market conditions, USDC fluctuates minimally—usually between $0.999 and $1.001. Some institutional traders exploit these micro-fluctuations via high-volume arbitrage, but the margins are incredibly small for retail traders. However, looking at the historical chart, you can see rare moments of high volatility known as de-pegging. For instance, during the Silicon Valley Bank crisis in March 2023, USDC temporarily dropped to around $0.88 due to panic. Traders who bought the fear at $0.88 made a quick ~13% profit when it inevitably restored its $1.00 peg days later. #USDC #USDC✅ {spot}(USDCUSDT)

USDC Analysis: The Role of Stablecoins in Trading

$USDC
In normal market conditions, USDC fluctuates minimally—usually between $0.999 and $1.001. Some institutional traders exploit these micro-fluctuations via high-volume arbitrage, but the margins are incredibly small for retail traders.
However, looking at the historical chart, you can see rare moments of high volatility known as de-pegging. For instance, during the Silicon Valley Bank crisis in March 2023, USDC temporarily dropped to around $0.88 due to panic. Traders who bought the fear at $0.88 made a quick ~13% profit when it inevitably restored its $1.00 peg days later.
#USDC #USDC✅
翻訳参照
BNB/USDT Liquidity Blueprint: Ranges, Sweeps, and High-Probability Entries$BNB The current live price of BNB/USDT is trading tightly between $658.31 and $662.47, compressing inside a very specific neutral range. If we look strictly at the high-timeframe order flow matrix, the token has strong structural resistance sitting at $689.80, where big institutional sellers aggressively swiped retail buy-stops earlier this month. On the local intraday chart, the immediate hurdle for a bullish continuation is the $673.10 level, which represents today's current range high. Right below current market prices, the nearest support block rests at $648.00, which protects a massive pool of internal sell-side liquidity. The ultimate institutional demand core, where major whale limit orders are clustered, is tucked much deeper down between $610.60 and $615.40. #BNB_Market_Update #BNBLUNCPOOL #BNB金鏟子 {spot}(BNBUSDT)

BNB/USDT Liquidity Blueprint: Ranges, Sweeps, and High-Probability Entries

$BNB The current live price of BNB/USDT is trading tightly between $658.31 and $662.47, compressing inside a very specific neutral range. If we look strictly at the high-timeframe order flow matrix, the token has strong structural resistance sitting at $689.80, where big institutional sellers aggressively swiped retail buy-stops earlier this month. On the local intraday chart, the immediate hurdle for a bullish continuation is the $673.10 level, which represents today's current range high. Right below current market prices, the nearest support block rests at $648.00, which protects a massive pool of internal sell-side liquidity. The ultimate institutional demand core, where major whale limit orders are clustered, is tucked much deeper down between $610.60 and $615.40.
#BNB_Market_Update #BNBLUNCPOOL #BNB金鏟子
·
--
ブリッシュ
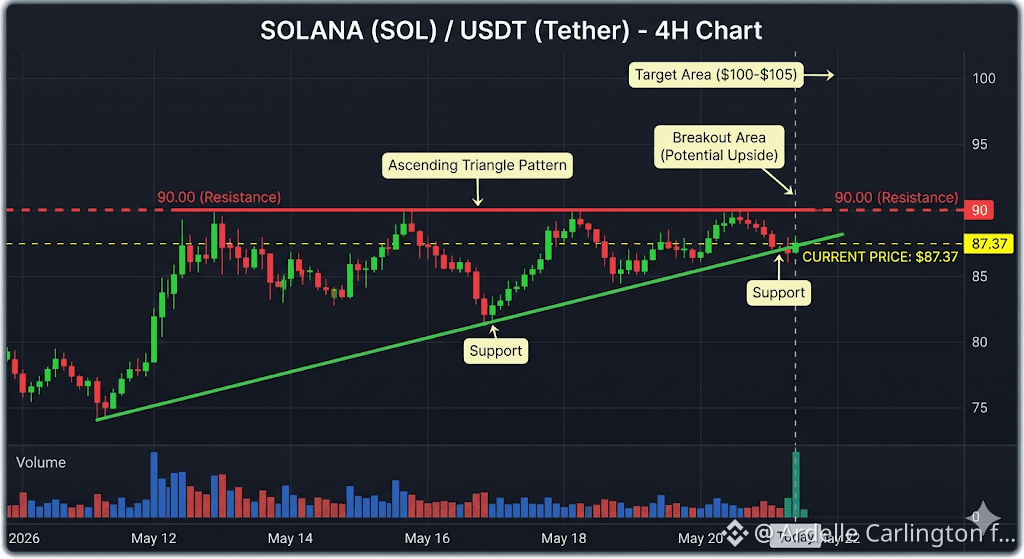
$SOL は現在約$87.37 USDで取引されており、24時間で約0.56パーセントの小幅な上昇を示しています。 日々のマーケットアクションでは、高値が$87.75 USD、安値が$85.37 USDです。 取引量は活発で、過去24時間で約36.4億USDがグローバルな取引所を通過しています。 この資産の全体的な市場キャップは約504.6億USDで安定しています。 #SkyBridgeCryptoFundLosses #NearDynamicReshardingSurge #HKDAPEthereumMainnetLive {spot}(SOLUSDT)
$SOL は現在約$87.37 USDで取引されており、24時間で約0.56パーセントの小幅な上昇を示しています。
日々のマーケットアクションでは、高値が$87.75 USD、安値が$85.37 USDです。
取引量は活発で、過去24時間で約36.4億USDがグローバルな取引所を通過しています。
この資産の全体的な市場キャップは約504.6億USDで安定しています。
#SkyBridgeCryptoFundLosses #NearDynamicReshardingSurge #HKDAPEthereumMainnetLive
記事
翻訳参照
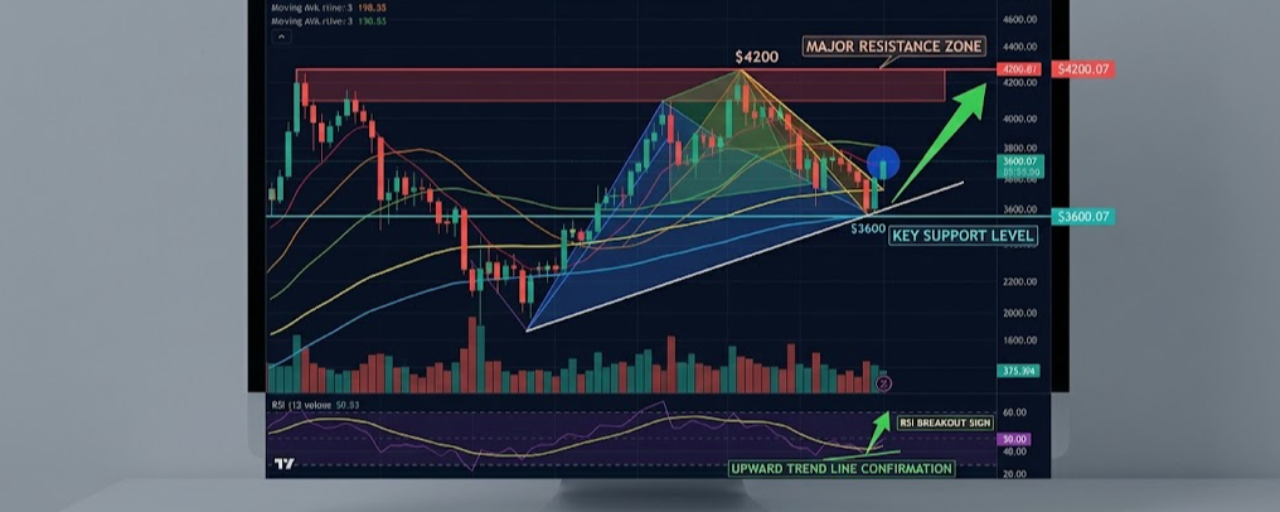
ETH Analysis: Is Ethereum Preparing for a Massive Bounce from $3,600?$ETH is currently displaying mixed signals on the weekly timeframe, characterized by consolidation after recent volatile swings. This latest price action has created a tightly wound structure that is now at a decision point. After finding significant demand near the $3600 level, ETH staged a recovery, but this rally has stalled as it approaches the previous resistance cluster around $4200, which has acted as a formidable ceiling. Key Technical Insights: Compression Zone: As visualized in the chart, the weekly price bars are forming a compression pattern. Following the recent sharp upthrust and subsequent pullback, the trading range has narrowed significantly. The white upward trendline from the local low is a critical guide to this current ascending structure, confirming that the bulls are still actively defending higher lows.The Deciding Retest: Price is now retesting the newly established support at $3600. This level is a crucial pivot; a successful defense here would consolidate a strong support base, setting the stage for a re-challenge of the upper boundary.Key Levels to Watch:Major Support: $3600. This is the primary defensive line for bulls. A weekly close below this level could lead to deeper correction towards $3200 or even $3000.Immediate Resistance: $4200. This is the immediate ceiling. If bulls can push past this cluster, they will trigger a breakout from the compression, opening up a path towards the next liquidity target near $4800.Trend Confirmation: The green arrow on the chart projects the path of the current bias, pointing towards an attempt to move back to the resistance zone. However, the compression structure means a move in either direction could be impending.RSI and Momentum: While not explicitly charted in detail, momentum indicators have cooled from previously overbought levels and are now in neutral-to-bullish territory, reflecting the consolidation phase rather than a clear directional change. A break below $3600 would likely coincide with a decisive breakdown in momentum. The Outlook: Ethereum is in a critical consolidation, poised for a momentum-driven move. As long as price holds the $3600 support floor on a weekly basis, the primary trend remains cautiously bullish. This indicates the market is building pressure to break through the $4200 resistance cluster. Traders should look for a confirmed breakout or breakdown from this compression to gauge the next major trend. #SECDelaysEventContractETFs #SECClarifiesTokenizedStockStance #PolymarketSeeksJapanApproval #ARMAStrategicBitcoinReserve {spot}(ETHUSDT)

ETH Analysis: Is Ethereum Preparing for a Massive Bounce from $3,600?

$ETH
is currently displaying mixed signals on the weekly timeframe, characterized by consolidation after recent volatile swings. This latest price action has created a tightly wound structure that is now at a decision point.
After finding significant demand near the $3600 level, ETH staged a recovery, but this rally has stalled as it approaches the previous resistance cluster around $4200, which has acted as a formidable ceiling.
Key Technical Insights:
Compression Zone: As visualized in the chart, the weekly price bars are forming a compression pattern. Following the recent sharp upthrust and subsequent pullback, the trading range has narrowed significantly. The white upward trendline from the local low is a critical guide to this current ascending structure, confirming that the bulls are still actively defending higher lows.The Deciding Retest: Price is now retesting the newly established support at $3600. This level is a crucial pivot; a successful defense here would consolidate a strong support base, setting the stage for a re-challenge of the upper boundary.Key Levels to Watch:Major Support: $3600. This is the primary defensive line for bulls. A weekly close below this level could lead to deeper correction towards $3200 or even $3000.Immediate Resistance: $4200. This is the immediate ceiling. If bulls can push past this cluster, they will trigger a breakout from the compression, opening up a path towards the next liquidity target near $4800.Trend Confirmation: The green arrow on the chart projects the path of the current bias, pointing towards an attempt to move back to the resistance zone. However, the compression structure means a move in either direction could be impending.RSI and Momentum: While not explicitly charted in detail, momentum indicators have cooled from previously overbought levels and are now in neutral-to-bullish territory, reflecting the consolidation phase rather than a clear directional change. A break below $3600 would likely coincide with a decisive breakdown in momentum.
The Outlook: Ethereum is in a critical consolidation, poised for a momentum-driven move. As long as price holds the $3600 support floor on a weekly basis, the primary trend remains cautiously bullish. This indicates the market is building pressure to break through the $4200 resistance cluster. Traders should look for a confirmed breakout or breakdown from this compression to gauge the next major trend.
#SECDelaysEventContractETFs #SECClarifiesTokenizedStockStance #PolymarketSeeksJapanApproval #ARMAStrategicBitcoinReserve
$BTC は、現在、週足の時間枠で面白いショーを展開しており、重要な構造レベルをテストしながら、以前の高ボリュームエリアに戻っています。 年初の急激な修正の後、$60,000–$66,000の範囲でマクロ的な底を見つけ、市場はうまく蓄積フェーズをエンジニアリングし、重要な心理的ゾーンを取り戻すために上昇しました。 重要な構造的なポイント: ブレイクアウトとリテストゾーン: チャートの下部の蓄積ボックスによって強い需要が$66,000以上で確立されたことが示されています。4月下旬と5月上旬の攻撃的な週のキャンドルが価格を押し上げ、古い抵抗を$73,784で越えました。 現在の価格アクション: BTCは$76,800エリアをうろうろしています。小さな赤い週の印刷が見られ、これはブレイクアウトレベルの自然なリテストを示しています。機関のオーダーフローの観点では、これは新しく形成されたサポートブロックを検証するためのプルバックであり、次の動きを決定する前のものです。 注目すべきレベル: 即時サポート: $73,784。これを週のクローズ基準で保持することで、即時の強気構造が完全に維持されます。 主要な抵抗: $80,977。これは次の重要な流動性プールと構造的な天井です。ここでクリーンにブレイクすれば、$90,044周辺にある主要供給ゾーンへの道が開かれます。 展望: 価格アクションが$73Kのフリップゾーンの上で安定した統合を調整する限り、抵抗が最も少ない道は$80,000の供給ターゲットに向かっています。しかし、即時のシェルフを保持できない場合、価格は$70,000の構造に戻される可能性があります。 #RussiaBansNonCustodialCryptoWallets #TrumpMediaBTCFaces455MLoss #IndiaToBlockPolymarketKalshi {spot}(BTCUSDT)
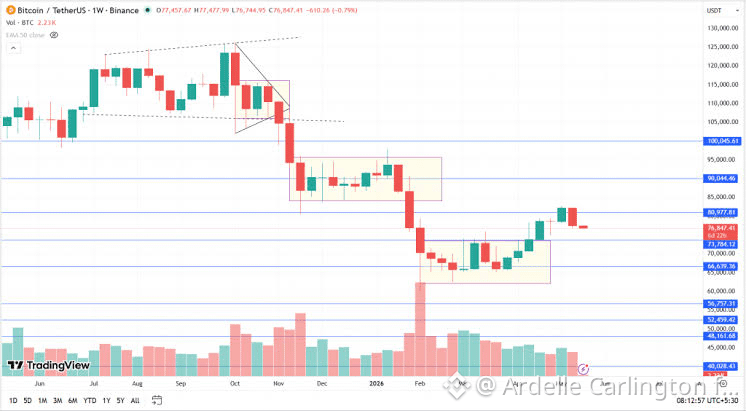
$BTC は、現在、週足の時間枠で面白いショーを展開しており、重要な構造レベルをテストしながら、以前の高ボリュームエリアに戻っています。
年初の急激な修正の後、$60,000–$66,000の範囲でマクロ的な底を見つけ、市場はうまく蓄積フェーズをエンジニアリングし、重要な心理的ゾーンを取り戻すために上昇しました。

重要な構造的なポイント:
ブレイクアウトとリテストゾーン: チャートの下部の蓄積ボックスによって強い需要が$66,000以上で確立されたことが示されています。4月下旬と5月上旬の攻撃的な週のキャンドルが価格を押し上げ、古い抵抗を$73,784で越えました。
現在の価格アクション: BTCは$76,800エリアをうろうろしています。小さな赤い週の印刷が見られ、これはブレイクアウトレベルの自然なリテストを示しています。機関のオーダーフローの観点では、これは新しく形成されたサポートブロックを検証するためのプルバックであり、次の動きを決定する前のものです。
注目すべきレベル:
即時サポート: $73,784。これを週のクローズ基準で保持することで、即時の強気構造が完全に維持されます。
主要な抵抗: $80,977。これは次の重要な流動性プールと構造的な天井です。ここでクリーンにブレイクすれば、$90,044周辺にある主要供給ゾーンへの道が開かれます。
展望: 価格アクションが$73Kのフリップゾーンの上で安定した統合を調整する限り、抵抗が最も少ない道は$80,000の供給ターゲットに向かっています。しかし、即時のシェルフを保持できない場合、価格は$70,000の構造に戻される可能性があります。
#RussiaBansNonCustodialCryptoWallets #TrumpMediaBTCFaces455MLoss #IndiaToBlockPolymarketKalshi
見逃せない次のビッグAIクリプトナラティブ!🚀AIが急速にスケールする中、著作権の問題とデータプライバシーは依然として大きな挑戦です。@OpenLedgerは、Story Protocolとの戦略的パートナーシップを通じて、IP資産のトラッキングのための法的に準拠したインフラを構築することで、これに直接対処しています。これにより、クリエイターはデータが未来のAIモデルをトレーニングする際に、オンチェーンで報酬を得られます。真の社会的ユーティリティの危機を解決することで、このプロジェクトは単なる投機を超えています。そのエコシステムの拡大を見守ることは、分散型技術愛好者にとって素晴らしいチャンスです。 #OpenLedger $OPEN

見逃せない次のビッグAIクリプトナラティブ!🚀

AIが急速にスケールする中、著作権の問題とデータプライバシーは依然として大きな挑戦です。@OpenLedgerは、Story Protocolとの戦略的パートナーシップを通じて、IP資産のトラッキングのための法的に準拠したインフラを構築することで、これに直接対処しています。これにより、クリエイターはデータが未来のAIモデルをトレーニングする際に、オンチェーンで報酬を得られます。真の社会的ユーティリティの危機を解決することで、このプロジェクトは単なる投機を超えています。そのエコシステムの拡大を見守ることは、分散型技術愛好者にとって素晴らしいチャンスです。 #OpenLedger $OPEN
·
--
ブリッシュ
#RussiaBansNonCustodialCryptoWallets フォローして、投稿して、トレードして、グローバルリーダーボードから25,000トークンのリワードを獲得しよう。リーダーボードとリワードの資格を得るには、イベント中に各タスクタイプ(投稿:1つ選択)を少なくとも一度完了する必要がある。赤いパケットやギブアウェイに関与する参加者は、リワードの対象外と見なされる。疑わしいビュー、インタラクション、または自動ボットの使用が疑われる参加者は、活動から失格とされる。高エンゲージメントの以前の投稿を改変してプロジェクト提出として再利用することは、失格の原因となる。プロジェクトリーダーボードはT+2の遅延でデータを表示する。例えば、2026-06-02のデータは、2026-06-04 9:00(UTC)の後にリーダーボードページに表示される。バウチャーリワードは2026-06-23の前に配布される。詳細については、キャンペーン発表を参照してください。#openledger $OPEN

はい
はい
引用されたコンテンツは削除されました
77
77
星期天-77
·
--
暗号通貨のスローガン:ALL IN!🚀
現実の状況:残高不足。💔

🧧🧧🧧🧧🧧🧧🧧🧧

#山寨季何时到来?

$BTC
{spot}(BTCUSDT)
$ETH
{spot}(ETHUSDT)
1
1
引用されたコンテンツは削除されました
ツリーハウス
ツリーハウス
Gourav-S
·
--
🌳 トリーハウス – DeFiの固定収入レイヤーの構築

DeFiは高い利回りを提供しましたが、真のベンチマークレートはありませんでした。トリーハウスは、オンチェーンの利回りに明確性、安定性、透明性をもたらすことで、それを変えようとしています。

🔑 トリーハウスの仕組み

⚡ tAssets(tETHのような) → DeFiの中で完全に合成可能でありながら、最良のリターンを自動的に追求する利回りを生む資産。
⚡ DOR(分散型提供レート) → TradFiのLIBORに似た透明性のあるベンチマークレートですが、暗号通貨向けに設計されています。

これらは一緒になって、DeFiの固定収入市場の基盤を構築します。

📈 主要なハイライト

わずか数ヶ月で$500M以上のTVL。

すでに60K以上のユーザーがtAssetsを保有しています。

主要なパートナーに支えられ、Ethereum、Arbitrum、Mantleなどで拡大中。

ネイティブトークン$TREE はガバナンス、DOR、およびステーキングインセンティブを強化します。

🚀 次は何ですか?

🌐 SOL、AVAX、BNBの新しいtAssets。
📊 フォワードレート契約(FRA)および構造化利回り商品。
🤝 CEX、BNBチェーン、機関投資家とのより深い統合。
🪴 DORがより多くのパネリストとオンチェーンガバナンスで完全に分散化される。

💡 なぜ重要なのか

トリーハウスは「ただの別の利回りボールト」ではありません。DeFiの固定収入のバックボーンを構築しています — TradFiで数兆ドルの価値がある市場です。ベンチマーク、透明性、実際の流動性を持って、DeFiを機関規模に向けて準備しています。

🔥 要するに:
tAssets + DOR = DeFiにおける安定した利回りの未来

#Treehouse #TreehouseFi #DEFİ #sol #Binance

$TREE
{spot}(TREEUSDT)
$SOL
{spot}(SOLUSDT)
1500
1500
Grace-blue bird
·
--
#美联储取消创新活动监管计划

#暗号市場の調整 トークンの赤い封筒が欲しいですか?$BNB $ETH
それなら、すぐにコメント欄で私の質問に答えてください!
豪華な報酬が得られます
さらに多くのトークン報酬がやって来ています
#バイナンスAlpha新登場
赤い箱の中の無料トークン、私をフォローして質問に答えるだけでOK。
メッセージをリポストして、もっとトークンを手に入れましょう、ありがとうございます。❤️

30000
30000
引用されたコンテンツは削除されました
翻訳参照
bigbox
bigbox
引用されたコンテンツは削除されました
翻訳参照
1
1
老K十年复盘
·
--
🧧🧧🎁お年玉を受け取った🧧🧧🎁🌹
翻訳参照
1
1
引用されたコンテンツは削除されました
翻訳参照
❤️
❤️
极道
·
--
$BNB 高位空才是最明智的❤️
翻訳参照
LA
LA
Floor_悟空
·
--
Lagrange 搞出大事:DeepProve-1 让 LLM 推理能自证清白了
谁能想到,以前只能在小模型上折腾的 zkML 技术,现在居然能拿下 LLM 了?
@Lagrange Official 刚推出的 DeepProve-1,直接成了首个能给完整大语言模型推理出加密证明的量产级系统,还成功给 GPT-2 的全量推理生成了零知识证明。
更厉害的是,GPT-2 和 LLAMA 这些热门开源模型在架构上很像,这意味着 DeepProve 离支持 LLAMA 也不远了。
再过几个月,说不定咱们常用的开源大模型都能用上这种可验证功能。
以前 zkML 顶多搞定 MLP、CNN 这类基础模型,现在直接突破到 Transformer 架构,等于把 AI 可信的边界往前推了一大步。
DeepProve-1 这步棋,直接把 「可验证 AI」 从画饼变成了能用的工具,感觉以后大模型不光要比谁更聪明,还得比谁更靠谱。
#lagrange $LA
{spot}(LAUSDT)
翻訳参照
感谢分享
感谢分享
0x蓝颜
·
--
Bubblemaps vs. 伝統的なツール:なぜそれが個人投資家に適しているのか?

暗号市場では、情報の差が最大のリスクです。伝統的なツール(Etherscanなど)は強力ですが、敷居が高いです。一方、Bubblemapsは直感的なビジュアライゼーションを提供し、個人投資家がリスクの高いトークンを迅速に特定できるようにします。

1. 伝統的なツールの限界
- データ過多:Etherscanの取引記録は複雑で、保有状況を迅速に判断するのが難しいです。
- 有料壁:Nansenなどはサブスクリプションが必要で、個人投資家には負担が大きいです。
- 協力の欠如:伝統的なツールは個人の分析に依存しており、Bubblemapsはクラウドソーシング調査をサポートしています。

2. Bubblemapsの三つの利点
✅ ワンクリックでクジラを識別:バブルチャートは保有の集中度を明確に表示します。
✅ コミュニティ主導:ユーザーは疑わしいアドレスを提出でき、$BMT の報酬を得ることができます。
✅ 無料で使いやすい:プログラミング知識は不要で、初心者でもすぐに使えます。

3. 実際のケース:罠を避ける
ある新しいコインは「公平な分配」を主張していますが、Bubblemapsは80%のトークンが5つのウォレットによって制御され、チームと関連していることを示しています。暴露後、価格は90%暴落しました。

結論:Bubblemapsは個人投資家に「機関レベル」の分析力を提供し、公平な競争を実現します。 #Bubblemaps $BMT @Bubblemaps.io
さらにコンテンツを探すには、ログインしてください
Binance Squareで世界の暗号資産トレーダーの仲間入り
⚡️ 暗号資産に関する最新かつ有益な情報が見つかります。
💬 世界最大の暗号資産取引所から信頼されています。
👍 認証を受けたクリエイターから、有益なインサイトを得られます。
メール / 電話番号
サイトマップ
Cookieの設定
プラットフォーム利用規約